90
Reef Water Quality Protection Plan 2013 Prioritisation project report Revised November 2014
Reef Water Quality Protection Plan 2013Prioritisation project report
Reef Water Quality Protection Plan 2013
Prioritisation project report
Revised November 2014

© Commonwealth of Australia 2014.
Ownership of intellectual property rights
Unless otherwise noted, copyright (and any other intellectual property rights, if any) in this publication is owned by the Commonwealth of Australia (referred to as the Commonwealth).
Creative Commons licence
All material in this publication is licensed under a Creative Commons Attribution 3.0 Australia Licence, save for content supplied by third parties, logos and the Commonwealth Coat of Arms.
Creative Commons Attribution 3.0 Australia Licence is a standard form licence agreement that allows you to copy, distribute, transmit and adapt this publication provided you attribute the work. A summary of the licence terms is available from creativecommons.org/licenses/by/3.0/au/deed.en. The full licence terms are available from creativecommons.org/licenses/by/3.0/au/legalcode.
This publication (and any material sourced from it) should be attributed as: Australian Government 2014, Reef Water Quality Protection Plan 2013 – prioritisation project report. CC BY 3.0
Cataloguing data
Australian Government 2014, Reef Water Quality Protection Plan 2013 – prioritisation project report, Canberra.
ISBN 978-1-7600307-3-5 (online)
Internet
Reef Water Quality Protection Plan 2013 – prioritisation project report is available at agriculture.gov.au
Contact
Department of Agriculture
Postal address GPO Box 858 Canberra ACT 2601 Australia Web agriculture.gov.au
Inquiries regarding the licence and any use of this document should be sent to [email protected]
Disclaimer
The authors do not warrant that the information in this document is free from errors or omissions. The authors do not accept any form of liability, be it contractual, tortious, or otherwise, for the contents of this document or for any other consequences arising from its use or any reliance placed upon it. The Australian Government acting through the Department of Agriculture, has exercised due care and skill in the preparation and compilation of the information and data in this publication. Notwithstanding, the Department of, its employees and advisers disclaim all liability, including liability for negligence, for any loss, damage, injury, expense or cost incurred by any person as a result of accessing, using or relying upon any of the information or data in this publication to the maximum extent permitted by law.
Lead authors: Michele Barson, Lucy Randall, Kevin Gale and Rob Lesslie
Contributors: Jon Brodie, Chris Carroll, Colin Creighton, Rob Ellis, Peter Hairsine, Stephen Lewis, Kevin McCosker, Britta Schaffelke, Jane Waterhouse, David Waters, Stuart Whitten
Revised November 2014 Figures 16–25 revised November 2014 to show average annual modelled loads from cropping, not grains. The loads/hectare/year values displayed for individual land uses in Figures 21–25 should not be added.
3Reef Water Quality Protection Plan 2013Prioritisation project report
Foreword
This report focuses on the land-based biophysical systems of the catchments flowing to the Great Barrier Reef lagoon, the impact of transported materials (sediments, nutrients and herbicides) on coral reefs and sea grasses, key ecosystems for the reef and the opportunities to improve agricultural land management practices affecting the quality of the water delivered to the lagoon. The work has been undertaken to support and inform discussion and decisions on funding priorities for investment, particularly through Reef Water Quality Grants (part of the Australian Government Reef Programme).
The analysis aims to sharpen the focus of investment in practice change by identifying the relative contributions of each of the 35 sub-catchments flowing to the reef lagoon to pollutant loads, the relative contribution of the major agricultural industries in each sub-catchment to pollutant loads, the room for improvement in agricultural management practices, and the practices expected to deliver the biggest load reductions. Consideration of the ecological impacts of these pollutants on riverine and estuarine ecosystems, or the contribution these ecosystems make to the reef’s ecological health is beyond the scope of this study.
The results of this study provide relative priorities for sub-catchments for investing in cane (nutrient and herbicide management practices) and grazing (sediment management practices). These priorities should be further refined when better information is available on the economic and social costs and benefits of practice change, including the role such changes can play in improving the long-term resilience and sustainability of industries in a changing climate.

4
Foreword
Reef Water Quality Protection Plan 2013Prioritisation project report
5Reef Water Quality Protection Plan 2013Prioritisation project report
Contents
FOREWORD 3
Acknowledgements 8
List of abbreviations and acronyms 8
Key findings 9
EXECUTIVE SUMMARY 10
Introduction 10
Methods used to rank sub-catchments for investment 11
Investment priorities for sub-catchments 11
Grazing investment priorities 11
Cane investment priorities 12
Future improvements 12
1 INTRODUCTION 13
Terms of reference for study 16
2 METHODS 18
Multi-Criteria Analysis Shell for Spatial Decision Support analysis 18
MCAS–S analysis for the Reef Water Quality Protection Plan 2013 19
Grazing industry analysis 21
Cane industry analysis 22
MCAS–S data inputs 23
Modelled water quality data 23
Modelling load reductions 24
Water quality data used in the MCAS–S analysis 24
The crown of thorns starfish index 25
Calculation of herbicide concentrations 26
Land management practices 26
Multi Criteria Analysis spreadsheets for NRM regions 27
3 INVESTMENT PRIORITIES FOR SUB-CATCHMENTS 29
Agricultural industry contributions to sub-catchment anthropogenic loads 29
Grazing industry contributions to anthropogenic loads 29
6
Contents
Reef Water Quality Protection Plan 2013Prioritisation project report
Sugar cane industry contributions to anthropogenic loads 31
MCAS–S results – grazing industry 33
MCAS–S results – sugar cane industry: nutrients 35
MCAS–S results – sugar cane industry: herbicides 36
Grazing – relative investment priorities for sub-catchments 40
Sugar cane – relative investment priorities for sub-catchments 42
Investment priorities over time 43
Using the MCAS–S investment priorities information 44
Summary of key points 46
4 FUTURE IMPROVEMENTS 47
Improving land management practices for better water quality outcomes 47
Opportunities in the grazing industry 47
Opportunities in the sugar cane industry 48
Better methods for reporting, monitoring and modelling land management practice change 49
Improving Source catchments modelling outputs 51
Refining the spatial scale of the reporting unit for water quality modelling results 51
Improving data on the sources of sediment loss 51
Improving the estimates of sediment delivered to the GBR lagoon 52
Improving ground cover data 52
Research to improve understanding of catchment-based processes affecting GBR water quality 53
Bioavailability of PN 53
Establishing the sources of anthropogenic DIN from grazed land 53
Research needed to support further land management practice change 53
Attributing risk to the reef to sub-catchments 53
Summary of key points 54
5 CONCLUSIONS 55
Using the information on priorities 55
Changes in priorities over time 56
REFERENCES 57
APPENDICES 63
1 Working Group on Reef Rescue 2 Prioritisation project – membership 63
2 Summary of the outcomes of the overall assessment of the relative risk of water quality in the GBR 64
3 Example of MCAS–S composite – estimation of room for improvement in sediment management practices in the grazing industry 65
4 Area and number of agricultural businesses for grazing and sugar cane in the GBR 66
5 ABCD land management practice framework for the grazing industry 68
6 Reef Rescue Sugar Industry – Broad ABCD for Water Quality Land Management Practice Framework 72
7a Room for improvement in sub-catchment sediment management practices in the grazing industry 2010-11 75
7
Contents
Reef Water Quality Protection Plan 2013Prioritisation project report
7b Room for improvement in sub-catchment nutrient and herbicide management practices in the sugar cane industry 2010-11 76
8 List of data sets describing the assets, threats and solvability for the grazing and sugar cane industries’ means to an end, plus scaling and weightings used 77
9 Estimated flows, herbicide loads, ratings, toxic loads and average concentrations for Great Barrier Reef Sub-catchments 78
10 Anthropogenic baseline – average annual modelled loads (1986–2009) exported from GBR sub-catchments by land use 80
11 Anthropogenic baseline – total suspended solids – average annual modelled loads (1986–2009) exported by sub-catchments (tonnes per hectare per year) by land use 85
TABLES
1 Gross value of agricultural production for major agricultural industries in the Great Barrier Reef natural resource management regions 13
2 The crown of thorns starfish (COTS) index for Great Barrier Reef sub-catchments 25
3 Normalised PSII inhibitor values used to calculate PSII herbicide equivalent loads 26
4 Sensitivity of sub-catchment priorities for investing in improved nutrient management in sugar cane to the crown of thorns starfish influence index 36
5 Investment rankings for NRM region sub-catchments for sugar cane and grazing 41
FIGURES
1a Land use in the northern sub-catchments of the Great Barrier Reef 14
1b Land use in the southern sub-catchments of the Great Barrier Reef 15
2 Reef Water Quality Protection Plan 2013 – generalised means-to-an-end 19
3 Grazing means-to-an-end diagram 22
4 Sugar cane means-to-an-end diagram 23
5 Percentage contributions from hillslope and gully erosion by land uses to GBR predicted annual anthropogenic TSS, PP and PN loads 30
6 Percentage contributions by land uses to GBR predicted annual anthropogenic DIN and PSII herbicide loads 30
7 Total suspended solids loads by land use (kilotonnes/year) generated from the management units within the Burdekin and Fitzroy sub-catchments 32
8 Total suspended solids loads by land use (tonnes/hectare/year) generated from the management units within the Burdekin and Fitzroy sub-catchments 32
9 Grazing MCAS–S results overview 33
10 Sub-catchment investment prioritisation for grazing – MCAS–S results 34
11 Sub-catchment investment prioritisation in improving nutrient and herbicide management for sugar cane – MCAS–S results adjusted to reflect locations where sugar cane is grown 37
12 Combined nutrient and herbicide sub-catchment investment prioritisation for sugar cane – MCAS–S results adjusted to reflect locations where sugar cane is grown 39
13 Percentage of Australian Government Reef Programme funds allocated to NRM regions 2008–09 to 2015–16 43
14 Scenario analyses for allocation of funds at NRM region level on the basis of MCAS–S investment rankings in Table 5 44
15 Comparison of the scenario analyses with the average funds received by regions from the Australian Government Reef Programme 2013–14 to 2015–16 45

8 Reef Water Quality Protection Plan 2013Prioritisation project report
Acknowledgements
The authors would like to acknowledge the assistance provided by the Paddock to Reef Integrated Monitoring Modelling and Reporting Program staff, who generated most of the data used in this study; helpful discussions with Scott Wilkinson and Rebecca Bartley (CSIRO) and Peter O’Reagain (Queensland Department of Agriculture, Fisheries and Forestry); Mike Grundy (CSIRO) for workshop facilitation; and Jodie Mewett (ABARES) for assistance with Australian Bureau of Statistics data. Rob Ellis, Melanie Shaw, Peter Hairsine and Barry Hart are thanked for comments which improved the accuracy and readability of the report. Thanks to the staff of the Brisbane office of the Department of Agriculture and the Queensland Department of Agriculture, Fisheries and Forestry Research Station in Townsville, who hosted our workshops. This study was funded by the Department of Agriculture and the Department of the Environment.
List of abbreviations and acronymsABARES Australian Bureau of Agricultural and Resource Economics and Sciences (within the Australian
Government Department of Agriculture)COTS crown of thorns starfish
CSIRO Commonwealth Scientific and Industrial Research Organisation
DIN dissolved inorganic nitrogen
GBR Great Barrier Reef
MCA Multiple Criteria Analysis
MCAS–S Multi-Criteria Analysis Shell for Spatial Decision Support
NRM natural resource management
PN particulate nitrogen
PP particulate phosphorus
PSII Photosystem II inhibiting (herbicide)
QDAFF Queensland Department of Agriculture, Fisheries and Forestry
TSS total suspended solids

9Reef Water Quality Protection Plan 2013Prioritisation project report
Key findings • Land used for agriculture occupies about 82 per cent of the GBR catchment. Land used for cropping, dairy,
grazing, horticulture (including bananas) and sugar cane contributes an estimated 56, 69 and 66 per cent respectively to the estimated anthropogenic loads of TSS, PN and PP, plus an estimated 87 per cent of the anthropogenic DIN and 100 per cent of the PSII delivered to the GBR lagoon.
• Grazing (75 per cent of the area of the GBR catchment) contributes an estimated 45, 43 and 45 per cent respectively (Figure 5, p. 30) to the estimated anthropogenic loads of TSS, PP and PN and an estimated 21 per cent of the DIN load (Figure 6, p.30). The Burdekin and Fitzroy sub-catchments are rated as very high and high priority for investment in improving grazing management (Table 5, p. 41).
• Stream bank erosion, (which cannot be attributed to particular land uses but occurs largely on land used for grazing) contributes an estimated 39, 28 and 21 per cent respectively to the anthropogenic loads of TSS, PP and PN (Figure 5, p. 30).
• Land used for sugar cane (1.3 per cent of the GBR catchment) contributes an estimated 56 and 94 per cent respectively (Figure 6, p. 36) to anthropogenic loads of DIN and PSII delivered to the GBR lagoon. The MCAS–S process has identified the Johnstone sub-catchment as very high priority and the Burdekin (mainly East Burdekin), Haughton, Herbert, Mulgrave-Russell and Tully sub-catchments as high priority for investment in nutrient practices to reduce DIN loads. The Herbert, Pioneer and Plane sub-catchments are rated as very high priority for investing in improving herbicide management practices; the Haughton is rated as high and the Johnstone and O’Connell as moderate priority for investment in herbicide management (Table 5, p. 41).
• The impact on funding over time of changes in priorities is discussed (p. 43).
• Opportunities for improving practices for better water quality outcomes are identified (p. 47). In the grazing industry these include supporting adoption of better herd management practices to deliver ground cover improvements whilst improving profitability, and targeting investment to reduce subsoil loss through gullying and stream bank erosion. In the sugar cane industry there are significant opportunities to reduce DIN loads, particularly by moving from district yield to block or zone potential yields to calculate nitrogen fertiliser applications.
• Recommendations are made on improvements in reporting, monitoring and modelling land management practices to track investment outcomes (p. 49). Areas are identified for updating Source catchment modelling (p. 51) to reflect new understanding of sediment storage processes and to provide spatially detailed water quality outputs, especially for the Burdekin and Fitzroy sub-catchments.
• The research needed to further improve investment targeting is identified (p. 53).

10 Reef Water Quality Protection Plan 2013Prioritisation project report
Executive summary
Introduction This report contains information that will support and inform discussion of funding priorities for future investment in the Great Barrier Reef (GBR) catchment, particularly for delivering on the Reef Water Quality Protection Plan 2013. The report focuses on the two main industries: the sugar cane industry, which makes the largest contributions to anthropogenic dissolved inorganic nitrogen (DIN) and herbicides; and grazing, which makes the largest contribution to total suspended solids (TSS) loads.
The Multi-Criteria Analysis Shell for Spatial Decision Support (MCAS–S) tool was used to support an assessment of the investment priority for each industry in the 35 sub-catchments making up the GBR catchment through data analysis and expert judgement. It combines information on (a) the risk to the GBR marine assets (corals, sea grasses) from land-based contaminants (TSS, particulate nitrogen (PN), particulate phosphorus (PP), DIN and five high-priority Photosystem II herbicides (PSII)) and (b) the potential for improvement in land management practices that would reduce contaminant loads entering the GBR (solvability).
Anthropogenic loads data are presented for the banana, dairy, grains or horticulture industries. However, no information was available on the extent of change in management practices resulting from investment for these industries, so they were not included in the MCAS–S analyses.
Declines in the coastal ecosystems of the GBR have been linked with increases in the land-based runoff of suspended sediments and nutrients and the addition of herbicides since European settlement. The 2013 Scientific Consensus Statement (State of Queensland 2013a) noted that there is strong evidence that improving catchment water quality will improve the resilience of the reef and associated ecosystems, buying some time by partially offsetting the increasing damage and stress from climate factors.
The Australian and Queensland governments established the Reef Water Quality Protection Plan in 2003 to halt and reverse the decline in the quality of the water entering the GBR lagoon. In the last five years, $158 million has been spent on improving agricultural management practices in reef catchments through grants to land managers and industry. Land managers have also invested an estimated $1.60 for each dollar provided by the Australian Government for Reef Rescue. In the first two years of the subsequent Reef Plan (2009) delivery, an estimated 34 per cent of sugar cane farmers, 25 per cent of horticulture farmers and 17 per cent of graziers adopted improved practices. Water quality modelling results from the Reef Plan Second Report Card (State of Queensland 2010) indicate that these changes could translate into a six to 15 per cent reduction in key pollutants (State of Queensland 2013b).
The Reef Plan Third Report Card (State of Queensland 2013c) noted that these programs are starting to halt and reverse the decline in reef water quality, reporting estimated reductions in the average annual anthropogenic loads of TSS, TN and PSII herbicides entering the reef. Subsequent scenario analyses undertaken to assess the feasibility of meeting the Reef Plan 2009 water quality targets suggest that the 50 per cent target for DIN may not be achieved by the adoption of the current A (aspirational or cutting edge) class nutrient management practices.
While there is considerable funding for the protection of the Great Barrier Reef, it is modest relative to the size of the water quality problem, and careful targeting of expenditure is needed to achieve desired outcomes.
11
Executive summary
Reef Water Quality Protection Plan 2013Prioritisation project report
In developing the Reef Water Quality Protection Plan 2013 (State of Queensland 2013b), it was agreed that actions under the plan would include prioritising investment and knowledge. These included ‘prioritise and align investments based on risk assessments of key pollutants, source areas and the risk they pose to Great Barrier Reef ecosystems, as well as information on priority areas for rehabilitation’.
A working group comprising Australian and Queensland government, CSIRO and university scientists was established to advise on investment priorities for each of the 35 major sub-catchments in the GBR catchment. Working group members collaborated to produce this report. This report complements the relative risk assessment for the marine environment of the GBR prepared by Brodie et al. (2013b).
Methods used to rank sub-catchments for investmentThe Multi-Criteria Analysis Shell for Spatial Decision Support (MCAS–S) was chosen to draw together lines of evidence from water quality monitoring and modelling, research and practice change monitoring, and expert opinion from Reef stakeholders. A Multi-Criteria Analysis spreadsheet containing the data used in the MCAS–S was provided to each GBR regional body in late 2013 to help their planning processes for the use of 2013–14 funding from the Australian Government Reef Programme.
The Paddock to Reef Integrated Monitoring, Modelling and Reporting program (Paddock to Reef program), established to estimate and report on progress towards Reef Plan goals and targets for land and catchment management and water quality, produces data on the likely long-term loads and load reductions predicted as a result of management practice change. These data have been used in this study to inform future investment priorities at the regional level through the Water Quality Grants Program and for delivery of the Reef Trust.
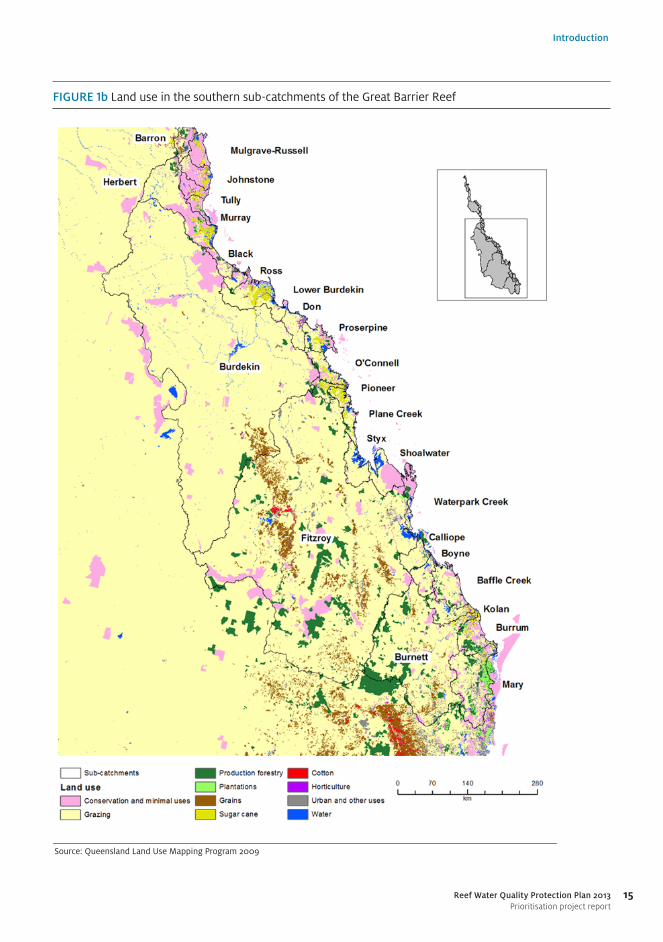
The MCAS–S tool enabled the ranking of scores for nine factors for the grazing industry and 10 factors for the sugar cane industry to identify priorities for funding for each of the GBR’s 35 sub-catchments (see Figures 1a and 1b on pages 14 and 15 for locations). For example, for the grazing industry, modelled annual average total loads (pre-development plus anthropogenic loads) of TSS, PN, PP and DIN were used to estimate the risk to the GBR’s corals and sea grasses posed by the quality of the water draining from each sub-catchment into the GBR lagoon.
The room for improvement (area of grazing land under C or D class management practices which has potential to move up to A or B class practices) was combined with the annual average anthropogenic loads of TSS, PN and PP to estimate solvability (the combination of factors that contribute to a possible solution – here defined as the magnitude of the anthropogenic load and the area over which management practices could be improved). Scores for risk and solvability were then combined for each sub-catchment to establish a priority for grazing investment.
Investment priorities for sub-catchments
Grazing investment prioritiesFor the grazing industry, modelled annual average total loads (pre-development plus anthropogenic loads) of TSS, PP and PN were combined to estimate the risk to the reef’s corals and seagrasses from sub-catchments with grazing. The room for improvement, (area of grazing land under C and D class sediment management practices) was combined with the annual average anthropogenic loads of TSS, PP and PN to estimate solvability. Scores for risk and solvability were then combined for each sub-catchment to establish relative priorities for investment in sediment management in grazing (Table 5, p. 41 summarises the results).
Grazing investment priorities for sediment management were identified for the Burdekin (very high) and the Fitzroy (high) sub-catchments (see figures 1a and 1b for locations) relative to all other sub-catchments, which were assessed as low to very low priority (Table 5, p. 41). Information is available from recent research (but could not be incorporated in the MCAS–S analysis) on the areas, erosion processes (especially sub-surface soils lost via gully erosion) and soil types within the Burdekin and Fitzroy sub-catchments likely to be major contributors of fine sediment to the GBR lagoon. This should be used at regional level to identify which practices and locations where investment should be made in improving grazing management.
12
Executive summary
Reef Water Quality Protection Plan 2013Prioritisation project report
Cane investment prioritiesFor the sugar cane industry, modelled annual average total loads (pre-development plus anthropogenic loads) of DIN, plus a crown of thorns starfish (COTS) influence index and a herbicide concentration index, were combined to estimate the risk to the reef’s corals and seagrasses from sub-catchments growing sugar cane. The room for improvement, (area of cane land under B, C and D class nutrient management practices and the area under C and D class herbicide management practices), was combined with the annual average anthropogenic loads of DIN and PSII herbicides to estimate solvability. Scores for risk and solvability were then combined for each sub-catchment to establish relative priorities for investment in improving nutrient and herbicide management in cane (Table 5, p. 41 summarises the results).
For the sugar cane industry, nutrient reduction investment priorities for sub-catchments were identified as very high for the Johnstone and high for the Mulgrave-Russell, Tully and Herbert in the Wet Tropics region and the Haughton in the Burdekin region. The Daintree in the Wet Tropics was ranked as moderate priority for nutrient reduction investment. The Barron (Wet Tropics); O’Connell, Pioneer and Plane (Mackay Whitsunday region), Mary (Burnett Mary region) and Burdekin were ranked as low priority. Sub-catchments ranked as very low priority for nutrient reduction investment include the Mossman and Murray (Wet Tropics); Black and Don, (Burdekin region); Proserpine (Mackay Whitsunday region); Fitzroy; and the Baffle, Kolan, Burnett and Burrum (Burnett Mary region).
Priority areas for investment in improved herbicide application practices for the sugar industry were influenced by the herbicide concentration index. Sub-catchments in the south of the GBR tended to have lower flows and higher herbicide concentrations. Priorities for herbicide investment were very high for the Herbert (Wet Tropics) and the Pioneer and Plane (Mackay Whitsunday), high for the Haughton and moderate for the Johnstone and O’Connell. Sub-catchments ranked as low priority for investment for herbicide management were the Mulgrave-Russell, Tully, Murray and Proserpine. Priorities for herbicide investment in the Daintree, Mosman and Barron, Black, Burdekin, Don, Fitzroy, Baffle, Kolan, Burnett, Burrum and Mary were ranked as very low.
Future improvements Other opportunities for improving returns on investment through programs aiming to improve the quality of runoff from agricultural land are outlined. They include improving land management practices in the grazing and cane industries; better methods for monitoring, modelling and reporting land management practice change; improvements to spatial data sets required as input to the Source catchments modelling; and research to improve understanding of catchment processes affecting GBR water quality.

13Reef Water Quality Protection Plan 2013Prioritisation project report
Chapter 1
Introduction
Declines in the coastal ecosystems of the GBR have been linked with increases in the land-based runoff of suspended sediments and nutrients and the addition of herbicides which have occurred since European settlement (De’Ath and Fabricius 2010, Brodie et al. 2012, Schaffelke et al. 2013). Recent estimates of the increases in mean annual loads delivered by rivers draining the Great Barrier Reef range from 5.5 times for total suspended solids and 5.7 times for total nitrogen to 8.9 times for total phosphorus (Kroon et al. 2012).
The recent Scientific Consensus Statement (Brodie et al. 2013a) noted that there is strong evidence that improving catchment water quality will improve the resilience of the reef and associated ecosystems. Reducing the land-based losses of nutrients, sediments and herbicides may buy the reef some time by partially offsetting the increasing damage and stress from climate factors, including temperature increases and ocean acidification. It suggested that the most significant effect could come from removing the water quality effects that are thought to trigger more frequent COTS outbreaks (State of Queensland 2013a).
The catchments of the GBR comprise an area of almost 42.16 million hectares; about 82 per cent of this land is used for agricultural production (Figures 1a and 1b). In 2010–11 the gross value of agricultural production, principally from the broadacre cropping, dairy, horticulture, grazing and sugar cane industries, totalled $4.25 billion (Table 1). As noted in the Scientific Consensus Statement (State of Queensland 2013a), research has identified that the majority of sediment and nutrient loads delivered to the GBR lagoon are derived from diffuse agricultural sources (e.g. Kroon et al. 2012 and 2013), with point sources such as sewage treatment plants and urban lands making relatively small contributions (see e.g. Drewry 2008, Kroon 2008, Lewis et al. 2008, Waters and Carroll 2013).
TABLE 1 Gross value of agricultural production for major agricultural industries in the Great Barrier Reef natural resource management regions
NRM Region
Total gross value of
agricultural production
($m)
Meat cattle ($m)
Dairy ($m)
Broadacre cropping
(excluding sugar cane)
($m)
Sugar cane ($m)
Horticulture excluding
bananas ($m)
Bananas ($m)
Cape York 51.9 48.2 – 1 – 2.4 –
Wet Tropics 802.8 55.9 35.2 15.8 296.4 103.7 276
Burdekin 983.8 396 2.2 46.9 237.6 290.1 –
Mackay Whitsunday 306.1 41.6 – 3.1 232.7 27.1 0.1
Fitzroy 1 003.5 671.9 5.4 254.4 5.3 51.6 –
Burnett Mary 1 102.5 265 66.8 37.7 116.8 547.3 0.8
Total 4 250.6 1 478.6 109.6 358.9 888.8 1 022.2 276.9
Source: Australian Bureau of Statistics agricultural census 2010–11

14
Introduction
Reef Water Quality Protection Plan 2013Prioritisation project report
FIGURE 1a Land use in the northern sub-catchments of the Great Barrier Reef
Source: Queensland Land Use Mapping Program 2009
15
Introduction
Reef Water Quality Protection Plan 2013Prioritisation project report
FIGURE 1b Land use in the southern sub-catchments of the Great Barrier Reef
Source: Queensland Land Use Mapping Program 2009

16
Introduction
Reef Water Quality Protection Plan 2013Prioritisation project report
In response to concerns about the health of the reef, the Australian and Queensland governments established the Reef Plan in 2003 to halt and reverse the decline in the quality of the water entering the GBR lagoon. The Reef Plan was updated in 2009, and again in 2013 (State of Queensland 2013b). Reef Rescue (2008–09 to 2013–14) and the Reef Programme (2014–15 to 2017–18) are the Australian Government’s contributions to this plan.
In the five years of Reef Rescue, $158 million was spent on improving the management practices of farmers and pastoralists in the Reef catchments through grants to land managers and support for industry engagement, extension and communication activities under the Water Quality Grants and Partnerships Program. This investment has been complemented by land manager investment in cash and in kind (more than an estimated $1.60 for each Reef Rescue dollar invested) (Australian Government 2014). Progress towards Reef Plan targets has been monitored through the Paddock to Reef program (Carroll et al. 2012) and published in a series of report cards (State of Queensland 2012, 2013c). Water quality modelling is indicating that these changes could translate into a six to 15 per cent reduction in key pollutants (State of Queensland 2013b).
Investments in research made over the last five years, plus modelling and monitoring results from the Paddock to Reef program have improved our understanding of the GBR marine ecosystems and their associated catchments. A working group (membership at Appendix 1) was established to provide advice on the relative investment priority for each of the 35 major sub-catchments, based on the potential for further improvement in on-farm management. Priorities were determined for major industries and for sediment, nutrient and herbicide management. This work provides the basis for this report.
Terms of reference for studyThe working group’s terms of reference were: • Analyse and report on the extent of practice change at river basin level by the broadacre cropping, cane,
dairy, grazing and horticulture industries, and estimate the cost per hectare of these changes. This will use the relevant ‘ABCD’ management practice frameworks for sediment, nutrient and herbicide management.
• Review the modelled water quality changes (nutrient, sediment and herbicide reductions) expected as a result of practice changes, and estimate the likely costs of these improvements to establish costs and benefits of water quality improvements for each river basin.
• If resources permit, undertake scenario analyses using water quality modelling to identify the types and locations of future investments predicted to provide the greatest water quality improvements.
• Synthesise the results of these analyses to inform relative priorities for further investments.• Consult with stakeholders and the broader reef water quality science community to ensure their input into
the analyses and communicate the outcomes of the process to them.
The Reef Plan Third Report Card (State of Queensland 2013c) noted that the programs delivered under Reef Plan are starting to halt and reverse the decline in reef water quality. While there is considerable funding available for the protection of the Great Barrier Reef, this is modest relative to the size of the water quality problem, and expenditure needs to be carefully targeted to achieve the desired outcomes.
Previous studies have suggested that there is substantial geographic variability in the loads delivered to the GBR lagoon, indicating the potential for opportunities to target investment. For example, Kroon et al. (2012) and Greiner et al. (2005) have shown that the increases in pollutant loads vary across the 35 sub-catchments draining into the GBR lagoon as a result of differences in extent and type of agricultural land use and practices, the extent of deforestation, mining, retention by reservoirs, surface runoff (reflecting differences in climate, topography and soils) and urbanisation. The assessment of relative risk of degraded water quality to the GBR (Brodie et al. 2013b) also identified that risk to the major reef assets, coral reefs and seagrasses differs between the pollutant classes and the source catchments, and varies with the distance of the assets from the river mouths. These studies indicate the substantial geographic variation in risk to the reef at and below sub-catchment level.

17
Introduction
Reef Water Quality Protection Plan 2013Prioritisation project report
This study seeks to identify the opportunities to sharpen the focus of future investment in practice change to reduce anthropogenic pollutant loads to the GBR lagoon by identifying the:1. relative contribution of each of the 35 sub-catchments flowing to the reef lagoon to pollutant loads
(TSS, PP, DIN, PN, and herbicides – PSII)2. relative contribution of major agricultural industries in each sub-catchment to pollutant loads generated 3. room for improvement in agricultural industries’ nutrient, herbicide and sediment management practices 4. management practices expected to deliver the biggest load reductions.

18 Reef Water Quality Protection Plan 2013Prioritisation project report
Chapter 2
Methods
Multi-Criteria Analysis Shell for Spatial Decision Support analysisFor this study, we chose the Multi-Criteria Analysis Shell for Spatial Decision Support (MCAS–S) approach (ABARES 2011) to draw the lines of evidence from water quality monitoring and modelling, research and practice change monitoring together in a transparent way. It also enables input from Reef stakeholders including governments, industry, the science community and regional natural resource management (NRM) bodies, as well as exploration of the data inputs and potential solutions.
Reef stakeholders had previously contributed to a Multiple Criteria Analysis (MCA) (Hajkowicz 2007, Bureau of Rural Sciences 2010) undertaken to advise on the allocation of Reef Rescue funding for years two to five of the program. This process informed allocation of Reef Rescue funds to regions in 2008. The MCA process and its results were well received. It facilitated the sharing of up-to-date information, and structured interactions between Reef Rescue implementers, scientists and stakeholders (Cotsell et al. 2009). The main result of the MCA work was to increase the priority given to the management of extensive grazing lands, in recognition of the extremely large pollutant loads delivered from the Burdekin and Fitzroy sub-catchments during periodic flood events (Cotsell et al. 2009).
As part of the current analysis, an MCA spreadsheet was prepared for each region to enable them to use initial results of the analysis for prioritising on-ground investment in 2013–14, and to familiarise them with the MCA process and the data for the estimated total and anthropogenic water quality loads, land use and the areas in different management practice classes (the ABCD frameworks) for sub-catchments available from the Paddock to Reef program.
MCAS–S is a spatial decision support software tool developed by ABARES (ABARES 2011). It is available free from daff.gov.au/abares/data/MCAS–S. This software facilitates spatial multi-criteria analysis – a process designed to improve decision-making by organising factual information, opinion, and policy and management goals in a transparent and logical framework. MCAS–S is particularly useful in participatory processes. MCAS–S enables users to view and classify map layers, and adapt and combine map layers to provide insight into key relationships and questions. Stakeholders can see the potential impact of decisions, look at alternatives using live-update mapping options, and produce statistical reports for areas of interest quickly and simply. MCAS–S has been used to inform the design of risk-based general surveillance systems for animal disease in Australia (East et al. 2013), decision making by the Murray Darling Basin Authority (ABARE–BRS 2010), examining trade-offs between agriculture, energy production, and biodiversity conservation (Hill and Olsen 2013) and assessing the risks of degraded water quality to GBR ecosystems (Brodie et al. 2013b).
MCAS–S uses raster spatial layers with a common extent and projection, and allows their combination according to user-defined simple algebraic formula (such as addition). Weightings can be assigned to each layer based on expert judgement. There are a number of options (equal interval, equal area, logarithmic or user defined) for classifying the mapped data. The software enables the production of statistical reports such as maximum and minimum values, ranges and counts of grid cells in various ranges. The MCAS–S analysis undertaken for this study only included data sets that were available in a similar format so that comparisons between the 35 GBR sub-catchments examined could be made.

19
Methods
Reef Water Quality Protection Plan 2013Prioritisation project report
MCAS–S analysis for the Reef Water Quality Protection Plan 2013The Reef Plan 2013 MCAS–S analysis follows the ‘assets, threats and solvability’ model for priority setting (Hajkowicz and McDonald 2006). Figure 2 shows the conceptual diagram or means-to-an-end pathway prepared to help visualise the relationships between policy alternatives (means) and objectives (ends) for this study. The ‘solvability’ criterion within the ATS model is a proxy measure of the likely cost (Stefan Hajkowicz, pers. comm.). A highly solvable problem may be considered to have lower cost. For example, in this study the area (hectares) of sugar cane land being managed using B, C, and D nutrient management practices (room for improvement) is one of the solvability criteria. This is because there are known actions to reduce nutrient losses from sugar cane land. More room for improvement within the investment region creates an increased likelihood of cost-effective options being identified to reduce marginal nutrient loads to the reef.
Three workshops were held with members of the working group to review the available data and agree on the information describing the assets, threats and solvability components of the MCAS–S analysis, the number of classes, and the class intervals and weightings for each data input.
FIGURE 2 Reef Water Quality Protection Plan 2013 – generalised means-to-an-end
Riskassessment
Solvability
Assets(corals and sea
grasses)
Threats(total loads)
Room forimprovement in
management practices
Anthropogenicloads
Priorities for investment
The assets referred to in this study were defined by Brodie et al. (2013b) as the areas (km2) of coral reef and seagrass meadows within the marine boundaries of each GBR NRM region, and were the key GBR ecosystems they used to assess the relative risk of pollutants to GBR ecosystem health. The pollutants assessed included the TSS, DIN and PSII delivered by the six NRM regions draining to the GBR lagoon, plus chlorophyll a – an indicator of nutrient enrichment in aquatic environments. High chlorophyll concentrations enhance the survival of COTS larvae.
The results of this marine assessment are summarised in Appendix 2 (Brodie et al. 2013b). These are reported at the NRM region level, and thus could not be used in the current MCAS–S analyses which use data at the more detailed 35 sub-catchment scale (see Figures 1a and 1b for locations). As a result, the total (anthropogenic plus pre-development) annual nutrient and sediment loads from each sub-catchment were used as a measure of the threats to coral reef and seagrass meadows. An index for herbicide concentrations was added to represent the herbicide threat to marine assets, and a COTS index to represent additional threats from some sub-catchments due to the likely influence of their DIN loads on the initiation of COTS outbreaks. The end-of-catchment loads for TSS, DIN and herbicides influence the ecologically relevant marine water quality variables of TSS, chlorophyll and herbicide concentrations which pose a risk to the GBR corals and seagrasses (Brodie et al. 2013b).
20
Methods
Reef Water Quality Protection Plan 2013Prioritisation project report
Solvability (the combination of factors that contribute to a possible solution) is defined as the score for size of the anthropogenic pollutant loads from agricultural lands, plus the score for room for improvement (the area over which land management practices affecting sediment, nutrient and/or herbicide loads could be improved). Sub-catchments with high solvability scores will deliver large pollutant loads to the GBR lagoon, and have large areas over which management practices could be improved.
The hypothesis underlying the Australian Government’s Reef Rescue and Reef Programme is that improvements in agricultural land management practices will result in improvements in water quality at the end of the catchments discharging to the GBR lagoon. Seventy-nine per cent – $158 million – of the Australian Government’s investment in Reef Rescue (2008-09 to 2013-14), was provided for Water Quality Grants and Partnerships to deliver on the following targets by 2013:• 10 per cent reduction in anthropogenic sediment and particulate nutrient loads • 25 per cent reduction in dissolved anthropogenic nutrients and herbicide loads • 1300 farmers and 650 pastoralists adopting improved management practices.
ABCD management systems frameworks were developed by industry and regional NRM organisations for Reef Rescue to categorise farming practices for the cane, grazing, cropping and horticulture industries according to recognised water quality improvements at paddock scale (Rolfe et al. 2008. Drewry et al. 2008). Detailed definitions for A (cutting-edge practices), B (currently promoted), C (common) and D (unacceptable) classes are available at reefplan.qld.gov.au/measuring-success/methods/management-practices.aspx. The grazing and cane frameworks used for Reef Rescue are shown in Appendices 5 and 6. Management system benchmarks were developed by the Paddock to Reef program through direct surveying of landholders, with surveys designed to align with the management practice frameworks. The benchmarks broadly describe how the landscape is managed (the proportion in an A, B, C, or D system state). As changes in management are identified (for example, through a Reef Rescue incentive grant to a farmer to move from C to B) these are represented in the reporting and modelling as areas moving from one system state to another (e.g. from ‘C’ management, to ‘B’ management class).
Under the Paddock to Reef program, sub-catchment scale industry benchmarks for the adoption of improved management practices were established for cane and grazing against regional ABCD management practice frameworks. (See reefplan.qld.gov.au/measuring-success/methods/assets/gbr-report-card-2011-management-practices-methods.pdf). Face-to-face surveys using questions based on key management practices (e.g. stock management, ground cover monitoring, tillage) were conducted by field officers, and sample results extrapolated to establish industry-wide benchmarks. Annual management practice change was tracked through detailed project information on Reef Rescue on-ground water quality improvement projects supplied by regional NRM bodies and other sources of practice change such as accredited and evaluated training undertaken through FarmReady, a Department of Agriculture Program providing training for primary producers to develop strategies to adapt and respond to the impacts of climate change.
The program utilises the values for the input data (red boxes in Figure 2) for each criterion, scoring the data for each sub-catchment; the sub-catchments with the lowest and highest loads (e.g. anthropogenic DIN loads) are scored as zero and one respectively. The remaining sub-catchments are ranked in relation to these smallest and largest contributors. The input data are then classified for mapping; in this study five equal interval classes are used. For interpretation purposes these classes are labelled as very low, low, medium, high and very high. Each sub-catchment’s score is added to provide a combined score.
In the example shown in Appendix 3, the input layers for C and D sediment management practices in the grazing industry are added to produce a combined room for improvement score (shown in the histogram) for each sub-catchment. The room for improvement scores are then classified into 5 classes to produce the room for improvement map. Scores for each of the anthropogenic loads are prepared in the same way, and added to produce a combined anthropogenic load score for each sub-catchment. Combining (adding) the room for improvement scores and the anthropogenic loads scores produces a solvability score for each sub-catchment. Adding sub-catchments’ risk assessment and solvability scores produces an overall priority score for investment in each sub-catchment. The results are presented as a series of maps (e.g. Figure 9).

21
Methods
Reef Water Quality Protection Plan 2013Prioritisation project report
The costs per unit of pollutant reduction across different industries and sub-catchments would be useful information to include in any future prioritisation process. The approximate cost per unit of modelled pollutant load reduction reported in the Reef Plan Second Report Card (State of Queensland 2010) for each NRM region was estimated using the costs of cane and grazing projects delivered under Reef Rescue.
The estimated abatement cost per tonne of sediment from grazing varied between $42 and $2600. Similarly the estimated cost of DIN abatement for cane varied from $22,000 to $117,000 per tonne across regions. The estimated cost of herbicide abatement for cane ranged from $2000 to $5900 per kilogram of active ingredient across regions (Kevin Gale, Department of Environment, pers. comm.). These differences were much larger than expected, and it was decided not to include this information in the MCAS–S analysis.
A number of factors may contribute to significant differences in abatement costs between regions, including average farm size, production differences (e.g. rain-fed v. irrigated cane, rangelands v. coastal grazing), climate, soil type and topography. However, further investigation also revealed differences that may be the source of significant errors in estimates of costs of practice change and associated pollutant abatement between regions, including:• Large differences in the pollution reduction levels attributed to management practice system changes
between regions. Regional abatement estimates for system changes were estimated independently by regional industry groups.
• Differences in how the areas of practice change were reported by regional NRM bodies for projects – ranging from whole properties to relatively small project areas within properties. For example, for grazing in some regions, the impact of attendance at accredited training courses was reported and subsequently modelled as practice improvement (e.g. C to B class system change) over entire properties. In other regions, the areas directly affected by much smaller on-ground project activities, such as mechanical treatment of scalds, were reported and modelled.
• Large investments (up to $300,000) by some regions went into foundation projects, such as region-wide GPS base station networks, and improved mill mud distribution systems for which direct water quality outcomes could not be modelled, although these projects may have significant water quality benefits in the long term.
These uncertainties in the reporting of project areas and pollutant abatement costs will be reduced over time as project reporting and modelling systems are improved. In addition, future load reductions will be estimated and modelled for individual practice changes rather than management practice system changes, which should greatly reduce inter-regional differences due to variations in ABCD class management practice frameworks.
A preliminary analysis of the modelled water quality loads data at the regional level, and the results of the assessment of the risk of key pollutants to GBR ecosystems (Brodie et al. 2013b) had been undertaken to provide advice to applicants for Water Quality Grants and Partnerships (Caring for our Country 2013). This work identified that the sugar cane industry made the largest contributions to anthropogenic DIN and herbicides, and that grazing made the largest contribution to TSS loads. Applicants were asked to give priority to funding for improvements in the cane and grazing industries in their applications. Data were also available for the cane and grazing industries on the extent of change in management practices resulting from investment. It was agreed to focus the MCAS–S analysis on these industries, with a view to including the other industries when sufficient information on their management practices and pollution generation rates is available.
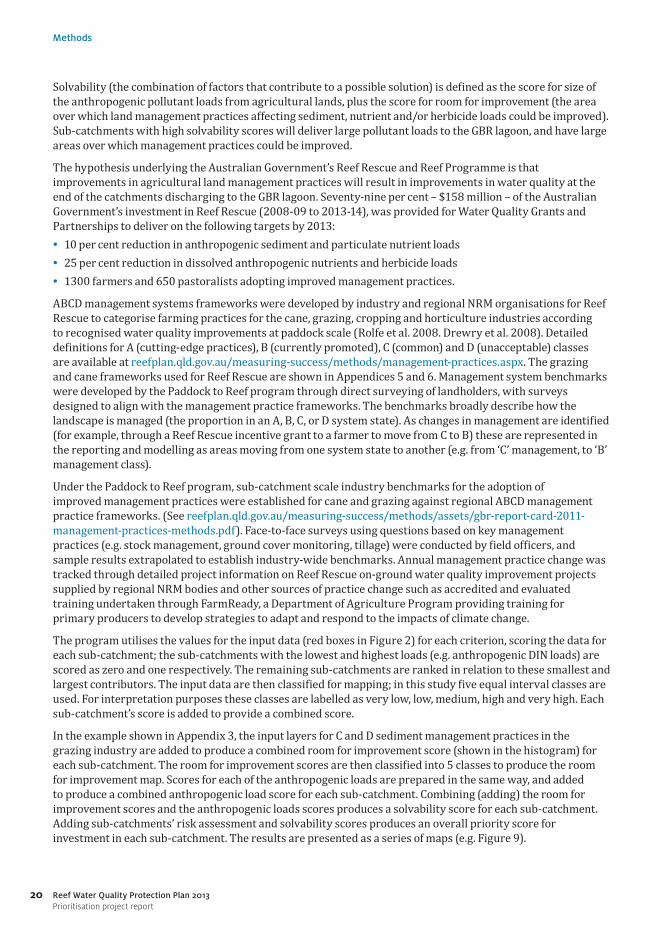
Grazing industry analysisFigure 3 shows the means-to-an-end diagram developed by the working group for grazing. The marine assets are the coral reefs and seagrass beds as described in Brodie et al. (2013). Note that data for these assets are not entered into the MCAS–S analysis but are used to define the threats. The threats to these assets are represented as the total (pre-development and anthropogenic) TSS, PP and PN loads from each sub-catchment. PP and PN loads were not included in the Brodie et al. risk assessment but are incorporated here due to increasing concerns about the possible role of phosphorus as an influence on reef health, and the bioavailability of particulate nutrients in the marine environment.
22
Methods
Reef Water Quality Protection Plan 2013Prioritisation project report
FIGURE 3 Grazing means-to-an-end diagram
Risk to reefAssets
(seagrass and coral reefs)
Total TSS exported loads
Total PPexported loads
Total PNexported loads
Room forimprovement
Solvability
Prioritising investmentin grazing by
sub-catchments
TSS loads PP loads PN loads C practices (ha) D practices (ha)
Threats
Anthropogenicsediment loads
Solvability scores are calculated by adding the scores for each sub-catchment’s anthropogenic loads for TSS, PN and PP from grazed land, plus the sub-catchment’s scores for room for improvement in grazing land management practices (descriptions in Appendix 5, data in Appendix 7a).
Cane industry analysisFigure 4 shows the means-to-an-end diagram for sugar cane. The marine assets are the coral reefs and seagrass beds as described in Brodie et al. (2013b). Again the data for these assets are not entered into the MCAS–S analyses but are used to define the threats. The nutrient threats to these are represented as the total (pre-development and anthropogenic) DIN loads, plus a COTS index of the relative differences between sub-catchment discharges to the COTS initiation zone (Furnas et al. 2013a). This zone is the area of the GBR lagoon between latitude 14.5°S (Cairns) and 17°S (Lizard Island) where primary COTS outbreaks have been observed. COTS outbreaks are a major cause of coral loss (De’Ath et al. 2012) and appear to be a response to excess nutrient runoff from certain catchments that impact this initiation zone.
Nutrient solvability for the cane industry is defined as the scores for room for improvement in nutrient management practices plus the scores for anthropogenic DIN loads in each sub-catchment. The room for improvement in each sub-catchment is the modelled area of cane grown using B, C or D nutrient management practices (see Appendix 6 for descriptions). B class practices (currently promoted practices, often referred to as ‘Best Management Practices’), were included in the room for improvement because recent work has suggested that the adoption of these B class practices may not result in the reduced nitrogen application rates needed for DIN load reduction (State of Queensland 2013a).
The herbicide threats are the annual mean concentrations for herbicides delivered to the GBR lagoon by each sub-catchment. The figures are derived from Lewis et al. (2011) and prepared by Stephen Lewis, James Cook University). Herbicide solvability is the scores for room for improvement in herbicide management practices (C and D class practices, Appendix 7b) plus the scores for herbicide loads. The working group decided not to include sediment loads in the sugar cane analysis because TSS loads from sugar for most sub-catchments are a minor risk to the reef and sediment losses are reduced through improved nutrient management practices.

23
Methods
Reef Water Quality Protection Plan 2013Prioritisation project report
FIGURE 4 Sugar cane means-to-an-end diagram
Anthropogenicherbicide
loads
Room forimprovement
herbicides
Herbicide solvability
Nutrientpriorities
PSII loads
C practices (ha) D practices (ha)
Anthropogenicnutrient
loads
Room forimprovement
nutrients
Nutrient solvability
DIN loads
Threats fromherbicides
Assets (seagrass and
coral reefs)Herbicides
risk
Threats fromnutrients
Assets (seagrass and
coral reefs)
B practices (ha) C practices (ha) D practices (ha)
Total DIN loads COTS influence
Risk to reef from herbicides
Prioritising investmentin sugar cane by sub-catchments
Herbicidepriorities
Risk to reef from nutrients
MCAS–S data inputs
Modelled water quality dataModelled water quality results for the Reef Report Card 2010 (State of Queensland 2012), including the average annual (1986–2009) modelled anthropogenic and total (pre-development plus anthropogenic) loads and loads per hectare for each sub-catchment, were supplied by the Paddock to Reef program (Carroll et al. 2012). This program uses the eWater Cooperative Research Centre (2010) Source catchments modelling framework to generate estimates for sediment, nutrient and herbicide loads entering the Great Barrier Reef lagoon from the 35 major Reef sub-catchments. SedNet modelling functionality has been incorporated in the Source catchments modelling to include estimates of sediments and particulate nutrients being delivered through gully and stream bank erosion.
The model is run for each scenario using a fixed climate period (1986–2009) to remove the effects of climate variability to estimate the annual average pre-development (100 per cent native vegetation) and baseline (2009 land use and land management) pollutant loads. Changes in land management (e.g. ground cover) relative to the baseline year are then modelled for the same long-term climate signal to produce the long-term annual average load reductions by NRM region for each pollutant. Land use changes are not modelled, as these are not detectable over the short timeframes of the reporting period. Delays between improved land management practice and attainment of improved land condition are not considered – load reductions are modelled for the expected final state of the land condition.
24
Methods
Reef Water Quality Protection Plan 2013Prioritisation project report
Whilst subject to significant uncertainty, regional and sub-catchment pollutant load estimates are validated through comparison with monitored loads where available. The Great Barrier Reef Catchment Loads Monitoring Program monitors TSS, nutrients (nitrogen and phosphorus) and herbicides as part of the Paddock to Reef program. TSS and nutrients are monitored at 25 sites covering 11 high priority catchments and 14 sub-catchments. Herbicides are monitored at 11 sites in nine high priority catchments and two sub-catchments. Samples are collected on a monthly basis during ambient (low flow, dry season) conditions and every few hours to daily during high flow events in the wet season. The concentrations of contaminants are determined, and the volume of water flowing in the rivers is then used to estimate the total amount of each contaminant (i.e. the load) that flows past the sampling sites. The loads for all measured contaminants are released in an annual technical report. (See reefplan.qld.gov.au/measuring-success/paddock-to-reef/catchment-loads-monitoring.aspx.)
Modelling load reductions Regional and catchment load reductions arising from improved land management practices in cane and grazing are modelled based on plot and paddock scale monitoring and modelling, and rainfall simulation experiments (Shaw et al. 2013). Information and methods used for monitoring and modelling are continuously improved, with the aim of decreasing uncertainties and increasing the range of industries and practices that may be modelled. Current model predictions of load reductions arising from the adoption of improved management practices are considered conservative.
A range of models were used to generate the daily pollutant loads for current and improved practices for Source catchments. For cane, APSIM (Thorburn et al. 2007) was used to model crop growth and DIN losses, with ‘Howleaky?’ used to model phosphorus and herbicides. ‘Howleaky?’ was used to model grains cropping (Rattray et al. 2004). The Revised Universal Soil Loss Equation (Renard et al. 1997) was used to model sediment loss from grazing lands with management effects on cover modelled using GRASP (Grass Production Model) (McKeon et al., 2000). Pollutant loads were generated using typical scenarios of A, B, C and D management practices which were defined through expert opinion in each region. The relative improvements in water quality outputs between the levels of management change (e.g. C to B) are therefore not equivalent across regions.
The modelling framework enables the synthesis of management practice, paddock monitoring and modelling, and catchment monitoring and modelling data. The modelled output is used to report end of catchment pollutant loads for each of the 35 major sub-catchments flowing to the GBR lagoon for a baseline year, and changes relative to the baseline year for each subsequent year of reported changes in management practices.
GBR sub-catchments range in size from the Mossman (48,000 hectares) to the Fitzroy (14,250,000 hectares). The larger of these sub-catchments, the Burdekin and the Fitzroy, contain a wide range of climates, soil types, underlying geologies and vegetation types. As a result, significant spatial heterogeneity in soil erosion rates is expected. Understanding these differences is important for prioritising investment and management options. Pollutant loads data for management units (so called to distinguish them from the sub-catchments which flow into the GBR lagoon) – the Belyando, Bowen Bogie, Cape Campaspe, East Burdekin, Upper Burdekin and Suttor in the Burdekin sub-catchment, and the Comet, Dawson, Fitzroy, Isaac, Mackenzie, Nogoa and Theresa Creek in the Fitzroy sub-catchment – were supplied from the Paddock to Reef program to investigate differences in soil loss at this scale.
Water quality data used in the MCAS–S analysisData for sediments (TSS), dissolved inorganic nitrogen (DIN) and herbicides (PSII) were chosen for the MCAS–S analysis from the suite of pollutants modelled because they had been identified as posing the greatest ecological risk to the GBR corals and seagrasses by Brodie et al. (2013). (Ecological risk in the GBR is defined by Brodie et al. 2013 as the area of coral reefs and sea grass meadows within a range of assessment classes – from very low to very high relative risk – for several water quality variables in each NRM region). Particulate nitrogen (PN) and phosphorus (PP) were also included due to concerns that these pollutants may be more readily bioavailable (available for uptake by living organisms) than previously thought, and could have significant impacts on reef corals and seagrasses.
25
Methods
Reef Water Quality Protection Plan 2013Prioritisation project report
Spreadsheets containing the modelled water quality loads for pre-development and 2008–09 scenarios were provided for the sub-catchments in each NRM region by the Paddock to Reef program to use in the MCAS–S analysis. The DIN, PP, PN, TSS and PSII herbicide data (atrazine, diuron, hexazinone and tebuthiuron) were extracted from the five spreadsheets. Anthropogenic loads for each land use were calculated by subtracting the pre-development loads from the 2008–09 loads; if the calculated anthropogenic loads were negative, these were set to zero. Anthropogenic loads were then divided by the area for each land use to calculate loads per hectare. The 14 land use classes were aggregated into seven land uses (bananas, dairy, grains, grazing, horticulture, sugar cane and other uses).
Other data supplied by Paddock to Reef included:• total loads to the GBR lagoon, which uses the 2008–09 scenario data for all land uses,• room for improvement data, which uses the area (hectares) under C and D practices in the grazing and B, C
and D practices in the sugar cane industries, (Appendices 7a and 7b respectively).
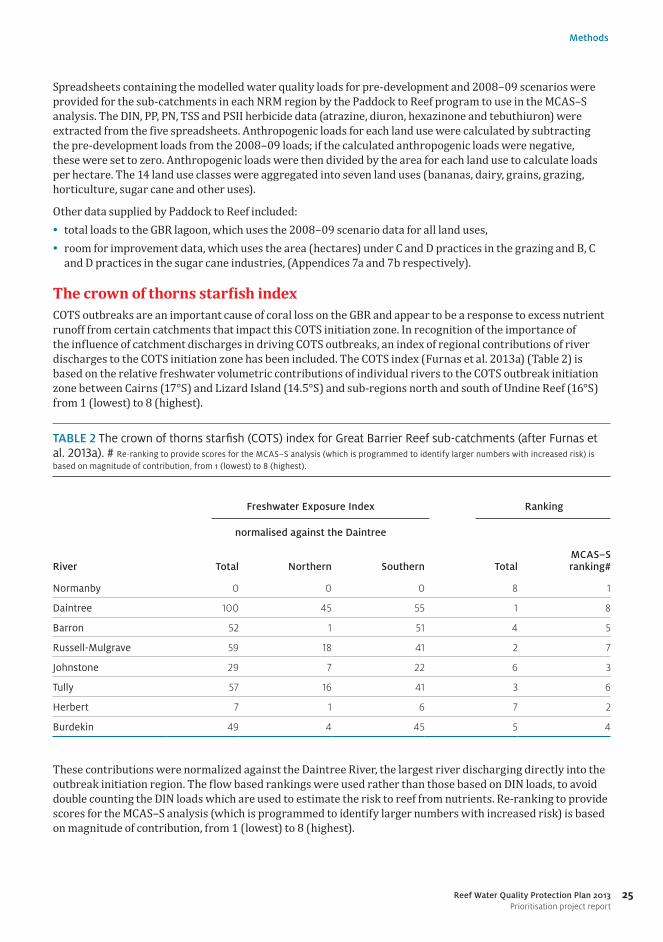
The crown of thorns starfish indexCOTS outbreaks are an important cause of coral loss on the GBR and appear to be a response to excess nutrient runoff from certain catchments that impact this COTS initiation zone. In recognition of the importance of the influence of catchment discharges in driving COTS outbreaks, an index of regional contributions of river discharges to the COTS initiation zone has been included. The COTS index (Furnas et al. 2013a) (Table 2) is based on the relative freshwater volumetric contributions of individual rivers to the COTS outbreak initiation zone between Cairns (17°S) and Lizard Island (14.5°S) and sub-regions north and south of Undine Reef (16°S) from 1 (lowest) to 8 (highest).
TABLE 2 The crown of thorns starfish (COTS) index for Great Barrier Reef sub-catchments (after Furnas et al. 2013a). # Re-ranking to provide scores for the MCAS–S analysis (which is programmed to identify larger numbers with increased risk) is based on magnitude of contribution, from 1 (lowest) to 8 (highest).
Freshwater Exposure Index Ranking
normalised against the Daintree
River Total Northern Southern TotalMCAS–S ranking#
Normanby 0 0 0 8 1
Daintree 100 45 55 1 8
Barron 52 1 51 4 5
Russell-Mulgrave 59 18 41 2 7
Johnstone 29 7 22 6 3
Tully 57 16 41 3 6
Herbert 7 1 6 7 2
Burdekin 49 4 45 5 4
These contributions were normalized against the Daintree River, the largest river discharging directly into the outbreak initiation region. The flow based rankings were used rather than those based on DIN loads, to avoid double counting the DIN loads which are used to estimate the risk to reef from nutrients. Re-ranking to provide scores for the MCAS–S analysis (which is programmed to identify larger numbers with increased risk) is based on magnitude of contribution, from 1 (lowest) to 8 (highest).
26
Methods
Reef Water Quality Protection Plan 2013Prioritisation project report
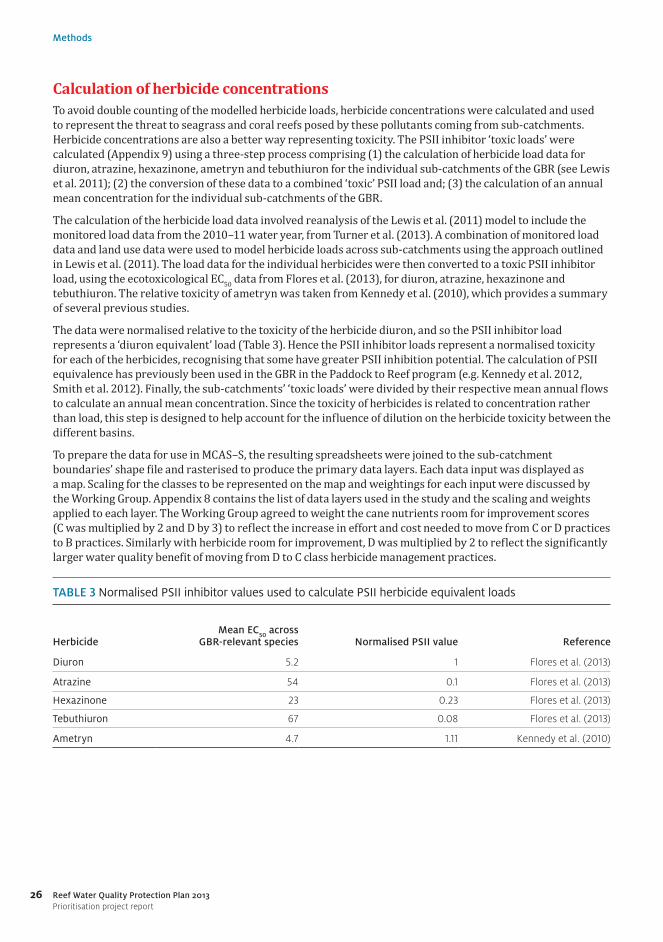
Calculation of herbicide concentrations To avoid double counting of the modelled herbicide loads, herbicide concentrations were calculated and used to represent the threat to seagrass and coral reefs posed by these pollutants coming from sub-catchments. Herbicide concentrations are also a better way representing toxicity. The PSII inhibitor ‘toxic loads’ were calculated (Appendix 9) using a three-step process comprising (1) the calculation of herbicide load data for diuron, atrazine, hexazinone, ametryn and tebuthiuron for the individual sub-catchments of the GBR (see Lewis et al. 2011); (2) the conversion of these data to a combined ‘toxic’ PSII load and; (3) the calculation of an annual mean concentration for the individual sub-catchments of the GBR.
The calculation of the herbicide load data involved reanalysis of the Lewis et al. (2011) model to include the monitored load data from the 2010–11 water year, from Turner et al. (2013). A combination of monitored load data and land use data were used to model herbicide loads across sub-catchments using the approach outlined in Lewis et al. (2011). The load data for the individual herbicides were then converted to a toxic PSII inhibitor load, using the ecotoxicological EC50 data from Flores et al. (2013), for diuron, atrazine, hexazinone and tebuthiuron. The relative toxicity of ametryn was taken from Kennedy et al. (2010), which provides a summary of several previous studies.
The data were normalised relative to the toxicity of the herbicide diuron, and so the PSII inhibitor load represents a ‘diuron equivalent’ load (Table 3). Hence the PSII inhibitor loads represent a normalised toxicity for each of the herbicides, recognising that some have greater PSII inhibition potential. The calculation of PSII equivalence has previously been used in the GBR in the Paddock to Reef program (e.g. Kennedy et al. 2012, Smith et al. 2012). Finally, the sub-catchments’ ‘toxic loads’ were divided by their respective mean annual flows to calculate an annual mean concentration. Since the toxicity of herbicides is related to concentration rather than load, this step is designed to help account for the influence of dilution on the herbicide toxicity between the different basins.
To prepare the data for use in MCAS–S, the resulting spreadsheets were joined to the sub-catchment boundaries’ shape file and rasterised to produce the primary data layers. Each data input was displayed as a map. Scaling for the classes to be represented on the map and weightings for each input were discussed by the Working Group. Appendix 8 contains the list of data layers used in the study and the scaling and weights applied to each layer. The Working Group agreed to weight the cane nutrients room for improvement scores (C was multiplied by 2 and D by 3) to reflect the increase in effort and cost needed to move from C or D practices to B practices. Similarly with herbicide room for improvement, D was multiplied by 2 to reflect the significantly larger water quality benefit of moving from D to C class herbicide management practices.
TABLE 3 Normalised PSII inhibitor values used to calculate PSII herbicide equivalent loads
HerbicideMean EC
50 across
GBR-relevant species Normalised PSII value Reference
Diuron 5.2 1 Flores et al. (2013)
Atrazine 54 0.1 Flores et al. (2013)
Hexazinone 23 0.23 Flores et al. (2013)
Tebuthiuron 67 0.08 Flores et al. (2013)
Ametryn 4.7 1.11 Kennedy et al. (2010)

27
Methods
Reef Water Quality Protection Plan 2013Prioritisation project report
Land management practices For the MCAS–S analysis, 2010–11 areas (hectares) under each of the ABCD systems for sediment management in the grazing industry and nutrient and herbicide management in the cane industry were supplied for each sub-catchment by the Paddock to Reef program.
Management system benchmarks for grazing developed by the Paddock to Reef program provide an estimate of the amount of land managed with the A, B, C and D management practices shown in Appendix 5. Grazing industry benchmarks had been developed through representative sampling of graziers in each catchment; these were weighted to reflect the potential impact of the management practices on water quality. The output used in the water quality modelling is a metric that attempts to approximate the likely impact of management on land condition, runoff and soil loss. The scores for room for improvement in practices were calculated for the grazing industry by adding together the area (hectares) under C and D class practices for each sub-catchment – i.e. the areas that could be available for adoption of B class practices. Future funding will be used to encourage pastoralists using C or D practices to adopt B grazing management practices.
For the cane industry, scores for room for improvement in nutrient management were calculated by summing the areas under B, C and D nutrient management practices, recognising that funding from the Reef Programme will focus on encouraging the adoption of revised practices for nutrient management. Recent work has shown that the B class practices for nutrient management shown in Appendix 6 may not deliver the DIN reductions needed to meet current Reef Plan targets (State of Queensland 2013a), and revised B class practices for nutrient management, which focus on matching nitrogen inputs to block or within block zone, have been developed for the cane industry.
Scores for room for improvement in herbicide management were estimated for each sub-catchment by summing the areas under C and D herbicide management practices. Management system benchmarks for sugar cane had been developed by the Paddock to Reef program following an industry-wide survey utilising a common suite of key indicator questions. Responses to these questions were analysed to develop a metric (A, B, C or D class) which attempts to approximate the impacts of management on the potential loss of sediment, nutrients, and herbicides from sugar cane farming systems.
The data on land management practice change provided to the Paddock to Reef program was not spatially explicit; areas subject to management change were described at the sub-catchment level rather than for the land parcels where the investments took place. The potentially large benefit of spatial targeting for maximum return on investment may be diluted by this approach.
Multi Criteria Analysis spreadsheets for NRM regionsIn addition to preparing the Paddock to Reef water quality and land management practices data for use in MCAS–S, an Excel spreadsheet-based Multi – Criteria Analysis, was prepared for each of the six regional NRM bodies. These spreadsheets included:• the average annual modelled total loads (anthropogenic plus pre-development) for the 1986–2009
climate period for sub-catchments used to characterise the threats to the coral and seagrass assets in the MCAS–S analysis
• the average annual modelled anthropogenic loads and loads per hectare (1986–2009 climate period) for sub-catchments for the banana, grains, grazing, horticulture and sugar cane industries and other uses – the anthropogenic loads used as input to solvability in the MCAS–S analysis
• the room for improvement in management practices in the sugar cane and grazing industries, also used as an input to solvability
• data from the Australian Bureau of Statistics agricultural census for 2010–11 showing the numbers of agricultural businesses in the banana, dairy, grains, grazing, horticulture and sugar cane industries and the areas (hectares) used by these industries to help characterise each sub-catchment.
28
Methods
Reef Water Quality Protection Plan 2013Prioritisation project report
The spreadsheets provided regional NRM bodies with access to the above data and the capacity to use the Multi – Criteria Analysis to compare data for sub-catchments within their region. The spreadsheet also included tools to adjust the weightings given to data sets, exclude data sets or add local data sets (such as information on the extent of gullying) to the analysis. These changes automatically updated the scores assigned to criteria, the overall scores and the spider diagram and bar charts used to display the results.
Presentations demonstrating the use of the MCA spreadsheet were made at four well attended regional science forums sponsored by the Australian Government Reef Programme to assist regional NRM bodies with their investment prioritisation in late 2013. Support was provided to regional staff interested in using the MCA tool in their prioritisation processes.

29Reef Water Quality Protection Plan 2013Prioritisation project report
Chapter 3
Investment priorities for sub-catchmentsAgricultural industry contributions to sub-catchment anthropogenic loadsResults showing the average annual modelled loads (1986–2009 climate period) for the 35 GBR sub-catchments for the banana, dairy, grains, grazing, horticulture and sugar cane industries and other land uses (comprising conservation, forestry and urban) are presented in Figures 16 to 20, Appendix 10. The loads per hectare data are shown in Figures 21 to 25, Appendix 11. The pollutants reported are sediments (TSS), dissolved inorganic nitrogen (DIN), particulate phosphorus (PP), particulate nitrogen (PN) and herbicides (PSII). Modelled loads reported in this section are based on Reef Plan Second Report Card results, as industry contributions to the report card were the only data available at the time of writing. In summary, land used for cropping, dairy, grazing, horticulture (including bananas) and sugar cane contributes an estimated 55, 69 and 66 per cent respectively to the estimated anthropogenic loads of TSS, PN and PP, plus an estimated 87 per cent of the anthropogenic DIN and 100 per cent of the PSII delivered to the GBR lagoon.
Figure 5 shows the estimated sources of anthropogenic TSS, PN and PP loads for the GBR catchment by land use. TSS loads were estimated to come predominantly from hillslope and gully erosion in grazing lands (45 per cent), followed by stream bank erosion (39 per cent), cane lands (6 per cent) and land cropped for grains (3 per cent). Non-agricultural land uses, including conservation, forestry and urban land, which occupy 13, 5 and less than 1 per cent of the GBR catchment respectively, contribute 3, 1 and 1 per cent to the GBR’s annual average anthropogenic load of TSS. While most of the PP and PN comes from hillslope and gully erosion in grazing land (43 and 45 per cent respectively), stream bank erosion contributes 28 and 21 per cent of the PP and PN respectively. Cane lands contribute 18 per cent to the annual average anthropogenic PP and 18 per cent to PN loads delivered to the GBR lagoon. The contributions from lands cropped for grain are 4 per cent (PP) and 3 per cent (PN).
Figure 6 shows the predicted sources of DIN and PSII loads for the GBR catchment. The largest contributions of DIN to anthropogenic loads come from sugar cane (56 per cent), followed by grazing (21 per cent) and grains (3 per cent). Most of the herbicides come from cane lands (94 per cent), with small contributions from land cropped for grains (4 per cent) and grazed lands, predominantly in the Fitzroy sub-catchment (2 per cent).
Grazing industry contributions to anthropogenic loadsThe grazing industry, which occupies 75 per cent of the area of the GBR catchments, contributes around 45 per cent of the average annual anthropogenic loads of TSS, and 43 and 45 per cent of the PP and PN respectively (Figure 6) delivered to the GBR lagoon from hillslope and gully erosion. Much of the total anthropogenic TSS, PP and PN exported to the GBR from grazing lands comes from the Burdekin (50, 45 and 46 per cent respectively) and Fitzroy (30, 25 and 15 per cent respectively) NRM regions. Within the Burdekin NRM region, the Burdekin sub-catchment is the largest contributor from grazing lands, with 85 per cent of the TSS, 85 per cent of the PP and 83 per cent of the PN loads.

30
Investment priorities for sub-catchments
Reef Water Quality Protection Plan 2013Prioritisation project report
FIGURE 5 Percentage contributions from hillslope and gully erosion by land uses to GBR predicted annual anthropogenic TSS, PP and PN loads
PPTSS PN
0
Land
use
(are
a of
the
GB
R)
Loads (percentage of GBR)
Nature conservation (9%)
Forestry (5%)
Urban (0.5%)
Stream bank (0%)
Other uses (0.5%)
Banana (0.01%)
Horticulture (0.1%)
Sugar cane (1.3%)
Irrigated cropping (0.5%)
Dryland cropping (3%)
Dairy (0.03%)
Grazing (75%)
10 20 30 40 50
FIGURE 6 Percentage contributions by land uses to GBR predicted annual anthropogenic DIN and PSII herbicide loads
PSIIDIN
0
Land
use
(are
a of
the
GB
R)
Loads (percentage of GBR)
Nature conservation (9%)
Forestry (5%)
Urban (0.5%)
Stream bank (0%)
Other uses (0.5%)
Banana (0.01%)
Horticulture (0.1%)
Sugar cane (1.3%)
Irrigated cropping (0.5%)
Dryland cropping (3%)
Dairy (0.03%)
Grazing (75%)
10 20 30 40 50 60 70 80 90 100

31
Investment priorities for sub-catchments
Reef Water Quality Protection Plan 2013Prioritisation project report
Within the Fitzroy NRM region, the biggest anthropogenic load contributions from hillslope and gully erosion in grazing lands come from the Fitzroy sub-catchment (90, 90 and 88 per cent of the TSS, PP and PN loads respectively). The grazing industry also makes a significant contribution to the GBR catchment’s DIN load; 22 per cent came from grazing. Grazing in the Burdekin and Fitzroy sub-catchments contributed 50 and 35 per cent respectively to this DIN load.
Stream bank erosion losses in the current model cannot be attributed to specific land uses. However, given the extent of grazing in the GBR catchment, it is likely that substantial components of the modelled TSS, PP and PN loads from stream bank erosion (39, 28 and 21 per cent respectively) come from land managed for grazing.
To examine the geographic variability in soil loss across the Burdekin and Fitzroy sub-catchments and the potential for better spatial targeting of investment, TSS data for end-of-system loads produced by the Paddock to Reef program were examined for management units (smaller catchment areas within the Burdekin and Fitzroy). The high variability shown in Figure 7 reflects the combination of catchment size and soil properties. For example, the TSS loads generated from grazing land range from 19 tonnes/year in the Nogoa (Fitzroy sub-catchment) to 835 tonnes/year in the Upper Burdekin (Burdekin sub-catchment). The tonnes/hectare/year generated from grazing land is also quite variable, ranging from 0.01 tonnes/hectare/year in the Nogoa, to nearly 0.6 tonnes/hectare/year in the Bowen Bogie (Figure 8). It should be noted that the loads presented for these management units represent loads generated from within the specific management unit only, and not those that necessarily contributed to the end-of-sub-catchment load. These load generation data account for sediment trapping from major dams within management units but cannot be directly compared with loads exported to the GBR lagoon. They should be used as a guide to the relative amounts of sediment generated in each management unit.
Terrestrial cosmogenic nuclide studies are a method of estimating natural background rates of erosion. Recent work in the Burdekin NRM region sub-catchments has further demonstrated the geographic variability in soil loss. This research (Croke et al. in review) has suggested that the Bowen (part of the Bowen Bogie management unit) and the Upper Burdekin and Suttor management units had high erosion rates prior to agricultural development (due to geology, slope and rainfall) and, with the introduction of agriculture, are delivering substantially more sediment. Croke et al. suggest that there is a much greater chance of reducing sediment yields delivered to the GBR if priority is given to investing in these areas.
Sugar cane industry contributions to anthropogenic loads The cane industry, which occupies 1.3 per cent of the area of the GBR catchments, contributes an estimated 6, 18 and 18 per cent of the average annual anthropogenic loads of TSS, PP and PN delivered to the GBR lagoon (Figure 5). It also contributes an estimated 56 per cent of the anthropogenic DIN load and 94 per cent of the herbicides (Figure 6). The largest DIN contributions from cane growing come from the Wet Tropics (50 per cent) and Burdekin (21 per cent) NRM regions. The Mackay Whitsunday and Burnett Mary regions contribute 16 and 12 per cent respectively. At the sub-catchment level, the largest contributors to total GBR DIN load from cane areas are the Johnstone (23 per cent), followed by the Haughton (14 per cent), the Herbert (10 per cent) and the Tully (8 per cent). At the sub-catchment level, the largest contributors to PSII load from cane areas are the Herbert (17 per cent), Johnstone (15 per cent), Mulgrave-Russell (11 per cent), Tully (11 per cent) and Haughton (9 per cent) sub-catchments.
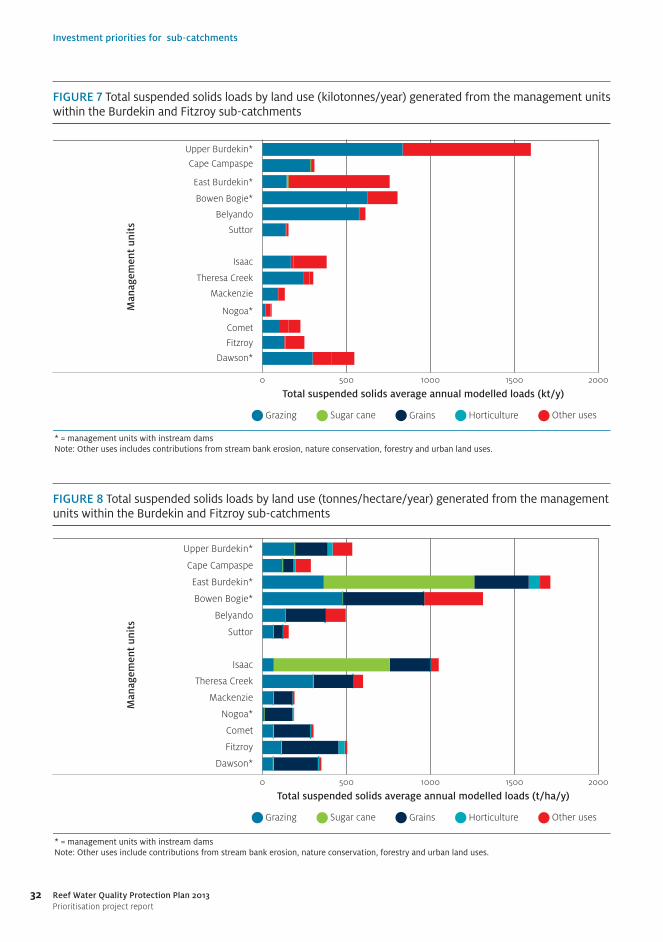
32
Investment priorities for sub-catchments
Reef Water Quality Protection Plan 2013Prioritisation project report
FIGURE 7 Total suspended solids loads by land use (kilotonnes/year) generated from the management units within the Burdekin and Fitzroy sub-catchments
Sugar caneGrazing Grains
0
Man
agem
ent
unit
s
Total suspended solids average annual modelled loads (kt/y)
* = management units with instream damsNote: Other uses includes contributions from stream bank erosion, nature conservation, forestry and urban land uses.
Dawson*
Fitzroy
Comet
Nogoa*
Mackenzie
Theresa Creek
Isaac
Suttor
Belyando
Bowen Bogie*
East Burdekin*
Cape Campaspe
Upper Burdekin*
500 1000 1500 2000
Other usesHorticulture
FIGURE 8 Total suspended solids loads by land use (tonnes/hectare/year) generated from the management units within the Burdekin and Fitzroy sub-catchments
Sugar caneGrazing Grains
0
Man
agem
ent
unit
s
Total suspended solids average annual modelled loads (t/ha/y)
* = management units with instream damsNote: Other uses include contributions from stream bank erosion, nature conservation, forestry and urban land uses.
Dawson*
Fitzroy
Comet
Nogoa*
Mackenzie
Theresa Creek
Isaac
Suttor
Belyando
Bowen Bogie*
East Burdekin*
Cape Campaspe
Upper Burdekin*
500 1000 1500 2000
Other usesHorticulture
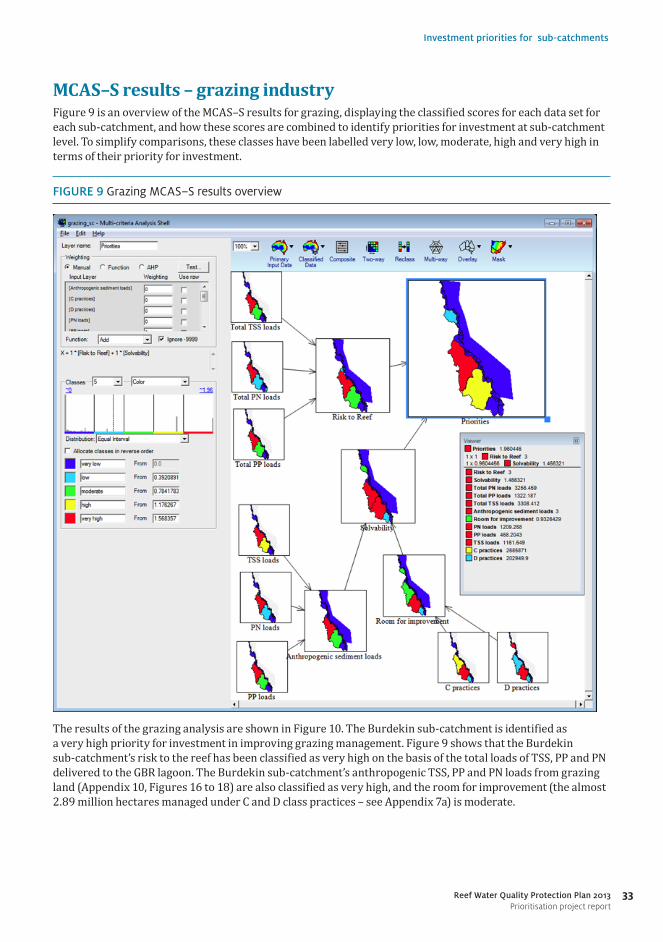
33
Investment priorities for sub-catchments
Reef Water Quality Protection Plan 2013Prioritisation project report
MCAS–S results – grazing industryFigure 9 is an overview of the MCAS–S results for grazing, displaying the classified scores for each data set for each sub-catchment, and how these scores are combined to identify priorities for investment at sub-catchment level. To simplify comparisons, these classes have been labelled very low, low, moderate, high and very high in terms of their priority for investment.
FIGURE 9 Grazing MCAS–S results overview
The results of the grazing analysis are shown in Figure 10. The Burdekin sub-catchment is identified as a very high priority for investment in improving grazing management. Figure 9 shows that the Burdekin sub-catchment’s risk to the reef has been classified as very high on the basis of the total loads of TSS, PP and PN delivered to the GBR lagoon. The Burdekin sub-catchment’s anthropogenic TSS, PP and PN loads from grazing land (Appendix 10, Figures 16 to 18) are also classified as very high, and the room for improvement (the almost 2.89 million hectares managed under C and D class practices – see Appendix 7a) is moderate.
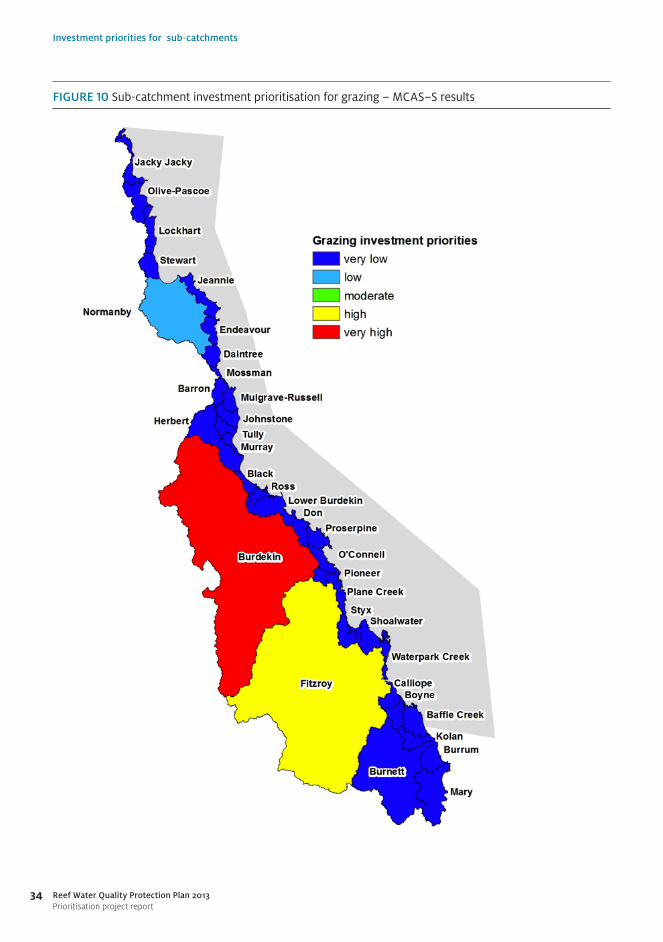
34
Investment priorities for sub-catchments
Reef Water Quality Protection Plan 2013Prioritisation project report
FIGURE 10 Sub-catchment investment prioritisation for grazing – MCAS–S results

35
Investment priorities for sub-catchments
Reef Water Quality Protection Plan 2013Prioritisation project report
Combining very high anthropogenic loads with moderate room for improvement has resulted in an assessment of very high solvability – that is, there are very high estimated anthropogenic loads coming from grazing land and there is a large area of grazing land – an estimated 22 per cent of the Burdekin sub-catchment – over which management practices could be improved to help reduce this load. Combining very high solvability with very high risk has identified the Burdekin sub-catchment as very high priority for investment in improving grazing management practices.
The Fitzroy sub-catchment’s total TSS, PP and PN loads present a moderate risk to the reef. Solvability is rated as very high on the basis of moderate anthropogenic sediment loads and very high room for improvement (a significant area of grazing is operated with C and/or D class practices). Combining moderate risks to the reef from sediment loads and very high solvability has identified the Fitzroy sub-catchment as a high priority for investment in improving grazing management practices. The remaining (principally coastal) sub-catchments are rated as very low priority for investment in improving grazing management practices; they all have very low scores for risk to the reef, anthropogenic sediment loads and room for improvement.
To summarise, the Burdekin and Fitzroy sub-catchments are rated as very high and high priority for investment in improving grazing management by virtue of their large area, very high total and anthropogenic loads and large scope for room for improvement (areas managed using C and D class practices).
MCAS–S results – sugar cane industry: nutrients The relative priorities between sub-catchments for reducing nutrient inputs from sugar cane are shown in Figure 11. The Johnstone sub-catchment is a very high priority for investment in improving nutrient management practices in the cane industry. Its score for risk to the reef from nutrients (total DIN loads plus COTS influence) is rated as very high. Estimated anthropogenic loads for DIN from cane lands are very high (Appendix 10, Figure 19). Scores for very high anthropogenic loads combined with high room for improvement in nutrient management (an estimated 26,580 hectares – see Appendix 7b – are managed using B, C or D nutrient management practices) produce a high nutrient solvability score. A combination of a high score for solvability and a very high anthropogenic loads score produces a very high priority score for investment in improving nutrient management.
The Burdekin (cane is mainly grown in the East Burdekin), Haughton, Herbert, Mulgrave-Russell and Tully sub-catchments are rated as high priority for investment. They have either very high risk to reef (a combination of estimated total DIN load and COTS influence) or very high solvability, a combination of estimated anthropogenic DIN loads and room for improvement. The Daintree is rated as moderate; it has a very high risk to the reef due to its COTS influence but is rated as very low for all other inputs.
Sub-catchments rated as low priority include the Barron, Fitzroy, Mary, O’Connell, Pioneer and Plane. Risk to the reef was rated as very low for most of these sub-catchments. The 23 remaining GBR sub-catchments were rated as very low priority for investment in improved nutrient management on cane lands. These include the Baffle, Black, Burnett, Burrum, Don, Kolan, Mossman, Murray and Proserpine sub-catchments, which had very low scores for the factors contributing to risk to reef and solvability (except for Burrum, where solvability was rated as low).
There is no sugar grown in the other 14 sub-catchments (see Appendix 4) which rated as very low priority for improving cane nutrient management. The sensitivity of the cane nutrients’ priorities results to the COTS influence (for the eight sub-catchments contributing to the COTS index) was tested by rerunning the MCAS–S analysis with the COTS data excluded. Priorities for the Wet Tropics sub-catchments, the Daintree and Mulgrave-Russell, changed significantly, while those for the Pioneer, Plane and Fitzroy increased from low to moderate (Table 4).

36
Investment priorities for sub-catchments
Reef Water Quality Protection Plan 2013Prioritisation project report
In the Burdekin sub-catchment, cane (approximately 5000 hectares – see Appendix 4) is mainly grown in the East Burdekin management unit (the Burdekin Irrigation Area). The Burdekin sub-catchment’s nutrient management priority is ranked as high in the MCAS–S analysis because of the very high risk to reef rating. This rating is very high because the total DIN loads (to which grazing makes a significant contribution) for the sub-catchment are large (see Figure 19, Appendix 10) and the COTS influence moderate. End-of-catchment load analysis at the management unit level might result in a lower priority for investment in improving cane nutrient management in the East Burdekin.
TABLE 4 Sensitivity of sub-catchment priorities for investing in improved nutrient management in sugar cane to the crown of thorns starfish influence index
Sub-catchment Priority rating with COTS influence index Priority rating without COTS influence index
Daintree Moderate Very low
Barron Low Very low
Mulgrave-Russell High Low
Tully High Moderate
Pioneer Low Moderate
Plane Low Moderate
Fitzroy Low Moderate
In the Fitzroy sub-catchment only a small area of cane (in the Isaac management unit – see Appendix 4) is grown. Improving nutrient management in the Isaac is rated as very low priority.
MCAS–S results – sugar cane industry: herbicidesThe relative priorities between sub-catchments for reducing herbicide inputs from sugar cane lands are shown in Figure 11. The Herbert, Pioneer and Plane sub-catchments have been rated as very high priority for improving herbicide management practices; these have high to very high scores for risk to the reef (estimated PSII concentrations) or for estimated PSII loads, plus high scores for room for improvement (the areas managed using C or D herbicide management practices in these three sub-catchments range from 25,650 to 59,300 hectares – see Appendix 7b). The Haughton is rated as a high priority for improving herbicide management. While this sub-catchment’s risk to the reef is rated as low, solvability (anthropogenic loads plus room for improvement) is very high.

37
Investment priorities for sub-catchments
Reef Water Quality Protection Plan 2013Prioritisation project report
FIG
UR
E 11
Sub
-cat
chm
ent i
nves
tmen
t prio
ritis
atio
n in
impr
ovin
g nu
trie
nt a
nd h
erbi
cide
man
agem
ent f
or s
ugar
can
e –
MC
AS–
S re
sults
adj
uste
d to
refle
ct
loca
tions
whe
re s
ugar
can
e is
gro
wn

38
Investment priorities for sub-catchments
Reef Water Quality Protection Plan 2013Prioritisation project report
The Johnstone and O’Connell catchments are rated as moderate priority; herbicide concentrations from the O’Connell present a moderate risk to the reef, although solvability is rated as very low; anthropogenic loads for the Johnstone are very high, resulting in a high solvability score.
Figure 12 shows the combined nutrient and herbicide MCAS–S results for sugar cane. Combining the priority scores for nutrients and herbicides results in very high priority for investment ratings for the Herbert and Johnstone; with the Mulgrave-Russell, Pioneer, Plane and Tully sub-catchments as high priority. Comparison of the nutrient and herbicide results at Figure 11 shows that only the Haughton, Herbert and the Johnstone are rated as moderate, high or very high priority for investment in both nutrient and herbicide management practice improvement. The Pioneer and Plane, rated as high priority in the combined assessment, have low ratings for nutrient investment; the Mulgrave-Russell and Tully are high priority for nutrients but low priority for herbicides.
Rankings for the Burdekin sub-catchment (moderate) and the Fitzroy sub-catchment (low) in the combined nutrient and herbicide results appear higher than they should be because the nutrient prioritisations incorporate very high (Burdekin sub-catchment) and high (Fitzroy sub-catchment) ratings for the total DIN loads, much of which is coming from grazing (Appendix 10, Figure 19). Compared with the Haughton for example, the number of growers and area of cane grown in the Burdekin and Fitzroy sub-catchments is quite small (Appendix 4).

39
Investment priorities for sub-catchments
Reef Water Quality Protection Plan 2013Prioritisation project report
FIGURE 12 Combined nutrient and herbicide sub-catchment investment prioritisation for sugar cane – MCAS–S results adjusted to reflect locations where sugar cane is grown
40
Investment priorities for sub-catchments
Reef Water Quality Protection Plan 2013Prioritisation project report
Grazing – relative investment priorities for sub-catchmentsGrazing priority rankings reflect the relative risk to the reef posed by estimated total TSS, PP and PN loads, the size of the estimated anthropogenic loads of TSS, PP and PN, the area grazed and the estimated area under C and D class practices (the extent of the area where practices could be improved). These rankings are largest for the Burdekin and Fitzroy, rated as very high and high priority respectively for investment in improving land management (Table 5). These sub-catchments drain very large areas; the Burdekin, followed by the Fitzroy, makes the largest contribution to annual average anthropogenic loads of TSS. Their dominant role in sediment export has been reported previously by Greiner et al. 2005, McKergow et al. 2005, Kroon et al. 2012 and the Scientific Consensus statement (State of Queensland 2013a).
Data on the loads per hectare per year of pollutants delivered to the GBR lagoon by sub-catchments were not included in the MCAS–S analyses but are briefly examined to see if sub-catchments identified as very high or high priority for investment in improved grazing management also deliver high loads per hectare of pollutants to the GBR lagoon. Estimated TSS loads per hectare from grazing land range from almost 0 in the Lockhart to 0.61 in the Johnstone sub-catchment, and are relatively low compared with loads per hectare from grains and horticulture (see Figure 16, Appendix 10). Grazing lands in most of the Wet Tropics sub-catchments, which are all rated as very low priority for investment in improving grazing practices, have TSS loads per hectare at the higher end of the range (more than 0.3 tonnes/hectare/year) as do several of the Mackay Whitsunday sub-catchments (O’Connell and Plane). The Burdekin and Fitzroy sub-catchments, identified as very high and high priority for investment in improved grazing management (Figure 10), deliver quite low TSS loads per hectare (0.1 and 0.07 tonnes respectively).
The modelled water quality loads by land use shown in Figure 7 indicate that there is substantial variability in erosion losses across the Burdekin and Fitzroy sub-catchments. Work by Croke et al. (in review) and the data in Figure 8 suggest that some management units within the Burdekin and Fitzroy sub-catchments may have substantially higher losses of sediment per hectare.
Locally available information should also be considered in allocating funds for improving grazing management practices. For example, Wilkinson et al. (2013a) has shown that sub-surface soils are the most likely sources of fine sediment in the Upper Burdekin and Bowen (part of the Bowen-Bogie management unit); this is probably derived from erosion of existing gully networks in proximity to rivers. Bartley et al. (2014) have noted that within the Burdekin sub-catchment the Bowen and the Upper and Lower Burdekin management units appear to be the dominant source of the fine silts and clays which are thought to pose the greatest risk to coral reefs. Within these sub-catchments, remotely sensed data showing areas of persistent low ground cover, gully density maps and soil maps showing the distribution of very fine-textured basaltic and sedimentary soils, which deliver a higher proportion of fine sediment per tonne lost to the reef (Bartley et al. 2014a), should be used to pinpoint locations for investment. By combining the sub-catchment-scale priority maps (e.g. Figure 10) with these high-resolution tools, users have highly prescriptive tools to address TSS concerns.

41
Investment priorities for sub-catchments
Reef Water Quality Protection Plan 2013Prioritisation project report
TABLE 5 Investment rankings for NRM region sub-catchments for sugar cane and grazing
NRM region Sub-catchment Area (ha) Cane nutrients Cane PSII Cane nutrients
and PSII Grazing
sediments
Cape York Jacky Jacky 292 976 NA NA NA VL
Olive-Pascoe 412 922 NA NA NA VL
Lockhart 284 735 NA NA NA VL
Stewart 277 234 NA NA NA VL
Normanby 2 439 585 NA NA NA L
Jeannie 362 236 NA NA NA VL
Endeavour 209 580 NA NA NA VL
4 279 268
Wet Tropics Daintree 210 656 M VL L VL
Mossman 47 887 VL VL VL VL
Barron 218 889 L VL VL VL
Mulgrave-Russell 197 882 H L H VL
Johnstone 232 607 VH M VH VL
Tully 168 527 H L H VL
Murray 111 544 VL L L VL
Herbert 984 200 H VH VH VL
2 172 192
Burdekin Black 112 780 VL VL VL VL
Ross 172 250 NA NA NA VL
Haughton 495 286 H H VH VL
Burdekin 12 830 249 L VL L VH
Don 335 607 VL VL VL VL
13 946 172
Mackay Whitsunday Proserpine 250 055 VL L L VL
O'Connell 233 211 L M M VL
Pioneer 168 382 L VH H VL
Plane 254 483 L VH H VL
906 131
Fitzroy Styx 301 454 NA NA NA VL
Shoalwater 360 807 NA NA NA VL
Waterpark 184 489 NA NA NA VL
Fitzroy 14 249 672 VL VL VL H
Calliope 224 386 NA NA NA VL
Boyne 250 154 NA NA NA VL
15 570 962
Burnett Mary Baffle 403 543 VL VL VL VL
Kolan 295 470 VL VL VL VL
Burnett 3 303 802 VL VL VL VL
Burrum 345 040 VL VL L VL
Mary 933 976 L VL L VL
Note: VL = very low, L = low, M = medium, H = high, VH = very high, NA = not applicable.
42
Investment priorities for sub-catchments
Reef Water Quality Protection Plan 2013Prioritisation project report
Sugar cane – relative investment priorities for sub-catchmentsSugar cane nutrient management priorities (Table 5) for sub-catchments generally reflect the relative risk to the reef posed by total DIN loads and herbicide concentrations, the size of the anthropogenic loads of DIN from sugar cane, the area of cane grown and the area under B, C and D class practices. The Burdekin sub-catchment is an exception; it is rated as high, largely on the basis of the large total DIN load (pre-development and anthropogenic loads from all sources, including a significant input from grazing) and COTS influence (Table 2). However, the anthropogenic DIN load from cane is scored as low in the MCAS–S analyses and the room for improvement is scored as very low, leading to a low solvability score. Within the Burdekin sub-catchment, only a comparatively small area of cane is grown, mostly in the East Burdekin (5000 hectares and about 30 cane farmers). It is recommended that the Burdekin sub-catchment nutrient management priorities be re-rated as low to reflect these factors, with overall cane investment priorities re-rated as low. Similarly, the Fitzroy sub-catchment, with a smaller area of cane (in Isaac) and 17 farmers, should be re-rated as very low for nutrient management priorities, resulting in an overall rating for cane and nutrient investment of very low.
Greiner et al. (2005) identified the Johnstone (here rated as very high priority for cane investment) and Plane (high priority) as having high ecological impact in their MCA comparison of GBR river basins (sub-catchments) due to their potential discharge of diffuse source pollutants into the GBR lagoon, the potential impact of that discharge and the ability to control discharge. The Mulgrave-Russell (high) and O’Connell (medium) were rated by Greiner et al. as having a high hazard to fishing and marine tourism on the basis of the likely economic impact of pollution.
The ranking of the relative risk of degraded marine water quality to the GBR coral reef and seagrass ecosystems between the GBR regions (Brodie et al. 2013b, see Appendix 2) was Wet Tropics (very high), Fitzroy (high), Burdekin (high), Mackay Whitsunday (moderate), Burnett Mary (uncertain), Cape York (low). Brodie et al. (2013b) identified The Wet Tropics region as the priority area for nitrogen management (on land used for sugar cane and bananas), Mackay Whitsunday and the Lower Burdekin (Haughton sub-catchment) for PSII management (on coastal cane lands). MCAS–S regional level results presented for this study (the cane nutrients and PSII data from Table 5) broadly suggest that investment priority rankings for the Wet Tropics (very high) and the Burnett Mary (very low) are similar to those from the marine study. In the MCAS–S analysis, Mackay Whitsunday is ranked ahead of the Fitzroy, largely due to the impact of the high rankings for herbicide concentrations for all four sub-catchments. In the marine risk assessment (Appendix 2) the nutrient-related variables of chlorophyll threshold exceedence and DIN plume loading were ranked highest in the Fitzroy region, contributing to its high relative marine risk.
Pollutant loads per hectare were not included in the sugar MCAS–S analysis, but are examined to see if sub-catchments rated as high priority for investment also had high loads per hectare. In the sugar cane industry anthropogenic DIN loads (kg/ha/y) range from a low of 0.17 in the Fitzroy to 24.19 kg/ha/y in the Johnstone (Figure 24, Appendix 11). The larger losses of DIN per hectare are mostly associated with sub-catchments rated as very high (Johnstone) or high (Tully, Haughton, Burdekin) priority for investment in improving nutrient management. The Baffle, Mary and Mossman sub-catchments were rated as very low priority for investment in sugar cane nutrient management improvement, but had higher losses per hectare than the Burdekin and Haughton. A two-way analysis of the MCAS–S data identified only the Johnstone sub-catchment as having both very high loads and very high loads per hectare of DIN from cane lands.
Herbicide loads (kilograms/hectare/year) from cane lands ranged from 0 in the Fitzroy (the percentage area of this sub-catchment under sugar is very small) to 0.085 kg/hectare/year in the Tully (Figure 25, Appendix 11). Larger losses per hectare were associated with sub-catchments in the Wet Tropics (except the Barron); most except the Herbert (very high) and Johnstone (moderate) were rated as low to very low priority for investment. The Pioneer, Plane and Haughton, rated as very high priority for investment in herbicide management (due to very high or high herbicide concentrations or very high anthropogenic loads, combined with very high or high room for improvement), tended to have lower herbicide losses per hectare (Figure 25, Appendix 11). The higher rainfall in the Wet Tropics sub-catchments is a likely factor driving the high losses per hectare. A two-way analysis of the MCAS–S data scored only the Johnstone sub-catchment as having both very high loads and very high loads per hectare of herbicides.
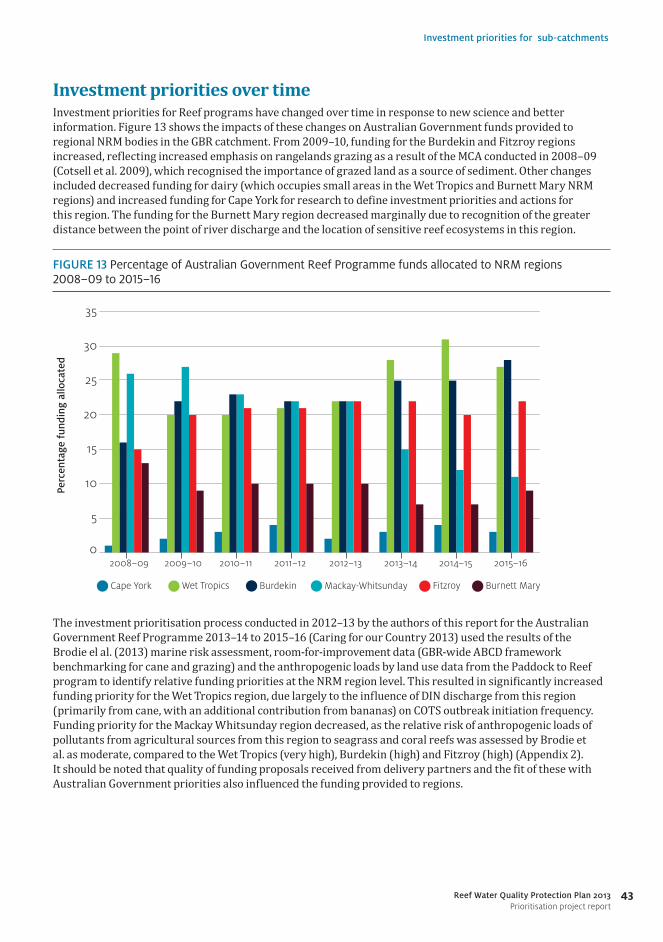
43
Investment priorities for sub-catchments
Reef Water Quality Protection Plan 2013Prioritisation project report
Investment priorities over timeInvestment priorities for Reef programs have changed over time in response to new science and better information. Figure 13 shows the impacts of these changes on Australian Government funds provided to regional NRM bodies in the GBR catchment. From 2009–10, funding for the Burdekin and Fitzroy regions increased, reflecting increased emphasis on rangelands grazing as a result of the MCA conducted in 2008–09 (Cotsell et al. 2009), which recognised the importance of grazed land as a source of sediment. Other changes included decreased funding for dairy (which occupies small areas in the Wet Tropics and Burnett Mary NRM regions) and increased funding for Cape York for research to define investment priorities and actions for this region. The funding for the Burnett Mary region decreased marginally due to recognition of the greater distance between the point of river discharge and the location of sensitive reef ecosystems in this region.
FIGURE 13 Percentage of Australian Government Reef Programme funds allocated to NRM regions 2008–09 to 2015–16
Wet Tropics Cape York Burdekin
Perc
enta
ge f
undi
ng a
lloca
ted
Fitzroy Burnett MaryMackay-Whitsunday
0
5
10
15
20
25
30
35
2015–162014–152013–142012–132011–122010–112009–102008–09
The investment prioritisation process conducted in 2012–13 by the authors of this report for the Australian Government Reef Programme 2013–14 to 2015–16 (Caring for our Country 2013) used the results of the Brodie el al. (2013) marine risk assessment, room-for-improvement data (GBR-wide ABCD framework benchmarking for cane and grazing) and the anthropogenic loads by land use data from the Paddock to Reef program to identify relative funding priorities at the NRM region level. This resulted in significantly increased funding priority for the Wet Tropics region, due largely to the influence of DIN discharge from this region (primarily from cane, with an additional contribution from bananas) on COTS outbreak initiation frequency. Funding priority for the Mackay Whitsunday region decreased, as the relative risk of anthropogenic loads of pollutants from agricultural sources from this region to seagrass and coral reefs was assessed by Brodie et al. as moderate, compared to the Wet Tropics (very high), Burdekin (high) and Fitzroy (high) (Appendix 2). It should be noted that quality of funding proposals received from delivery partners and the fit of these with Australian Government priorities also influenced the funding provided to regions.
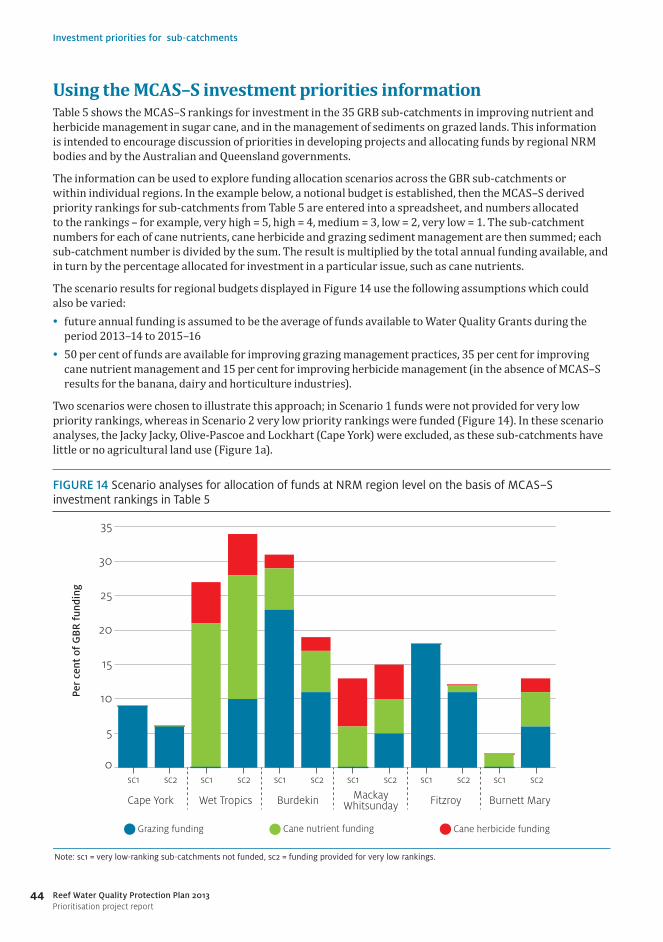
44
Investment priorities for sub-catchments
Reef Water Quality Protection Plan 2013Prioritisation project report
Using the MCAS–S investment priorities informationTable 5 shows the MCAS–S rankings for investment in the 35 GRB sub-catchments in improving nutrient and herbicide management in sugar cane, and in the management of sediments on grazed lands. This information is intended to encourage discussion of priorities in developing projects and allocating funds by regional NRM bodies and by the Australian and Queensland governments.
The information can be used to explore funding allocation scenarios across the GBR sub-catchments or within individual regions. In the example below, a notional budget is established, then the MCAS–S derived priority rankings for sub-catchments from Table 5 are entered into a spreadsheet, and numbers allocated to the rankings – for example, very high = 5, high = 4, medium = 3, low = 2, very low = 1. The sub-catchment numbers for each of cane nutrients, cane herbicide and grazing sediment management are then summed; each sub-catchment number is divided by the sum. The result is multiplied by the total annual funding available, and in turn by the percentage allocated for investment in a particular issue, such as cane nutrients.
The scenario results for regional budgets displayed in Figure 14 use the following assumptions which could also be varied:• future annual funding is assumed to be the average of funds available to Water Quality Grants during the
period 2013–14 to 2015–16• 50 per cent of funds are available for improving grazing management practices, 35 per cent for improving
cane nutrient management and 15 per cent for improving herbicide management (in the absence of MCAS–S results for the banana, dairy and horticulture industries).
Two scenarios were chosen to illustrate this approach; in Scenario 1 funds were not provided for very low priority rankings, whereas in Scenario 2 very low priority rankings were funded (Figure 14). In these scenario analyses, the Jacky Jacky, Olive-Pascoe and Lockhart (Cape York) were excluded, as these sub-catchments have little or no agricultural land use (Figure 1a).
FIGURE 14 Scenario analyses for allocation of funds at NRM region level on the basis of MCAS–S investment rankings in Table 5
Cane nutrient fundingGrazing funding Cane herbicide funding
Per
cent
of
GB
R f
undi
ng
0
5
10
15
20
25
30
35
Note: sc1 = very low-ranking sub-catchments not funded, sc2 = funding provided for very low rankings.
sc2sc1sc2sc1sc2sc1sc2sc1sc2sc1sc2sc1
Burnett MaryFitzroyMackayWhitsundayBurdekinWet TropicsCape York

45
Investment priorities for sub-catchments
Reef Water Quality Protection Plan 2013Prioritisation project report
Figure 14 shows the impact of removing funding for the very low priority rankings. Under this scenario no funds are allocated to Wet Tropics, Mackay Whitsunday or Burnett Mary for grazing improvements, and no funding is provided to the Burnett Mary for herbicide management improvement. It should be noted that the Fitzroy NRM region currently receives no funding for improving the management of cane nutrients or herbicides; the number of cane farmers and the area under cane in this region (in the Isaacs sub-catchment) is quite small (see Appendix 4).
Figure 15 shows the potential impact of these scenarios on regional NRM funding compared with the average of funds provided in 2013–14 to 2015–16. Changes in funding under scenario 1 (where very low priorities are not funded) range from a decrease of 5.8 per cent for Burnett Mary to an increase of 5.6 per cent more than the average for Cape York. For scenario 2, changes range from a decrease of 9.2 per cent for Fitzroy, to an increase of 5.5 per cent for Wet Tropics.
For Cape York there is an increase in funding under both scenarios. Under scenario 1 funds for grazing improvements are only allocated to the Normanby, which was ranked third for grazing investment in Table 5. In scenario 2 some funds are also allocated to the Jeannie and Endeavour sub-catchments. For Wet Tropics there is little difference between average funding 2013–14 to 2015–16 and scenario 1 results. In scenario 2, allocation of funds to the 13 Wet Tropics sub-catchments rated as very low priority for grazing, cane nutrients or herbicide investment increases Wet Tropics funding by about 5.5 per cent.
FIGURE 15 Comparison of the scenario analyses with the average funds received by regions from the Australian Government Reef Programme 2013–14 to 2015–16
Scenario 1 (VL not funded)Average funding 2013-14 to 2015-16 Scenario 2 (VL funded)
Per
cent
of
GB
R f
undi
ng
0
5
10
15
20
25
30
35
Burnett MaryFitzroyMackay WhitsundayBurdekinWet TropicsCape York
In the Burdekin, scenario 1 results in an increase in funding of 4.5 per cent, receiving a higher proportion of the funds available for grazing investment. In scenario 2, funds (compared with the average 2013–14 to 2015–16 allocation) decrease by about 6.2 per cent as funds are spread across sub-catchments ranked as very low priority for funding. In the Mackay Whitsunday region there is little difference between the average 2013–14 to 2015–16 allocation and scenario 1 results; scenario 2 increases funds by 2.4 per cent when resources are allocated to five very low priority sub-catchments.
46
Investment priorities for sub-catchments
Reef Water Quality Protection Plan 2013Prioritisation project report
In the Fitzroy NRM region all sub-catchments are ranked as very low priority for funding, except the Fitzroy sub-catchment (see Table 5), which is high priority for grazing investment. Funding for this region decreases under scenario 1 (by 3.4 per cent), where only the Fitzroy sub-catchment is funded for grazing improvement, and in scenario 2 (by 9.2 per cent). In scenario 2 a small amount of funding is allocated for improvements in cane management (Figure 2) as the very small area of cane in the Fitzroy sub-catchment, which is encompassed by the Mackay Whitsunday cane program, had not been excluded prior to the analysis; but funding for grazing is reduced, as this is shared across many more mostly very low priority sub-catchments. For the Burnett Mary, scenario 1 results in a reduced (by 5.8 per cent) allocation, with funding to be focused on cane nutrients in the Mary sub-catchment (Figure 2). In scenario 2 funds increase by 4.7 per cent as resources are allocated to other sub-catchments ranked as very low priority for grazing, cane nutrient and herbicide management improvements.
Summary of key points• Land used for agriculture occupies about 82 per cent of the GBR catchment. Land used for cropping, dairy,
grazing, horticulture (including bananas) and sugar cane, contributes an estimated 55, 69 and 66 per cent to the estimated anthropogenic loads of TSS, PN and PP, plus an estimated 87 per cent of the anthropogenic DIN and 100 per cent of the PSII delivered to the GBR lagoon.
• Grazing (75 per cent of the area of the GBR catchment) contributes an estimated 45, 43 and 45 per cent to the estimated anthropogenic loads of TSS, PN and PP and an estimated 21 per cent of the DIN load. Grazing is likely to be a major contributor to the anthropogenic loads of TSS, PN and PP coming from stream bank erosion (which cannot be attributed to a particular land use). Stream bank erosion contributes an estimated; 39, 28 and 21 per cent of the of TSS, PN and PP loads respectively.
• The Burdekin and Fitzroy sub-catchments are rated as very high and high priority for investment in improving grazing management by virtue of their large area, very high total and anthropogenic loads and large room for improvement (areas managed using C and D class practices). Research suggests that some management units within these sub-catchments may deliver disproportionately larger amounts of sediment to the lagoon; this information could be used to improve prioritisation within these sub-catchments.
• Land used for sugar cane (1.3 per cent of the GBR catchment) contributes an estimated 56 and 94 per cent to the estimated anthropogenic loads of DIN and PSII delivered to the GBR lagoon.
• The Johnstone sub-catchment is a very high priority for investment in improving nutrient management practices to reduce DIN loads. The Burdekin (cane is mainly grown in the East Burdekin), Haughton, Herbert, Mulgrave-Russell and Tully sub-catchments are rated as high priority; the Daintree is rated as moderate priority for investment.
• The Herbert, Pioneer and Plane sub-catchments have been rated as very high priority for investing in improving herbicide management practices; the Haughton is rated as a high priority and the Johnstone and O’Connell catchments are rated as moderate priority for investment.
47Reef Water Quality Protection Plan 2013Prioritisation project report
Chapter 4
Future improvements
The catchments flowing to the GBR lagoon and its associated marine ecosystems are part of a dynamic, complex and interconnected system. Much of the research, monitoring and modelling being undertaken to improve the quality of water delivered to the lagoon from land used for agriculture is at the leading edge of such activities. Water quality science is continually improving and, as understanding changes, the Reef Water Quality Protection Plan activities will be refined to take this into account.
This MCAS–S analysis has been undertaken to provide policy makers, industry and NRM regions with information to improve the allocation of resources to achieve maximum pollutant reductions with the limited resources available. The sub-catchments within NRM regions, industries and pollutants have been identified where the likely biggest returns on investment in improving management practices for better water quality outcomes could be expected on the basis of currently available information and the most recent research.
In the following sections, further opportunities for improving returns on investment through the Water Quality Grants and other programs aiming to improve the quality of runoff from agricultural land are outlined. These include:• improving land management practices for better water quality outcomes • better methods for monitoring, modelling and reporting land management practice change• improvements to Source catchments modelling for the Paddock to Reef program• research to improve understanding of catchment-based processes affecting GBR water quality.
Improving land management practices for better water quality outcomes
Opportunities in the grazing industryThe 2013 Scientific Consensus Statement (State of Queensland 2013a) noted that water quality modelling indicates that early adopters of best practice land management have reduced pollutant loads, making a significant step towards the goal of halting and reversing the decline in the quality of the water delivered to the reef. Continuous improvement in management practices plus transformational changes in some farming technologies may be necessary to reach some targets.
With 45 per cent of the annual average anthropogenic sediment load, plus a significant component of the stream bank erosion load delivered to the GBR coming from grazing land, future load reductions depend on the capacity of pastoralists to improve management practices. However, in 2009 the Northern Beef industry (which includes Queensland pastoral areas draining to the reef) was reported to be in its worst state since the 1970s and generally unprofitable and unsustainable (McCosker et al. 2010). These results are consistent with QDAFF financial benchmarking projects in the Fitzroy and Burdekin in 2006–10, and the production aspects were supported by QDAFF surveys for the Reef Plan in 2011–13. Anecdotal information suggests that, although grazing management workshops are quite well attended, most participants do not have the resources to implement the management changes needed to reduce soil loss through hillslope, gully and stream bank erosion.
48
Future improvements
Reef Water Quality Protection Plan 2013Prioritisation project report
‘The extremely poor performance of the extensive breeder herd is an alarming contributor to poor business performance’ (McCosker et al. 2010). Herd management skills seem to be closely linked with environmental outcomes. Breeder performance (conception rates, weaning rates etc.) is just as important for environmental performance as it is for business profit; good breeder productivity contributes to increased profitability, enabling more conservative stocking rates. Reducing stocking rates over parts of properties (in turn) will enable ground cover to improve and potentially allow for the return of some perennial species, as well as reduce soil losses. O’Reagain et al. (2011) have demonstrated that sustainable management with lower stocking rates can be profitable in climatically variable environments.
It is recommended that the Reef Plan Water Quality Risk Framework for Grazing be revised to recognise the important role that herd management improvements play in improving profitability and providing opportunities for reductions in stocking rates, with better outcomes for water quality, soil condition and long-term sustainability. This revision should be underpinned by a review which examines how a staged framework for property investment that supports pastoralists improving herd management and infrastructure to reduce stocking rates while improving ground cover management and pasture productivity could be developed. The review should also identify further research needs and how best to communicate the longer term strategies that need to be adopted step wise by graziers to improve profitability and longer term sustainability.
Stream bank erosion across the GBR catchment is estimated to contribute 39 per cent of TSS loads and 28 and 21 per cent of PP and PN respectively delivered to the reef (Figure 5). A significant component of these loads will come from grazed lands, which occupy 75 per cent of the GBR catchments. Stream bank erosion is included in the ‘Other uses’ category shown in Appendices 10 and 11 (Figures 16–25) because it cannot be attributed to specific land uses in the current Source catchments modelling. Water quality improvements arising from investments in stream bank fencing and revegetation have not been modelled as the data were not available at the time of writing this report. Therefore it is difficult to assess the impact of practices used to date. However, given the size of the stream bank contribution to loads, it is recommended that further work is undertaken to identify how and where to direct investment to reduce these loads in the most cost effective manner.
Subsoil erosion (including gullying) is now known to be a very significant source of the sediment delivered to the GBR (Croke et al. 2009, Tims et al. 2010, Hancock et al. 2013, Olley et al. 2013 and Wilkinson et al. 2013a). Effective gully management includes reducing grazing pressure to increase levels of ground cover in vulnerable eroding parts of the landscape and to reduce runoff volumes from these areas. Targeted remediation works in unstable gullies, and other erosion features can also assist reducing sediment yield (Thorburn and Wilkinson 2013).
Informal check dams constructed from fallen timber and positioned in the base of existing gully networks have been used in the Burdekin and Normanby sub-catchments. Results from the Burdekin showed that a combination of check dams and grazing management in adjacent paddocks gave a large reduction in sediment leaving the gullies in the second year following treatment (Wilkinson and Thorburn 2013b). These check dams need to be placed in locations with stable (non-incising) bed levels; disturbance of sodic subsoils needs to be avoided. They have been shown to be an effective way to trap this fine sediment on the gully bed, reduce gully sediment yield, and initiate revegetation of the gully bed, provided they are appropriately sized to the runoff volumes. Production of local gully control manuals to encourage adoption of this approach should be considered, together with access to technically competent support to ensure that works provide optimal benefits.
Opportunities in the sugar cane industryScenario analyses (modelling) have been undertaken to assess the feasibility of meeting the Reef Plan 2009 water quality targets, a minimum 50 per cent reduction in nitrogen, phosphorus and herbicide loads at the end of catchments by 2013 and a minimum 20 per cent reduction in total suspended sediment (TSS) loads at the end of catchments by 2020 (Waters et al. 2013). These estimates suggest that the 20 per cent TSS reduction target can be achieved with a 50/50 adoption of A and B class practices across all cane and grazing land. For DIN, the modelling suggests that the 50 per cent target may not be met by the complete adoption of A class nutrient management practices.
49
Future improvements
Reef Water Quality Protection Plan 2013Prioritisation project report
The 2013 Scientific Consensus Statement (State of Queensland 2013a) noted that the universal adoption of B class practices is unlikely to meet water quality improvement targets for fine sediments, total nitrogen or total phosphorus, but may for PSII herbicides. Management of agricultural lands will need to move beyond current industry accepted practices to more ‘aspirational’ practices to meet water quality targets. A revised Paddock to Reef Water Quality Risk Framework has been developed for the sugar cane industry, and is being used to respond to these concerns (Kevin McCosker, Queensland Department of Agriculture, Fisheries and Forestry, pers. comm.). The new framework includes weightings to identify the practices which will deliver the largest improvements in water quality.
The Scientific Consensus Statement (State of Queensland 2013a) noted that nitrogen surpluses (the difference between nitrogen inputs and nitrogen in crop offtake) are high in many intensively managed crops, and that loads could be reduced by reducing inputs. Current cane industry nutrient recommendations aim to supply nutrients to meet the district yield potential, which is defined as 120 per cent of the estimated highest annual average district yield. These recommendations result in the majority of fields being over-fertilised to ensure that the minority are not nutrient limited. Alternative management systems have been identified (Thorburn et al. 2011), but further work will be needed to help growers improve fertiliser use efficiency. Discussions are being held with researchers and industry to identify the additional work needed to support improved nitrogen use efficiency whilst maintaining profitability and productivity.
Good progress has been made in reducing annual average PSII loads, principally in the sugar cane industry. Paddock to Reef water quality modelling estimates indicate that 70 per cent of modelled load reduction is due to management improvements in the Wet Tropics and Mackay Whitsunday regions (Waters et al. 2013). These regions encompass a number of the sub-catchments rated as high priority for investment in improved herbicide management in this study (Table 5). Existing A and B class herbicide and soil management practices for sugar cane (Appendix 6) are contributing to this load reduction.
These include controlled traffic and banded application (particularly in combination) which has been shown to give significant reductions in herbicide runoff under simulated storm rainfall, especially for furrow irrigated cane (Silburn et al. 2013). Oliver et al. (2014) found that banded application of diuron and atrazine using a shielded sprayer onto raised beds decreased the average total load of both herbicides moving off-site by 90 per cent compared with the conventional broadcast treatment in a furrow irrigated farming system. Further reductions may also be expected with regulatory changes; for example, the Australian Herbicides and Veterinary Medicines Authority has recently (November 2013) amended the usage of the PSII herbicide diuron in the Wet Tropics to reduce the maximum applicable annual volume applied by 75 per cent. However, a wide range of new and emerging herbicides are being used in cropping systems, and there is a need to expand monitoring to incorporate these and to better understand their behaviour and fate.
Better methods for reporting, monitoring and modelling land management practice changeThe 2012 review of the Paddock to Reef program (Chinn and Gongora, unpublished) noted the need to improve the management practice adoption component of the program. Changes which would improve confidence in the modelled load reductions, enable tracking of change at investment sites over time and ensure that the most cost effective investments are chosen include: • reporting of the spatial locations of investments (property-level GIS data)• quality checking of the data set by regional bodies• monitoring of individual practices rather than system change • reporting on practice change for all industries funded• reporting on the costs of practice change in a way that they can be meaningfully compared across regions.
Currently most regional NRM bodies do not provide land management practice change information as spatially explicit shape files that enable modellers to locate the area of change. A tool is used to ‘accumulate’ the outputs from each of the model land management practices into a single time-series. This is done at a sub-catchment
50
Future improvements
Reef Water Quality Protection Plan 2013Prioritisation project report
scale by weighting, based on the proportion of the sub-catchment represented by each ABCD management practice class. This avoids the need to make assumptions around the spatial distribution of the management practices, and instead assumes an even distribution across the climate/soil/sub-catchment (Carroll et al. 2012).
The result is sub-optimal reporting of investment benefits and an inability to report ongoing change (and the cumulative impact of those investments) over time for investment sites. The provision of higher spatial resolution data will enable all regional modelling outputs to be of similar resolution and more useful for regional and sub-regional prioritisation processes. In the future, project data will include spatial information for each investment for collation in the same database. This will provide greater accuracy in modelling of water quality outcomes, and assist with the targeting of further investments to specific localities according to room for improvement.
For Reef Rescue, the land management practice change outputs provided to modellers were metrics representing system changes that tried to approximate the likely impact of changed management on land condition, runoff and soil loss. Recently revised Water Quality Risk Assessment Frameworks for grazing and sugar cane will enable estimation and modelling of future load reductions for individual practice changes, which should greatly improve the rigour of estimates around the impact of practice change investments. It will also significantly reduce inter-regional differences due to variations in ABCD class management practice frameworks.
Current modelling of sub-catchment reductions in pollutant loads is based on the assumption that practice changes have been implemented by landholders who have received funding for this purpose through Reef Rescue 2007–09 to 2013–14 and/or extension services provided by the Queensland Government, regional NRM bodies or private sector consultants. To improve confidence in the modelled reductions related to grants for equipment or farm infrastructure, it is recommended that a follow-up audit of a proportion of land holder grant recipients is undertaken. Further targeted evaluation should be incorporated in the design phase of extension programs and projects, utilising the Paddock to Reef Water Quality Risk Frameworks. It is also recommended that multiple lines of evidence for practice change (such as annual fertiliser sales) be collated and published.
While the sugar cane and grazing industries were identified as major priorities for future investment (Caring for our Country 2013), nutrient management in banana crops was also a high priority (for the Wet Tropics), as were management actions to reduce sediment, nitrogen and herbicide loads from broadacre cropping in the Fitzroy. Surveys of cropping management practices in the Fitzroy region (Barson 2013) indicate that there is room for improvement in cultivation techniques, crop residue retention and soil nutrient testing that reduce sediment and nitrogen loads. Collection of data on management practice change for the GBR’s broadacre cropping areas is needed to track investment outcomes and model water improvements due to practice change in this industry. A paddock based model and a management practice framework are being developed to report on water quality improvements due to practice change in the banana industry.
The cost of implementing practice change should be an important consideration in any prioritisation process. The limited information available on costs of pollutant abatement indicated substantial variation between industries and pollutants and was considered not suitable for incorporation in the current MCAS–S analysis. There is a need to further explore how water quality targets can be achieved at least-cost (Roebeling et al. 2009).
The following cost estimates (Kevin Gale, Department of Environment, pers. comm.) are for ongoing annual average load reductions based on two years of Reef Rescue investments and the results of the Reef Plan Second Report Card (2010):• For grazing, the cost of sediment reduction averaged $137 per tonne, with most reduction and most cost
effective reduction achieved in large projects in the extensive grazing areas of the Burdekin, Cape York and Fitzroy regions. The total investment was $13.75 million for 100 kilotonnes/year ongoing sediment reduction at end of catchments.
• For sugar cane, the cost of DIN reduction averaged $38,500 per tonne across all regions (nominally allocating 70 per cent of cane funding against DIN reduction). Total investment was $16.8 million for 434 tonnes/year ongoing DIN reduction at end of catchments.
• For herbicide reduction in sugar cane, the cost averaged $3,844 per kilogram of active constituent across all regions (nominally allocating 20 per cent of cane funding against herbicide reduction). The total investment was $4.8 million for 1254 kilograms/year ongoing reduction at the end of catchments.
51
Future improvements
Reef Water Quality Protection Plan 2013Prioritisation project report
• For sediment reduction in sugar cane, the cost averaged $125 per tonne across all regions (nominally allocating 10 per cent of cane funding against sediment reduction). The total investment was $2.37 million for 19 kilotonnes/year ongoing reduction at the end of catchments. Most of the reduction occurred in the rain-fed cane production systems of the Wet Tropics and Mackay Whitsunday regions. It should be noted that many of the herbicide and nutrient management projects implemented by the sugar cane industry would also have reduced sediment losses.
As noted in Chapter 2, the very large differences between regions in abatement costs are thought to be influenced by differences between regions in how changes were estimated and reported in addition to differences in farming systems. Additional factors influencing regional differences in abatement costs include the extent to which investments were targeted spatially to reduce pollutant loads and the competitiveness of the regional funding process. It will be important for future investment evaluation to ensure that consistent measurement and reporting approaches are adopted and included in future discussion of priorities.
Improving Source catchments modelling outputs
Refining the spatial scale of the reporting unit for water quality modelling resultsWhile the main land use in the Burdekin and Fitzroy sub-catchments is grazing (92 and 80 per cent of their areas respectively), it is clear from the water quality modelling results showing loads generated from grazing land (Figure 7) that erosion losses vary substantially across these NRM regions. Research has also identified significant differences in rates of erosion, sources of erosion (hillslope, gully and stream bank) and in the likely impact on the reef of finer sediments derived from specific sub-catchments (Bartley et al. 2014a). Regional NRM bodies have asked for modelled water quality results to be made available for spatial units smaller than sub-catchments. The catchment modelling operates at a very detailed scale (5150 spatial units are modelled across the GBR catchment). The models use verification data from 25 water quality monitoring stations in 14 sub-catchments (TSS and nutrients), 14 sites in 14 priority sub-catchments for herbicides, and 201 river gauging stations recording water flows. There is a trade-off between the reliability and spatial scale of the modelled water quality outputs. Further investigation and discussion with regional NRM bodies is recommended to optimise the spatial scale of water quality reporting, especially for the Burdekin and Fitzroy sub-catchments.
Improving data on the sources of sediment lossRecent research has led to substantial improvements in understanding the likely sources of sediment eroded from GBR catchments; subsoil sources, especially gullies, are thought to be contributing a much larger component. As noted by Chinn and Gongora (unpublished) the availability of better data for rock cover (a component of ground cover), and information from sediment tracer studies identifying the relative proportions of sediment delivered from hillslope, gully and stream bank erosion will enable improved modelling of sediment losses. Reef Rescue efforts have focused on improving ground cover management on grazed lands to reduce TSS loads. Ground cover management will continue to be a major component of good grazing management, as ground cover management is a component of managing these sub-surface sources. Increased ground cover (and an increase in the proportion of deep rooted native perennial grasses) has a major role in reducing the runoff that is fuelling gully and stream bank erosion, as well as protecting hillslopes (Bartley et al. 2014b).
Having up-to-date spatial layers of the spatial location and rate of change of gully and stream bank erosion processes will enable the models to better reflect the relative importance of gullies, hillslopes and stream banks in delivering sediments for each sub-catchment. This will improve the allocation of funds between erosion control activities and lead to improved water quality outcomes for the GBR.
52
Future improvements
Reef Water Quality Protection Plan 2013Prioritisation project report
Improving the estimates of sediment delivered to the GBR lagoon The use of models such as Source catchments requires a number of assumptions to be made about the processes underway in catchments and how these are influenced by human activities and climate. Recent research using sediment tracing and dating techniques has indicated that predicted anthropogenic end-of-GBR catchment loads delivered to the GBR lagoon could be overestimated, as more sediment may be stored in floodplains and in channel benches than currently accounted for in modelling.
Results of sediment tracing studies in Theresa Creek, a catchment within the Fitzroy River basin, suggest that the high rates of sediment storage in channel benches may mean that catchment disturbance related increases in erosion (due to agricultural land use post European settlement) may not have translated to commensurately large increases in catchment sediment yields (Hughes et al. 2010). Further work is required to quantify the role of sediment sinks in the downstream low-lying parts of the Fitzroy River basin and other large dry-tropical catchments that drain to the GBR.
Thompson et al. (2011) have shown (in the Nogoa, part of the Fitzroy basin) that topographic features such as floodplain constrictions and tributary junctions can reduce catchment connectivity and the transfer of sediment, which is subsequently stored on floodplains rather than transported to the coast. More than 46 such major valley constriction sites have been reported for the Fitzroy (Amos et al. 2008). Information on the spatial location of these constrictions across the GBR sub-catchments and the rate of deposition and re-entrainment of these sediments could be collected from digital elevation models to provide information about sediment storage at nodes.
Improving ground cover dataGround cover (the percentage of the soil surface covered by plant matter and other biological crusts and rock) data derived from satellite remote sensing is a fundamental input to Source catchments modelling, and for reporting on the Reef Plan’s ground cover catchment target for grazed lands. Ground cover data are used in the catchment modelling to represent the effect of cover on soil erosion rates, and hence sediment loss into streams.
Recent advances in ground cover monitoring from remote sensing have increased the spatial and temporal resolution of the data available for catchment modelling. Fractional cover data are now used to represent the green and non-green ground cover components as well as the bare ground. This information will improve estimates of cover and runoff relationships. The combination of freely available Landsat and MODIS satellite data has also significantly improved the temporal resolution of the ground cover data; monthly and seasonal data could be used to capture the inter- and intra-annual dynamics of ground cover. This will enable ground cover changes to be represented more accurately in the catchment models, and it is also improving the information available for pastoral land management decision making.
Advances have also been made in estimating ground cover in areas of the GBR catchment with significant tree cover (tree cover tends to obscure ground cover monitoring by satellites). These advances have the potential to significantly increase the extent of the monitoring and reporting area for the GBR ground cover target (to more than 90 per cent of the GBR catchment area) and to improve modelling of ground cover and runoff relationships in these areas. Some field checking is still needed to ensure the reliability of ground cover estimates for these tree covered areas. Validation of modelled water quality against measured water quality will be needed where cover factor adjustments have been made based on the improved ground cover data. It may be necessary to develop adjustment factors for different levels and types of cover, and for different land types or regions. This should include experiments to validate ground cover estimates under trees and the impacts this cover has on runoff and erosion.

53
Future improvements
Reef Water Quality Protection Plan 2013Prioritisation project report
Research to improve understanding of catchment-based processes affecting GBR water quality
Bioavailability of PN In the last five years a substantial proportion of funding from Reef Rescue Water Quality Grants has been used to improve nitrogen management practices to reduce DIN loads from cane lands. Comparing modelled average annual modelled anthropogenic DIN and PN loads from all land uses suggests that PN loads are about 30 per cent higher than DIN loads. Dissolved inorganic and particulate forms of nutrients discharged into the GBR are both important in driving ecological effects (Furnas et al. 2013b). Dissolved inorganic forms of nitrogen (and phosphorus) are considered to be of greatest concern compared with dissolved organic and particulate forms of nutrients, as they are immediately and completely bioavailable for algal growth. However, most PN and PP (eroded principally from grazed lands) is mineralised from fine sediment following delivery to the GBR and could be readily available for uptake in marine systems (Brodie et al. 2013b). A review recently funded by the Australian Government Reef Programme is expected to provide a better understanding of PN dynamics and the time to bioavailability. This understanding could lead to a change in priorities for funding.
Establishing the sources of anthropogenic DIN from grazed land Water quality modelling results indicate that 66 per cent of the anthropogenic DIN delivered to the GBR is associated with sugar cane (56 per cent), dryland cropping (3 per cent) and irrigated cropping (1 per cent) or horticulture, including bananas (4 per cent) or other horticultural land uses (2 per cent). Grazing is estimated to contribute 21 per cent to the overall GBR anthropogenic DIN load, predominantly from the Burdekin and Fitzroy sub-catchments wvw. The processes and sources of the DIN coming from grazed lands, or how amenable this might be to management, are not understood.
Research needed to support further land management practice changeThe 2013 Scientific Consensus Statement notes the need for transformational changes in some farming technologies to reach some targets (State of Queensland 2013a). For the grazing industry, opportunities for delivering on Reef Plan 2013 targets would be strengthened by a better understanding of the water quality effectiveness and costs of specific grazing practices (i.e. the public and private benefit associated with investments), including riparian grazing management, reducing grazing pressure on gullied lands, and gully remediation approaches that could be applied cost effectively over large areas.
The commercial feasibility of the lowest water quality risk nutrient management practices identified in the draft Paddock to Reef water quality Risk Framework for sugar cane have yet to be proven. Field trials are needed to support widespread adoption of the cane nitrogen budgeting practices, which are based on yield expectations for specific blocks and ratoon numbers (a ratoon crop is the new cane which grows from the stubble after harvesting), and for yield zones within blocks. Ideally this issue would be addressed along with other site-based constraints, such as waterlogging and soil sodicity, to improving profitability and productivity for the sugar industry. The Australian Government Reef Programme has recently funded a compilation of sugar cane nutrient use field trial results; this review will identify further work needed to support the adoption of nutrient practices that pose the lowest risk to water quality.
Attributing risk to the reef to sub-catchmentsThe Brodie et al. (2013b) study (see Appendix 2) identified the relative risk to the GBR’s marine assets such as seagrasses and coral reefs from the quality of the water (TSS, DIN and PSII loads) delivered from the six NRM regions in the GBR catchment. The results of this project informed regional funding levels for 2013. A marine risk assessment conducted to define the zones of influence for each of the GBR’s 35 sub-catchments would provide better information on the risk to the reef posed by each sub-catchment and replace the total loads data currently used to represent threats in future MCAS–S assessments. With further outputs from the eReefs hydrodynamic model and recent improvements in remote sensing capability (e.g. Devlin et al. 2012), it would be possible to define zones of influence for each sub-catchment and conduct the risk assessment on those assessment units.
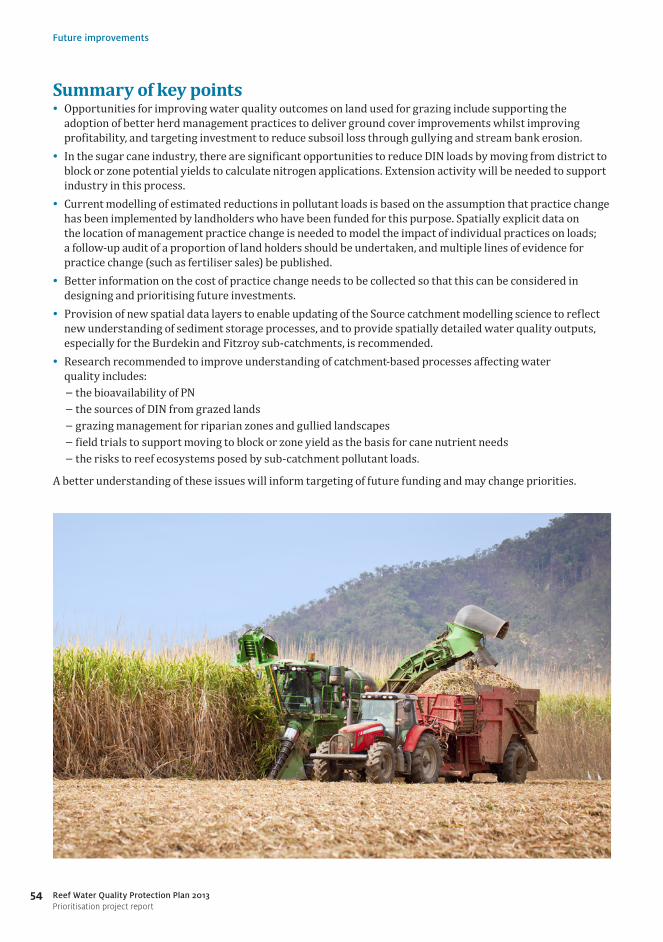
54
Future improvements
Reef Water Quality Protection Plan 2013Prioritisation project report
Summary of key points • Opportunities for improving water quality outcomes on land used for grazing include supporting the
adoption of better herd management practices to deliver ground cover improvements whilst improving profitability, and targeting investment to reduce subsoil loss through gullying and stream bank erosion.
• In the sugar cane industry, there are significant opportunities to reduce DIN loads by moving from district to block or zone potential yields to calculate nitrogen applications. Extension activity will be needed to support industry in this process.
• Current modelling of estimated reductions in pollutant loads is based on the assumption that practice change has been implemented by landholders who have been funded for this purpose. Spatially explicit data on the location of management practice change is needed to model the impact of individual practices on loads; a follow-up audit of a proportion of land holders should be undertaken, and multiple lines of evidence for practice change (such as fertiliser sales) be published.
• Better information on the cost of practice change needs to be collected so that this can be considered in designing and prioritising future investments.
• Provision of new spatial data layers to enable updating of the Source catchment modelling science to reflect new understanding of sediment storage processes, and to provide spatially detailed water quality outputs, especially for the Burdekin and Fitzroy sub-catchments, is recommended.
• Research recommended to improve understanding of catchment-based processes affecting water quality includes:
ሲ the bioavailability of PN ሲ the sources of DIN from grazed lands ሲ grazing management for riparian zones and gullied landscapes ሲ field trials to support moving to block or zone yield as the basis for cane nutrient needs ሲ the risks to reef ecosystems posed by sub-catchment pollutant loads.
A better understanding of these issues will inform targeting of future funding and may change priorities.
55Reef Water Quality Protection Plan 2013Prioritisation project report
Chapter 5
Conclusions Using the information on priorities Developing a targeted approach to reducing pollutant loads, particularly by targeting water quality improvement to the highest risk pollutants to the highest risk regions, is one of the guiding principles of the 2013 Reef Water Quality Protection Plan (State of Queensland 2013b). The results of the MCAS–S analysis provide structured, transparent information to inform discussion of future investment priorities for the cane and grazing industries in the GBR sub-catchments. Sub-catchments have been ranked for investment in improving land management practices by considering the risk presented to reef water quality, and the potential for each industry to reduce the anthropogenic loads delivered from sub-catchments to the reef lagoon by improving management practices.
Table 5 provides a guide to where, on the basis of the best currently available information, investments in improving practices in the sugar cane and grazing industries could be expected to give the biggest water quality improvements. In the Wet Tropics NRM region this is in improving the management of nutrients in the Johnston, Mulgrave-Russell, Tully, Herbert and Daintree, and in improving herbicide management in the Herbert and Johnstone sub-catchments. In the Burdekin NRM region, investments in improved cane nutrient and herbicide management are expected to give the biggest returns in the Haughton sub-catchment. In the Mackay Whitsunday NRM region, investment in improving cane herbicide management practices is likely to deliver the biggest water quality improvements.
For the grazing industry, the biggest returns on investment in practices reducing sediment loss will come from the Burdekin and Fitzroy sub-catchments in the Burdekin and Fitzroy regions respectively. Data on the anthropogenic loads delivered to the GBR lagoon from smaller units such as management units (so this could be compared with the loads delivered to the lagoon from other sub-catchments) were not available to inform this study. Information on erosion rates and sources of sediment from studies such as Bartley et al. (2014), Turner et al. (2013) and Wilkinson et al. (2013a and b), plus gully mapping, could be added to the MCA spreadsheets provided to the Burdekin and Fitzroy NRM regions to help identify which management units might deliver the biggest reductions in sediment loads for the available investment. For an example of this approach, see Wilkinson et al. (2014).
It is recommended that government agencies, NRM regional bodies, rural research and development organisations and industry bodies use the priority rankings in this report to inform discussion of future investment arrangements. Opportunities to do this include:• Refining annual regional priorities for on-ground funding. GBR NRM regions have received Australian
Government Reef Programme funding for three financial years, from 2013–14.• Developing and updating Water Quality Improvement Plans; plans are currently being prepared for
Cape York, the Wet Tropics, the Burdekin, Mackay Whitsunday and Burnett Mary.• Improving the targeting and delivery of extension through the Queensland Government funded cane and
grazing best management practice programs.• Future funding under the Reef Trust (see environment.gov.au/reef-trust).
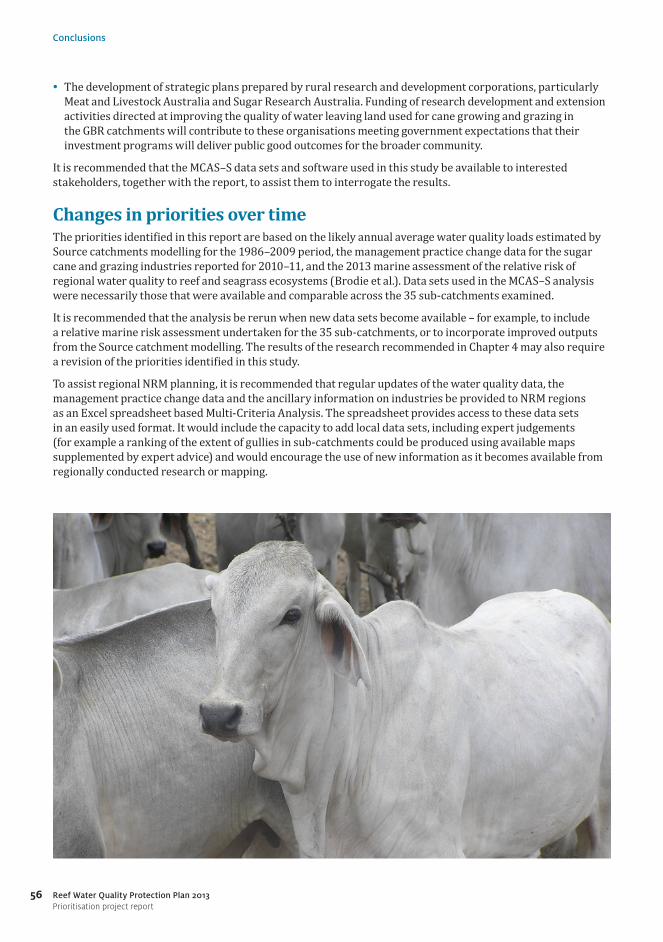
56
Conclusions
Reef Water Quality Protection Plan 2013Prioritisation project report
• The development of strategic plans prepared by rural research and development corporations, particularly Meat and Livestock Australia and Sugar Research Australia. Funding of research development and extension activities directed at improving the quality of water leaving land used for cane growing and grazing in the GBR catchments will contribute to these organisations meeting government expectations that their investment programs will deliver public good outcomes for the broader community.
It is recommended that the MCAS–S data sets and software used in this study be available to interested stakeholders, together with the report, to assist them to interrogate the results.
Changes in priorities over timeThe priorities identified in this report are based on the likely annual average water quality loads estimated by Source catchments modelling for the 1986–2009 period, the management practice change data for the sugar cane and grazing industries reported for 2010–11, and the 2013 marine assessment of the relative risk of regional water quality to reef and seagrass ecosystems (Brodie et al.). Data sets used in the MCAS–S analysis were necessarily those that were available and comparable across the 35 sub-catchments examined.
It is recommended that the analysis be rerun when new data sets become available – for example, to include a relative marine risk assessment undertaken for the 35 sub-catchments, or to incorporate improved outputs from the Source catchment modelling. The results of the research recommended in Chapter 4 may also require a revision of the priorities identified in this study.
To assist regional NRM planning, it is recommended that regular updates of the water quality data, the management practice change data and the ancillary information on industries be provided to NRM regions as an Excel spreadsheet based Multi-Criteria Analysis. The spreadsheet provides access to these data sets in an easily used format. It would include the capacity to add local data sets, including expert judgements (for example a ranking of the extent of gullies in sub-catchments could be produced using available maps supplemented by expert advice) and would encourage the use of new information as it becomes available from regionally conducted research or mapping.

57Reef Water Quality Protection Plan 2013Prioritisation project report
References
ABARE–BRS (2010) Indicators of community vulnerability and adaptive capacity across the Murray-Darling Basin – a focus on irrigation in agriculture. ABARE–BRS Client Report for Murray Darling Basin Authority, Canberra.
ABARES (2011) Multi-criteria Analysis Shell for Spatial Decision Support (MCAS–S) User Guide. Australian Bureau of Agricultural and Resource Economics and Sciences, Canberra. http://adl.brs.gov.au/data/warehouse/mcas3o9abl_031/mcas3o9abl_03111a00ap14_______/MCAS–SUserGuide2011_1.0.0.pdf
Amos, K.J., Croke, J.C., Hughes, A.O., Chapman, J., Takken, I. and Lymburner, L. (2008) A catchment-scale assessment of anabranching in the 143 000 km2 Fitzroy River catchment, north-eastern Australia. Earth Surface Processes and Landforms 33, 1222–1241.
Australian Government (2014) Reef Achievements 2008–2013. http://www.environment.gov.au/marine/publications/australian-government-reef-achievements-2008-2013
Bartley, R., Wilkinson, S.N., Hawdon, A.A., Abbott, B.N. and Post, D.A (2010) Impacts of improved grazing land management on sediment yields. Part 2: Catchment response. Journal of Hydrology 389, 249–259.
Bartley, R., Bainbridge, Z., Lewis, S., Kroon, F.J., Wilkinson, S.N., Brodie, J.E. and Silburn, D.M. (2014a) Relating sediment impacts on coral reefs to watershed sources, processes and management: A review. Science of the Total Environment 468–469 (2014) 1138–1153.
Bartley, R., Corfield, J.P., Hawdon, A.A., Kinsey-Henderson, A.E., Abbott, B.N., Scott N. Wilkinson, S., N. and Keen, R.J. (2014b) Can changes to pasture management reduce runoff and sediment loss to the Great Barrier Reef? The results of a 10-year study in the Burdekin catchment, Australia. The Rangeland Journal. http://dx.doi.org/10.1071/RJ13013
Barson, M. (2013) Land management practice trends in Queensland’s broadacre cropping industries. Caring for our Country Sustainable Practices fact sheet 18, Department of Agriculture, Fisheries and Forestry, Canberra. daff.gov.au/__data/assets/pdf_file/0007/2278294/qld-practices-broadacre.pdf
Brooks, A., Spencer, J., Olley, J., Pietsch, T., Borombovits, D., Curwen, G., Shelleberg, J., Howley, C., Gleeson, A., Simon, A., Bankhead, A., Klimetz, D., Eslami-Endargoli, L. and Boureault, A. (2013) Sediment sources, sinks and drivers in the Normanby Basin: an empirically-based sediment budget for the Cape York savannah. Griffith University.
Brodie, J., Binney, J., Fabricius, K., Gordon, I., Hoegh-Guldberg, O., Hunter, H., O’Reagain, P., Pearson, R., Quirk, M., Thorburn, P., Waterhouse, J., Webster, I. and Wilkinson, S. (2008) Scientific consensus statement on water quality in the Great Barrier Reef. A Reef Plan publication. Department of the Premier and Cabinet, Queensland, Brisbane.
Brodie, J.E., Kroon, F.J., Schaffelke B., Wolanski, E.C., Lewis, S.E., Devlin M.J., Bohnet, I.C., Bainbridge Z.T., Waterhouse, J. and Davis A.M. (2012) Terrestrial pollutant runoff to the Great Barrier Reef: An update of issues, priorities and management responses. Marine Pollution Bulletin 65, 81–100.
58
References
Reef Water Quality Protection Plan 2013Prioritisation project report
Brodie, J., Waterhouse, J., Schaffelke, B., Johnson, J.E., Kroon, F., Thorburn, P., Rolfe, J., Lewis, S., Warne, M.St.J., Fabricius, K., McKenzie, L. and Devlin, M. ( 2013a) 2013 Scientific Consensus Statement. Land use impacts on Great Barrier Reef water quality and ecosystem condition. Department of the Premier and Cabinet, Queensland, Brisbane.
Brodie, J., Waterhouse, J., Maynard, J., Bennett, J., Furnas, M., Devlin, M., Lewis, S., Collier, C., Schaffelke, B., Fabricius, K., Petus, C., da Silva, E., Zeh, D., Randall, L., Brando, V., McKenzie, L., O’Brien, D., Smith, R., Warne, M.St.J., Brinkman, R., Tonin, H., Bainbridge, Z., Bartley, R., Negri, A., Turner, R.D.R., Davis, A., Bentley, C., Mueller, J., Alvarez-Romero, J.G., Henry, N., Waters, D., Yorkston, H. and Tracey, D. (2013b) Assessment of the relative risk of water quality to ecosystems of the Great Barrier Reef. A report to the Department of the Environment and Heritage Protection, Queensland Government, Brisbane. TropWATER Report 13/28, Townsville.
Bureau of Rural Sciences (2010) Multiple criteria analysis to inform investments in reef water quality. Draft final report to the Reef Rescue Taskforce, Australian Government Land and Coasts Division. Bureau of Rural Sciences, 30 June.
Caring for our Country (2013) Reef Rescue water quality grants and partnerships priorities for further action 2013–14 to 2015–16 – Summary of outcomes. nrm.gov.au/funding/reef-rescue/pubs/reef-rescue-priorities.pdf
Carroll, C., Waters, D., Vardy, S., Silburn, D.M., Attard, S., Thorburn, P., Davis, A.M., Halpin, N., Schmidt, M., Wilson, B. and Clark, A. (2012) A paddock to reef monitoring and modelling framework for the Great Barrier Reef: paddock and catchment component. Marine Pollution Bulletin. Special issue: Catchments to reef continuum: Case studies from the Great Barrier Reef, Vol. 65, Issues 4–9, pp 136–149.
Chinn, C. and Gongora, M. (unpublished) Paddock to reef integrated monitoring, modelling and reporting program. Summary report on the findings of the program review. July 2013.
Cotsell, P., Gale, K., Hajkowicz, S., Lesslie, R., Marshall, N., and Randall, L. (2009) Use of a multiple criteria analysis (MCA) process to inform Reef Rescue allocations. Paper presented to the 2009 MTSRF Annual Conference.
Croke, J., Bartley, R., Chappell, J., Thompson, C.J., Fifield, K., Times, S. and Austin, J. (in review) Quantifying spatially averaged long-term erosion rates in the Burdekin watershed using terrestrial cosmogenic nuclides. Earth and Planetary Science Letters.
De’ath, G. and Fabricius, K., (2010) Water quality as a regional driver of coral biodiversity and macroalgae on the Great Barrier Reef. Ecol. Appl. 20, 840–850.
De’ath, G., Fabricius, K.E., Sweatman, H. and Puotinen, M. (2012) The 27-year decline of coral cover on the Great Barrier Reef and its causes. Proceedings of the National Academy of Sciences of the United States of America, 109 (44), 17734–17735. pnas.org/cgi/doi/10.1073/pnas.1208909109.
Devlin, M.J., McKinna, L.W., Alvarez-Romero, J.G., Petus, C., Abbott, B., Harkness, P. and Brodie, J. (2012) Mapping the pollutants in surface riverine flood plume waters in the Great Barrier Reef, Australia. Marine Pollution Bulletin 65, 224–235.
Drewry, J., Higham, W. and Mitchell, C., (2008) Water quality improvement plan: Final report for Mackay Whitsunday region. Mackay Whitsunday Natural Resource Management Group. nrm.com.au/index.php?p=1_12
East, I.J., Wicks, R.M., Martin P.A.J., Sergeant, E.S.G., Randall, L.A. and Garner, M.G. (2013) Use of a multi-criteria analysis framework to inform the design of risk based general surveillance systems for animal disease in Australia. Preventive Veterinary Medicine 112, 230–247. http://dx.doi.org/10.1016/j.prevetmed.2013.09.012
eWater Cooperative Research Centre (2010) Source catchments user guide. eWater Cooperative Research Centre, Canberra.
Fabricius K., Okaji, K. and De’ath, G. 2010 Three lines of evidence to link outbreaks of the crown-of-thorns seastar Acanthaster planci to the release of larval food limitation. Coral Reefs 29(3) 593–605.

59
References
Reef Water Quality Protection Plan 2013Prioritisation project report
Flores F., Collier C.J., Mercurio P. and Negri, A.P. (2013) Phytotoxicity of four photosystem II herbicides to tropical seagrasses. PLoS ONE 8(9), e75798. doi:10.1371/journal.pone.0075798
Furnas, M., Brinkman, R., Fabricius, K., Tonin, H. and Schaffelke, B. (2013a) Linkages between river runoff, phytoplankton blooms and primary outbreaks of crown-of-thorns starfish in the Northern GBR. Chapter 1 in Assessment of the relative risk of water quality to ecosystems of the Great Barrier Reef: Supporting studies. Report to Department of the Environment and Heritage Protection, Queensland Government, Brisbane. TropWATER Report 13/30, Townsville.
Furnas, M., O’Brien, D. and Warne, M. (2013b) The Redfield Ratio and potential nutrient limitation of phytoplankton in the Great Barrier Reef. Chapter 2 in Assessment of the relative risk of water quality to ecosystems of the Great Barrier Reef: Supporting studies. Report to Department of the Environment and Heritage Protection, Queensland Government, Brisbane. TropWATER Report 13/30, Townsville.
Greiner, R., Herr, A., Brodie, J., and Haynes, D. (2005) A multi-criteria approach to Great Barrier Reef catchment (Queensland, Australia) diffuse-source pollution problem. Marine Pollution Bulletin 51 (1), pp. 128–137.
Hajkowicz, S.A. and McDonald, G.T. (2006) The threats, assets and solvability (ATS) model for setting environmental priorities. Journal of Environmental Policy and Planning 8 (1), 87–102.
Hajkowicz, S.A., (2007) Allocating scarce financial resources across regions for environmental management in Queensland, Australia. Ecological Economics 61, 92–3, 208–216.
Hancock, G.J., Wilkinson, S.N., Hawdon, A.A. and Keen, R.J. (2013). Use of fallout tracers 7Be, 210Pb and 137Cs to distinguish the form of sub-surface soil erosion delivering sediment to rivers in large catchments. Hydrological Processes, 10.1002/hyp.9926.
Hill, M.J. and Olson, R. (2013) Possible future trade-offs between agriculture, energy production, and biodiversity conservation in North Dakota, Regional Environmental Change 13, 311–328.
Hughes, A.O., Olley, J.M., Croke, J. C. and McKergow, L.M. (2009) Sediment source changes over the last 250 years in a dry-tropical catchment, central Queensland, Australia. Geomorphology 104, 262–275.
Hughes, A.O., Croke, J.C., Pietsch, T.J. and Olley, J.M. (2010) Changes in the rates of floodplain and in-channel bench accretion in response to catchment disturbance, central Queensland, Australia. Geomorphology 114, 338–347.
Kennedy, K., Schroeder, T., Shaw, M., Haynes, D., Lewis, S., Bentley, C., Paxman, C., Carter, S., Brando, V.E., Bartkow, M., Hearn, L. and Mueller, J.F. (2012) Long term monitoring of photosystem II herbicides – Correlation with remotely sensed freshwater extent to monitor changes in the quality of water entering the Great Barrier Reef, Australia. Marine Pollution Bulletin 65 (2012) 292–305.
Kroon, F.J. (2008) Draft Tully water quality improvement plan. CSIRO: Water for a Healthy Country National Research Flagship.
Kroon, F.J., Kuhnert, P.M., Henderson, B.L., Wilkinson, S.N., Kinsey-Henderson, A., Abbott, B., Brodie, J.E. and Turner, R.D.R. (2012) River loads of suspended solids, nitrogen, phosphorus and herbicides delivered to the Great Barrier Reef lagoon, Marine Pollution Bulletin 65, 167–181.
Kroon, F., Turner, R., Smith, R., Warne, M., Hunter, H., Bartley, R., Wilkinson, S., Lewis, S., Waters, D. and Carroll, C. (2013) 2013 Scientific Consensus Statement. Chapter 4: Sources of sediment, nutrients, pesticides and other pollutants in the Great Barrier Reef catchment. Department of the Premier and Cabinet, State of Queensland, Brisbane.
Lewis, S.J., Bainbridge, Z. and Brodie, J. (2008) Water quality monitoring of the Black Ross Basins: 2007/08 wet season. ACTFR Report No08/04 for the Black Ross Water Quality Improvement Plan, ACTFR James Cook University.

60
References
Reef Water Quality Protection Plan 2013Prioritisation project report
Lewis, S.J., Smith, R., Brodie, J.E., Bainbridge, Z.T., Davis, A.M. and Turner, R. (2011) Using monitoring data to model herbicides exported to the Great Barrier Reef, Australia. In Chan, F., Marinova, D. and Anderssen, R.S. (eds) MODSIM 2011. 19th International Congress on Modelling and Simulation. Modelling and Simulation Society of Australia and New Zealand. December 2011, pp.2051–2056. mssanz.org.au/modsim2011/E5/lewis.pdf
McCosker, T., McLean D., and P. Holmes (2010) Northern beef situation analysis 2009. Final report B.NBP.0518, Meat & Livestock Australia Limited.
McKeon, G.M., Ash, A., Hall, W.B. and Stafford Smith, M. (2000) Simulation of grazing strategies for beef production in north-east Queensland. In Applications of seasonal climate forecasting in agricultural and natural ecosystems – the Australian experience. (eds G.L. Hammer, N. Nicholls and C. Mitchell), pp. 227–252. Kluwer Academic, the Netherlands.
McKergow, L.A., Prosser, I.P., Hughes, A.O. and Brodie, J. (2005) Sources of sediment to the Great Barrier Reef World Heritage Area. Marine Pollution Bulletin 51, 200–211.
Oliver D.P., Anderson, J.S., Davis, A., Lewis, S., Brodie, J. and Kookana, R. (2014) Banded applications are highly effective in minimising herbicide migration from furrow-irrigated sugar cane. Science of The Total Environment 466–467, 841–848.
Olley, J., Brooks, A., Spencer, J., Pietsch, T. and Borombovits, D. (2013) Subsoil erosion dominates the supply of fine sediment to rivers draining into Princess Charlotte Bay, Australia. Journal of Environmental Radioactivity, 124(0), 121–129.
O’Reagain, P., Bushell, J., and B. Holmes (2011) Managing for rainfall variability: long term profitability of different grazing strategies in a northern Australian tropical savanna. Animal Production Science 51 (3), 210–224.
Rattray, D.J., Freebairn, D.M., McClymont, D., Silburn, D.M., Owens, J. and Robinson, B. (2004) HOWLEAKY? The journey to demystifying ‘simple’ technology. Paper 422. In Raine, S.R., Biggs, A.J.W., Menzies, N.W., Freebairn, D.M. and Tolmie, P.E. (eds), ISCO 2004 Conserving Soil and Water for Society: Sharing Solutions, 13th International Soil Conservation Organisation Conference, Brisbane, July 2004 (ASSSI/IECA: Brisbane).
Renard, K.G., Foster, G.A., Weesies, G.A. and McCool, D.K. (1997) Predicting soil erosion by water: A guide to conservation planning with the Revised Universal Soil Loss Equation (RUSLE). Agriculture Handbook No. 703, USDA, Washington, DC.
Roebeling, P.C., van Grieken, M.E., Webster A.J., Biggs, J. and P. Thorburn (2009) Cost-effective water quality improvement in linked terrestrial and marine ecosystems: a spatial environmental–economic modelling approach. Marine and Freshwater Research, 2009, 60, 1150–1158.
Rolfe, J., Wake, J., Higham, W., Windle, J. and Trendell, P. (2008) Best management practice adoption in the sugar industry for improving water quality: the Mackay Whitsunday region. For Consortium for Integrated Resource Management.
Schaffelke, B., Anthony, K., Blake, J., Brodie, J., Collier, C., Devlin, M., Fabricius, K., Martin, K., McKenzie, L., Negri, A., Ronan, M., Thompson, A. and Warne, M. (2013) Chapter 1, Marine and coastal ecosystem impacts. 2013 Scientific Consensus Statement. Land use impacts on Great Barrier Reef water quality and ecosystem condition. Department of the Premier and Cabinet, State of Queensland, Brisbane. reefplan.qld.gov.au/about/scientific-consensus-statement/ecosystem-impacts.aspx
Shaw, M., Silburn, D., Ellis, R., Searle, R., Biggs, J., Thorburn, P. and Whish, G. (2013). Paddock scale modelling to assess effectiveness of agricultural management practice in improving water quality in the Great Barrier Reef Catchments. In Piantadosi, J., Anderssen, R.S. and Boland J. (eds) MODSIM2013, 20th International Congress on Modelling and Simulation. Modelling and Simulation Society of Australia and New Zealand, December 2013, pp. 3190–3196. www.mssanz.org.au/modsim2013/L21/shaw.pdf.
Silburn, D.M., Foley, J.L. and R.C. deVoil (2013) Managing runoff of herbicides under rainfall and furrow irrigation with wheel traffic and banded spraying. Agriculture, Ecosystems & Environment 180, 40–53.
61
References
Reef Water Quality Protection Plan 2013Prioritisation project report
Smith, R., Middlebrook, R., Turner, R., Huggins, R., Vardy, S. and Warne, M.St.J. (2012) Large-scale pesticide monitoring across Great barrier Reef catchments – Paddock to Reef Integrated Monitoring Modelling and Reporting Program. Marine Pollution Bulletin 65, 117–127.
Star, M., Rolfe, J., Donaghy, P., Beutel, T., Whish, G. and Abbott, B. (2013) Targeting resource investments to achieve sediment reduction and improved Great Barrier Reef health. Agriculture, Ecosystems and Environment 180, 148–156.
State of Queensland (2013a) Scientific consensus statement: Land use impacts on Great Barrier Reef water quality and ecosystem condition. Reef Water Quality Protection Plan Secretariat, July.
State of Queensland (2013b) Reef Water Quality Protection Plan 2013: Securing the health and resilience of the Great Barrier Reef World Heritage Area and adjacent catchments. Reef water Quality Protection Plan Secretariat, July. reefplan.qld.gov.au/resources/assets/reef-plan-2013.pdf
State of Queensland (2013c) Great Barrier Reef Report Card 2011. Reef Water Quality Protection Plan Secretariat, July.
State of Queensland (2012) Great Barrier Reef Second Report Card 2010. Reef Water Quality Protection Plan Secretariat, December.
State of Queensland (2009) Reef Water Quality Protection Plan: For catchments adjacent to the Great Barrier Reef World Heritage Area. Queensland Department of Premier and Cabinet, Reef Water Quality Protection Plan Secretariat, September.
State of Queensland and Commonwealth of Australia (2003) Reef Water Quality Protection Plan: For catchments adjacent to the Great Barrier Reef World Heritage Area. Queensland Department of Premier and Cabinet, October.
Thompson, C.J., Croke, J.C. and Purvis-Smith, D. (2011) Floodplain sediment disconnectivity at a tributary junction and valley constriction site in the Fitzroy River basin, Queensland, Australia. Geomorphology 125, 293–304.
Thorburn, P.J., Webster, A.J., Biggs, I.M., Biggs, J.S., Park, S.E. and Spillman, M.F. (2007) Towards innovative management of nitrogen fertiliser for a sustainable sugar industry. Proceedings of the Australian Society of Sugar Cane Technologists 29, 85–96.
Thorburn, P.J., Webster, A.J., Biggs, J.S. and Biggs, I.M. (2011) Meeting global environmental challenges of sugar cane production through an innovative nitrogen fertiliser management system. Plant Soil 339, 51–67.
Thorburn, P.J. and Wilkinson, S.N. (2013) Conceptual frameworks for estimating the water quality benefits of improved land management practices in large catchments. Agric. Ecosyst. Environ. 180, 192–209. http://dx.doi.org/10.1016/j.agee.2011.12.021
Tims, S.G., Everett, S.E., Fifield, L.K., Hancock, G.J. and Bartley, R. (2010) Plutonium as a tracer of soil and sediment movement in the Herbert River, Australia. Nuclear Instruments and Methods in Physics Research Section B: Beam Interactions with Materials and Atoms, 268 (7–8), 1150–1154.
Turner, R., Huggins, R., Wallace, R., Smith, R., Vardy, S. and Warne, M.St.J. (2013) Loads of sediment, nutrients and pesticides discharged from high priority Queensland rivers in 2010–2011. Great Barrier Reef Catchment Loads Monitoring Program, Department of Science, Information Technology, Innovation and the Arts, Brisbane.
Waters, D. and Carroll, C. (2013) Modelling of catchment pollutant load reductions due to improved management practices in the Great Barrier Reef. Tier 2 technical report. Department of Natural Resources and Mines, State of Queensland.
Waters, D., Carroll, C., Ellis, R., McCloskey, G., Hateley, L., Packett, R., Dougall, C. and Fentie, B. (2013) Catchment modelling scenarios to inform GBR water quality targets. In Piantadosi, J., Anderssen, R.S. and Boland J. (eds) MODSIM2013, 20th International Congress on Modelling and Simulation. Modelling and Simulation Society of Australia and New Zealand, December, pp. 3204–3210. mssanz.org.au/modsim2013/L21/waters.pdf

62
References
Reef Water Quality Protection Plan 2013Prioritisation project report
Wilkinson, S.N., Hancock, G.J., Bartley, B., Hawdon, A.A. and Keen, R.J. (2013a) Using sediment tracing to assess processes and spatial patterns of erosion in grazed rangelands, Burdekin River basin, Australia. Agriculture Ecosystems & Environment 180, 90–102. http://dx.doi.org/10.1016/j.agee.2012.02.002
Wilkinson, S.N., Kinsey-Henderson, A.E., Hawdon, A.A., Ellis, T.W. and Nicholas, D.M. (2013b) Gully erosion and its response to grazing practices in the Upper Burdekin catchment. CSIRO Water for a Healthy Country.
Wilkinson, S.N., Bastin, G., Stokes, C.J., Hawdon, A.A, Chewings, V.H., Kinsey-Henderson, A.E., Nicholas, D.M., Abbott, B., McKellar, K. and Kemei, J. (2014) Improving grazing management practices to enhance ground cover and reduce sediment loads. Appendix 4: Priorities for reducing sediment loss from GBR grazing lands. Report to the Reef Rescue Water Quality Research and Development Program. Reef and Rainforest Research Centre Limited, Cairns.

63Reef Water Quality Protection Plan 2013Prioritisation project report
Appendices
APPENDIX 1 Working Group on Reef Rescue 2 Prioritisation project – membership
Dr Michele Barson Department of Agriculture
Dr Jon Brodie James Cook University
Dr Chris Carroll, Mr Dave Waters Queensland Department of Natural Resources and Mines
Mr Colin Creighton Reef and Rainforest Research Centre
Dr Kevin Gale Department of Environment
Dr Peter Hairsine CSIRO Land and Water
Dr Rob Lesslie, Dr Lucy Randall ABARES, Department of Agriculture
Mr Kevin McCosker Queensland Department of Agriculture, Fisheries and Forestry
Dr Mike Ronan Queensland Department of Environment and Heritage Protection
Dr Britta Schaffelke Australian Institute of Marine Science
Dr Jane Waterhouse C2O Consulting
Dr Stuart Whitten CSIRO Ecosystem Sciences
Dr Hugh Yorkston Great Barrier Reef Marine Park Authority

64
Appendices
Reef Water Quality Protection Plan 2013Prioritisation project report
APP
END
IX 2
Sum
mar
y of
the
outc
omes
of t
he o
vera
ll as
sess
men
t of t
he re
lativ
e ris
k of
wat
er q
ualit
y in
the
GBR
Reg
ion
Dom
inan
t va
riab
les
in
mar
ine
asse
ssm
ent
Varia
bles
whe
re m
ax a
rea
is
in R
egio
n
M
arin
e
Ris
k In
dex
Reg
iona
l A
nthr
opog
enic
Loa
d as
a p
ropo
rtio
n
of t
he T
otal
GB
R
Load
(%
)Lo
ads
Inde
x
Rel
ativ
e R
isk
Inde
xM
anag
emen
t Is
sues
Ass
ocia
ted
land
use
sO
vera
ll R
anki
ng o
f R
elat
ive
Ris
k
CR =
Cor
al R
eef
SG =
Sea
gras
sCo
ral
Ree
f Se
agra
ssTS
SD
INPS
II H
erb
Cape
Yor
kCO
TS In
itiat
ion
Zone
(CR)
124
3<1
<10
9Th
e da
ta in
this
Reg
ion
are
high
ly
unce
rtai
n du
e to
lim
ited
va
lidat
ion
of m
arin
e da
tase
ts.
LOW
Wet
Tro
pics
100
839
2061
100
100
Nut
rient
sPe
stic
ides
Suga
rcan
eBa
nana
sV
ERY
HIG
H
Bur
deki
nTS
S 2m
g/L
(SG
, CR)
TSS
7mg/
L (S
G)
TSS
Plum
e lo
adin
g (C
R, S
G)
Chl 0
.45µ
g/L
(SG
)D
IN P
lum
e lo
adin
g (S
G)
4010
032
1113
6276
Sedi
men
ts
Pest
icid
es
Nut
rient
s
Gra
zing
Suga
rcan
e (c
oast
al)
HIG
H
Mac
kay
Whi
tsun
day
Pest
icid
e ex
posu
re
(CR
, SG
)54
374
612
2550
Pest
icid
esN
utrie
nts
Suga
rcan
eM
OD
ERA
TE
Fitz
roy
TSS
7mg/
L (C
R)Ch
l 0.4
5µg/
L (C
R)D
IN P
lum
e lo
adin
g (C
R)
8659
175
428
80Se
dim
ents
Pest
icid
es
Nut
rient
s
Gra
zing
Crop
ping
HIG
H
Bur
nett
M
ary
All
varia
bles
ran
k re
lativ
ely
low
1123
44
920
19Se
dim
ents
Gra
zing
UN
CER
TAIN
Sour
ce: B
rodi
e et
al.
(20
13b)
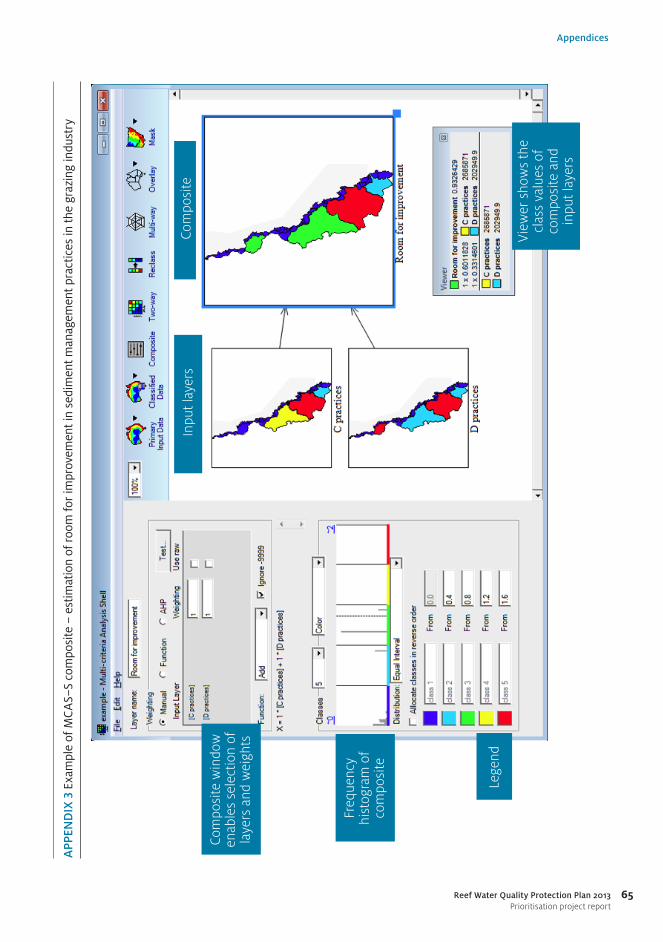
65
Appendices
Reef Water Quality Protection Plan 2013Prioritisation project report
APP
END
IX 3
Exa
mpl
e of
MC
AS–
S co
mpo
site
– e
stim
atio
n of
room
for
impr
ovem
ent i
n se
dim
ent m
anag
emen
t pra
ctic
es in
the
graz
ing
indu
stry
Com
posi
te w
indo
w
enab
les
sele
ctio
n of
la
yers
and
wei
ghts
Freq
uenc
y hi
stog
ram
of
com
posi
te
View
er s
how
s th
e cl
ass
valu
es o
f co
mpo
site
and
in
put l
ayer
s
Lege
nd
Inpu
t lay
ers
Com
posi
te

66
Appendices
Reef Water Quality Protection Plan 2013Prioritisation project report
APP
END
IX 4
Are
a an
d nu
mbe
r of
agr
icul
tura
l bus
ines
ses
for
graz
ing
and
suga
r ca
ne in
the
GBR
Padd
ock
to R
eef
data
*A
BS
Agr
icul
tura
l Cen
sus
2010
–11
NR
M r
egio
nSu
b-
catc
hmen
tM
anag
emen
t un
itA
rea
(ha)
Are
a of
gra
zing
(h
a)A
rea
of s
ugar
can
e (h
a)N
umbe
r of
gra
zing
bu
sine
sses
Num
ber
of
suga
r ca
ne
busi
ness
es
Gro
ss v
alue
of
sug
ar c
ane
prod
ucti
on ($
)
Cape
Yor
kJa
cky
Jack
y29
2 97
6 2
5 0
03
–
–
–
–
Oliv
e-Pa
scoe
412
922
63
314
–
–
–
–
Lock
hart
284
735
11
–
6
–
–
Stew
art
277
234
96
679
–
1
–
–
Nor
man
by2
439
585
1 7
21 6
89
–
25
–
–
Jean
nie
362
236
113
022
–
–
–
–
En
deav
our
209
580
130
316
–
1
7 –
–
Wet
Tro
pics
Dai
ntre
e21
0 6
56 1
4 81
4 4
354
2
1 2
2 4
263
60
4
Mos
sman
47 8
87 1
651
4
84
4 1
1 4
0
11
969
657
Barr
on21
8 88
9 6
7 23
3 5
618
2
26
62
19
461
232
Mul
grav
e-Ru
ssel
l19
7 88
2 6
594
2
4 93
4 6
4 2
07
49
945
297
John
ston
e23
2 60
7 3
7 88
0
28
00
5 3
28
226
4
5 46
6 76
3
Tully
168
527
8 1
21
20
264
4
3 9
7 3
9 92
3 27
2
Mur
ray
111
544
6 9
09
15 7
89
27
45
15 9
79 0
34
Her
bert
984
200
551
80
6 7
5 86
2 15
4 4
76
10
9 11
8 72
2
Bur
deki
nBl
ack
112
780
51
523
1 4
12
25
9
2 1
23 2
35
Ross
172
250
87
890
–
3
2 –
–
H
augh
ton
Low
er B
urde
kin
495
286
291
620
9
8 54
8 1
28
488
2
19 5
83 9
09
Burd
ekin
Upp
er B
urde
kin
4 0
04
962
3 5
15 4
98
–
190
3
3
06
514
Cape
Cam
pasp
e1
993
987
1 9
26 2
92
–
51
–
–
East
Bur
deki
n32
8 85
6 3
16 5
90
4 9
53
13
30
1
2 91
5 18
3
Bow
en B
ogie
1 16
2 86
5 1
047
127
–
8
0
9
2 9
36 2
44
Bely
ando
3 50
6 22
5 3
357
993
–
15
1 –
–
Su
ttor
1 83
3 35
4 1
675
435
–
5
5 –
–
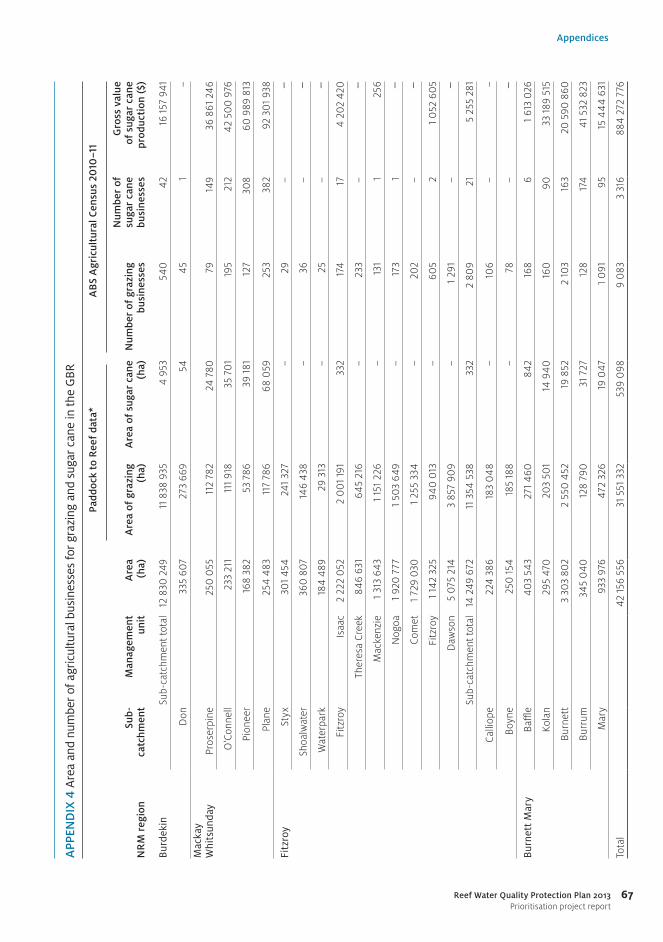
67
Appendices
Reef Water Quality Protection Plan 2013Prioritisation project report
APP
END
IX 4
Are
a an
d nu
mbe
r of
agr
icul
tura
l bus
ines
ses
for
graz
ing
and
suga
r ca
ne in
the
GBR
Padd
ock
to R
eef
data
*A
BS
Agr
icul
tura
l Cen
sus
2010
–11
NR
M r
egio
nSu
b-
catc
hmen
tM
anag
emen
t un
itA
rea
(ha)
Are
a of
gra
zing
(h
a)A
rea
of s
ugar
can
e (h
a)N
umbe
r of
gra
zing
bu
sine
sses
Num
ber
of
suga
r ca
ne
busi
ness
es
Gro
ss v
alue
of
sug
ar c
ane
prod
ucti
on ($
)
Bur
deki
nSu
b-ca
tchm
ent t
otal
12 8
30 2
49 1
1 83
8 93
5 4
953
5
40
42
16
157
941
Don
335
607
273
669
5
4 4
5 1
–
M
acka
y W
hits
unda
yPr
oser
pine
250
055
112
782
2
4 78
0
79
149
3
6 86
1 24
6
O'C
onne
ll23
3 21
1 1
11 9
18
35
701
195
2
12
42
500
976
Pion
eer
168
382
53
786
39
181
127
3
08
60
989
813
Plan
e25
4 48
3 1
17 7
86
68
059
2
53
382
9
2 30
1 93
8
Fitz
roy
Styx
301
454
241
327
–
2
9 –
–
Sh
oalw
ater
360
80
7 1
46 4
38
–
36
–
–
Wat
erpa
rk18
4 48
9 2
9 31
3 –
2
5 –
–
Fi
tzro
yIs
aac
2 22
2 0
52 2
00
1 19
1 3
32
174
1
7 4
202
420
Ther
esa
Cree
k84
6 63
1 6
45 2
16
–
233
–
–
M
acke
nzie
1 31
3 64
3 1
151
226
–
131
1
2
56
Nog
oa1
920
777
1 5
03
649
–
173
1
–
Co
met
1 72
9 0
30 1
255
334
–
2
02
–
–
Fitz
roy
1 14
2 32
5 9
40 0
13
–
60
5 2
1
052
60
5
Daw
son
5 0
75 2
14 3
857
90
9 –
1
291
–
–
Su
b-ca
tchm
ent t
otal
14 2
49 6
72 1
1 35
4 53
8 3
32
2 8
09
21
5 2
55 2
81
Calli
ope
224
386
183
048
–
1
06
–
–
Boyn
e25
0 15
4 1
85 1
88
–
78
–
–
Bur
nett
Mar
yBa
ffle
403
543
271
460
8
42
168
6
1
613
026
Kola
n29
5 47
0 2
03
501
14
940
1
60
90
3
3 18
9 51
5
Burn
ett
3 30
3 80
2 2
550
452
1
9 85
2 2
10
3 1
63
20
590
860
Burr
um34
5 0
40 1
28 7
90
31
727
128
1
74
41
532
823
Mar
y93
3 97
6 4
72 3
26
19
047
1
091
9
5 15
44
4 63
1
Tota
l42
156
556
31
551
332
539
098
9
083
3
316
8
84 2
72 7
76

68
Appendices
Reef Water Quality Protection Plan 2013Prioritisation project report
APP
END
IX 5
ABC
D la
nd m
anag
emen
t pra
ctic
e fr
amew
ork
for
the
graz
ing
indu
stry
Prin
cipl
eFr
amew
ork
A p
ract
ices
Fram
ewor
k B
pra
ctic
esFr
amew
ork
C pr
acti
ces
Fram
ewor
k D
pra
ctic
es
Mai
ntai
ning
A c
ondi
tion
land
and
/or
impr
ovin
g B
& C
cond
ition
land
tow
ards
A
Mai
ntai
ning
A/B
con
ditio
n la
nd a
nd/o
r im
prov
ing
B &
C co
nditi
on la
nd to
war
ds
A/B
Mai
ntai
ning
land
in A
B co
nditi
on a
nd g
radu
al
impr
ovem
ent o
f C c
ondi
tion
land
AB
C co
nditi
on la
nd
decl
inin
g
1. A
chie
ving
opt
imum
car
ryin
g ca
paci
ty
1.1 M
anag
ing
Land
type
sLa
nd ty
pes
docu
men
ted
on p
rope
rty
map
. Pr
oper
ty fe
ncin
g en
able
s al
l pad
dock
s an
d la
nd ty
pes
to b
e m
anag
ed to
ach
ieve
gr
ound
cov
er ta
rget
s.
Land
type
s de
fined
and
man
aged
to
prev
ent o
verg
razi
ng o
f pre
ferr
ed la
nd
type
s. P
rope
rty
map
incl
udes
pla
ns
for f
utur
e im
prov
emen
ts. A
ppro
pria
te
inte
rnal
fenc
ing.
Padd
ocks
man
aged
for
dom
inan
t soi
l typ
e w
ith s
ome
over
graz
ing
of p
refe
rred
land
ty
pes.
Lan
d ty
pes
not m
arke
d on
pro
pert
y m
ap. B
asic
in
tern
al fe
ncin
g.
Ove
rgra
zing
on
pref
erre
d la
nd ty
pes
and
arou
nd
wat
erin
g po
ints
. No
prop
erty
pla
n in
pla
ce.
In
adeq
uate
inte
rnal
fe
ncin
g to
man
age
graz
ing
pres
sure
.
1.2 M
anag
ing
Land
Co
nditi
onG
razi
ng L
and
Man
agem
ent P
lan
impl
emen
ted
and
land
con
ditio
n m
onito
red
in a
ccor
danc
e w
ith p
lan.
Padd
ocks
mon
itore
d fo
r lan
d co
nditi
on. G
razi
ng L
and
Man
agem
ent
Plan
is b
eing
dev
elop
ed.
Casu
al o
bser
vatio
n of
land
co
nditi
on w
ith b
asic
pas
ture
m
anag
emen
t.
No
man
agem
ent t
o ar
rest
or
impr
ove
decl
inin
g la
nd
cond
ition
.
1.3 W
ater
dis
trib
utio
nW
ater
ing
poin
ts lo
cate
d to
pre
vent
un
even
pat
ch g
razi
ng a
cros
s al
l lan
d ty
pes
and
padd
ocks
. Wat
erin
g po
int l
ocat
ion
and
desi
gn p
reve
nts
loca
lised
land
de
grad
atio
n.
Ade
quat
e w
ater
ing
poin
ts fo
r pad
dock
si
ze, a
nd c
arry
ing
capa
city
. Wat
erin
g po
ints
are
loca
ted
to m
inim
ise
occu
rren
ce o
f une
ven
graz
ing.
Lim
ited
wat
erin
g in
fras
truc
ture
re
sulti
ng in
som
e un
even
gr
azin
g pr
essu
re.
Larg
e pa
ddoc
ks u
nder
-w
ater
ed re
sulti
ng in
ov
ergr
azin
g in
pro
xim
ity
to a
vaila
ble
wat
er. N
o pl
an
for d
evel
opm
ent o
f fur
ther
w
ater
ing
poin
ts.
1.4 R
ipar
ian
and
fron
tage
m
anag
emen
tA
ll m
ajor
wat
er c
ours
es fe
nced
to e
nabl
e eff
ectiv
e m
anag
emen
t of r
ipar
ian
area
. O
ff st
ream
wat
erin
g po
ints
use
d to
pr
otec
t and
man
age
fron
tage
pad
dock
s.
Act
ion
take
n to
reha
bilit
ate
degr
aded
rip
aria
n ar
eas.
Maj
or w
ater
cour
ses
and
ripar
ian
zone
s m
anag
ed th
roug
h fe
ncin
g an
d off
-str
eam
wat
erin
g po
ints
.
A fe
w s
trat
egic
ally
pla
ced
off-s
trea
m w
ater
ing
poin
ts a
t pr
essu
re a
reas
.
No
off-s
trea
m w
ater
ing
poin
ts. W
ater
way
s no
t fe
nced
. Fro
ntag
e co
untr
y fr
eque
ntly
ove
rgra
zed.
1.5 P
astu
re S
pelli
ngSp
ellin
g of
all
padd
ocks
at a
ppro
pria
te
inte
rval
s ac
cord
ing
to p
astu
re s
peci
es
and
land
type
to e
nsur
e as
a d
elib
erat
e m
eans
of i
mpr
ovin
g gr
ound
cov
er a
nd
land
con
ditio
n.
Spel
ling
of p
addo
cks
at a
ppro
pria
te
inte
rval
s ac
cord
ing
to p
astu
re s
peci
es
and
land
type
to e
nsur
e ad
equa
te e
nd
of g
row
ing
seas
on g
roun
d co
ver.
Occ
asio
nal s
pelli
ng o
nly
of p
addo
cks
of c
once
rn o
r fo
r hus
band
ry re
ason
s (e
.g.
wea
ner p
addo
ck).
No
plan
for s
pelli
ng
past
ure
and
limite
d m
anag
emen
t fre
quen
tly
resu
lting
in lo
w g
roun
d co
ver a
t end
of g
row
ing
seas
on, r
egar
dles
s of
se
ason
al c
ondi
tions
.

69
Appendices
Reef Water Quality Protection Plan 2013Prioritisation project report
APP
END
IX 5
ABC
D la
nd m
anag
emen
t pra
ctic
e fr
amew
ork
for
the
graz
ing
indu
stry
Prin
cipl
eFr
amew
ork
A p
ract
ices
Fram
ewor
k B
pra
ctic
esFr
amew
ork
C pr
acti
ces
Fram
ewor
k D
pra
ctic
es
Mai
ntai
ning
A c
ondi
tion
land
and
/or
impr
ovin
g B
& C
cond
ition
land
tow
ards
A
Mai
ntai
ning
A/B
con
ditio
n la
nd a
nd/o
r im
prov
ing
B &
C co
nditi
on la
nd to
war
ds
A/B
Mai
ntai
ning
land
in A
B co
nditi
on a
nd g
radu
al
impr
ovem
ent o
f C c
ondi
tion
land
AB
C co
nditi
on la
nd
decl
inin
g
2. M
atch
ing
stoc
king
rat
e to
fora
ge a
vaila
bilit
y
2.1
Stoc
king
rat
eFo
rage
bud
getin
g an
d la
nd c
ondi
tion
mon
itorin
g us
ed to
sto
ckin
g ra
tes
mat
ch
fora
ge a
vaila
bilit
y ac
ross
all
padd
ocks
and
la
nd ty
pes.
Gra
zing
man
agem
ent r
esul
ts
in e
nd o
f dry
sea
son
grou
nd c
over
targ
ets
bein
g m
et.
Stoc
king
rat
e ad
just
ed to
fora
ge
avai
labi
lity
in re
spon
se to
sea
sona
l co
nditi
ons
and
land
con
ditio
n. P
astu
re
spel
ling
used
per
iodi
cally
to m
anag
e al
l lan
d ty
pes
Som
e fle
xibi
lity
in s
tock
ing
rate
. Pre
pare
d to
redu
ce s
tock
nu
mbe
rs in
dry
con
ditio
ns.
Hig
h st
ocki
ng r
ates
that
fr
eque
ntly
exc
eed
fora
ge
avai
labi
lity
rega
rdle
ss o
f se
ason
al c
ondi
tions
.
2.2
Gro
und
cove
rPa
ddoc
ks h
ave
mor
e th
an 4
0%
cov
er a
nd
appr
opria
te p
astu
re y
ield
at e
nd o
f dry
se
ason
. For
age
budg
etin
g ut
ilise
d an
d su
ppor
ted
by p
hoto
mon
itorin
g at
end
of
dry
seas
on.
Gro
und
cove
r doe
sn't
fall
belo
w
40%
at e
nd o
f sea
son
rega
rdle
ss o
f se
ason
al c
ondi
tions
.
In m
ost y
ears
40
% e
nd o
f dr
y se
ason
gro
und
cove
r m
aint
aine
d. C
over
may
fall
belo
w 4
0%
in d
ry y
ears
on
som
e la
nd ty
pes
and
padd
ocks
.
Less
than
40
%
grou
ndco
ver i
n m
ost y
ears
re
gard
less
of s
easo
nal
cond
ition
s.
3. S
trat
egic
use
of fi
re to
ach
ieve
man
agem
ent a
nd e
colo
gica
l out
com
es
3. S
trat
egic
use
of fi
reSt
rate
gic
fire
man
agem
ent i
s pa
rt o
f the
gr
azin
g m
anag
emen
t pla
n. In
clud
ing:
pre
-fir
e pl
anni
ng a
nd p
repa
ratio
n, p
ost-fi
re
man
agem
ent,
cons
ider
atio
n of
inte
nsity
of
bur
n an
d im
pact
s up
on b
iodi
vers
ity.
Doc
umen
ted
fire
man
agem
ent
stra
tegy
whi
ch in
clud
es ta
rget
ing
woo
dy w
eeds
and
tim
ber t
hick
enin
g.
App
ropr
iate
(wet
sea
son)
spe
lling
of
padd
ocks
pos
t bur
n.
Opp
ortu
nity
bur
ning
. No
fire
prev
entio
n st
rate
gy.
Lim
ited
pre-
and
pos
t-fire
pl
anni
ng. N
ot li
nked
to g
razi
ng
man
agem
ent p
lan.
Inap
prop
riate
use
of
fire
- no
fire
prev
entio
n st
rate
gy, e
xces
sive
bur
ning
fr
eque
ncy.
Gra
zing
of
burn
t are
as o
ccur
s w
ithou
t su
ffici
ent t
ime
to re
cove
r. N
o do
cum
ente
d fir
e m
anag
emen
t str
ateg
y.

70
Appendices
Reef Water Quality Protection Plan 2013Prioritisation project report
APP
END
IX 5
ABC
D la
nd m
anag
emen
t pra
ctic
e fr
amew
ork
for
the
graz
ing
indu
stry
Prin
cipl
eFr
amew
ork
A p
ract
ices
Fram
ewor
k B
pra
ctic
esFr
amew
ork
C pr
acti
ces
Fram
ewor
k D
pra
ctic
es
Mai
ntai
ning
A c
ondi
tion
land
and
/or
impr
ovin
g B
& C
cond
ition
land
tow
ards
A
Mai
ntai
ning
A/B
con
ditio
n la
nd a
nd/o
r im
prov
ing
B &
C co
nditi
on la
nd to
war
ds
A/B
Mai
ntai
ning
land
in A
B co
nditi
on a
nd g
radu
al
impr
ovem
ent o
f C c
ondi
tion
land
AB
C co
nditi
on la
nd
decl
inin
g
4. S
trat
egic
man
agem
ent o
f wee
ds a
nd fe
ral a
nim
als
to a
chie
ve p
rodu
ctiv
ity
and
ecol
ogic
al o
utco
mes
4. S
trat
egic
pes
t m
anag
emen
tSt
rate
gic
pest
man
agem
ent p
lan
impl
emen
ted
to c
ontr
ol te
rres
tria
l and
/or
wat
er w
eeds
and
pes
t ani
mal
s. P
est
sour
ce a
reas
and
out
brea
ks m
arke
d on
pr
oper
ty m
ap a
nd li
nked
to g
razi
ng la
nd
man
agem
ent p
lan.
Impl
emen
tatio
n of
a d
ocum
ente
d pe
st
and
wee
d m
anag
emen
t pla
n ba
sed
on
regu
lar m
onito
ring.
Acc
ount
s fo
r pes
t im
pact
s w
hen
docu
men
ting
fora
ge
budg
et.
Reac
tive
man
agem
ent o
f te
rres
tria
l and
wat
er w
eeds
an
d pe
st a
nim
als,
incl
udin
g de
clar
ed s
peci
es. N
o pe
st
man
agem
ent p
lan.
No
pest
man
agem
ent.
Prom
ote
rege
nera
tion
of r
ipar
ian
zone
s to
pre
vent
deg
rada
tion
and
wee
d in
fest
atio
n.
5. S
trat
egic
use
of s
own
past
ures
to a
chie
ve p
rodu
ctiv
ity
and
reso
urce
con
diti
on o
utco
mes
5. S
trat
egic
use
of s
own
past
ures
Ass
essm
ent o
f the
nee
d fo
r sow
n pa
stur
e (e
nviro
nmen
tal a
nd e
cono
mic
) in
corp
orat
ed in
to a
pro
pert
y de
velo
pmen
t pl
an. P
astu
re s
peci
es, e
stab
lishm
ent
met
hods
, buff
erin
g an
d so
il co
nser
vatio
n pr
actic
es m
ost s
uite
d to
spe
cific
land
and
so
il ty
pes.
Whe
re a
ppro
pria
te, e
stab
lishm
ent
of s
own
past
ures
. App
ropr
iate
soi
l co
nser
vatio
n pr
actic
es a
dopt
ed a
nd
buffe
rs in
pla
ce o
n w
ater
cour
ses.
Es
tabl
ishm
ent m
etho
d is
app
ropr
iate
fo
r the
land
scap
e an
d so
il ty
pe.
Whe
re a
ppro
pria
te, s
own
past
ures
est
ablis
hed
on
suita
ble
soil
type
s.
No
cons
ider
atio
n gi
ven
to
the
role
of s
own
past
ures
w
ithin
the
ente
rpris
e.
6. L
ocat
ion
and
mai
nten
ance
of p
rope
rty
road
s an
d fir
ebre
aks
6. P
rope
rty
road
s an
d fir
ebre
aks
Road
s an
d fir
ebre
aks
wel
l pla
nned
and
lo
cate
d in
acc
orda
nce
with
a p
rope
rty
man
agem
ent p
lan
and
mar
ked
on
prop
erty
map
. Pre
vent
ativ
e er
osio
n co
ntro
l pra
ctic
es im
plem
ente
d an
d w
ell
mai
ntai
ned.
All
road
s an
d tr
acks
are
de
sign
ed to
min
imis
e th
e ch
ance
of w
ater
flo
ws
conc
entr
atin
g in
to r
ills.
Soi
l ero
sion
is
min
imal
.
Road
s an
d fir
ebre
aks
are
wel
l m
aint
aine
d, m
arke
d on
pro
pert
y m
ap
and
cont
rolle
d ac
cord
ing
to p
lan.
Re
plac
emen
t roa
ds a
nd fi
rebr
eaks
ar
e re
loca
ted
in a
pla
nned
man
ner t
o st
able
are
as w
here
feas
ible
to p
reve
nt
and
stab
ilise
ero
sion
. Ero
sion
con
trol
w
orks
are
impl
emen
ted
in h
igh
prio
rity
area
s.
Loca
tion
of ro
ads
and
fireb
reak
s is
not
pla
nned
w
ith m
aint
enan
ce a
nd
impl
emen
tatio
n of
ero
sion
co
ntro
l wor
ks o
nly
in a
reas
w
here
ser
ious
ero
sion
has
oc
curr
ed.
Road
s ar
e po
orly
loca
ted
and
not m
aint
aine
d. A
s er
osio
n ex
pand
s, th
ey
are
relo
cate
d to
adj
acen
t ar
eas.
Fire
brea
ks a
re
only
inst
alle
d in
a w
ildfir
e em
erge
ncy
with
no
cons
ider
atio
n fo
r str
ateg
ic
loca
tion
or m
aint
enan
ce.

71
Appendices
Reef Water Quality Protection Plan 2013Prioritisation project report
APP
END
IX 5
ABC
D la
nd m
anag
emen
t pra
ctic
e fr
amew
ork
for
the
graz
ing
indu
stry
Prin
cipl
eFr
amew
ork
A p
ract
ices
Fram
ewor
k B
pra
ctic
esFr
amew
ork
C pr
acti
ces
Fram
ewor
k D
pra
ctic
es
Mai
ntai
ning
A c
ondi
tion
land
and
/or
impr
ovin
g B
& C
cond
ition
land
tow
ards
A
Mai
ntai
ning
A/B
con
ditio
n la
nd a
nd/o
r im
prov
ing
B &
C co
nditi
on la
nd to
war
ds
A/B
Mai
ntai
ning
land
in A
B co
nditi
on a
nd g
radu
al
impr
ovem
ent o
f C c
ondi
tion
land
AB
C co
nditi
on la
nd
decl
inin
g
7. P
reve
ntio
n an
d st
abili
sati
on o
f ero
sion
are
as in
clud
ing
gulli
es, s
trea
m b
anks
, and
hill
slop
es
7. Pr
even
tion
and
stab
ilisa
tion
of e
rosi
onEr
osio
n co
ntro
l mea
sure
s in
pla
ce a
cros
s pr
oper
ty, w
ith o
ngoi
ng m
onito
ring
and
impl
emen
tatio
n of
furt
her m
itiga
tion
optio
ns. A
ll ro
ads
and
trac
ks a
re d
esig
ned
to m
inim
ise
the
chan
ce o
f wat
er fl
ows
conc
entr
atin
g in
to r
ills
incl
udin
g di
vers
ion
bank
s. A
ctiv
ely
mai
ntai
ning
hig
h le
vels
of
grou
nd c
over
uph
ill o
f are
as v
ulne
rabl
e to
gu
llyin
g.
Div
ersi
on b
anks
est
ablis
hed
upsl
ope
of a
reas
vul
nera
ble
to g
ully
ing
or
alte
rnat
ive
actio
ns w
here
app
ropr
iate
. Er
osio
n co
ntro
l mea
sure
s in
pla
ce
acco
rdin
g to
pla
n w
ith (
haph
azar
d)
inte
rmitt
ent m
onito
ring.
Sto
ck d
enie
d ac
cess
to c
once
ntra
ted
eros
ion
area
s.
Som
e fe
ncin
g us
ed to
exc
lude
st
ock
from
ero
sion
are
as to
pr
omot
e gr
ound
cov
er. N
o er
osio
n or
land
deg
rada
tion
man
agem
ent i
nclu
ded
in a
m
anag
emen
t pla
n.
No
iden
tifica
tion
of h
igh
risk
area
s or
man
agem
ent
for g
ully
ero
sion
.
8. R
ecor
ds M
anag
emen
t
8. R
ecor
ds m
anag
emen
tA
ccur
ate
reco
rds
of s
tock
num
bers
by
anim
al c
lass
, pad
dock
num
bers
and
sto
ck
mov
emen
ts. L
ives
tock
per
form
ance
dat
a su
ch a
s liv
ewei
ghts
and
pre
gnan
cy te
st
data
reco
rded
and
use
d in
man
agem
ent.
Land
con
ditio
n is
mon
itore
d an
d us
ed
to in
form
pro
pert
y pl
anni
ng a
nd la
nd
and
lives
tock
man
agem
ent.
Cost
s an
d be
nefit
s of
man
agem
ent s
trat
egie
s e.
g.
supp
lem
enta
ry fe
edin
g ar
e as
sess
ed a
nd
used
in fu
ture
dec
isio
n m
akin
g.
Acc
urat
e re
cord
s of
sto
ck n
umbe
rs
by a
nim
al c
lass
, pad
dock
num
bers
an
d st
ock
mov
emen
ts. L
ives
tock
pe
rfor
man
ce d
ata
such
as
livew
eigh
ts
and
preg
nanc
y te
st d
ata
reco
rded
an
d us
ed in
man
agem
ent.
Prod
uctio
n co
sts
are
mon
itore
d. L
and
cond
ition
is
mon
itore
d.
Basi
c re
cord
s of
bra
ndin
gs,
wea
ning
s, s
tock
num
bers
and
m
ovem
ents
. Lim
ited
reco
rdin
g of
pro
duct
ion
data
.
Lim
ited
stoc
k re
cord
s an
d no
reco
rdin
g of
pro
duct
ion
data
.

72
Appendices
Reef Water Quality Protection Plan 2013Prioritisation project report
APPENDIX 6 Reef Rescue Sugar Industry – Broad ABCD for Water Quality Land Management Practice Framework showing practices as at 2008-09 season – Differences from previous categories – DRAFT –13 May 2010
Practice Type
Practice Action
D = Superseded/ Dated
C = Code of Practice
B = Best A = Aspirational
(do 100% of these actions)
(do 75% of these actions) (not proven or economically viable)
Principles Superseded practices or not recommended
Code of Practice Best management practice from an overall farm sustainability perspective (environment, social, economic)
Best for water quality but not from an overall farm sustainability perspective (environment, social, economic)
Nutrient Number of application rates
Single application rate
One rate for plant, and a different rate for ratoon
Variable rates between blocks based on soil type
Variable rates within block (eg based on yield mapping, soil mapping). Amounts based on property yield potential recommendations.
Application rate amount
Amounts based on historic rules of thumb
Amounts based on old industry recommendations
Amounts based on 6ES or equivalent (takes account of fallow history/ legumes/ by-products etc)
Specific advisor recommendations to change amounts; and/or use Near Infra Red data to change amounts
Timing Ad hoc Same time each year
Time applications for crop class, irrigation and weather
As for “B”
Placement/ method
Broadcast on surface (or in cutaway for plant cane)
Banded surface for granular
Sub-surface. Sub-surface with auto shut off at end of row and/or fertiliser box with rate control
Any liquid products applied above surface prior to first irrigation/ rain
Accuracy/ Calibration
None Annual When product changes or at least once per month
Each time of use or at least once per month
Testing None Some soil testing One soil test per crop cycle As for “B” plus Leaf sampling analysis
Chemical (herbicides for sugar)
Number of application rates (strategy and planning)
Single application rate
One rate for plant cane and one rate for ratoon cane
Herbicide strategy by block Variable strategy within blocks
Application rate amount
Use maximum label rate amount
Rate amount appropriate to weed pressure within label rates
Herbicide strategy by block Variable strategy within blocks
Timing Ad hoc Spray as per label recommendations
Time applications for crop class, irrigation and weather
All weeds controlled before 4 leaf stage
Multiple weed control during fallow
Placement/ method
Standard spray rig both high clearance and low clearance
Occasionally change nozzles
Nozzles matched to job Variable rate controller, yield sensor
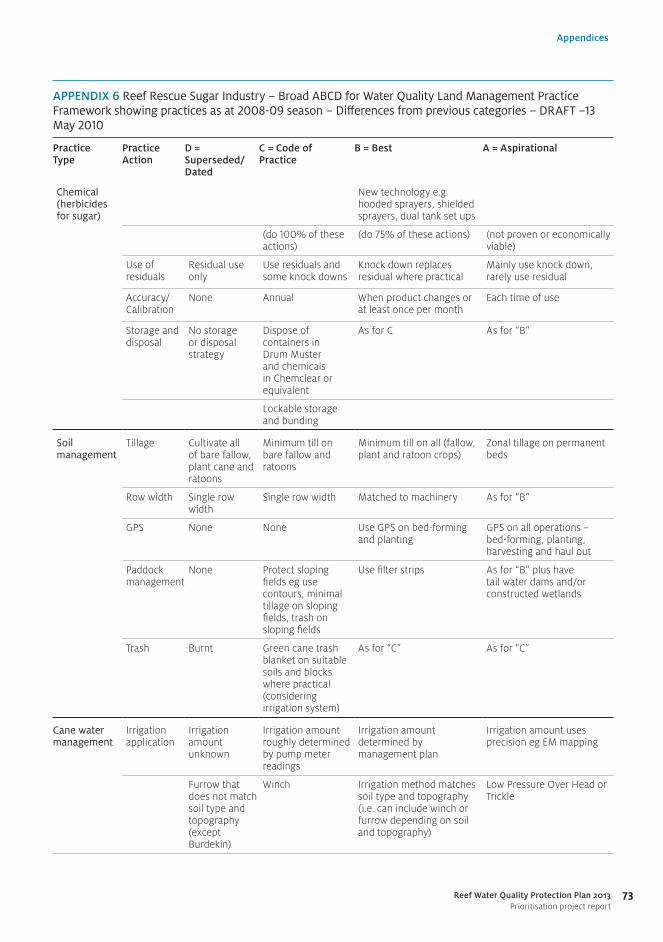
73
Appendices
Reef Water Quality Protection Plan 2013Prioritisation project report
APPENDIX 6 Reef Rescue Sugar Industry – Broad ABCD for Water Quality Land Management Practice Framework showing practices as at 2008-09 season – Differences from previous categories – DRAFT –13 May 2010
Practice Type
Practice Action
D = Superseded/ Dated
C = Code of Practice
B = Best A = Aspirational
Chemical (herbicides for sugar)
New technology e.g. hooded sprayers, shielded sprayers, dual tank set ups
(do 100% of these actions)
(do 75% of these actions) (not proven or economically viable)
Use of residuals
Residual use only
Use residuals and some knock downs
Knock down replaces residual where practical
Mainly use knock down, rarely use residual
Accuracy/ Calibration
None Annual When product changes or at least once per month
Each time of use
Storage and disposal
No storage or disposal strategy
Dispose of containers in Drum Muster and chemicals in Chemclear or equivalent
As for C As for “B”
Lockable storage and bunding
Soil management
Tillage Cultivate all of bare fallow, plant cane and ratoons
Minimum till on bare fallow and ratoons
Minimum till on all (fallow, plant and ratoon crops)
Zonal tillage on permanent beds
Row width Single row width
Single row width Matched to machinery As for “B”
GPS None None Use GPS on bed-forming and planting
GPS on all operations – bed-forming, planting, harvesting and haul out
Paddock management
None Protect sloping fields eg use contours, minimal tillage on sloping fields, trash on sloping fields
Use filter strips As for “B” plus have tail water dams and/or constructed wetlands
Trash Burnt Green cane trash blanket on suitable soils and blocks where practical (considering irrigation system)
As for “C” As for “C”
Cane water management
Irrigation application
Irrigation amount unknown
Irrigation amount roughly determined by pump meter readings
Irrigation amount determined by management plan
Irrigation amount uses precision eg EM mapping
Furrow that does not match soil type and topography (except Burdekin)
Winch Irrigation method matches soil type and topography (i.e. can include winch or furrow depending on soil and topography)
Low Pressure Over Head or Trickle

74
Appendices
Reef Water Quality Protection Plan 2013Prioritisation project report
APPENDIX 6 Reef Rescue Sugar Industry – Broad ABCD for Water Quality Land Management Practice Framework showing practices as at 2008-09 season – Differences from previous categories – DRAFT –13 May 2010
Practice Type
Practice Action
D = Superseded/ Dated
C = Code of Practice
B = Best A = Aspirational
Cane water management
No efficiency checks
For Burdekin – furrow irrigation with correct set times and flow rate to minimise runoff and deep drainage
Irrigation system efficiency checks annually
Irrigation efficiency checks as for “B”
Efficiency checks every few years
Irrigation scheduling method
Grower experience, guesswork or set cycle
Prioritise crop cycle eg plant cane and 1st ratoon over 5th ratoon
Quantitative scheduling and soil moisture monitoring
Quantitative scheduling, soil moisture monitoring, and precision water application across soil type or management zones
Some scheduling eg mini pans
Use manual scheduling eg moisture probes
Use electronic scheduling and software
Climate forecasting
(do 100% of these actions)
(do 75% of these actions) (not proven or economically viable)
Drainage Basic drainage in original farm layout
Laser levelling only Storm water pits on suitable soil types capturing first flush
Storm water pits on suitable soil types capturing first flush and pit bypass overflow plus (if irrigation) recycling with water quality testing
Bank end of furrows (if furrow irrigation)
Contour banks, diversion banks or constructed waterways with ground cover e.g. grass
Days after fertiliser application
Not considered i.e. random
Zero to two days Two to five days depending on soil type
Two to five days depending on soil type
Record keeping and planning
No plan Basic written record keeping/ Paddock Journal
Documented Herbicide Management Plan
As for “B” plus: GIS based plan
Records “kept in head”
Chemcert current (within previous 5 years)
Documented Nutrient Management Plan
Documented Drainage Management Plan
Chemcert accreditation more than five years ago
Documented Irrigation Management Plan
Computerised record keeping
Records of use include time of spraying, type of pesticide, amount of pesticide, wind speed, wind direction
BSES Weed Management Strategy and/or Ask GB or equivalent

75
Appendices
Reef Water Quality Protection Plan 2013Prioritisation project report
APPENDIX 7a Room for improvement in sub-catchment sediment management practices in the grazing industry 2010-11
Region Sub-catchment C sediment practices (ha) D sediment practices (ha)
Cape York Jacky Jacky – –
Olive-Pascoe – –
Lockhart – –
Stewart 4 240
Normanby 843 654 591 031
Jeannie 274 190
Endeavour 2 431 3 837
Wet Tropics Daintree 493 174
Mossman 200 17
Barron 22 404 4 652
Mulgrave-Russell 1 011 206
Johnstone 5 101 555
Tully 24 –
Murray 152 –
Herbert 148 327 16 004
Burdekin Black 6 451 460
Ross 12 736 1 159
Haughton 101 545 7 802
Burdekin 2 685 871 202 950
Don 41 086 11 623
Mackay Whitsunday Proserpine 40 697 22 648
O'Connell 68 421 13 331
Pioneer 22 671 24 618
Plane 43 805 27 358
Fitzroy Styx 137 897 62 709
Shoalwater 70 484 16 376
Waterpark 16 770 2 282
Fitzroy 4 467 645 612 290
Calliope 126 907 974
Boyne 131 959 829
Burnett Mary Baffle 18 893 20 004
Kolan 14 089 3 774
Burnett 1 646 781 227 088
Burrum 239 875 9 801
Mary 92 891 17 750
Source: Paddock to Reef Program

76
Appendices
Reef Water Quality Protection Plan 2013Prioritisation project report
APPENDIX 7b Room for improvement in sub-catchment nutrient and herbicide management practices in the sugar cane industry 2010-11
Region Sub-catchment B nutrient
practices (ha) C nutrient
practices (ha) D nutrient
practices (ha) C herbicide
practices (ha) D herbicide
practices (ha)
Cape York Jacky Jacky – – – – –
Olive-Pascoe – – – – –
Lockhart – – – – –
Stewart – – – – –
Normanby – – – – –
Jeannie – – – – –
Endeavour – – – – –
Wet Tropics Daintree 2 489 1 751 114 952 2 453
Mossman 2 769 1 948 127 1 059 2 729
Barron 1 578 2 368 581 415 242
Mulgrave-Russell 18 210 2 011 1 537 16 735 2 712
Johnstone 18 315 2 777 5 490 4 867 16 924
Tully 13 186 5 726 323 10 421 6 911
Murray 10 274 4 462 252 8 120 5 385
Herbert 48 468 17 448 8 345 16 583 42 733
Burdekin Black 902 325 155 309 795
Ross – – – – –
Haughton 32 616 38 921 14 138 47 988 7 740
Burdekin 1 497 2 020 763 2 444 378
Don 17 22 8 27 4
Mackay Whitsunday Proserpine 10 572 5 662 3 437 13 669 –
O'Connell 13 331 17 295 1 731 18 039 1 978
Pioneer 13 624 22 041 1 273 22 837 2 813
Plane 22 343 36 524 3 050 32 046 1 424
Fitzroy Styx – – – – –
Shoalwater – – – – –
Waterpark – – – – –
Fitzroy – – – – –
Calliope – – – – –
Boyne – – – – –
Burnett Mary Baffle 417 280 142 249 95
Kolan 8 876 4 141 1 611 7 495 2 660
Burnett 6 906 9 591 1 799 12 036 3 140
Burrum 10 995 16 496 2 463 21 572 1 949
Mary 5 708 7 984 2 581 9 300 1 495
Source: Paddock to Reef Program
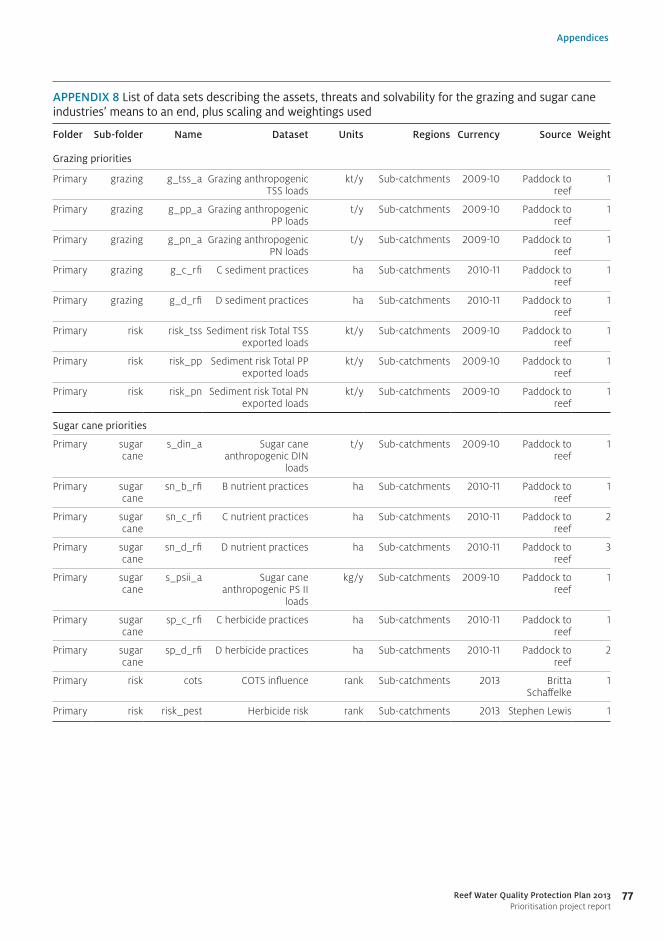
77
Appendices
Reef Water Quality Protection Plan 2013Prioritisation project report
APPENDIX 8 List of data sets describing the assets, threats and solvability for the grazing and sugar cane industries’ means to an end, plus scaling and weightings used
Folder Sub-folder Name Dataset Units Regions Currency Source Weight
Grazing priorities
Primary grazing g_tss_a Grazing anthropogenic TSS loads
kt/y Sub-catchments 2009-10 Paddock to reef
1
Primary grazing g_pp_a Grazing anthropogenic PP loads
t/y Sub-catchments 2009-10 Paddock to reef
1
Primary grazing g_pn_a Grazing anthropogenic PN loads
t/y Sub-catchments 2009-10 Paddock to reef
1
Primary grazing g_c_rfi C sediment practices ha Sub-catchments 2010-11 Paddock to reef
1
Primary grazing g_d_rfi D sediment practices ha Sub-catchments 2010-11 Paddock to reef
1
Primary risk risk_tss Sediment risk Total TSS exported loads
kt/y Sub-catchments 2009-10 Paddock to reef
1
Primary risk risk_pp Sediment risk Total PP exported loads
kt/y Sub-catchments 2009-10 Paddock to reef
1
Primary risk risk_pn Sediment risk Total PN exported loads
kt/y Sub-catchments 2009-10 Paddock to reef
1
Sugar cane priorities
Primary sugar cane
s_din_a Sugar cane anthropogenic DIN
loads
t/y Sub-catchments 2009-10 Paddock to reef
1
Primary sugar cane
sn_b_rfi B nutrient practices ha Sub-catchments 2010-11 Paddock to reef
1
Primary sugar cane
sn_c_rfi C nutrient practices ha Sub-catchments 2010-11 Paddock to reef
2
Primary sugar cane
sn_d_rfi D nutrient practices ha Sub-catchments 2010-11 Paddock to reef
3
Primary sugar cane
s_psii_a Sugar cane anthropogenic PS II
loads
kg/y Sub-catchments 2009-10 Paddock to reef
1
Primary sugar cane
sp_c_rfi C herbicide practices ha Sub-catchments 2010-11 Paddock to reef
1
Primary sugar cane
sp_d_rfi D herbicide practices ha Sub-catchments 2010-11 Paddock to reef
2
Primary risk cots COTS influence rank Sub-catchments 2013 Britta Schaffelke
1
Primary risk risk_pest Herbicide risk rank Sub-catchments 2013 Stephen Lewis 1

78
Appendices
Reef Water Quality Protection Plan 2013Prioritisation project report
APP
END
IX 9
Est
imat
ed fl
ows,
her
bici
de lo
ads,
ratin
gs, t
oxic
load
s an
d av
erag
e co
ncen
trat
ions
for
Gre
at B
arrie
r Re
ef S
ub-c
atch
men
ts
Sub-
catc
hmen
tFl
ow
(ML/
y)A
met
ryn
(kg)
Atr
azin
e (k
g)D
iuro
n (k
g)H
exaz
inon
e (k
g)Te
buth
iuro
n (k
g)A
met
ryn
rati
ngA
traz
ine
rati
ngD
iuro
n ra
ting
Hex
azin
one
rati
ngTe
buth
iuro
n ra
ting
Tota
l 't
oxic
' PS
II
load
Toxi
c EM
C (µ
g.L–1
)
Pion
eer
Riv
er82
2 18
632
530
130
019
30
35.7
5113
00.
243
.60
1430
.61.7
4
Plan
e Cr
eek
1 26
4 56
439
640
1569
233
043
.161
.615
68.9
52.7
017
26.2
1.37
O'C
onne
ll R
iver
1 47
5 73
524
400
980
146
026
.938
.598
0.4
32.9
010
78.8
0.73
Pros
erpi
ne R
iver
1 24
3 83
717
286
699
104
019
.227
.569
8.9
23.5
076
9.2
0.62
Hau
ghto
n R
iver
1 0
45 1
6915
512
290
81
16.3
49.3
290.
11.8
0.1
357.7
0.34
Her
bert
Riv
er4
273
490
039
547
847
62
038
478
107.6
0.2
623.
80.
15
Bur
nett
Riv
er19
3 14
10
964
389
09.
34.
38.
70.
723
0.12
John
ston
e R
iver
4 55
9 02
90
247
301
299
00
23.8
301.1
67.6
039
2.5
0.0
9
Mul
grav
e-R
usse
ll R
iver
s3
684
046
018
222
522
20
017
.522
4.7
50.2
029
2.5
0.0
8
Don
Riv
er84
6 60
01
3248
121
1.33.
148
2.7
0.1
55.2
0.0
7
Mos
sman
Riv
er50
7 88
60
1823
230
01.8
22.9
5.1
029
.80.
06
Tully
Riv
er3
488
088
012
114
714
60
011
.714
6.7
330
191.5
0.0
5
Mur
ray
Riv
er1
290
985
043
5352
00
4.2
52.8
11.9
068
.80.
05
Kola
n R
iver
74 3
210
63
31
00.
62.
60.
60.
13.
90.
05
Fitz
roy
Riv
er4
659
346
058
681
2763
90
56.4
80.6
649
.619
2.7
0.0
4
Bur
rum
Riv
er25
8 81
30
146
61
01.4
5.5
1.30
8.2
0.0
3
Shoa
lwat
er C
reek
387
422
03
71
00.
20.
36.
60.
30
7.3
0.02
Bur
deki
n R
iver
8 91
3 70
23
154
634
266
3.1
14.9
62.8
0.9
20.7
102.
30.
01
Mar
y R
iver
1 40
0 2
390
642
251
06.
12.
25.
70.
114
.10.
01
Bar
ron
Riv
er79
3 80
20
194
100
01.8
3.8
2.3
08
0.0
1
Bla
ck R
iver
620
226
07
30
00.
20.
73.
50.
10
4.4
0.0
1
Boy
ne R
iver
40 3
07
01
00
10
0.1
00.
10
0.2
0.0
1
Dai
ntre
e R
iver
2 63
9 31
90
911
100
00.
810
.62.
40
13.8
0.0
1

79
Appendices
Reef Water Quality Protection Plan 2013Prioritisation project report
APP
END
IX 9
Est
imat
ed fl
ows,
her
bici
de lo
ads,
ratin
gs, t
oxic
load
s an
d av
erag
e co
ncen
trat
ions
for
Gre
at B
arrie
r Re
ef S
ub-c
atch
men
ts
Sub-
catc
hmen
tFl
ow
(ML/
y)A
met
ryn
(kg)
Atr
azin
e (k
g)D
iuro
n (k
g)H
exaz
inon
e (k
g)Te
buth
iuro
n (k
g)A
met
ryn
rati
ngA
traz
ine
rati
ngD
iuro
n ra
ting
Hex
azin
one
rati
ngTe
buth
iuro
n ra
ting
Tota
l 't
oxic
' PS
II
load
Toxi
c EM
C (µ
g.L–1
)
Baffl
e Cr
eek
491
201
03
01
10
0.3
0.3
0.3
0.1
0.9
0
Calli
ope
Riv
er11
7 0
340
00
01
00
00
00.
10
Styx
Riv
er27
1 61
60
00
01
00
00
0.1
0.1
0
Ros
s R
iver
573
747
01
00
00
0.1
00.
10
0.2
0
Wat
er P
ark
Cree
k39
1 68
60
00
00
00
00
00.
10
Nor
man
by R
iver
4 69
2 71
50
10
16
00.
10
0.1
0.5
0.7
0
Jack
y Ja
cky
Cree
k2
830
817
00
00
00
00
00
00
Oliv
e-Pa
scoe
Riv
ers
3 57
5 88
10
00
00
00
00
00
0
Lock
hart
Riv
er2
213
964
00
00
00
00
00
00
Stew
art R
iver
1 32
5 36
50
00
00
00
00
00
0
Jean
nie
Riv
er1
309
193
00
00
00
00
00
00
Ende
avou
r R
iver
1 58
8 86
20
00
00
00
00
00
0

80
Appendices
Reef Water Quality Protection Plan 2013Prioritisation project report
FIGURE 16 Anthropogenic baseline – total suspended solids – average annual modelled loads (1986–2009) exported from sub-catchments (kilotonnes per year) by land use
Sub-
catc
hmen
ts
- 500 1,000 1,500 2,000 2,500
Jacky Jacky Olive-Pascoe
Lockhart Stewart
Normanby Jeannie
Endeavour
Daintree Mossman
Barron Mulgrave-Russell
Johnstone Tully
Murray Herbert
Black Ross
Haughton Burdekin
Don
Proserpine O'Connell
Pioneer Plane
Styx Shoalwater Waterpark
Fitzroy Calliope
Boyne
Baffle Kolan
Burnett Burrum
Mary
Total suspended solids average annual modelled loads (kt/y)
Grazing
Sugarcane
Cropping
Horticulture
Bananas
Dairy
Other uses
Cape York
Wet Tropics
Burdekin
Mackay Whitsunday
Fitzroy
Burnett Mary
Note: Other uses include contributions from stream bank erosion, nature conservation, forestry and urban land.
APPENDIX 10 Anthropogenic baseline – average annual modelled loads (1986–2009) exported from GBR sub-catchments by land use
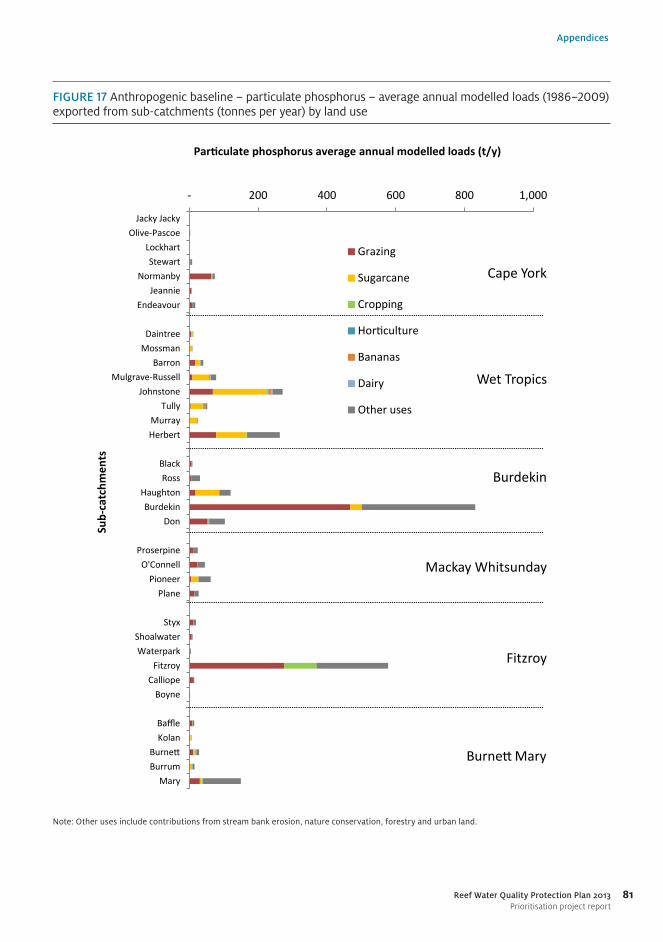
81
Appendices
Reef Water Quality Protection Plan 2013Prioritisation project report
FIGURE 17 Anthropogenic baseline – particulate phosphorus – average annual modelled loads (1986–2009) exported from sub-catchments (tonnes per year) by land use
Sub-
catc
hmen
ts
- 200 400 600 800 1,000
Jacky Jacky Olive-Pascoe
Lockhart Stewart
Normanby Jeannie
Endeavour
Daintree Mossman
Barron Mulgrave-Russell
Johnstone Tully
Murray Herbert
Black Ross
Haughton Burdekin
Don
Proserpine O'Connell
Pioneer Plane
Styx Shoalwater Waterpark
Fitzroy Calliope
Boyne
Baffle Kolan
Burnett Burrum
Mary
Particulate phosphorus average annual modelled loads (t/y)
Grazing
Sugarcane
Cropping
Horticulture
Bananas
Dairy
Other uses
Cape York
Wet Tropics
Burdekin
Mackay Whitsunday
Fitzroy
Burnett Mary
Note: Other uses include contributions from stream bank erosion, nature conservation, forestry and urban land.

82
Appendices
Reef Water Quality Protection Plan 2013Prioritisation project report
FIGURE 18 Anthropogenic baseline – particulate nitrogen – average annual modelled loads (1986–2009) exported from sub-catchments (tonnes per year) by land use
Sub-
catc
hmen
ts
- 500 1,000 1,500 2,000
Jacky Jacky Olive-Pascoe
Lockhart Stewart
Normanby Jeannie
Endeavour
Daintree Mossman
Barron Mulgrave-Russell
Johnstone Tully
Murray Herbert
Black Ross
Haughton Burdekin
Don
Proserpine O'Connell
Pioneer Plane
Styx Shoalwater Waterpark
Fitzroy Calliope
Boyne
Baffle Kolan
Burnett Burrum
Mary
Particulate nitrogen average annual modelled loads (t/y)
Grazing
Sugarcane
Cropping
Horticulture
Bananas
Dairy
Other uses
Cape York
Wet Tropics
Burdekin
Mackay Whitsunday
Fitzroy
Burnett Mary
Note: Other uses include contributions from stream bank erosion, nature conservation, forestry and urban land.

83
Appendices
Reef Water Quality Protection Plan 2013Prioritisation project report
FIGURE 19 Anthropogenic baseline – dissolved inorganic nitrogen – average annual modelled loads (1986–2009) exported from sub-catchments (tonnes per year) by land use
Sub-
catc
hmen
ts
- 200 400 600 800 1,000
Jacky Jacky Olive-Pascoe
Lockhart Stewart
Normanby Jeannie
Endeavour
Daintree Mossman
Barron Mulgrave-Russell
Johnstone Tully
Murray Herbert
Black Ross
Haughton Burdekin
Don
Proserpine O'Connell
Pioneer Plane
Styx Shoalwater Waterpark
Fitzroy Calliope
Boyne
Baffle Kolan
Burnett Burrum
Mary
Dissolved inorganic nitrogen average annual modelled loads (t/y)
Grazing
Sugarcane
Cropping
Horticulture
Bananas
Dairy
Other uses
Cape York
Wet Tropics
Burdekin
Mackay Whitsunday
Fitzroy
Burnett Mary
Note: Other uses include contributions from stream bank erosion, nature conservation, forestry and urban land.
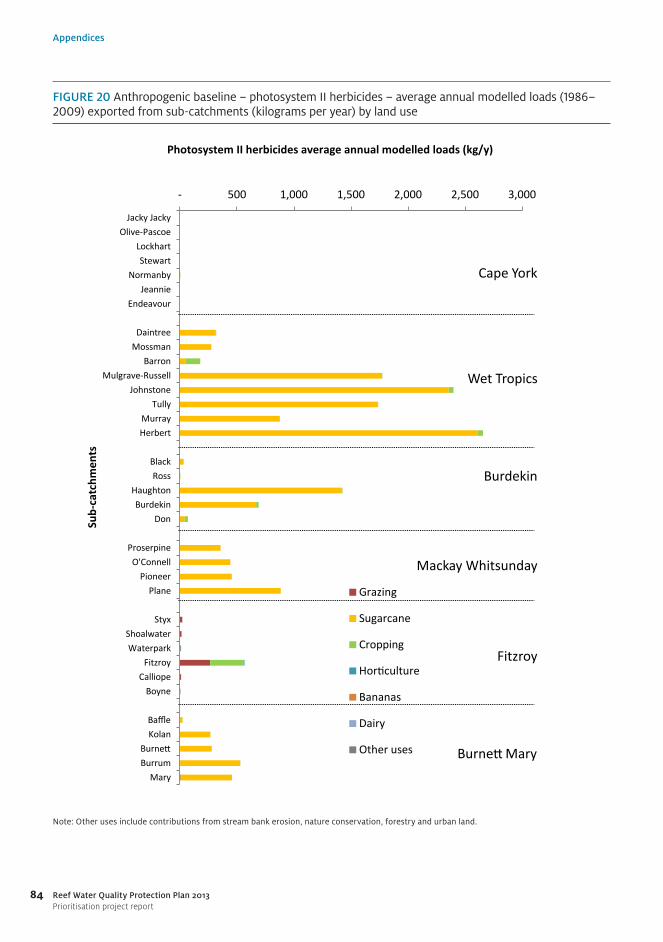
84
Appendices
Reef Water Quality Protection Plan 2013Prioritisation project report
FIGURE 20 Anthropogenic baseline – photosystem II herbicides – average annual modelled loads (1986–2009) exported from sub-catchments (kilograms per year) by land use
Sub-
catc
hmen
ts
- 500 1,000 1,500 2,000 2,500 3,000
Jacky Jacky Olive-Pascoe
Lockhart Stewart
Normanby Jeannie
Endeavour
Daintree Mossman
Barron Mulgrave-Russell
Johnstone Tully
Murray Herbert
Black Ross
Haughton Burdekin
Don
Proserpine O'Connell
Pioneer Plane
Styx Shoalwater Waterpark
Fitzroy Calliope
Boyne
Baffle Kolan
Burnett Burrum
Mary
Photosystem II herbicides average annual modelled loads (kg/y)
Grazing
Sugarcane
Cropping
Horticulture
Bananas
Dairy
Other uses
Cape York
Wet Tropics
Burdekin
Mackay Whitsunday
Fitzroy
Burnett Mary
Note: Other uses include contributions from stream bank erosion, nature conservation, forestry and urban land.

85
Appendices
Reef Water Quality Protection Plan 2013Prioritisation project report
FIGURE 21 Anthropogenic baseline – total suspended solids – average annual modelled loads (1986–2009) exported from sub-catchments (tonnes per hectare per year) by land use
Sub-
catc
hmen
ts
- 10 20 30 40 50 60 70
Jacky Jacky Olive-Pascoe
Lockhart Stewart
Normanby Jeannie
Endeavour
Daintree Mossman
Barron Mulgrave-Russell
Johnstone Tully
Murray Herbert
Black Ross
Haughton Burdekin
Don
Proserpine O'Connell
Pioneer Plane
Styx Shoalwater Waterpark
Fitzroy Calliope
Boyne
Baffle Kolan
Burnett Burrum
Mary
Total suspended solids average annual modelled loads (t/ha/y)
Grazing
Sugarcane
Cropping
Horticulture
Bananas
Dairy
Other uses
Cape York
Wet Tropics
Burdekin
Mackay Whitsunday
Fitzroy
Burnett Mary
Note: Other uses include contributions from stream bank erosion, nature conservation, forestry and urban land. Loads for individual land uses should not be added.
Appendix 11 Anthropogenic baseline – total suspended solids – average annual modelled loads (1986–2009) exported by sub-catchments (tonnes per hectare per year) by land use
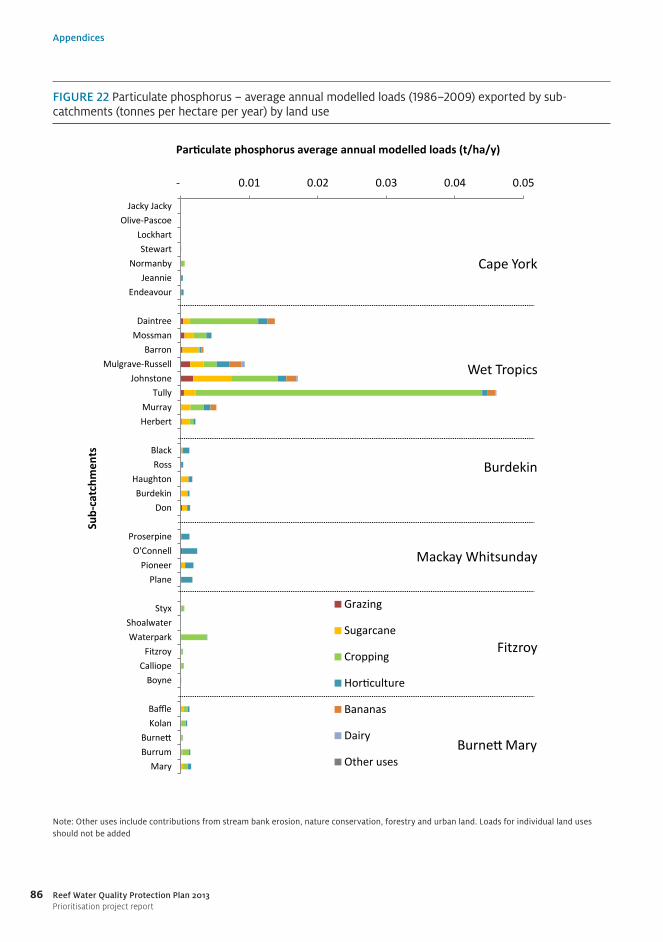
86
Appendices
Reef Water Quality Protection Plan 2013Prioritisation project report
FIGURE 22 Particulate phosphorus – average annual modelled loads (1986–2009) exported by sub-catchments (tonnes per hectare per year) by land use
Sub-
catc
hmen
ts
- 0.01 0.02 0.03 0.04 0.05
Jacky Jacky Olive-Pascoe
Lockhart Stewart
Normanby Jeannie
Endeavour
Daintree Mossman
Barron Mulgrave-Russell
Johnstone Tully
Murray Herbert
Black Ross
Haughton Burdekin
Don
Proserpine O'Connell
Pioneer Plane
Styx Shoalwater Waterpark
Fitzroy Calliope
Boyne
Baffle Kolan
Burnett Burrum
Mary
Particulate phosphorus average annual modelled loads (t/ha/y)
Grazing
Sugarcane
Cropping
Horticulture
Bananas
Dairy
Other uses
Cape York
Wet Tropics
Burdekin
Mackay Whitsunday
Fitzroy
Burnett Mary
Note: Other uses include contributions from stream bank erosion, nature conservation, forestry and urban land. Loads for individual land uses should not be added
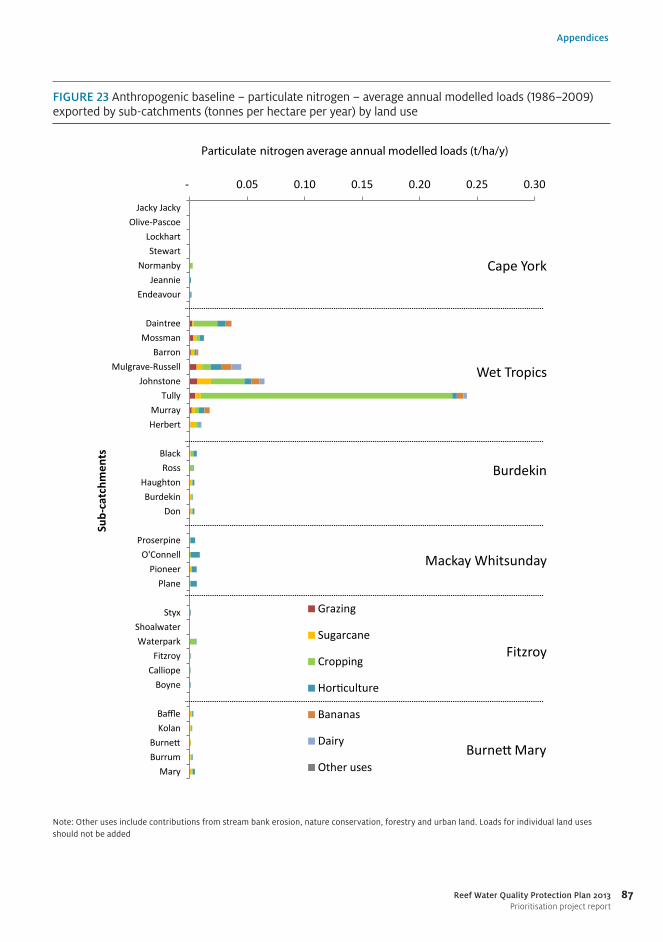
87
Appendices
Reef Water Quality Protection Plan 2013Prioritisation project report
FIGURE 23 Anthropogenic baseline – particulate nitrogen – average annual modelled loads (1986–2009) exported by sub-catchments (tonnes per hectare per year) by land use
Sub-
catc
hmen
ts
- 0.05 0.10 0.15 0.20 0.25 0.30
Jacky Jacky Olive-Pascoe
Lockhart Stewart
Normanby Jeannie
Endeavour
Daintree Mossman
Barron Mulgrave-Russell
Johnstone Tully
Murray Herbert
Black Ross
Haughton Burdekin
Don
Proserpine O'Connell
Pioneer Plane
Styx Shoalwater Waterpark
Fitzroy Calliope
Boyne
Baffle Kolan
Burnett Burrum
Mary
Particulate nitrogen average annual modelled loads (t/ha/y)
Grazing
Sugarcane
Cropping
Horticulture
Bananas
Dairy
Other uses
Cape York
Wet Tropics
Burdekin
Mackay Whitsunday
Fitzroy
Burnett Mary
Note: Other uses include contributions from stream bank erosion, nature conservation, forestry and urban land. Loads for individual land uses should not be added

88
Appendices
Reef Water Quality Protection Plan 2013Prioritisation project report
FIGURE 24 Anthropogenic baseline – dissolved inorganic nitrogen – average annual modelled loads (1986–2009) exported by sub-catchments (tonnes per hectare per year) by land use
Sub-
catc
hmen
ts
- 0.01 0.02 0.03 0.04 0.05 0.06 0.07
Jacky Jacky Olive-Pascoe
Lockhart Stewart
Normanby Jeannie
Endeavour
Daintree Mossman
Barron Mulgrave-Russell
Johnstone Tully
Murray Herbert
Black Ross
Haughton Burdekin
Don
Proserpine O'Connell
Pioneer Plane
Styx Shoalwater Waterpark
Fitzroy Calliope
Boyne
Baffle Kolan
Burnett Burrum
Mary
Dissolved inorganic nitrogen average annual modelled loads (t/ha/y)
Grazing
Sugarcane
Cropping
Horticulture
Bananas
Dairy
Other uses
Cape York
Wet Tropics
Burdekin
Mackay Whitsunday
Fitzroy
Burnett Mary
Note: Other uses include contributions from stream bank erosion, nature conservation, forestry and urban land. Loads for individual land uses should not be added
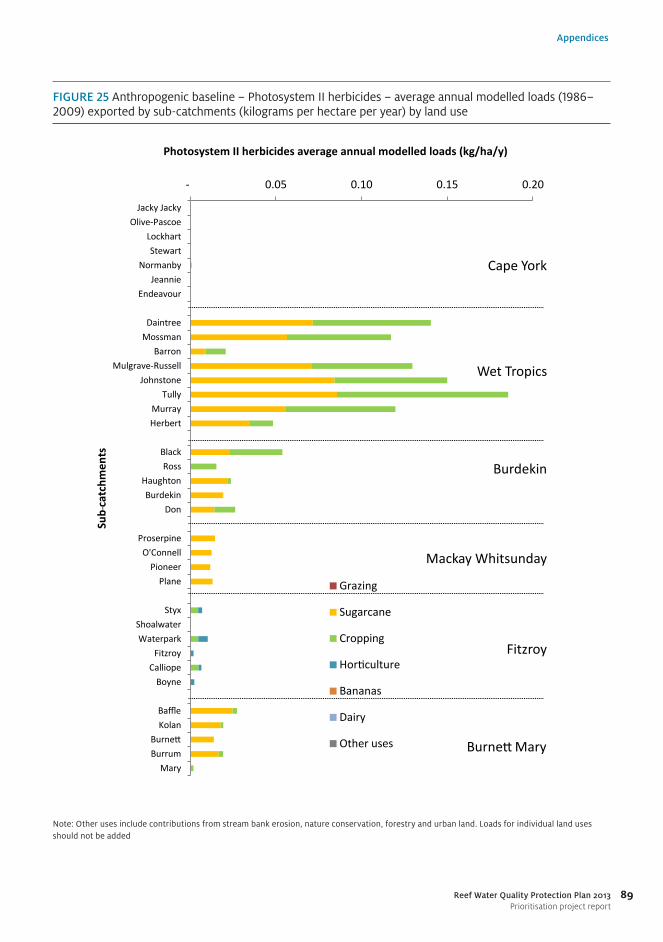
89
Appendices
Reef Water Quality Protection Plan 2013Prioritisation project report
FIGURE 25 Anthropogenic baseline – Photosystem II herbicides – average annual modelled loads (1986–2009) exported by sub-catchments (kilograms per hectare per year) by land use
- 0.05 0.10 0.15 0.20
Jacky Jacky Olive-Pascoe
Lockhart Stewart
Normanby Jeannie
Endeavour
Daintree Mossman
Barron Mulgrave-Russell
Johnstone Tully
Murray Herbert
Black Ross
Haughton Burdekin
Don
Proserpine O'Connell
Pioneer Plane
Styx Shoalwater Waterpark
Fitzroy Calliope
Boyne
Baffle Kolan
Burnett Burrum
Mary
Photosystem II herbicides average annual modelled loads (kg/ha/y)
Sub
catc
hmen
ts
Grazing
Sugarcane
Cropping
Horticulture
Bananas
Dairy
Other uses
Cape York
Wet Tropics
Burdekin
Mackay Whitsunday
Fitzroy
Burnett Mary
-
Note: Other uses include contributions from stream bank erosion, nature conservation, forestry and urban land. Loads for individual land uses should not be added

90
Appendices
Reef Water Quality Protection Plan 2013Prioritisation project report


