sequencing of dnase i hypersensitive sites (dnase-seq) is a powerful technique for identifying cis-regulatory elements across the genome. We studied the key experimental parameters to optimize performance of dnase-seq. sequencing short fragments of 50–100 base pairs (bp) that accumulate in long internucleosome linker regions was more efficient for identifying transcription factor binding sites compared to sequencing longer fragments. We also assessed the potential of dnase-seq to predict transcription factor occupancy via generation of nucleotide-resolution transcription factor footprints. in modeling the sequence-specific dnase i cutting bias, we found a strong effect that varied over more than two orders of magnitude. this indicates that the nucleotide-resolution cleavage patterns at many transcription factor binding sites are derived from intrinsic dnase i cleavage bias rather than from specific protein-dnA interactions. in contrast, quantitative comparison of dnase i hypersensitivity between states can predict transcription factor occupancy associated with particular biological perturbations.
DNase-seq adapts traditional DNase I footprinting1 and leverages modern DNA sequencing to identify regions of the genome where regulatory factors interact with DNA to modify chromatin struc-ture and gene transcription1–5. DNase-seq has been applied to map regulatory regions in diverse cell and tissue types, revealing cell- and lineage-specific regulators as well as regulatory regions that are present in various cell types5,6. These regulatory regions may also be used to help understand the biological role of non-coding genetic variants in physical traits and common diseases6,7. In addition, DNase-seq has been highly effective in comparing transcription factor (TF) binding profiles in treatment conditions relative to control conditions8–11.
To optimize DNase-seq and to characterize its biases, we stud-ied the key parameters of DNase I concentration and selected
refined dnase-seq protocol and data analysis reveals intrinsic bias in transcription factor footprint identificationHousheng Hansen He1–5,7, Clifford A Meyer1,3,7, Sheng’en Shawn Hu3,6,7, Mei-Wei Chen3, Chongzhi Zang1,3, Yin Liu3,6, Prakash K Rao3, Teng Fei1–3, Han Xu1,3, Henry Long3, X Shirley Liu1,3 & Myles Brown2,3
fragment size. We assessed the ability of DNase-seq to detect TF binding sites and to understand systematic biases that could influence interpretation of DNase-seq data. We also addressed the use of DNase-seq footprinting to discover TF binding sites at nucleo-tide resolution5,12. In our analysis of the genome-wide binding sites of 36 TFs, we found that although footprinting data from DNase-seq were informative for some TFs such as CTCF, such data were uninformative for many others such as the androgen receptor (AR). We show that intrinsic DNase I cutting biases, a factor that had not been adequately accounted for in previous footprinting studies, can be incorrectly interpreted as patterns induced by TF binding.
resultsFragment size and enzyme concentration influence dnase-seqTo determine optimal DNase I digestion conditions for obtaining high-quality, reproducible, DNase-seq data sets so that genome-wide TF binding sites can be identified, we used nominal DNase I amounts of 5 units (U), 25 U, 50 U, 75 U and 100 U per 500-µl reac-tion and selected for subsequent sequencing fragments of 50–100 bp, 100–200 bp and 200–300 bp (Supplementary Fig. 1). We found high concordance between replicates (Supplementary Fig. 2).
We compared the overlap of DNase-seq peaks identified by model-based analysis of ChIP-seq (MACS)13 in the prostate cancer cell line, LNCaP, with high-confidence CTCF and AR ChIP-seq peaks in the same cell line. At a read depth downsampled to 15 million mapped reads, analysis of short fragments (50–100 bp) recovered a greater proportion of known sites than that of inter-mediate fragments (100–200 bp) and long fragments (200–300 bp) (Fig. 1a). We observed a similar trend for FOXA1 and the enhancer- and promoter-associated histone modification H3K4me2 (Supplementary Fig. 3). Digestion with 25 U and 50 U of DNase I performed best for analyses of various fragment lengths, regardless of sequencing depth (Fig. 1). Moreover, the use of longer fragments (100–200 bp or 200–300 bp) would require
1Department of Biostatistics and Computational Biology, Dana-Farber Cancer Institute and Harvard School of Public Health, Boston, Massachusetts, USA. 2Department of Medical Oncology, Dana-Farber Cancer Institute and Harvard Medical School, Boston, Massachusetts, USA. 3Center for Functional Cancer Epigenetics, Dana-Farber Cancer Institute, Boston, Massachusetts, USA. 4Ontario Cancer Institute, Princess Margaret Cancer Center–University Health Network, Toronto, Ontario, Canada. 5Department of Medical Biophysics, University of Toronto, Toronto, Ontario, Canada. 6Department of Bioinformatics, School of Life Science and Technology, Tongji University, Shanghai, China. 7These authors contributed equally to this work. Correspondence should be addressed to M.B. ([email protected]), X.S.L. ([email protected]) or H.L. ([email protected]).Received 17 June; accepted 30 OctObeR; published Online 8 decembeR 2013; dOi:10.1038/nmeth.2762
many fold greater sequencing depth to find the sites found using the 50–100-bp frag-ments. Sites that were not detected usually had lower ChIP-seq signal and were less likely to be identified as strong ChIP-seq peaks (Supplementary Fig. 4). Across ChIP-seq binding sites, as DNase I hypersensitive (DHS) signal decreased in data for digest with 5 U DNase I and 50–100-bp fragments, so did the DHS signal for all other experimental conditions (Supplementary Fig. 5). Pooling samples prepared under suboptimal conditions decreased performance (Supplementary Fig. 6). In MCF-7 cells, the optimal conditions for DNase-seq to identify estrogen receptor (ER) and CTCF binding sites were similar to those found in LNCaP cells (Supplementary Fig. 7).
internucleosome spacing filters dnase-seq fragmentsTo probe chromatin structural effects that underlie fragment size differences, we examined strand-specific DNase-seq read distri-butions as a function of the distance from experimentally identi-fied H3K4me2-marked nucleosome centers (Fig. 2)14. We found notable differences in the patterns produced by sequencing dif-ferent fragment sizes, although the nucleosome-occupied region was depleted of cuts in all cases. The 50–100-bp fragments, being shorter than the 147 bp of DNA associated with a nucleosome, cannot span a nucleosome, and therefore are constrained to lie in the linker regions between two nucleosomes (Fig. 2a). Of the intermediate-size fragments (100–200 bp), a proportion between 147 bp and 200 bp can span a nucleosome; therefore, the 100–200-bp fragments are likely to have cuts in adjacent linker regions flanking a nucleosome (Fig. 2b). The long fragments (200–300 bp) also had cut sites in adjacent linkers where the linkers might span slightly broader nucleosome-depleted regions (Fig. 2c). This suggests that internucleosomal linker length influences the fragment-size
distribution at a locus. To test this, we selected pairs of positioned nucleosomes, identified by micrococcal nuclease digest followed by chromatin immunoprecipitation of H3K4me2 and sequencing (MNase–ChIP-seq)14, separated from each other by an internu-cleosomal linker length of 20–50 bp, too short to accommodate entire 50–100-bp DNase I digestion fragments. Consistently, we noted a depletion of cuts from this fragment range in these linker regions (Fig. 2d). Longer fragments can span the nucleosomes, and accordingly we saw cuts from the 100–200-bp and 200–300-bp fragment ranges inside these short linker regions (Fig. 2e,f). After extension of the linker lengths to 100–130 bp, both ends of 50–100 bp fragments could, in principle, be accommodated in the linker, and we saw that the cut sites from the short fragments were enriched in these longer linker regions (Fig. 2g) along with the ends of the longer fragments (Fig. 2h,i). DNase-seq tag density is therefore not simply a measure of DNA accessibility but is a function of the relative probability of cleaving both DNA strands at two loci separated by a narrow genomic interval. Genomic loci that are compatible with nucleosome-spanning fragments are more common than long linker regions needed to accommodate 50–100-bp fragments. The scarcity of these longer linker regions and their overlap with TF binding sites accounts for the efficiency of the 50–100-bp fragments.
To examine fragment size effects at a higher resolution, we con-ducted paired-end sequencing of DNase I–digested chromatin (50 U DNase I). The fragment-size distribution was dominated by a periodicity of ~10.4 bp (Fig. 3a), consistent with one com-plete turn of the double helix, and may be attributed to the acces-sibility of the minor groove of nucleosome-associated DNA15. We observed the periodic pattern in fragments longer than the
nucleosome size, 147 bp, and a phase shift between subnucleosomal and supernu-cleosomal patterns (Fig. 3a). This pattern may represent a dominant signal coming from heterochromatic regions with a rela-tively fixed linker length16. Fragments that
0 5 10 15 20 25 30
0
0.2
0.4
0.6
0.8
1.0
Reads sampled fromDNase-seq (M)
AR a
5
25
50
75
100
50−1
00
100−
200
200−
300
CTCF
50−1
00
100−
200
200−
300
AR
Fragment size (bp)
Am
ount
of D
Nas
e I (
U)
00.10.20.30.40.50.60.70.80.91.0
Pro
port
ion
of b
indi
ng s
ites
dete
cted
by
DN
ase-
seq
b
0 5 10 15 20 25 30
0
0.2
0.4
0.6
0.8
1.0
Reads sampled fromDNase-seq (M)
Fra
ctio
n of
TF
pea
ksov
erla
ppin
g w
ith D
HS
pea
ks
50 U, 50−100 bp50 U, 100−200 bp50 U, 200−300 bp
CTCFFigure 1 | Effect of digestion level and fragment size on recovery of known TF binding sites. (a) Proportion of 10,000 ChIP-seq–enriched regions discovered as DHS sites for CTCF and AR in LNCaP cells. (b) Influence of read depth and fragment size on the overlap between TF binding sites and DHS sites.
Ave
rage
DH
Ssi
gnal
−1,000 −500 0 500 1,000
Relative distance from the center (bp)of nucleosome
50–100 bp
100–200 bp
200–300 bp
Ave
rage
DH
Ssi
gnal
Ave
rage
DH
Ssi
gnal
0.20
0.25
0.30
0.08
0.12
0.16
0.30
0.40
50–100 bp
100–200 bp
200–300 bp
−1,000 −500 0 500 1,000
0.20
0.30
0.40
0.08
0.12
0.16
0.20
0.30
0.40
50–100 bp
100–200 bp
200–300 bp
−1,000 −500 0 500 1,000
PlusMinus
da g
eb h
fc i
0.20
0.30
0.40
0.12
0.16
0.20
0.30
0.40
0.50
0.60
Relative distance from the center (bp)of nucleosome
Relative distance from the center (bp)of nucleosome
Figure 2 | Nucleosome-positioning effects on DNase-seq results. (a–c) Distributions of 5′ ends of DNase-seq reads relative to the center of nucleosomes (dashed lines) identified by MNase digestion and H3K4me2 immunoprecipation14 for fragments of 50–100 bp (a), 100–200 bp (b) and 200–300 bp (c) in LNCaP cells. (d–i) Distributions of 5′ ends of DNase-seq reads from fragments of 50–100 bp (d,g), 100–200 bp (e,h) and 200–300 bp (f,i) relative to 35,244 pairs of nucleosomes selected to have short, 20–50 bp, internucleosomal linkers (d–f) and relative to 16,684 nucleosome pairs with longer, 100–130 bp, linkers (g–i).
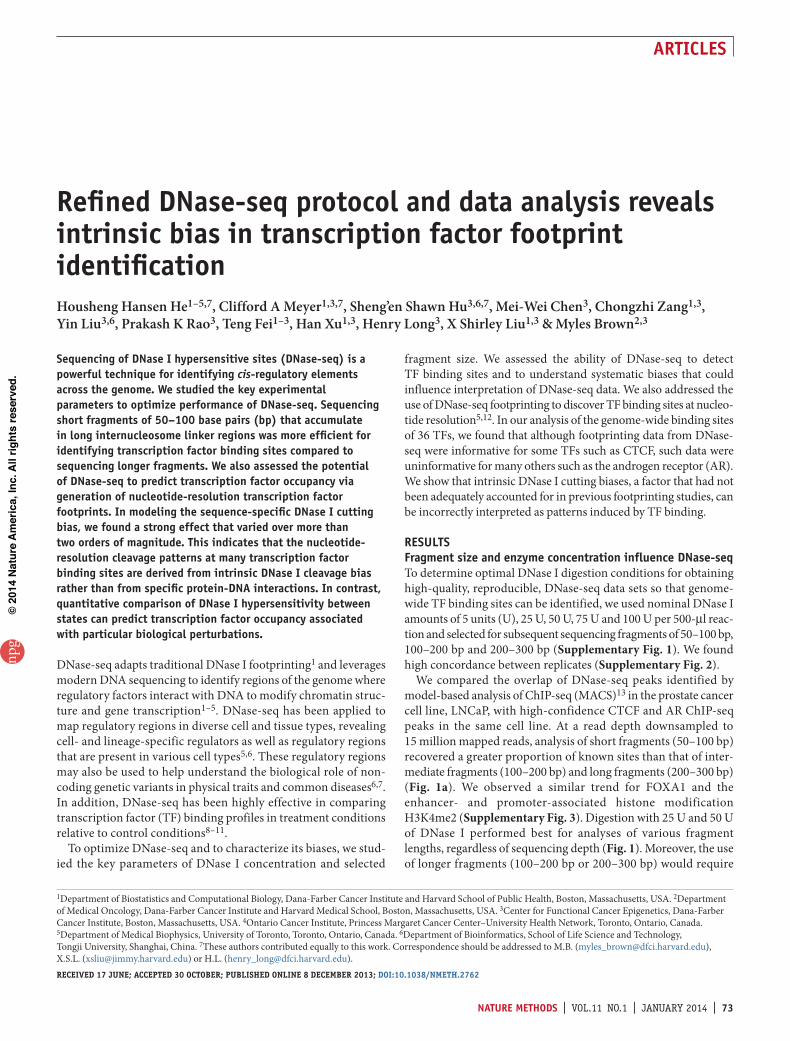
overlap with DNase-seq peaks showed a weaker periodic pattern (Fig. 3a), suggesting that the periodic pattern arises primarily from fragments distributed widely across the genome and not at clustered DHS regions. As a function of fragment length the proportion of reads that fall into the DHS regions was strongly biased toward the shorter ones (Fig. 3a). Paired-end or full-length sequencing of DNase-seq fragments allowed precise characterization of fragment size distribution and filtering of amplification artifacts while retaining multiple hits at the same nucleotide (Fig. 3b).
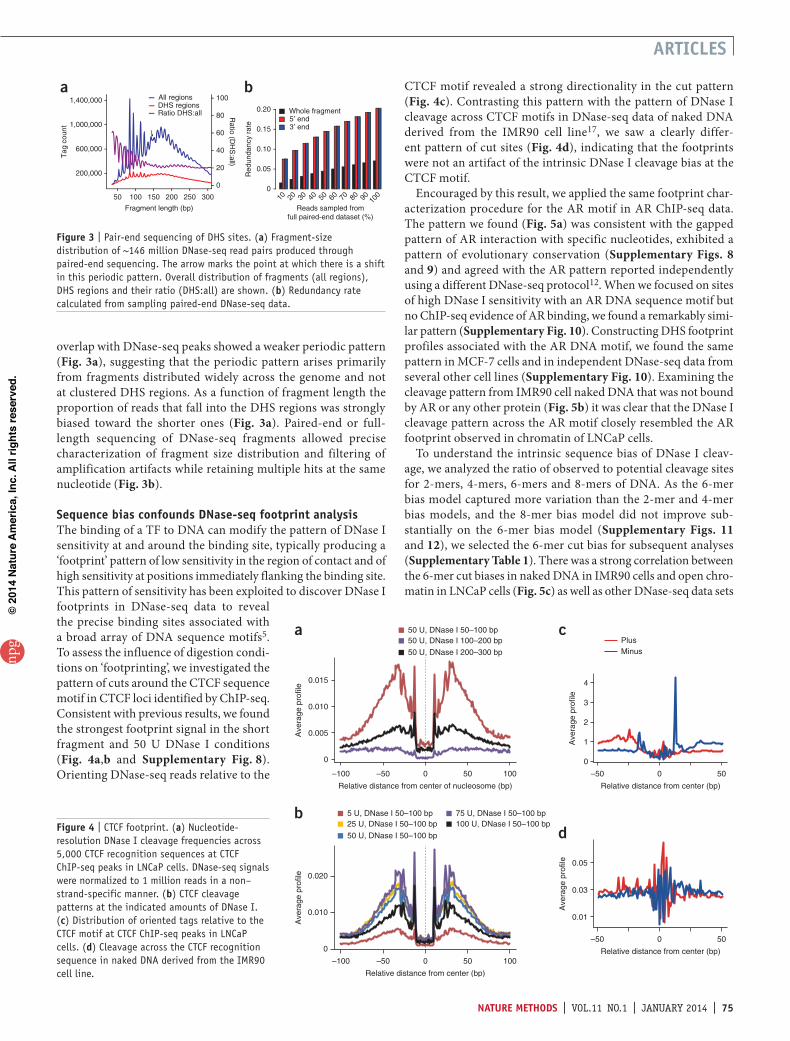
sequence bias confounds dnase-seq footprint analysisThe binding of a TF to DNA can modify the pattern of DNase I sensitivity at and around the binding site, typically producing a ‘footprint’ pattern of low sensitivity in the region of contact and of high sensitivity at positions immediately flanking the binding site. This pattern of sensitivity has been exploited to discover DNase I footprints in DNase-seq data to reveal the precise binding sites associated with a broad array of DNA sequence motifs5. To assess the influence of digestion condi-tions on ‘footprinting’, we investigated the pattern of cuts around the CTCF sequence motif in CTCF loci identified by ChIP-seq. Consistent with previous results, we found the strongest footprint signal in the short fragment and 50 U DNase I conditions (Fig. 4a,b and Supplementary Fig. 8). Orienting DNase-seq reads relative to the
CTCF motif revealed a strong directionality in the cut pattern (Fig. 4c). Contrasting this pattern with the pattern of DNase I cleavage across CTCF motifs in DNase-seq data of naked DNA derived from the IMR90 cell line17, we saw a clearly differ-ent pattern of cut sites (Fig. 4d), indicating that the footprints were not an artifact of the intrinsic DNase I cleavage bias at the CTCF motif.
Encouraged by this result, we applied the same footprint char-acterization procedure for the AR motif in AR ChIP-seq data. The pattern we found (Fig. 5a) was consistent with the gapped pattern of AR interaction with specific nucleotides, exhibited a pattern of evolutionary conservation (Supplementary Figs. 8 and 9) and agreed with the AR pattern reported independently using a different DNase-seq protocol12. When we focused on sites of high DNase I sensitivity with an AR DNA sequence motif but no ChIP-seq evidence of AR binding, we found a remarkably simi-lar pattern (Supplementary Fig. 10). Constructing DHS footprint profiles associated with the AR DNA motif, we found the same pattern in MCF-7 cells and in independent DNase-seq data from several other cell lines (Supplementary Fig. 10). Examining the cleavage pattern from IMR90 cell naked DNA that was not bound by AR or any other protein (Fig. 5b) it was clear that the DNase I cleavage pattern across the AR motif closely resembled the AR footprint observed in chromatin of LNCaP cells.
To understand the intrinsic sequence bias of DNase I cleav-age, we analyzed the ratio of observed to potential cleavage sites for 2-mers, 4-mers, 6-mers and 8-mers of DNA. As the 6-mer bias model captured more variation than the 2-mer and 4-mer bias models, and the 8-mer bias model did not improve sub-stantially on the 6-mer bias model (Supplementary Figs. 11 and 12), we selected the 6-mer cut bias for subsequent analyses (Supplementary Table 1). There was a strong correlation between the 6-mer cut biases in naked DNA in IMR90 cells and open chro-matin in LNCaP cells (Fig. 5c) as well as other DNase-seq data sets
50 100 150 200 250 300
200,000
600,000
1,000,000
1,400,000
Fragment length (bp)
Tag
cou
nt
0
20
40
60
80
100All regionsDHS regionsRatio DHS:all
a b
10 20 30 40 50 60 70 80 90 100
Whole fragment5′ end3′ end
Reads sampled fromfull paired-end dataset (%)
Red
unda
ncy
rate
0
0.05
0.10
0.15
0.20
Ratio (D
HS
:all)
Figure 3 | Pair-end sequencing of DHS sites. (a) Fragment-size distribution of ~146 million DNase-seq read pairs produced through paired-end sequencing. The arrow marks the point at which there is a shift in this periodic pattern. Overall distribution of fragments (all regions), DHS regions and their ratio (DHS:all) are shown. (b) Redundancy rate calculated from sampling paired-end DNase-seq data.
–100 –50 0 50 100
0
0.005
0.010
0.015
Relative distance from center of nucleosome (bp)
50 U, DNase I 50–100 bp50 U, DNase I 100–200 bp
50 U, DNase I 200–300 bp
Ave
rage
pro
file
a
–100 –50 0 50 100
0
0.010
0.020
Relative distance from center (bp)
Ave
rage
pro
file
5 U, DNase I 50–100 bp25 U, DNase I 50–100 bp
50 U, DNase I 50–100 bp
75 U, DNase I 50–100 bp100 U, DNase I 50–100 bp
b
Relative distance from center (bp)
0
1
2
3
4
0 50
PlusMinus
–50
Ave
rage
pro
file
c
Relative distance from center (bp)
0.01
0.03
0.05
0 50–50
Ave
rage
pro
file
dFigure 4 | CTCF footprint. (a) Nucleotide-resolution DNase I cleavage frequencies across 5,000 CTCF recognition sequences at CTCF ChIP-seq peaks in LNCaP cells. DNase-seq signals were normalized to 1 million reads in a non– strand-specific manner. (b) CTCF cleavage patterns at the indicated amounts of DNase I. (c) Distribution of oriented tags relative to the CTCF motif at CTCF ChIP-seq peaks in LNCaP cells. (d) Cleavage across the CTCF recognition sequence in naked DNA derived from the IMR90 cell line.
(Supplementary Fig. 13). This correlation between different sam-ples was higher than the correlation between forward-strand cuts on the 6-mers of DNA and forward-stand cuts on their reverse complements in the same naked DNA sample (Fig. 5d), suggest-ing the strand-oriented nature of the bias owing to the single-stranded nicking action of DNase I (ref. 18). This phenomenon was not limited to data obtained using cyanase or benzo-nase instead of DNase I, although the precise nature of the sequence bias varies between DNase I and the other nucleases19 (Supplementary Fig. 14). Using the 6-mer model, we predicted cut profiles at AR and CTCF binding sites (Fig. 5e,f). Although this model predicted cleavage patterns in chromatin at AR bind-ing sites, it did not predict the CTCF footprint at CTCF binding sites and would have a minimal impact on CTCF footprint dis-covery (Supplementary Fig. 15). We found the DNase-seq cleav-age pattern of p53, which closely resembled the one previously reported5, was also very similar to cleavage patterns derived from both naked DNA and the 6-mer model (Fig. 5g–i), suggesting that it is more likely to be a product of intrinsic sequence bias rather than protein-binding effects.
Footprinting quality is factor-dependentWe next asked whether most TFs display strong DNase-seq foot-prints or footprints that are virtually indistinguishable from the naked DNA background. We assessed the DNase-seq footprints of 34 TFs with ChIP-seq data and well-defined binding motifs20 in the K562 cell line21, along with those of AR in LNCaP cells and the glucocorticoid receptor (GR) in mouse mammary 3134 cells. For each of the 36 TFs we used two methods to predict whether a fac-tor’s sequence motif occurrence in the genome would be enriched
in the ChIP-seq data. The first prediction was based simply on the number of DNase-seq tags (DHS; Fig. 6a) falling in a 200-bp window centered on the TF recognition sequence. The second was based on the DNase I footprint score based on the ratio of reads in the regions flanking the TF motif over the motif center regions (Online Methods). For each of the 36 factors, we plotted a receiver operating characteristic (ROC) curve as illustrated for CTCF (Fig. 6a). For CTCF, the footprint score outperformed tag count at low false positive rates and underperformed at higher ones. To summarize the performance of the footprint score rela-tive to the tag count at low false positive rates, where it performed best, we calculated the ratio of the area under the curve (AUC) for the footprint score to the AUC for the DNase-seq tag count for false positive rates from 0 to 0.1.
We next examined the ratio of footprint score AUC to DNase-seq tag count AUC at low false positive rates for the 36 TFs versus the correlation between the observed DNase I cleavage pattern and the 6-mer predicted background cleavage pattern (Fig. 6b and Supplementary Table 2). We found that the strength of the foot-print (F test; P < 10−4; Supplementary Fig. 16a) as well as footprint performance (F test; P < 10−5; Fig. 6b) were inversely related to the correlation between the observed DNase I cleavage and intrinsic bias. With the exception of CTCF at false positive rates <0.04, the footprint score performed worse than the DNase-seq tag count at all points on the ROC curve for all of the factors analyzed.
To test whether there was residual footprint signal after adjusting for DNase I cutting bias, we normalized the cleavage signal, taking the 6-mer bias into account, and compared this result with a similar uniform normalization that assumes all 6-mers are cut with equal likelihood (Supplementary Fig. 17).
Figure 5 | DNase I cleavage bias as revealed by AR and P53 binding. (a,b) DNase cleavage across 4,691 AR ChIP-seq–enriched AR recognition sequences in LNCaP cells (a) and in naked DNA from IMR90 cells17 (b). (c) Cleavage ratio of the number of observed cleavage sites between the third and fourth bases of that 6-mer relative to the number of such 6-mers in the mappable genome for each possible DNA 6-mer (Pearson correlation of log ratios = 0.86). (d) Cleavage ratios for 6-mers in DNase I–digested naked DNA and their reverse complements (Pearson correlation of log ratios = 0.53). (e,f) The DNase I cleavage pattern predicted from DNA sequence at the AR sites in a, using the 6-mer model of intrinsic DNase I cleavage bias (e), and at the CTCF binding sites in LNCaP cells (f). (g) Observed DNase I cleavage pattern in chromatin of K562 cells at imputed p53 binding sites. (h,i) DNase I cleavage pattern produced from naked DNA of IMR90 cells (h), and the pattern predicted (i) from the 6-mer model of intrinsic DNase I cleavage bias at the p53 sites used in g.
DNase I footprint patterns in human cell lines and in mouse liver5. On that basis, it had been claimed that these motifs cor-respond to transcriptional regulatory factors that are evolution-arily conserved between the two species. We found that cleavage patterns in embryonic stem (ES) cell line H7 for the de novo motifs UW.Motif.0500 and UW.Motif.0458 (Online Methods), which had been reported5 to be ES cell type–specific, were nearly identical to the 6-mer prediction as well as the naked DNA pat-tern (Fig. 6c). We made the same observation in K562 cells and mouse liver (Supplementary Fig. 19). Whereas the known motifs with informative footprints, such as CTCF, tended to be weakly correlated with predicted bias, all 15 of the de novo motifs showed strong correlation coefficients in the H7 ES cell and K562 cell lines (Supplementary Fig. 20). The similarity of footprint patterns between human and mouse that had been reported as a sign of conserved TF activity5 may be the result of DNase I cleav-age bias instead (Supplementary Figs. 14g and 19). Although this analysis shows that DNase-seq–derived footprinting does not support the identity of these motifs, it does not rule out the possibility that other unidentified cell type–specific motifs may be present in DHS regions. In contrast, quantitative compari-son of DNase I hypersensitivity between conditions (∆DHS)11 predicted differences in TF occupancy for factors such as AR (Fig. 6d) and GR (Supplementary Fig. 21).
Tru
e po
sitiv
e ra
te
0 0.2 0.4 0.6 0.8 1.0
0
0.2
0.4
0.6
0.8
1.0
DHSFootprint score
False positive rate
Tru
e po
sitiv
e ra
te
0 0.02 0.04 0.06 0.08 0.10
0
0.2
0.4
0.6
0.8
1.0 DHS
Footprint score
a c UW.Motif.0500DNase cleavage in H7-hESC
0.4
0.8
1.2
0
0.04
0.2
0.4
Ave
rage
pro
file
Ave
rage
pro
file
Ave
rage
pro
file
0
0.2
0.4
0.6
0
0.02
0.04
0
0.2
0.4
−25 0 25 −25 0 25Relative distance from
center of motif (bp)Relative distance from
center of motif (bp)
PlusMinus
DNase cutting bias in H7-hESC
DNase cleavage in IMR90 naked DNA
UW.Motif.0458DNase cleavage in H7-hESC
DNase cleavage in IMR90 naked DNA
DNase cutting bias in H7-hESCF
ootp
rint s
core
AU
C/ta
g co
unt A
UC
(F
PR
< 0
.1)
Pearson correlation betweenobserved and predicted cleavage
b
–0.2 0 0.2 0.4 0.6 0.8 1.0
0
0.2
0.4
0.6
0.8
1.0 P < 10–5 , R2 = 0.4673
m3134 GR
CTCF
LNCaP AR
JUN
SP1
NRF-1
FOS
ZBTB33
Tru
e po
sitiv
e ra
te
0 0.2 0.4 0.6 0.8 1.0
0
0.2
0.4
0.6
0.8
1.0
False positive rate
Tru
e po
sitiv
e ra
te0.00 0.02 0.04 0.06 0.08 0.10
0
0.2
0.4
0.6
0.8
1.0
DHS
Footprint score∆DHS
d
DHS
Footprint score∆DHS
Figure 6 | Predicting TF binding from DNase-seq tag count and footprint score. (a) Full ROC curve (top) and ROC curve up to a false positive rate of 0.1 (bottom) comparing the performance of the DNase-seq footprint score (AUC = 0.91) with the absolute DNase-seq tag count in a 200-bp window (DHS; AUC = 0.79). Shaded regions represent the areas under the respective absolute DNase-seq tag count (DHS) and footprint score ROC curves for indicated false positive rates. (b) Relationship between performance of footprint score prediction and the correlation of DNase-seq cleavage with sequence bias. For 36 transcription factors with known DNA-binding motifs and ChIP-seq data, we constructed ROC curves as in a. y axis represents the footprint score relative to tag count performance as the ratio of the footprint score AUC to the tag count AUC for false positive rates (FPRs) < 0.1. For CTCF, this is the ratio of blue to red shaded areas in a. x axis represents the Pearson correlation between the observed DNase I cleavage pattern and that predicted from the 6-mer intrinsic bias model. (c) Comparison of observed, predicted and naked DNA cleavage bias in de novo motifs UW.Motif.0500 (57,941 regions) and UW.Motif.0458 (30,772 regions). (d) Full ROC curve (top) and ROC curve up to a false positive rate of 0.1 (bottom) for AR in LNCaP cells, comparing the performance of the DNase-seq footprint (AUC = 0.50) with the absolute tag count (DHS; AUC = 0.94) and the ∆ DHS score (AUC = 0.88)11.
Modeling 6-mer bias dampened most of the cleavage signal across AR and SP1 binding sites (motif and ChIP-seq peak; Supplementary Fig. 17a,b). The different normalizations across CTCF sites had little effect on the cleavage pattern (Supplementary Fig. 17c). For JUN and ZBTB33 the normali-zation reduced the bias-induced signal, revealing a trough-like footprint (Supplementary Fig. 17d,e). A sequence-bias normali-zation of the footprint score did not improve performance of the TF binding site prediction (Supplementary Fig. 16c). Although improved analysis techniques may improve the performance of prediction for factors that have footprints different from the underlying nuclease cleavage bias, our analysis found that there are a substantial number of TFs such as AR that leave negligi-ble footprints in DNase-seq data obtained by current methods (Fig. 6b). Although we did not observe DNase I footprints at AR motifs in AR ChIP-seq peaks, we found many instances of DNase I footprints at CTCF and NRF1 motifs in AR ChIP-seq peak regions (Supplementary Fig. 18).
Recently DNase-seq has been used to identify 289 regula-tory factor DNA-binding motifs that are not represented in the major motif databases: TRANSFAC database of transcription factor binding sites, Jaspar transcription factor binding profile database and UniPROBE database of DNA-binding proteins5. Many of these motifs were reported to display nearly identical
discussionIn optimizing the DNase-seq protocol, we found short 50–100 bp fragments to be more efficient than longer fragments for identify-ing TF binding sites. This we ascribed to the compatibility of these short fragments with the long internucleosomal linker regions that are associated with TF binding and their incompatibility with short internucleosomal linker lengths that are more broadly distributed across the genome. Comparing DNase-seq read counts between treatment and control conditions appears to be the most informa-tive strategy for identifying differentially used enhancers.
Previous work on DNase-seq footprint detection revealed the effect of intrinsic sequence bias to be minimal5. These prior find-ings may have resulted from a combination of inaccurate charac-terization of DNase I cleavage bias, the adoption of null models that underestimated the variability of DNase-seq read counts and inadequate computational control experiments. We found that the effects of DNase I sequence bias were abundantly clear in the analysis of cleavage patterns in aggregate, with DNA lined up by specific sequence motifs. Using this approach, we found a very high correlation between the motif ‘footprints’ reported in ES cells5 and the DNase I cleavage bias, suggesting that these footprints may be artifacts rather than evidence of previously uni-dentified motifs of TF binding.
Our analysis of DNase-seq data and ChIP-seq data for 36 TFs showed that the efficiency of DNase I footprints in recovering TF binding sites was associated with the extent to which the observed cleavage pattern differs from the intrinsic cleavage bias. The strong influence of DNA sequence on DNase I cleavage effi-ciency has been associated with the width of the minor groove17. The interactions between TFs and DNA in permitting or hinder-ing DNase I cleavage may account for the variety of footprinting effects. Alternatively, TF-DNA interaction durations in vivo might vary greatly between TFs8. Current DNase-seq methods do not allow these alternatives to be distinguished, which calls for new methods to probe TF occupancy in vivo at high spatial and tem-poral resolution.
methodsMethods and any associated references are available in the online version of the paper.
Accession codes. Short Read Archive: GSE51915 (LNCaP cell and MCF-7 cell DNase-seq raw fastq and processed bed files).
Note: Any Supplementary Information and Source Data files are available in the online version of the paper.
AcknoWledgmentsThis work was supported by grants from the US National Institutes of Health (1R01 GM099409 to X.S.L.; 1U41 HG007000 to X.S.L. and C.A.M.; 2P50 CA090381-06 to C.A.M. and M.B.; 2R01 DK074967-06 to M.B. and X.S.L., 1K99CA172948-01 to H.H.H.); the Mazzone Award (to X.S.L.), the Department of Defense (W81XWH-10-1-0557 to H.H.H.) and the Prostate Cancer Foundation (to M.B.).
Author contriButionsH.H.H., C.A.M., H.L., X.S.L. and M.B. designed the experiments and wrote the manuscript. M.-W.C. and H.H.H. performed the experiments with the help from Y.L., P.K.R. and T.F. C.A.M., S.S.H. and H.H.H. conducted the data analysis with the help from C.Z. and H.X.
comPeting FinAnciAl interestsThe authors declare no competing financial interests.
reprints and permissions information is available online at http://www.nature.com/reprints/index.html.
1. Galas, D.J. & Schmitz, A. DNAse footprinting: a simple method for the detection of protein-DNA binding specificity. Nucleic Acids Res. 5, 3157–3170 (1978).
2. Song, L. et al. Open chromatin defined by DNase I and FAIRE identifies regulatory elements that shape cell-type identity. Genome Res. 21, 1757–1767 (2011).
3. Boyle, A.P. et al. High-resolution genome-wide in vivo footprinting of diverse transcription factors in human cells. Genome Res. 21, 456–464 (2011).
4. Degner, J.F. et al. DNase I sensitivity QTLs are a major determinant of human expression variation. Nature 482, 390–394 (2012).
5. Neph, S. et al. An expansive human regulatory lexicon encoded in transcription factor footprints. Nature 489, 83–90 (2012).
6. Thurman, R.E. et al. The accessible chromatin landscape of the human genome. Nature 489, 75–82 (2012).
7. Maurano, M.T. et al. Systematic localization of common disease-associated variation in regulatory DNA. Science 337, 1190–1195 (2012).
8. Voss, T.C. et al. Dynamic exchange at regulatory elements during chromatin remodeling underlies assisted loading mechanism. Cell 146, 544–554 (2011).
9. Ling, G., Sugathan, A., Mazor, T., Fraenkel, E. & Waxman, D.J. Unbiased, genome-wide in vivo mapping of transcriptional regulatory elements reveals sex differences in chromatin structure associated with sex-specific liver gene expression. Mol. Cell Biol. 30, 5531–5544 (2010).
10. John, S. et al. Chromatin accessibility pre-determines glucocorticoid receptor binding patterns. Nat. Genet. 43, 264–268 (2011).
11. He, H.H. et al. Differential DNase I hypersensitivity reveals factor-dependent chromatin dynamics. Genome Res. 22, 1015–1025 (2012).
12. Tewari, A.K. et al. Chromatin accessibility reveals insights into androgen receptor activation and transcriptional specificity. Genome Biol. 13, R88 (2012).
13. Zhang, Y. et al. Model-based analysis of ChIP-Seq (MACS). Genome Biol. 9, R137 (2008).
15. Gaffney, D.J. et al. Controls of nucleosome positioning in the human genome. PLoS Genet. 8, e1003036 (2012).
16. Luger, K., Dechassa, M.L. & Tremethick, D.J. New insights into nucleosome and chromatin structure: an ordered state or a disordered affair? Nat. Rev. Mol. Cell Biol. 13, 436–447 (2012).
17. Lazarovici, A. et al. Probing DNA shape and methylation state on a genomic scale with DNase I. Proc. Natl. Acad. Sci. USA 110, 6376–6381 (2013).
18. Campbell, V.W. & Jackson, D.A. The effect of divalent cations on the mode of action of DNase I. The initial reaction products produced from covalently closed circular DNA. J. Biol. Chem. 255, 3726–3735 (1980).
19. Grontved, L. et al. Rapid genome-scale mapping of chromatin accessibility in tissue. Epigenetics Chromatin 5, 10 (2012).
20. Matys, V. et al. TRANSFAC and its module TRANSCompel: transcriptional gene regulation in eukaryotes. Nucleic Acids Res. 34, D108–D110 (2006).
21. ENCODE Project Consortium. et al. An integrated encyclopedia of DNA elements in the human genome. Nature 489, 57–74 (2012).
online methodsData used in analyses. CTCF ChIP-seq data in K562 cells and LNCaP cells from Encyclopedia of DNA Elements (ENCODE) were obtained from Gene Expression Omnibus accession codes GSE32465, GSE31477, GSE30263 and GSM822289; AR ChIP-seq data in LNCaP cells were obtained from GSM353644; TP53 ChIP-seq data in Saos-2 cells were obtained from GSE15780; DNase data in K562 cells from ENCODE were obtained from GSM646567; DNase data for naked DNA of IMR90 cells were from DNA Data Bank of Japan, SRA068503; mouse DNase I, benzonase and cyanase data were from GSE39982. ER and CTCF data in MCF-7 cells were from http://cistrome.dfci.harvard.edu/NR_Cistrome. De novo motifs identified in ref. 5 were downloaded from ftp://ftp.ebi.ac.uk/pub/databases/ensembl/encode/supplementary/integration_data_jan2011/byDataType/ footprints/jan2011/de.novo.pwm.
No statistical method was used to predetermine sample size.
Cell line and culture conditions. The prostate cancer cell line LNCaP and breast cancer cell line MCF7 were obtained from the American Type Culture Collection. LNCaP cells were main-tained in RPMI 1640 medium supplemented with 10% FBS, 2 mM glutamine, 100 U/ml penicillin and 100 mg/ml strepto-mycin. MCF-7 cells were maintained in DMEM supplemented with 10% FBS, 2 mM glutamine, 100 U/ml penicillin and 100 mg/ml streptomycin. LNCaP and MCF-7 cells were starved in phenol red–free medium supplemented with 10% charcoal-stripped FBS for 3 d before stimulation with hormone.
DNase I hypersensitivity mapping. DNase I hypersensitivity mapping was performed as previously described with brief modi-fications9–11. LNCaP cells were starved for 3 d in phenol red–free medium supplemented with 10% charcoal-stripped FBS and then treated with ethanol or active androgen 5α-dihydrotestosterone (DHT) at a final concentration of 10 nM for 4 h. MCF-7 cells were starved the same way and then treated with ethanol or 17β-estrodial (E2) at a final concentration of 10 nM for 45 min. The cells were trypsinized and pelleted before washing and resuspension in buffer A (15 mM Tris-Cl (pH 8.0), 15 mM NaCl, 60 mM KCl, 1 mM EDTA (pH 8.0), 0.5 mM EGTA (pH 8.0), 0.5 mM spermi-dine and 0.15 mM spermine). Nuclei were extracted by adding buffer A containing NP-40. The nuclei were washed with buffer A and resuspended in prewarmed lysis buffer at a concentration of 5 M/ml and then digested with different amounts of DNase I for 5 min at 37 °C. The reactions were terminated by the addi-tion of an equal volume of stop buffer and incubated at 55 °C. After 15 min, proteinase K (final concentration of 20 µg/ml) was added to each digestion reaction and incubated for 2 h at 55 °C. DNA was extracted by careful phenol-chloroform purification using phase-lock gel. qPCR on the three CTCF sites and three housekeeping gene promoters was performed to determine the ideal digestion level. DNA fragments of 50–100 bp, 100–200 bp, 200–300 bp or 50–300 bp (for pair-end sequencing) were selected using low-melting agarose gel. The sequencing libraries were pre-pared following the Rubicon Genomics ThruPLEX-FD library preparation protocol. DNase-seq libraries were sequenced at the Center for Cancer Computational Biology at the Dana-Farber Cancer Institute.
DNase I calibration. As the effective activity of the DNase I enzyme may vary by manufacturer and batch, tends to decay over time and may be inhibited in cellular extracts, we use a calibration approach to allow the enzyme concentration optimized in this experiment to be reproduced in other systems. We assessed the extent to which DNA was digested by DNase I using loci selected to be stable across cell lines and conditions. CTCF ChIP-seq and DNase-seq experiments across multiple cell lines have shown CTCF to bind broadly across diverse cell types in DHS locations21. We selected 25 constitutive CTCF binding sites with low variabil-ity in DHS tags across 77 DNase-seq data sets in 43 cell types for enzyme calibration. After initial testing, primer pairs spanning three of these sites together with three housekeeping gene pro-moters, provided in Supplementary Table 3, were used to mea-sure the proportion of uncleaved loci in the cell population over a range of DNase I concentrations. In three different cell lines tested (Supplementary Fig. 1c), a sharp change in the proportion occurs for all loci in the range between 5 U and 100 U DNase I, enabling accurate calibration of DNase I enzyme activity in this range.
Performance evaluation of DNase I cleavage conditions. DNase-seq reads were mapped to the human reference genome hg19 using the bowtie software. Mapped reads were randomly sampled without replacement from the set of all mapped reads. At each sampling level, peaks were identified using MACS2 with options–keep-dup = 1 with the default P-value cutoff of 10−5. ChIP-seq peaks were compared with DNase-seq peaks by trim-ming ChIP-seq peaks to 600 bp around the peak summit. Peaks were considered to be overlapping if they had at least 1-bp overlap. We selected the most significant 10,000 ChIP-seq peaks from each ChIP-seq data set.
Differential DNase-seq. We used the methodology that we have described previously11 to compute a ∆DHS score represent-ing the change in DNase sensitivity for each DHS site, ∆DHS = (nT/mean(nT))1/2 − (nC/mean(nC))1/2, where nT and nC represent the tag counts within 100 bp from the motif center in treatment and control conditions, respectively. ∆DHS was calculated using 50 U DNase I data in LNCaP cell DHT and vehicle conditions. Androgen receptor, almost completely absent in the control con-dition, was induced to bind in the treatment condition. To test whether changes in DHS are associated with AR binding, we ranked loci by ∆DHS score and grouped these ranked loci into bins of 500. We then assessed the proportion of sites in each bin that overlapped with a ChIP-seq–identified AR site.
DNase-seq protocol. A protocol is available as Supplementary Protocol.
Analysis of nucleosome position effects on DNase-seq reads. Positions of nucleosomes marked by H3K4me2 were computed in the same way as previously described14 (GSE33216) using the NPS software22. Profiles of tag densities relative to the centers of these nucleosomes were derived based on the 5′ end of the DNase-seq tags.
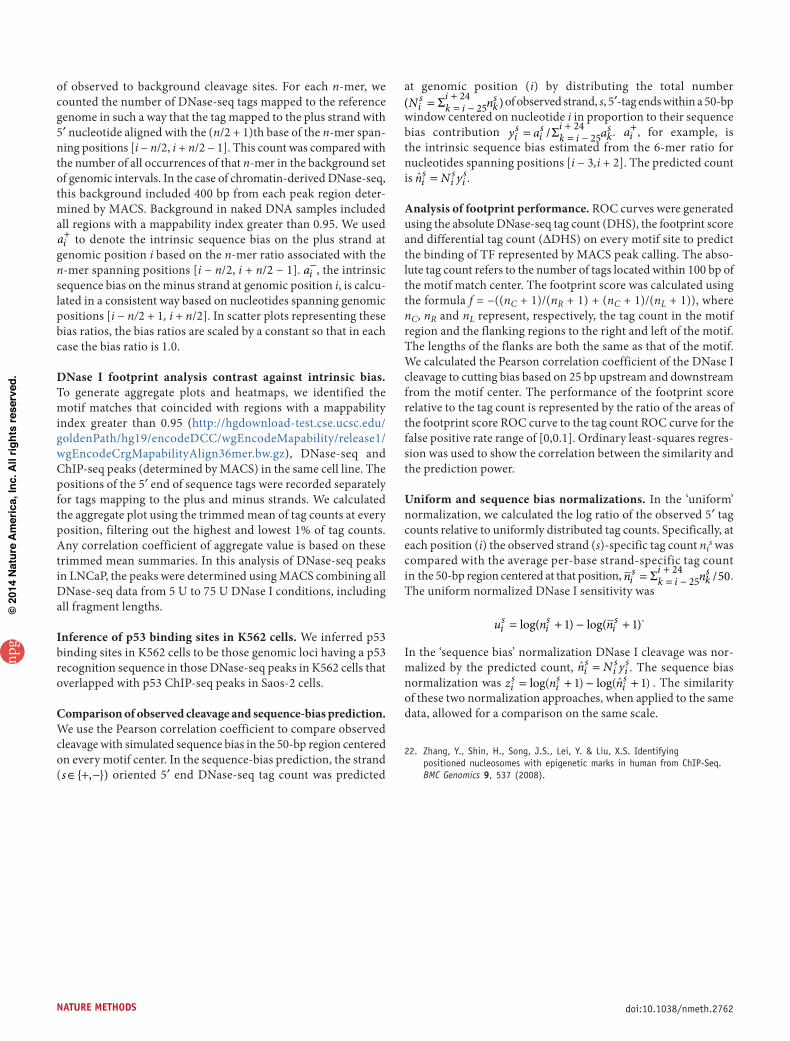
Estimation of intrinsic DNA induced nuclease cut bias. Intrinsic cut bias in chromatin and naked DNA was estimated from ratios
of observed to background cleavage sites. For each n-mer, we counted the number of DNase-seq tags mapped to the reference genome in such a way that the tag mapped to the plus strand with 5′ nucleotide aligned with the (n/2 + 1)th base of the n-mer span-ning positions [i − n/2, i + n/2 − 1]. This count was compared with the number of all occurrences of that n-mer in the background set of genomic intervals. In the case of chromatin-derived DNase-seq, this background included 400 bp from each peak region deter-mined by MACS. Background in naked DNA samples included all regions with a mappability index greater than 0.95. We used ai
+ to denote the intrinsic sequence bias on the plus strand at genomic position i based on the n-mer ratio associated with the n-mer spanning positions [i − n/2, i + n/2 − 1]. ai
−, the intrinsic sequence bias on the minus strand at genomic position i, is calcu-lated in a consistent way based on nucleotides spanning genomic positions [i − n/2 + 1, i + n/2]. In scatter plots representing these bias ratios, the bias ratios are scaled by a constant so that in each case the bias ratio is 1.0.
DNase I footprint analysis contrast against intrinsic bias. To generate aggregate plots and heatmaps, we identified the motif matches that coincided with regions with a mappability index greater than 0.95 (http://hgdownload-test.cse.ucsc.edu/ goldenPath/hg19/encodeDCC/wgEncodeMapability/release1/wgEncodeCrgMapabilityAlign36mer.bw.gz), DNase-seq and ChIP-seq peaks (determined by MACS) in the same cell line. The positions of the 5′ end of sequence tags were recorded separately for tags mapping to the plus and minus strands. We calculated the aggregate plot using the trimmed mean of tag counts at every position, filtering out the highest and lowest 1% of tag counts. Any correlation coefficient of aggregate value is based on these trimmed mean summaries. In this analysis of DNase-seq peaks in LNCaP, the peaks were determined using MACS combining all DNase-seq data from 5 U to 75 U DNase I conditions, including all fragment lengths.
Inference of p53 binding sites in K562 cells. We inferred p53 binding sites in K562 cells to be those genomic loci having a p53 recognition sequence in those DNase-seq peaks in K562 cells that overlapped with p53 ChIP-seq peaks in Saos-2 cells.
Comparison of observed cleavage and sequence-bias prediction. We use the Pearson correlation coefficient to compare observed cleavage with simulated sequence bias in the 50-bp region centered on every motif center. In the sequence-bias prediction, the strand (s∈ + −{ , }) oriented 5′ end DNase-seq tag count was predicted
at genomic position (i) by distributing the total number ( ),N ni
sk ii
ks= = −
+Σ 2524 of observed strand, s, 5′-tag ends within a 50-bp
window centered on nucleotide i in proportion to their sequence bias contribution y a ai
sis
k ii
ks= = −
+/Σ 2524 . ai
+ , for example, is the intrinsic sequence bias estimated from the 6-mer ratio for nucleotides spanning positions [i − 3,i + 2]. The predicted count is n̂ N yi
sis
is= .
Analysis of footprint performance. ROC curves were generated using the absolute DNase-seq tag count (DHS), the footprint score and differential tag count (∆DHS) on every motif site to predict the binding of TF represented by MACS peak calling. The abso-lute tag count refers to the number of tags located within 100 bp of the motif match center. The footprint score was calculated using the formula f = −((nC + 1)/(nR + 1) + (nC + 1)/(nL + 1)), where nC, nR and nL represent, respectively, the tag count in the motif region and the flanking regions to the right and left of the motif. The lengths of the flanks are both the same as that of the motif. We calculated the Pearson correlation coefficient of the DNase I cleavage to cutting bias based on 25 bp upstream and downstream from the motif center. The performance of the footprint score relative to the tag count is represented by the ratio of the areas of the footprint score ROC curve to the tag count ROC curve for the false positive rate range of [0,0.1]. Ordinary least-squares regres-sion was used to show the correlation between the similarity and the prediction power.
Uniform and sequence bias normalizations. In the ‘uniform’ normalization, we calculated the log ratio of the observed 5′ tag counts relative to uniformly distributed tag counts. Specifically, at each position (i) the observed strand (s)-specific tag count ni
s was compared with the average per-base strand-specific tag count in the 50-bp region centered at that position, n ni
sk ii
ks= = −
+Σ 2524 50/ .
The uniform normalized DNase I sensitivity was
u n nis
is
is= + − +log( ) log( )1 1 .
In the ‘sequence bias’ normalization DNase I cleavage was nor-malized by the predicted count, n̂ N yi
sis
is= . The sequence bias
normalization was ̂ log( ) log( ˆ )az n nis
is
is= + − +1 1 . The similarity
of these two normalization approaches, when applied to the same data, allowed for a comparison on the same scale.
22. Zhang, Y., Shin, H., Song, J.S., Lei, Y. & Liu, X.S. Identifying positioned nucleosomes with epigenetic marks in human from ChIP-Seq. BMC Genomics 9, 537 (2008).