23
Baker & O’Brien, Inc. All rights reserved. OPIS 16 th Annual National Supply Summit Las Vegas, Nevada October 28, 2014 Refining America’s New Light Tight Oil (LTO) Production
Baker & O’Brien, Inc. All rights reserved.
OPIS 16th Annual National Supply Summit Las Vegas, Nevada October 28, 2014
Refining America’s New Light Tight Oil (LTO) Production
1
• Growing U.S. LTO Production
• The Industry’s Initial Response
• What Happens Next?
• How Will Refined Products and Intermediates be Impacted?
Note: This presentation assumes that current restrictions on crude oil exports will continue for at least the next several years, and does not address the pros/cons or
impacts of lifting or keeping those restrictions.
Overview
2
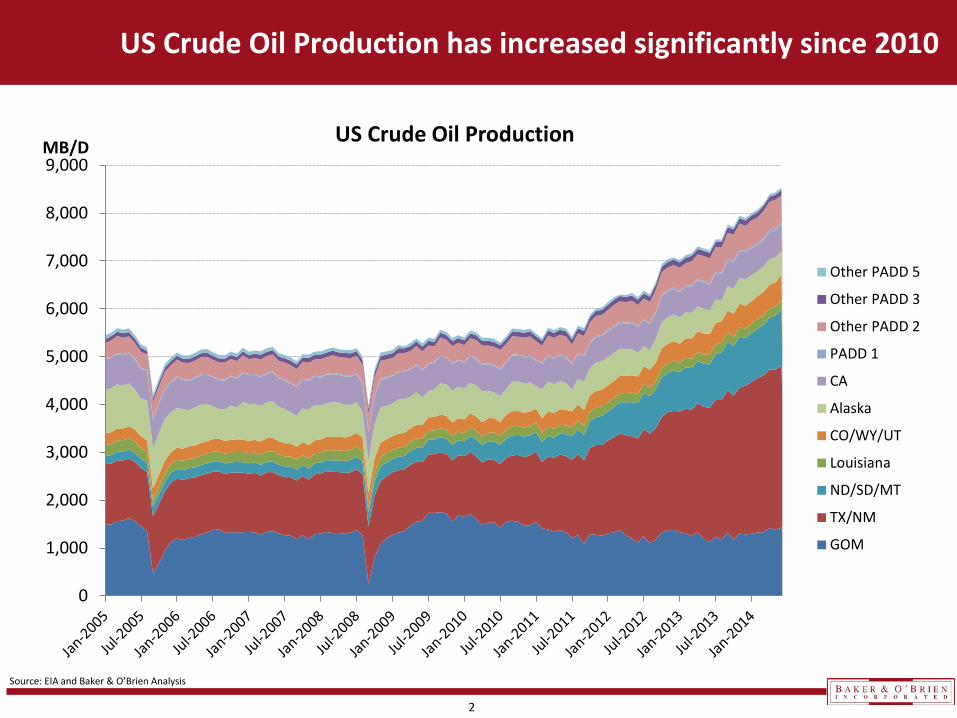
US Crude Oil Production has increased significantly since 2010
Source: EIA and Baker & O’Brien Analysis
US Crude Oil Production MB/D
0
1,000
2,000
3,000
4,000
5,000
6,000
7,000
8,000
9,000
Other PADD 5
Other PADD 3
Other PADD 2
PADD 1
CA
Alaska
CO/WY/UT
Louisiana
ND/SD/MT
TX/NM
GOM
3
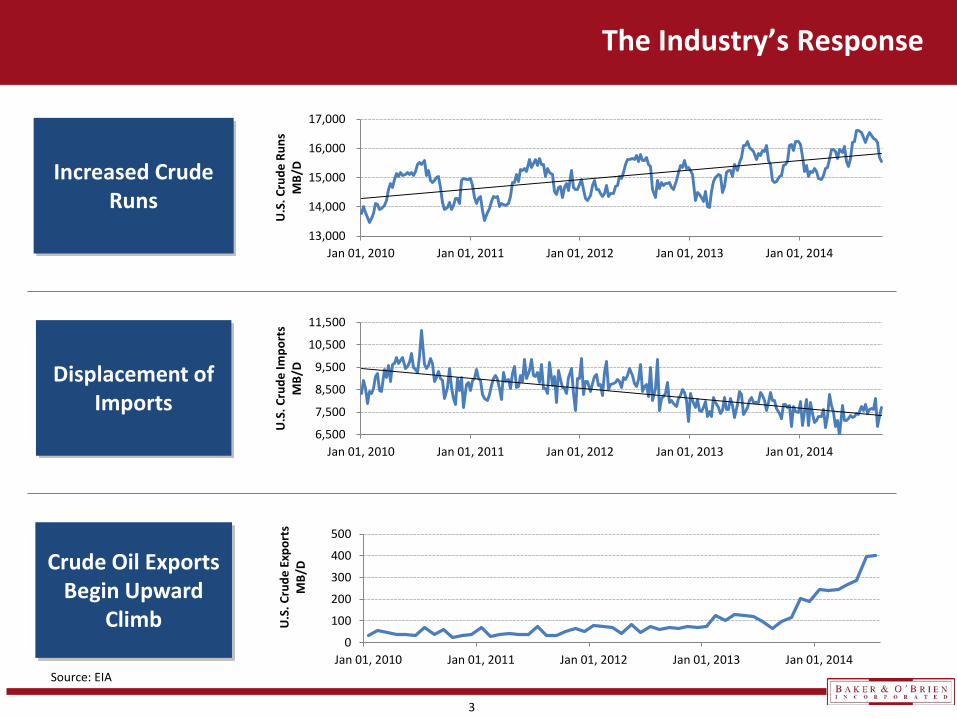
The Industry’s Response
Displacement of
Imports
Crude Oil Exports Begin Upward
Climb
Increased Crude Runs
Source: EIA
13,000
14,000
15,000
16,000
17,000
Jan 01, 2010 Jan 01, 2011 Jan 01, 2012 Jan 01, 2013 Jan 01, 2014
U.S
. Cru
de R
uns
MB/
D
6,500
7,500
8,500
9,500
10,500
11,500
Jan 01, 2010 Jan 01, 2011 Jan 01, 2012 Jan 01, 2013 Jan 01, 2014
U.S
. Cru
de Im
port
s M
B/D
0
100
200
300
400
500
Jan 01, 2010 Jan 01, 2011 Jan 01, 2012 Jan 01, 2013 Jan 01, 2014
U.S
. Cru
de E
xpor
ts
MB/
D
4
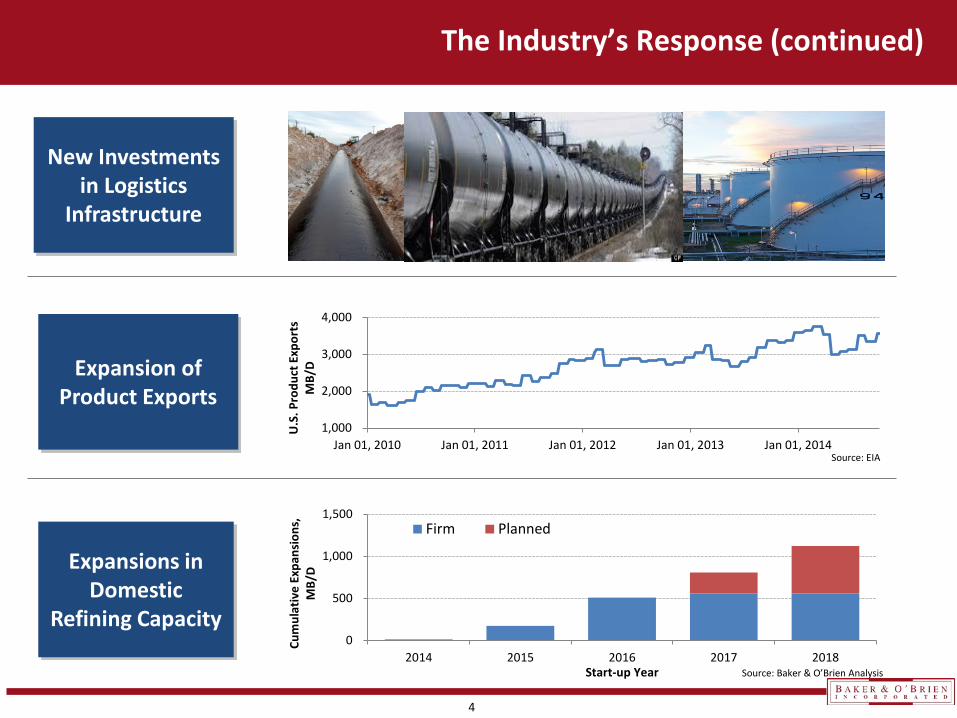
The Industry’s Response (continued)
Expansions in Domestic
Refining Capacity
New Investments in Logistics
Infrastructure
Expansion of Product Exports
Source: EIA
1,000
2,000
3,000
4,000
Jan 01, 2010 Jan 01, 2011 Jan 01, 2012 Jan 01, 2013 Jan 01, 2014
U.S
. Pro
duct
Exp
orts
M
B/D
0
500
1,000
1,500
2014 2015 2016 2017 2018
Cum
ulat
ive
Expa
nsio
ns,
MB/
D
Start-up Year
Firm Planned
Source: Baker & O’Brien Analysis
5
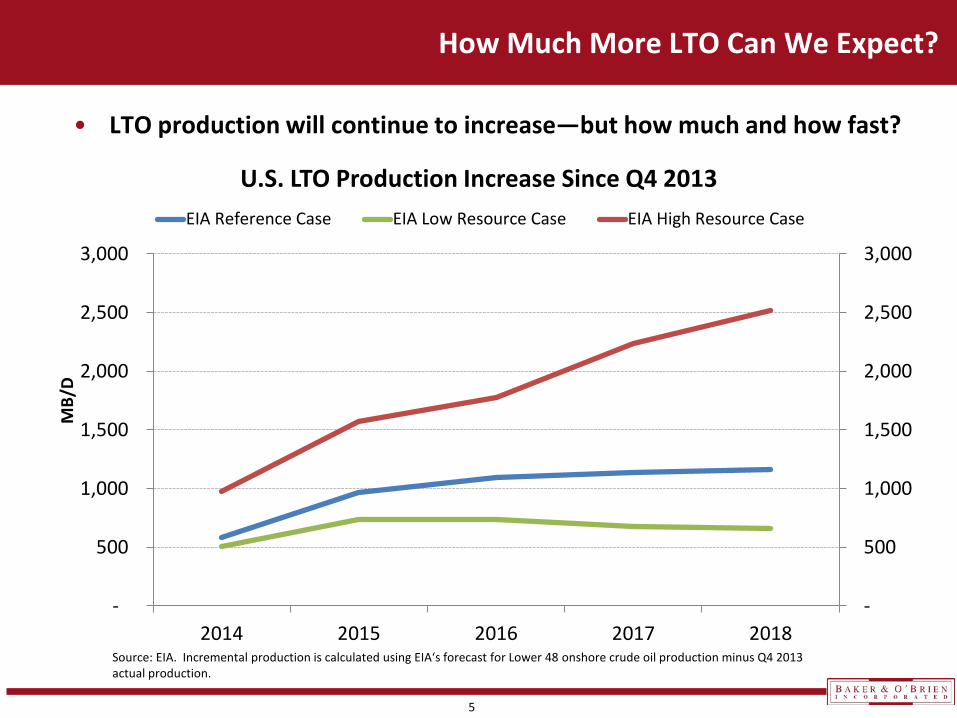
• LTO production will continue to increase—but how much and how fast?
How Much More LTO Can We Expect?
Source: EIA. Incremental production is calculated using EIA‘s forecast for Lower 48 onshore crude oil production minus Q4 2013 actual production.
-
500
1,000
1,500
2,000
2,500
3,000
-
500
1,000
1,500
2,000
2,500
3,000
2014 2015 2016 2017 2018
MB/
D
U.S. LTO Production Increase Since Q4 2013 EIA Reference Case EIA Low Resource Case EIA High Resource Case
6
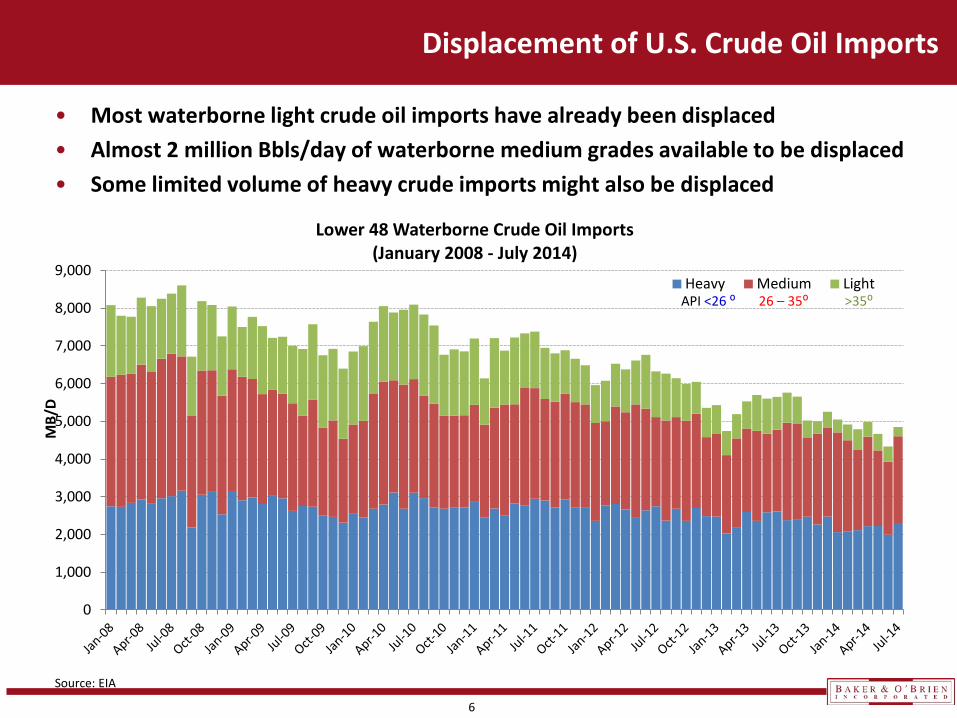
Displacement of U.S. Crude Oil Imports
• Most waterborne light crude oil imports have already been displaced • Almost 2 million Bbls/day of waterborne medium grades available to be displaced • Some limited volume of heavy crude imports might also be displaced
Source: EIA
0
1,000
2,000
3,000
4,000
5,000
6,000
7,000
8,000
9,000
MB/
D
Lower 48 Waterborne Crude Oil Imports (January 2008 - July 2014)
Heavy Medium Light API <26 ⁰ 26 – 35⁰ >35⁰
7
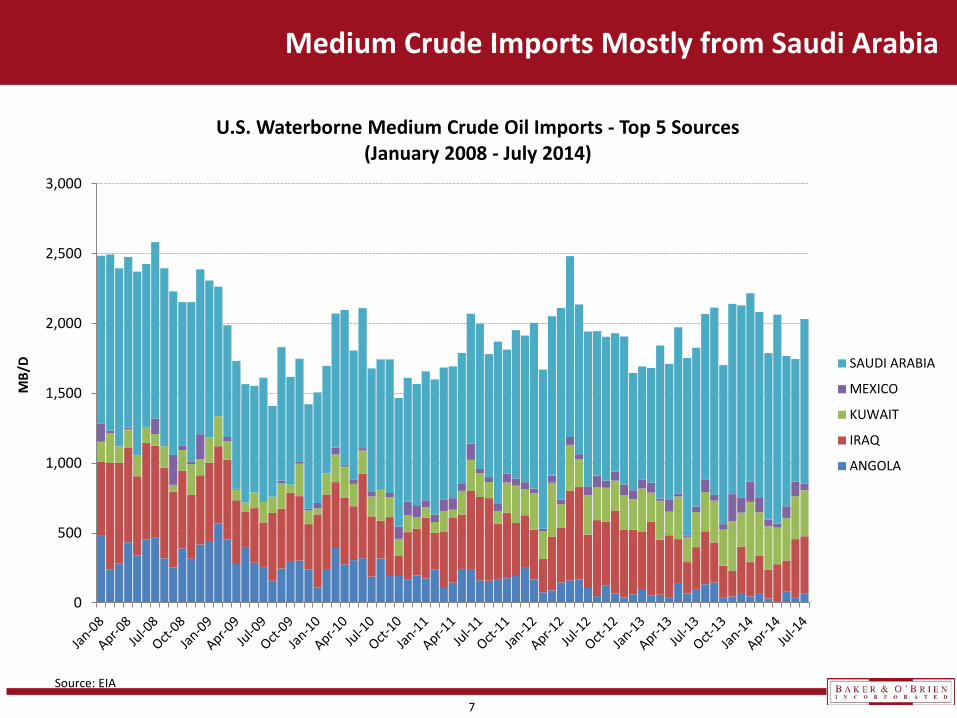
Medium Crude Imports Mostly from Saudi Arabia
0
500
1,000
1,500
2,000
2,500
3,000
MB/
D
U.S. Waterborne Medium Crude Oil Imports - Top 5 Sources (January 2008 - July 2014)
SAUDI ARABIA
MEXICO
KUWAIT
IRAQ
ANGOLA
Source: EIA
8
• As part of announced refining expansions, we can expect some “capacity creep” in ability to run more LTO.
• Since most waterborne light crude imports have been displaced, medium grades are likely to be backed out.
• West Coast LTO runs will slowly be increased as logistics bottlenecks are overcome.
• More stabilized condensates will be exported as a result of recent regulatory finding.
What Can the Industry do Next?
9
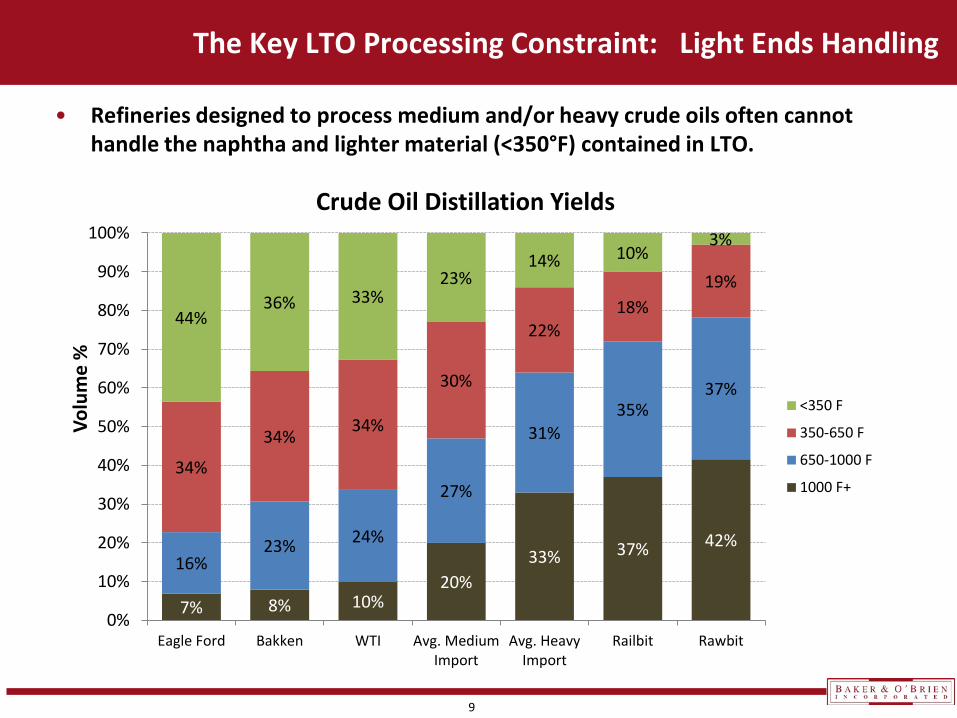
The Key LTO Processing Constraint: Light Ends Handling
• Refineries designed to process medium and/or heavy crude oils often cannot handle the naphtha and lighter material (<350°F) contained in LTO.
7% 8% 10% 20%
33% 37% 42% 16%
23% 24%
27%
31% 35%
37%
34%
34% 34%
30%
22% 18%
19%
44% 36% 33%
23% 14% 10%
3%
0%
10%
20%
30%
40%
50%
60%
70%
80%
90%
100%
Eagle Ford Bakken WTI Avg. MediumImport
Avg. HeavyImport
Railbit Rawbit
Crude Oil Distillation Yields
<350 F
350-650 F
650-1000 F
1000 F+
Volu
me
%
10
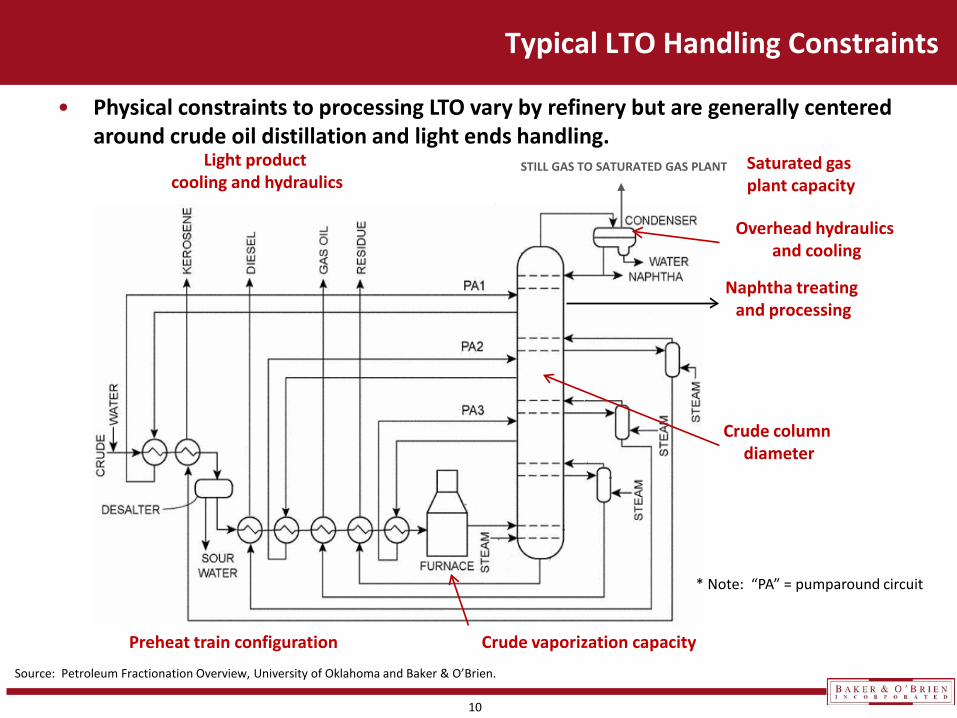
Typical LTO Handling Constraints
STILL GAS TO SATURATED GAS PLANT
Crude vaporization capacity
Saturated gas plant capacity
Light product cooling and hydraulics
Crude column diameter
Overhead hydraulics and cooling
Naphtha treating and processing
Preheat train configuration
Source: Petroleum Fractionation Overview, University of Oklahoma and Baker & O’Brien.
• Physical constraints to processing LTO vary by refinery but are generally centered around crude oil distillation and light ends handling.
* Note: “PA” = pumparound circuit
11
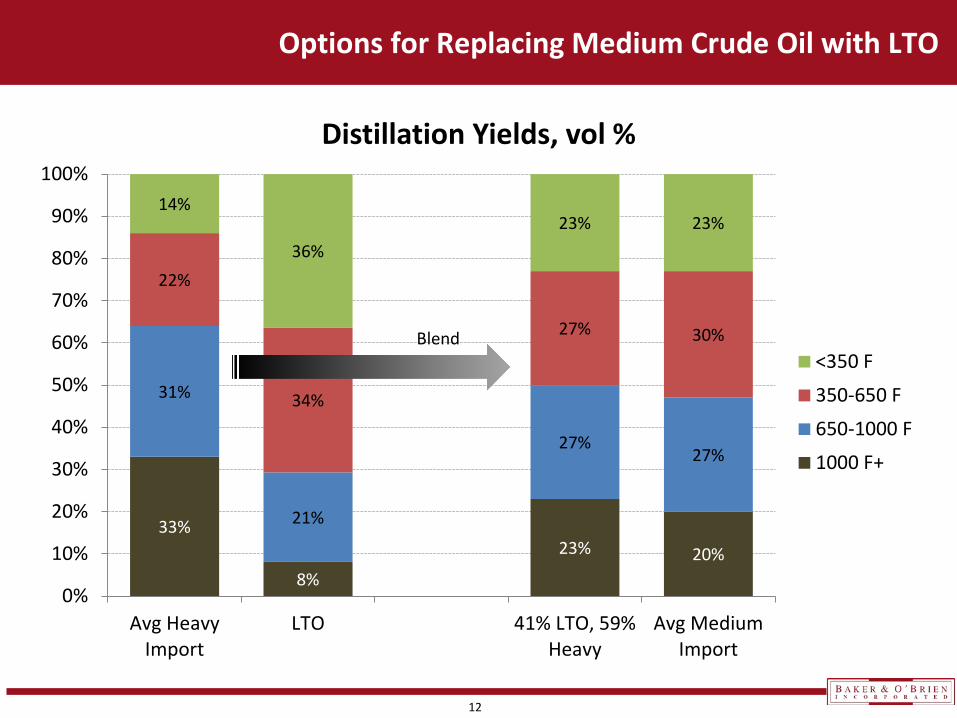
• Direct substitution of medium crude with LTO: – Refiners would generally need to sacrifice some throughput in order to
substitute light for medium without some additional investment.
Options for Replacing Medium Crude Oil with LTO
• LTO/heavy blends can substitute for some medium grade imports:
– Advantages: Enables refiners to maintain crude throughput and keep downstream units full.
– Challenges: Blending exact substitute for medium grades Asphaltene precipitation issues Crude oil blending facilities Availability of heavy crude oil Possible high acid (TAN) constraints
12
Options for Replacing Medium Crude Oil with LTO
33%
8%
23% 20%
31%
21%
27% 27%
22%
34%
27% 30%
14%
36% 23% 23%
0%
10%
20%
30%
40%
50%
60%
70%
80%
90%
100%
Avg HeavyImport
LTO 41% LTO, 59%Heavy
Avg MediumImport
Distillation Yields, vol %
<350 F
350-650 F
650-1000 F
1000 F+
Blend
13
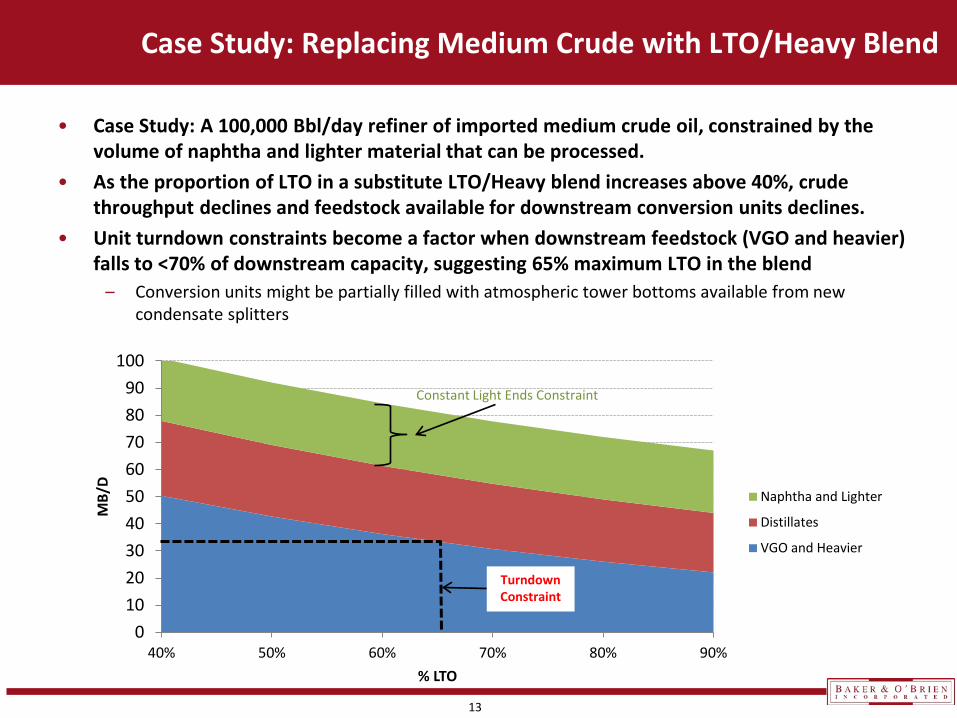
• Case Study: A 100,000 Bbl/day refiner of imported medium crude oil, constrained by the volume of naphtha and lighter material that can be processed.
• As the proportion of LTO in a substitute LTO/Heavy blend increases above 40%, crude throughput declines and feedstock available for downstream conversion units declines.
• Unit turndown constraints become a factor when downstream feedstock (VGO and heavier) falls to <70% of downstream capacity, suggesting 65% maximum LTO in the blend
– Conversion units might be partially filled with atmospheric tower bottoms available from new condensate splitters
Case Study: Replacing Medium Crude with LTO/Heavy Blend
0102030405060708090
100
40% 50% 60% 70% 80% 90%
MB/
D
% LTO
Naphtha and Lighter
Distillates
VGO and Heavier
Constant Light Ends Constraint
Turndown Constraint
14
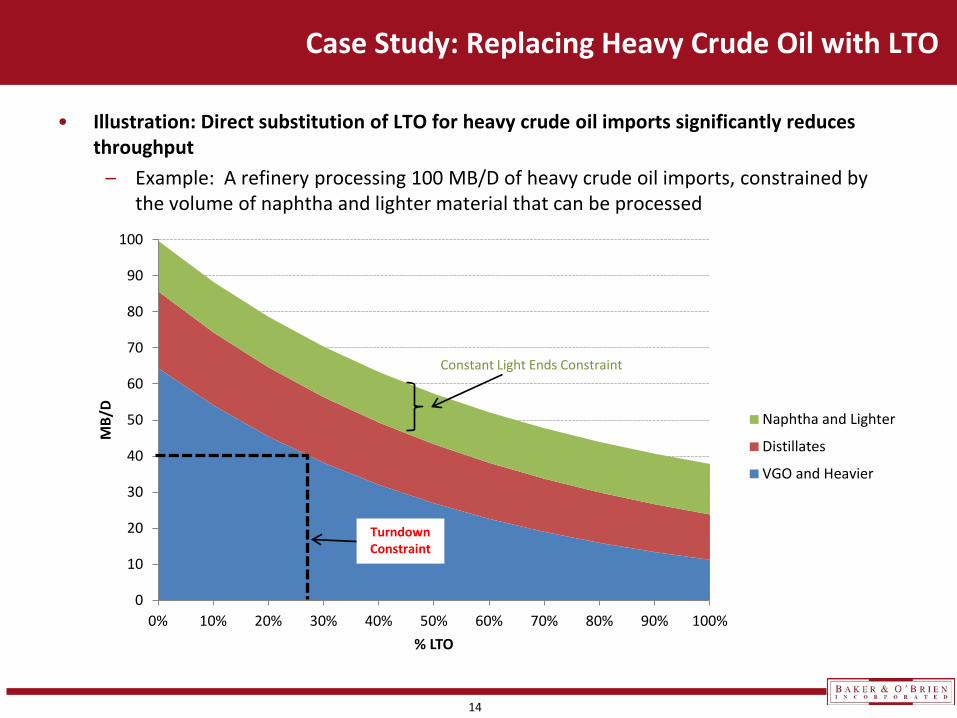
• Illustration: Direct substitution of LTO for heavy crude oil imports significantly reduces throughput
– Example: A refinery processing 100 MB/D of heavy crude oil imports, constrained by the volume of naphtha and lighter material that can be processed
Case Study: Replacing Heavy Crude Oil with LTO
0
10
20
30
40
50
60
70
80
90
100
0% 10% 20% 30% 40% 50% 60% 70% 80% 90% 100%
MB/
D
% LTO
Naphtha and Lighter
Distillates
VGO and Heavier
Constant Light Ends Constraint
Turndown Constraint
15
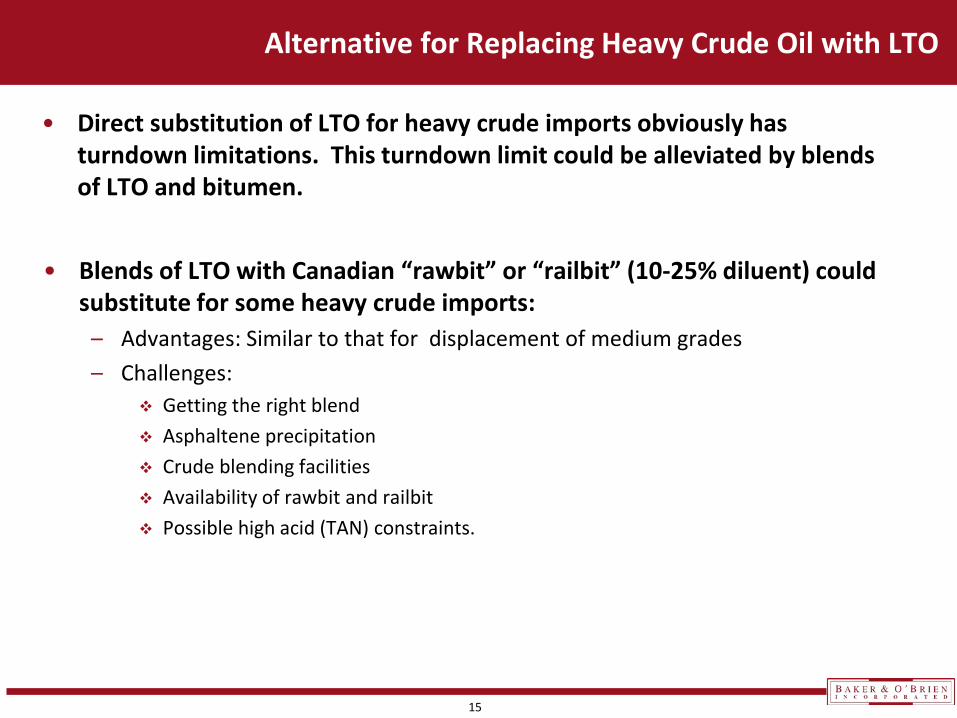
• Direct substitution of LTO for heavy crude imports obviously has turndown limitations. This turndown limit could be alleviated by blends of LTO and bitumen.
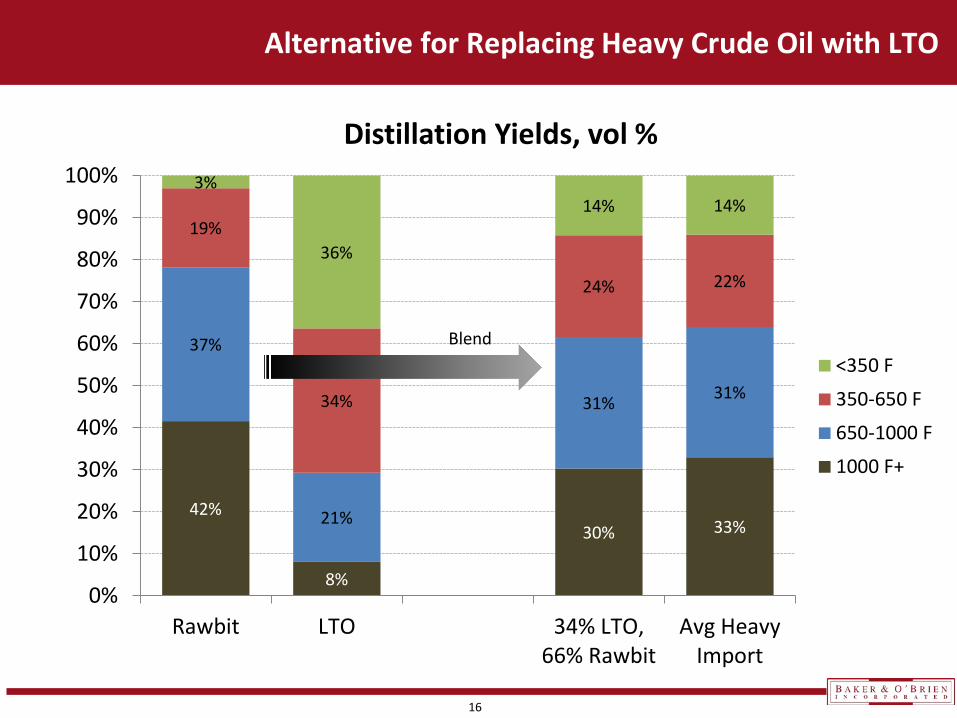
Alternative for Replacing Heavy Crude Oil with LTO
• Blends of LTO with Canadian “rawbit” or “railbit” (10-25% diluent) could substitute for some heavy crude imports:
– Advantages: Similar to that for displacement of medium grades – Challenges:
Getting the right blend Asphaltene precipitation Crude blending facilities Availability of rawbit and railbit Possible high acid (TAN) constraints.
16
Alternative for Replacing Heavy Crude Oil with LTO
42%
8%
30% 33%
37%
21%
31% 31%
19%
34%
24% 22%
3%
36%
14% 14%
0%
10%
20%
30%
40%
50%
60%
70%
80%
90%
100%
Rawbit LTO 34% LTO,66% Rawbit
Avg HeavyImport
Distillation Yields, vol %
<350 F
350-650 F
650-1000 F
1000 F+
Blend
17
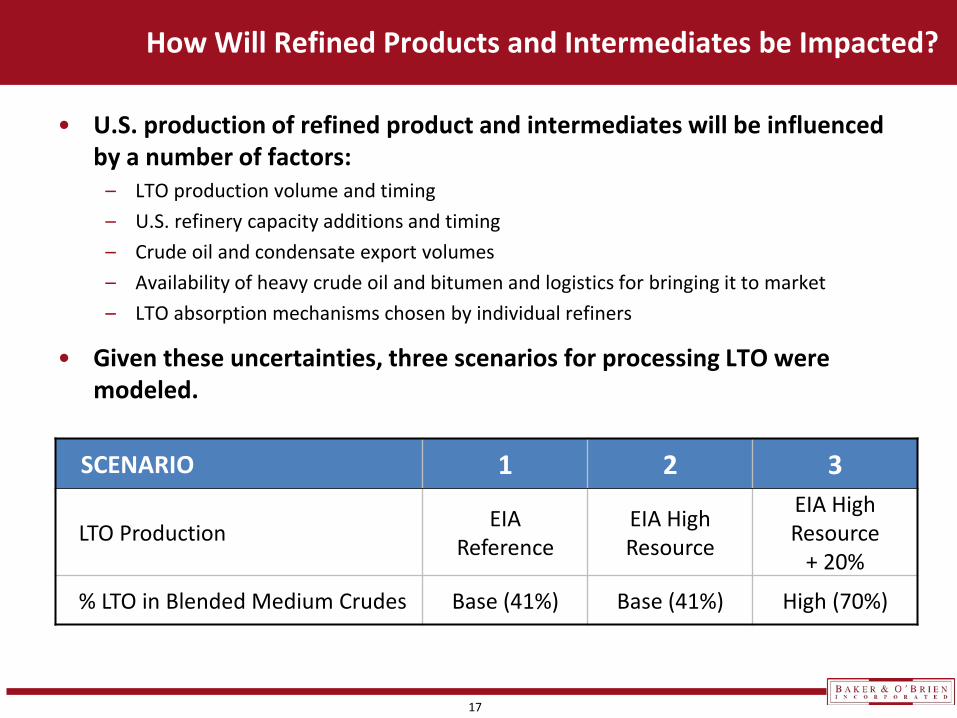
• U.S. production of refined product and intermediates will be influenced by a number of factors:
– LTO production volume and timing – U.S. refinery capacity additions and timing – Crude oil and condensate export volumes – Availability of heavy crude oil and bitumen and logistics for bringing it to market – LTO absorption mechanisms chosen by individual refiners
• Given these uncertainties, three scenarios for processing LTO were modeled.
How Will Refined Products and Intermediates be Impacted?
SCENARIO 1 2 3
LTO Production EIA Reference
EIA High Resource
EIA High Resource
+ 20%
% LTO in Blended Medium Crudes Base (41%) Base (41%) High (70%)
18
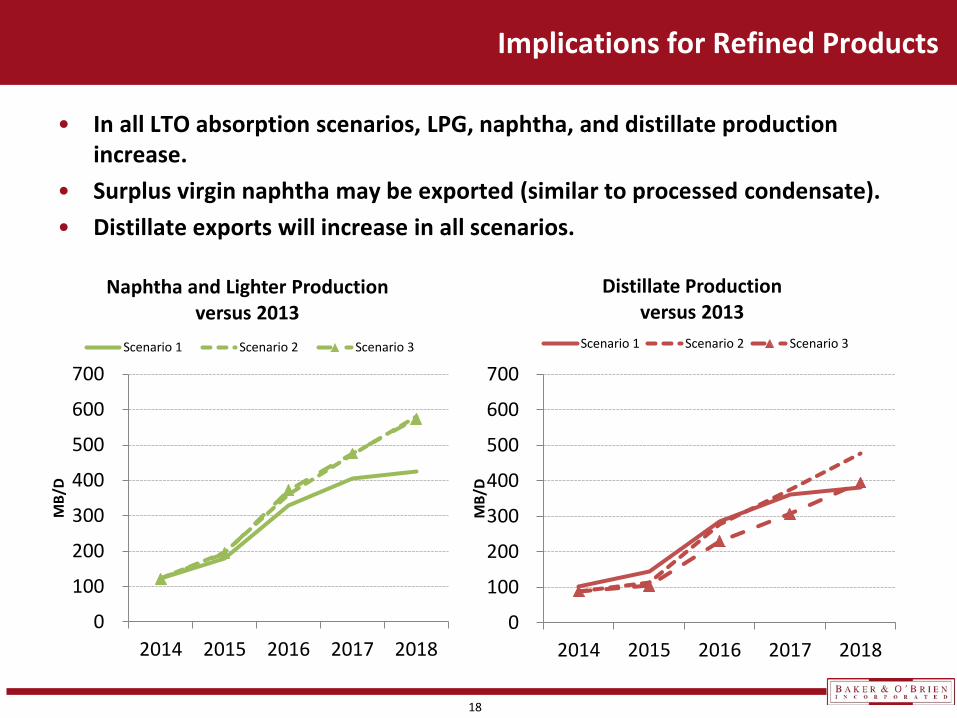
• In all LTO absorption scenarios, LPG, naphtha, and distillate production increase.
• Surplus virgin naphtha may be exported (similar to processed condensate). • Distillate exports will increase in all scenarios.
Implications for Refined Products
0
100
200
300
400
500
600
700
2014 2015 2016 2017 2018
MB/
D
Naphtha and Lighter Production versus 2013
Scenario 1 Scenario 2 Scenario 3
0
100
200
300
400
500
600
700
2014 2015 2016 2017 2018
MB/
D
Distillate Production versus 2013
Scenario 1 Scenario 2 Scenario 3
19
• Add or Increase Utilization of Reforming and/or Isomerization Capacity – EIA reports U.S. reformers operate at only ~ 75% utilization – Blend and export surplus gasoline production – Latin America or Asia likely to be primary markets
• Export Surplus LPGs and Naphthas as Feedstock for Petrochemical Facilities – Asia and Europe likely to be primary markets
• Export to Canada as Diluent for Bitumen – Expected new demand of 200-250 MB/day by 2018 – Increased use of rawbit or railbit would decrease demand
Refiner Options for Overcoming Naphtha Limitations
20
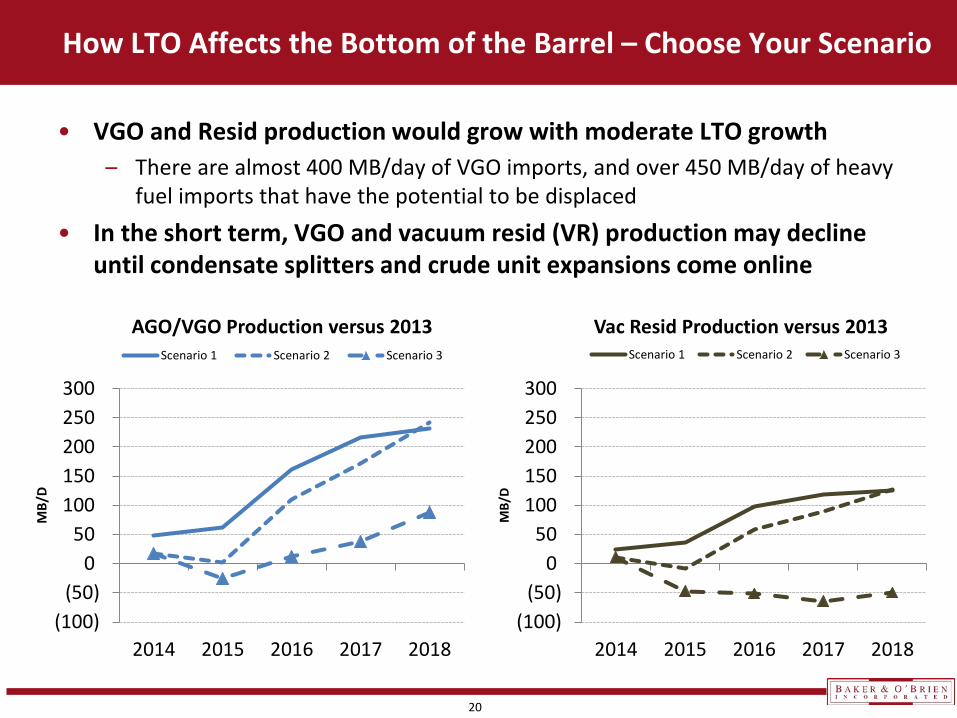
• VGO and Resid production would grow with moderate LTO growth
– There are almost 400 MB/day of VGO imports, and over 450 MB/day of heavy fuel imports that have the potential to be displaced
• In the short term, VGO and vacuum resid (VR) production may decline until condensate splitters and crude unit expansions come online
How LTO Affects the Bottom of the Barrel – Choose Your Scenario
(100)(50)
050
100150200250300
2014 2015 2016 2017 2018
MB/
D
AGO/VGO Production versus 2013 Scenario 1 Scenario 2 Scenario 3
(100)(50)
050
100150200250300
2014 2015 2016 2017 2018
MB/
D
Vac Resid Production versus 2013 Scenario 1 Scenario 2 Scenario 3
21
• US crude oil production has increased significantly since 2010 and is expected to continue to rise.
• Refiners can be expected to accelerate the displacement of medium and heavy crude imports.
• Refiners will exercise available short term and long term (capital) options for overcoming light ends limitations.
• Light virgin products will exhibit year-to-year increases, but heavy virgin intermediates could decline in the near term before rising.
• To the extent possible, refiners will blend LTO with heavier components to minimize turndown limitations.
Summary

22
Baker & O’Brien – Independent Energy Consultants
www.bakerobrien.com
Dallas Headquarters
12001 N. Central Expressway Suite 1200
Dallas, TX 75243 Phone: 1-214-368-7626
Fax: 1-214-368-0190
Houston Office
1333 West Loop South Suite 1350
Houston, TX 77027 Phone: 1-832-358-1453
Fax: 1-832-358-1498
London Office
146 Fleet Street Suite 2
London EC4A 2BU Phone: 44-20-7373-0925


