1
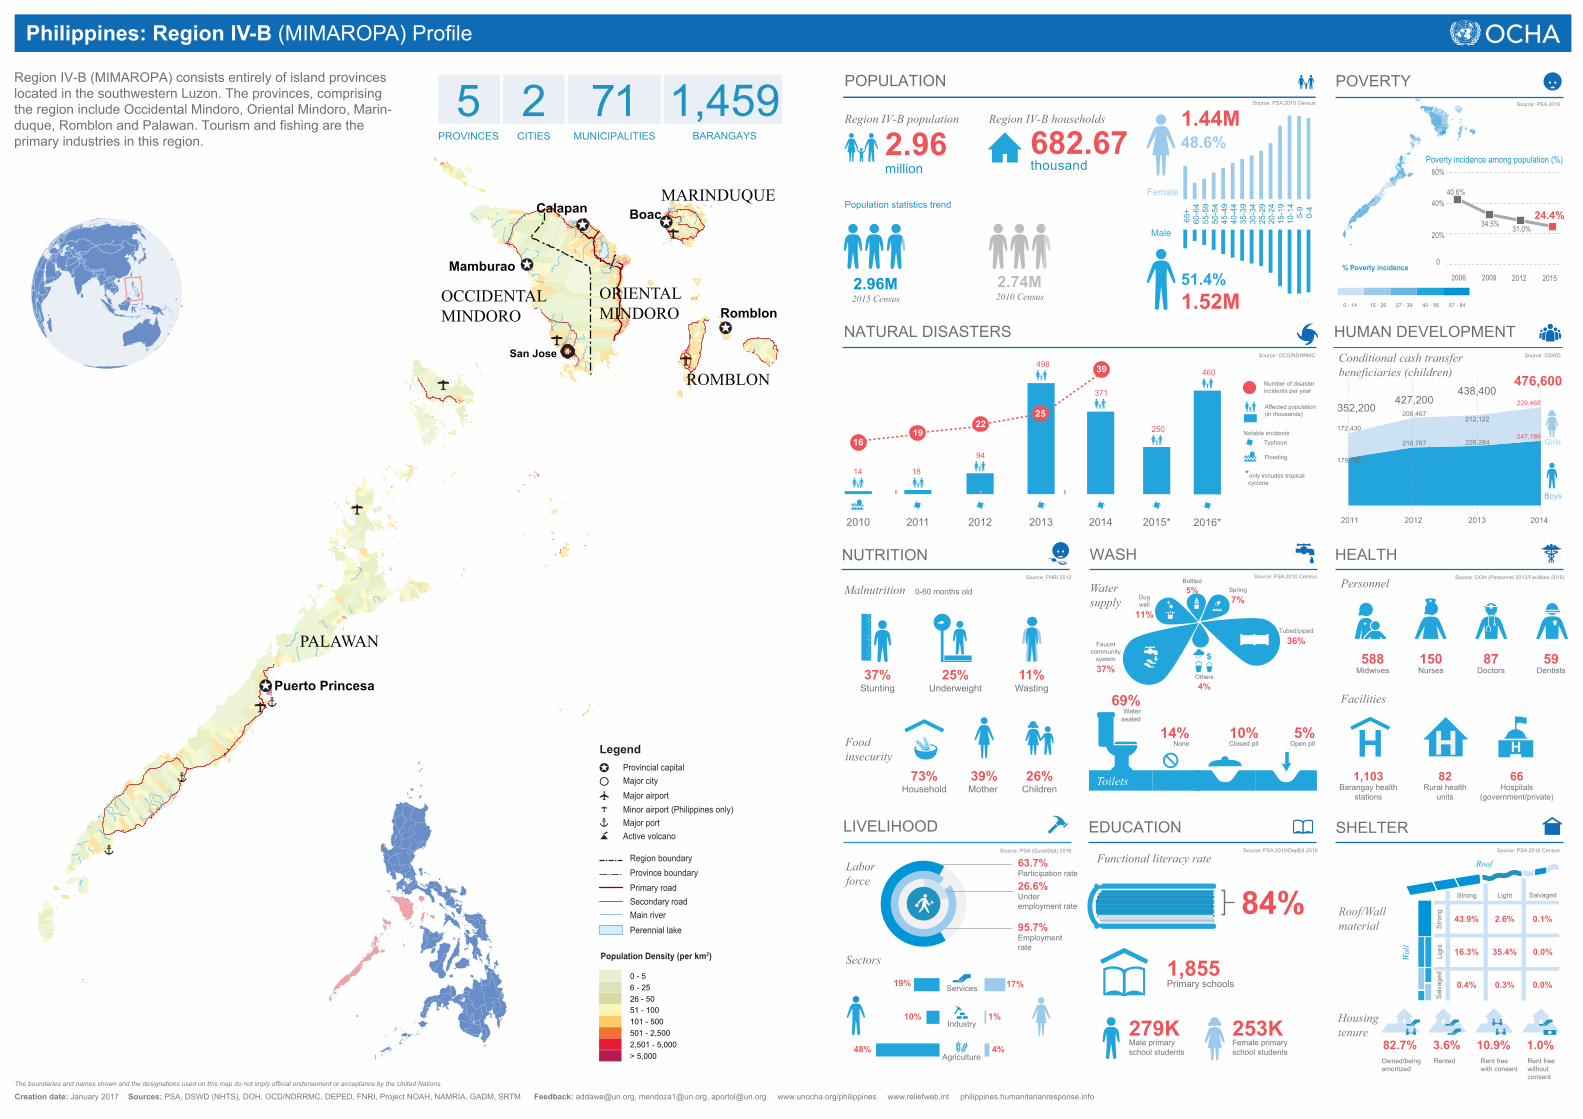
PALAWAN OCCIDENTAL MINDORO ORIENTAL MINDORO MARINDUQUE ROMBLON Puerto Princesa Mamburao Calapan Boac Romblon San Jose Region boundary Province boundary Perennial lake Main river Population Density (per km 2 ) Legend Primary road Secondary road Provincial capital Major city Major port Active volcano Major airport Minor airport (Philippines only) 0 - 5 6 - 25 26 - 50 51 - 100 101 - 500 501 - 2,500 2,501 - 5,000 > 5,000 Region IV-B (MIMAROPA) consists entirely of island provinces located in the southwestern Luzon. The provinces, comprising the region include Occidental Mindoro, Oriental Mindoro, Marin- duque, Romblon and Palawan. Tourism and fishing are the primary industries in this region. 5 PROVINCES 2 CITIES 71 MUNICIPALITIES 1,459 BARANGAYS WASH 69% Water sealed 14% None 10% Closed pit 5% Open pit Toilets Water supply Others 4% Dug well 11% Spring 7% Bottled 5% Tubed/piped 36% Faucet community system 37% SHELTER Housing tenure 82.7% 3.6% 1.0% 10.9% Roof/Wall material Source: PSA 2010 Census Source: FNRI 2012 Source: PSA 2010 Census Source: PSA 2010/DepEd 2016 Source: PSA (QuickStat) 2016 Source: OCD/NDRRMC Source: DSWD Source: PSA 2016 Source: PSA 2015 Census Source: DOH (Personnel 2012/Facilities 2016) LIVELIHOOD Sectors 4% 1% 17% Agriculture Services Industry 10% 19% 48% Labor force 63.7% Participation rate 95.7% Employment rate 26.6% Under employment rate EDUCATION Functional literacy rate 1,855 Primary schools 279K Male primary school students 253K Female primary school students Owned/being amortized Rented Rent free without consent Rent free with consent Roof Wall 43.9% 16.3% 35.4% 0.3% 2.6% 0.0% 0.0% 0.1% 0.4% Strong Strong Light Light Salvaged Salvaged 84% Personnel Facilities HEALTH *only includes tropical cyclone 1,103 Barangay health stations 82 Rural health units 66 Hospitals (government/private) POVERTY 51.4% 48.6% POPULATION Region IV-B population 2.96 million Region IV-B households 682.67 thousand 0-4 5-9 10-14 15-19 20-24 25-29 30-34 35-39 40-44 45-49 50-54 55-59 60-64 65+ Female Male 1.52M 1.44M Population statistics trend 2.96M 2015 Census 2.74M 2010 Census NUTRITION 25% Underweight 11% Wasting 0-60 months old 37% Stunting Malnutrition Food insecurity 39% Mother 26% Children 73% Household 0 - 14 15 - 26 27 - 39 40 - 56 57 - 84 % Poverty incidence 2006 2009 2012 2015 40.6% 34.5% 31.0% 24.4% 0 20% 40% 60% Poverty incidence among population (%) NATURAL DISASTERS HUMAN DEVELOPMENT 352,200 427,200 438,400 476,600 2011 2012 2013 2014 Girls Boys 179,798 218,767 226,284 172,430 208,467 212,122 247,189 229,468 2014 2013 2012 2011 2010 16 19 22 25 39 2015* 2016* 14 18 94 498 371 250 460 Flooding Typhoon Affected population (in thousands) Number of disaster incidents per year Notable incidents Philippines: Region IV-B (MIMAROPA) Profile Conditional cash transfer beneficiaries (children) 150 Nurses 588 Midwives 87 Doctors 59 Dentists The boundaries and names shown and the designations used on this map do not imply official endorsement or acceptance by the United Nations. Creation date: January 2017 Sources: PSA, DSWD (NHTS), DOH, OCD/NDRRMC, DEPED, FNRI, Project NOAH, NAMRIA, GADM, SRTM Feedback: [email protected], [email protected], [email protected] www.unocha.org/philippines www.reliefweb.int philippines.humanitarianresponse.info