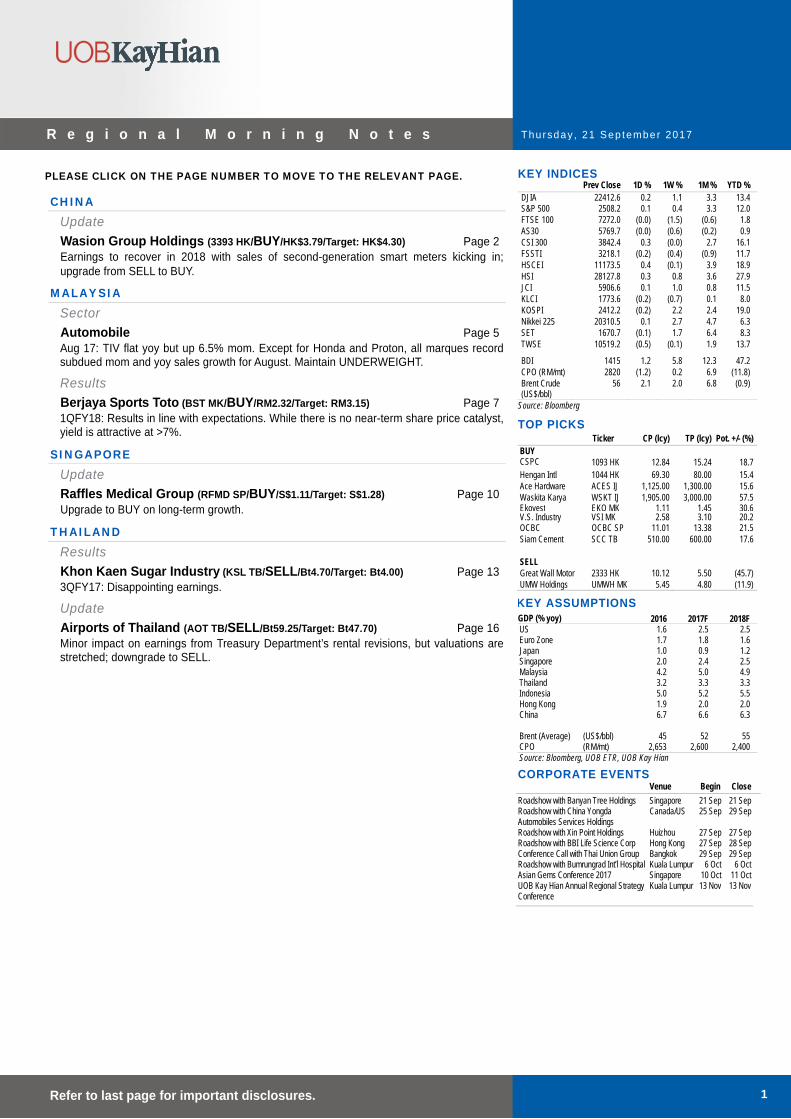
Thursda y , 21 Se p tember 2017 1 Refer to last page for important disclosures. R e g i o n a l M o r n i n g N o t e s PLEASE CLICK ON THE PAGE NUMBER TO MOVE TO THE RELEVANT PAGE. CHINA Update Wasion Group Holdings (3393 HK/BUY/HK$3.79/Target: HK$4.30) Page 2 Earnings to recover in 2018 with sales of second-generation smart meters kicking in; upgrade from SELL to BUY. MALAYSIA Sector Automobile Page 5 Aug 17: TIV flat yoy but up 6.5% mom. Except for Honda and Proton, all marques record subdued mom and yoy sales growth for August. Maintain UNDERWEIGHT. Results Berjaya Sports Toto (BST MK/BUY/RM2.32/Target: RM3.15) Page 7 1QFY18: Results in line with expectations. While there is no near-term share price catalyst, yield is attractive at >7%. SINGAPORE Update Raffles Medical Group (RFMD SP/BUY/S$1.11/Target: S$1.28) Page 10 Upgrade to BUY on long-term growth. THAILAND Results Khon Kaen Sugar Industry (KSL TB/SELL/Bt4.70/Target: Bt4.00) Page 13 3QFY17: Disappointing earnings. Update Airports of Thailand (AOT TB/SELL/Bt59.25/Target: Bt47.70) Page 16 Minor impact on earnings from Treasury Department’s rental revisions, but valuations are stretched; downgrade to SELL. KEY INDICES Prev Close 1D % 1W % 1M % YTD % DJIA 22412.6 0.2 1.1 3.3 13.4 S&P 500 2508.2 0.1 0.4 3.3 12.0 FTSE 100 7272.0 (0.0) (1.5) (0.6) 1.8 AS30 5769.7 (0.0) (0.6) (0.2) 0.9 CSI 300 3842.4 0.3 (0.0) 2.7 16.1 FSSTI 3218.1 (0.2) (0.4) (0.9) 11.7 HSCEI 11173.5 0.4 (0.1) 3.9 18.9 HSI 28127.8 0.3 0.8 3.6 27.9 JCI 5906.6 0.1 1.0 0.8 11.5 KLCI 1773.6 (0.2) (0.7) 0.1 8.0 KOSPI 2412.2 (0.2) 2.2 2.4 19.0 Nikkei 225 20310.5 0.1 2.7 4.7 6.3 SET 1670.7 (0.1) 1.7 6.4 8.3 TWSE 10519.2 (0.5) (0.1) 1.9 13.7 BDI 1415 1.2 5.8 12.3 47.2 CPO (RM/mt) 2820 (1.2) 0.2 6.9 (11.8) Brent Crude (US$/bbl) 56 2.1 2.0 6.8 (0.9) Source: Bloomberg TOP PICKS Ticker CP (lcy) TP (lcy) Pot. +/- (%) BUY CSPC 1093 HK 12.84 15.24 18.7 Hengan Intl 1044 HK 69.30 80.00 15.4 Ace Hardware ACES IJ 1,125.00 1,300.00 15.6 Waskita Karya WSKT IJ 1,905.00 3,000.00 57.5 Ekovest EKO MK 1.11 1.45 30.6 V.S. Industry VSI MK 2.58 3.10 20.2 OCBC OCBC SP 11.01 13.38 21.5 Siam Cement SCC TB 510.00 600.00 17.6 SELL Great Wall Motor 2333 HK 10.12 5.50 (45.7) UMW Holdings UMWH MK 5.45 4.80 (11.9) KEY ASSUMPTIONS GDP (% yoy) 2016 2017F 2018F US 1.6 2.5 2.5 Euro Zone 1.7 1.8 1.6 Japan 1.0 0.9 1.2 Singapore 2.0 2.4 2.5 Malaysia 4.2 5.0 4.9 Thailand 3.2 3.3 3.3 Indonesia 5.0 5.2 5.5 Hong Kong 1.9 2.0 2.0 China 6.7 6.6 6.3 Brent (Average) (US$/bbl) 45 52 55 CPO (RM/mt) 2,653 2,600 2,400 Source: Bloomberg, UOB ETR, UOB Kay Hian CORPORATE EVENTS Venue Begin Close Roadshow with Banyan Tree Holdings Singapore 21 Sep 21 Sep Roadshow with China Yongda Canada/US 25 Sep 29 Sep Automobiles Services Holdings Roadshow with Xin Point Holdings Huizhou 27 Sep 27 Sep Roadshow with BBI Life Science Corp Hong Kong 27 Sep 28 Sep Conference Call with Thai Union Group Bangkok 29 Sep 29 Sep Roadshow with Bumrungrad Int’l Hospital Kuala Lumpur 6 Oct 6 Oct Asian Gems Conference 2017 Singapore 10 Oct 11 Oct UOB Kay Hian Annual Regional Strategy Kuala Lumpur 13 Nov 13 Nov Conference
Transcript
Thursday , 21 Sep tember 2017
1 Refer to last page for important disclosures.
R e g i o n a l M o r n i n g N o t e s
PLEASE CLICK ON THE PAGE NUMBER TO MOVE TO THE RELEVANT PAGE.
CHINA Update Wasion Group Holdings (3393 HK/BUY/HK$3.79/Target: HK$4.30) Page 2 Earnings to recover in 2018 with sales of second-generation smart meters kicking in; upgrade from SELL to BUY.
MALAYSIA Sector Automobile Page 5 Aug 17: TIV flat yoy but up 6.5% mom. Except for Honda and Proton, all marques record subdued mom and yoy sales growth for August. Maintain UNDERWEIGHT.
Results Berjaya Sports Toto (BST MK/BUY/RM2.32/Target: RM3.15) Page 7 1QFY18: Results in line with expectations. While there is no near-term share price catalyst, yield is attractive at >7%.
SINGAPORE Update Raffles Medical Group (RFMD SP/BUY/S$1.11/Target: S$1.28) Page 10 Upgrade to BUY on long-term growth.
Update Airports of Thailand (AOT TB/SELL/Bt59.25/Target: Bt47.70) Page 16 Minor impact on earnings from Treasury Department’s rental revisions, but valuations are stretched; downgrade to SELL.
TOP PICKS Ticker CP (lcy) TP (lcy) Pot. +/- (%) BUY CSPC 1093 HK 12.84 15.24 18.7 Hengan Intl 1044 HK 69.30 80.00 15.4 Ace Hardware ACES IJ 1,125.00 1,300.00 15.6 Waskita Karya WSKT IJ 1,905.00 3,000.00 57.5 Ekovest EKO MK 1.11 1.45 30.6 V.S. Industry VSI MK 2.58 3.10 20.2 OCBC OCBC SP 11.01 13.38 21.5 Siam Cement SCC TB 510.00 600.00 17.6
SELL Great Wall Motor 2333 HK 10.12 5.50 (45.7) UMW Holdings UMWH MK 5.45 4.80 (11.9)
KEY ASSUMPTIONS GDP (% yoy) 2016 2017F 2018F US 1.6 2.5 2.5 Euro Zone 1.7 1.8 1.6 Japan 1.0 0.9 1.2 Singapore 2.0 2.4 2.5 Malaysia 4.2 5.0 4.9 Thailand 3.2 3.3 3.3 Indonesia 5.0 5.2 5.5 Hong Kong 1.9 2.0 2.0 China 6.7 6.6 6.3 Brent (Average) (US$/bbl) 45 52 55 CPO (RM/mt) 2,653 2,600 2,400 Source: Bloomberg, UOB ETR, UOB Kay Hian
CORPORATE EVENTS Venue Begin Close
Roadshow with Banyan Tree Holdings Singapore 21 Sep 21 Sep Roadshow with China Yongda Canada/US 25 Sep 29 Sep Automobiles Services Holdings Roadshow with Xin Point Holdings Huizhou 27 Sep 27 Sep Roadshow with BBI Life Science Corp Hong Kong 27 Sep 28 Sep Conference Call with Thai Union Group Bangkok 29 Sep 29 Sep Roadshow with Bumrungrad Int’l Hospital Kuala Lumpur 6 Oct 6 Oct Asian Gems Conference 2017 Singapore 10 Oct 11 Oct UOB Kay Hian Annual Regional Strategy Kuala Lumpur 13 Nov 13 Nov Conference
COMPANY DESCRIPTION Wasion Group manufactures and sells smart meters and related equipment to grid companies and industrial and commercial power users in China.
STOCK DATA GICS sector IndustrialBloomberg ticker: 3393 HKShares issued (m): 1,011Market cap (HK$m): 3,830Market cap (US$m): 4913-mth avg daily t'over (US$m): 0.8
Earnings Recovery In 2018 To Be Driven By Next Generation Of Smart Meters Wasion’s earnings will probably recover from 2018 when sales of the next generation of smart meters kick in. In addition, as the SGCC has shortened payment terms again in 2017, Wasion’s receivable days – our biggest concern – will likely decline from 2H17, spurring cash flow. We raise 2017-19 core EPS estimates by 20%, 53% and 69% to Rmb0.17, Rmb0.29 and Rmb0.38 respectively, and raise our target price from HK$2.00 to HK$4.30. Upgrade from SELL to BUY.
WHAT’S NEW
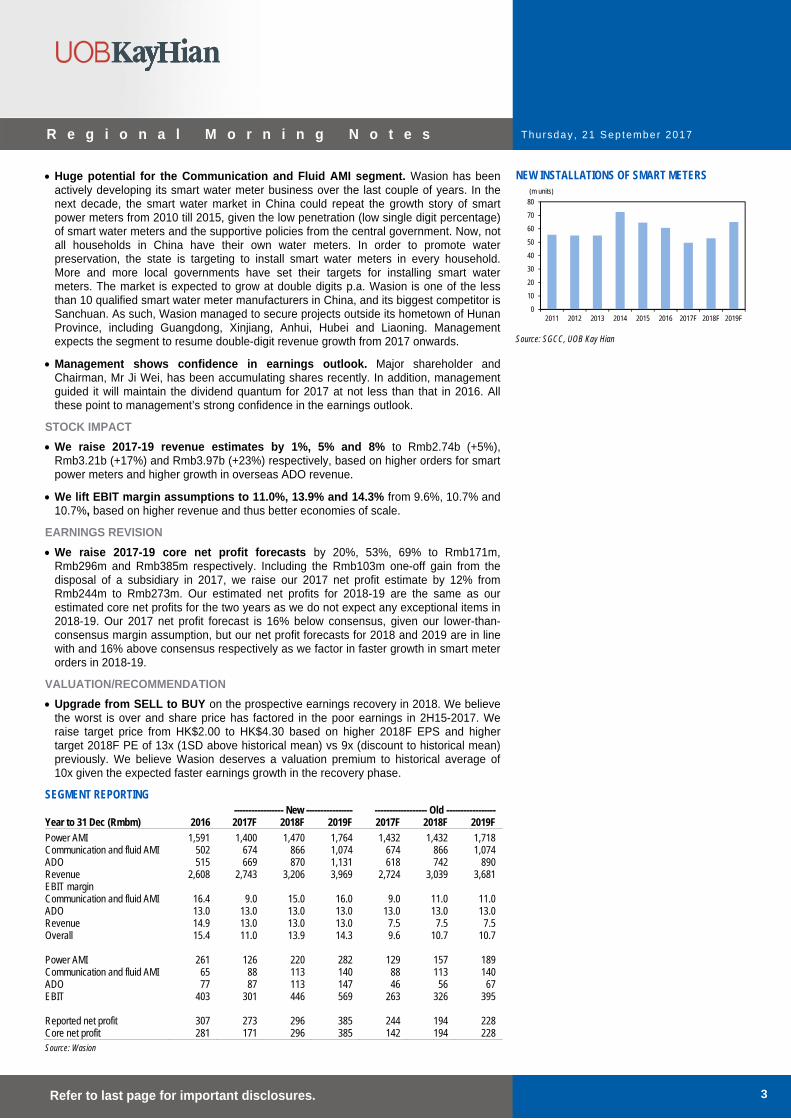
• Recovery of the Power AMI segment in 2018 with sales of the new generation of smart meters kicking in. Wasion Group Holdings’ (Waison) revenue was dragged down by the reduction in smart power meter procurement by the State Grid Corporation of China (SGCC) from 2H15 to 1H17. For 2017, we expect revenue from the Power Advanced Metering Infrastructure (AMI) segment to drop 10% yoy. Looking ahead, we expect the segment’s revenue to recover in 2018-19, driven by sales of the second generation of smart meters. The first generation of smart meters has been installed in China since 2010, and they were supposed to be replaced in 2016 given the replacement cycle of six years. But since the second generation of smart meters and the supplementary systems will only be ready by 2018, the replacement of the old smart meters has been postponed from 2016 to 2018. Replacement demand for smart meters in 2018-19 could be bigger than we expect, as the accumulated replacement demand for 2016-17 will also be reflected in the coming two years.
• Overseas orders are flowing in strongly, partly due to China’s One Belt One Road strategy. Those orders are mainly those for the smart meters and related devices from the utilities companies in developing countries like Indonesia, Egypt and Brazil. Overseas orders contributed 20% of Wasion’s total revenue in 1H17, and thus these are mitigating the tumble of smart meter orders from SGCC in 2017.
• ADO segment is likely to see revenue grow at a 30% CAGR in 2017-19, driven by the power-saving initiatives in China’s business communities. Wasion’s orders for ADO are coming from the transport industry (railway stations, airports), schools and data centres at Internet companies like Alibaba and Tencent (for big data). Further upside may come from escalating demand for smart meters and power distribution systems from electric vehicles (EV) recharging stations and distributed power grids for renewable energy sources.
• Huge potential for the Communication and Fluid AMI segment. Wasion has been actively developing its smart water meter business over the last couple of years. In the next decade, the smart water market in China could repeat the growth story of smart power meters from 2010 till 2015, given the low penetration (low single digit percentage) of smart water meters and the supportive policies from the central government. Now, not all households in China have their own water meters. In order to promote water preservation, the state is targeting to install smart water meters in every household. More and more local governments have set their targets for installing smart water meters. The market is expected to grow at double digits p.a. Wasion is one of the less than 10 qualified smart water meter manufacturers in China, and its biggest competitor is Sanchuan. As such, Wasion managed to secure projects outside its hometown of Hunan Province, including Guangdong, Xinjiang, Anhui, Hubei and Liaoning. Management expects the segment to resume double-digit revenue growth from 2017 onwards.
• Management shows confidence in earnings outlook. Major shareholder and Chairman, Mr Ji Wei, has been accumulating shares recently. In addition, management guided it will maintain the dividend quantum for 2017 at not less than that in 2016. All these point to management’s strong confidence in the earnings outlook.
STOCK IMPACT • We raise 2017-19 revenue estimates by 1%, 5% and 8% to Rmb2.74b (+5%),
Rmb3.21b (+17%) and Rmb3.97b (+23%) respectively, based on higher orders for smart power meters and higher growth in overseas ADO revenue.
• We lift EBIT margin assumptions to 11.0%, 13.9% and 14.3% from 9.6%, 10.7% and 10.7%, based on higher revenue and thus better economies of scale.
EARNINGS REVISION • We raise 2017-19 core net profit forecasts by 20%, 53%, 69% to Rmb171m,
Rmb296m and Rmb385m respectively. Including the Rmb103m one-off gain from the disposal of a subsidiary in 2017, we raise our 2017 net profit estimate by 12% from Rmb244m to Rmb273m. Our estimated net profits for 2018-19 are the same as our estimated core net profits for the two years as we do not expect any exceptional items in 2018-19. Our 2017 net profit forecast is 16% below consensus, given our lower-than-consensus margin assumption, but our net profit forecasts for 2018 and 2019 are in line with and 16% above consensus respectively as we factor in faster growth in smart meter orders in 2018-19.
VALUATION/RECOMMENDATION • Upgrade from SELL to BUY on the prospective earnings recovery in 2018. We believe
the worst is over and share price has factored in the poor earnings in 2H15-2017. We raise target price from HK$2.00 to HK$4.30 based on higher 2018F EPS and higher target 2018F PE of 13x (1SD above historical mean) vs 9x (discount to historical mean) previously. We believe Wasion deserves a valuation premium to historical average of 10x given the expected faster earnings growth in the recovery phase.
SEGMENT REPORTING ----------------- New ---------------- ------------------ Old ----------------- Year to 31 Dec (Rmbm) 2016 2017F 2018F 2019F 2017F 2018F 2019F Power AMI 1,591 1,400 1,470 1,764 1,432 1,432 1,718 Communication and fluid AMI 502 674 866 1,074 674 866 1,074 ADO 515 669 870 1,131 618 742 890 Revenue 2,608 2,743 3,206 3,969 2,724 3,039 3,681 EBIT margin Communication and fluid AMI 16.4 9.0 15.0 16.0 9.0 11.0 11.0 ADO 13.0 13.0 13.0 13.0 13.0 13.0 13.0 Revenue 14.9 13.0 13.0 13.0 7.5 7.5 7.5 Overall 15.4 11.0 13.9 14.3 9.6 10.7 10.7 Power AMI 261 126 220 282 129 157 189 Communication and fluid AMI 65 88 113 140 88 113 140 ADO 77 87 113 147 46 56 67 EBIT 403 301 446 569 263 326 395 Reported net profit 307 273 296 385 244 194 228 Core net profit 281 171 296 385 142 194 228 Source: Wasion
NEW INSTALLATIONS OF SMART METERS
0
10
20
30
40
50
60
70
80
2011 2012 2013 2014 2015 2016 2017F 2018F 2019F
(m units)
Source: SGCC, UOB Kay Hian
Thursday , 21 Sep tember 2017
4 Refer to last page for important disclosures.
R e g i o n a l M o r n i n g N o t e s
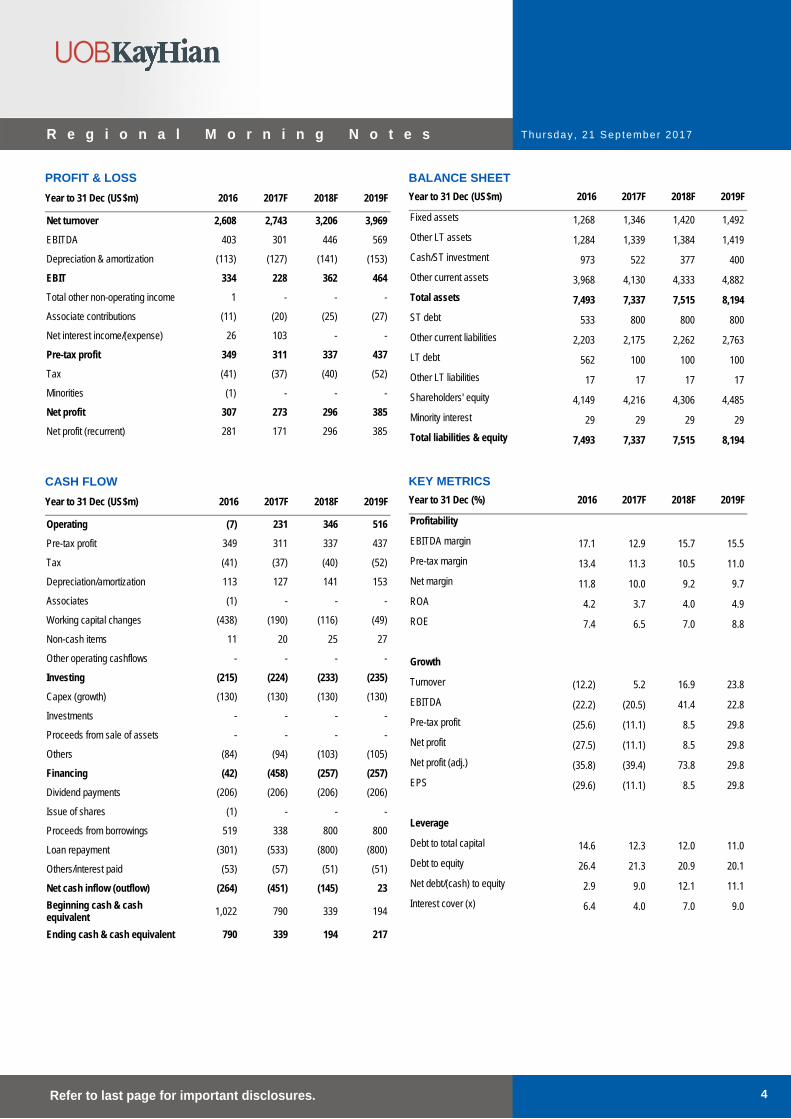
PROFIT & LOSS Year to 31 Dec (US$m) 2016 2017F 2018F 2019F
Leverage Debt to total capital 14.6 12.3 12.0 11.0 Debt to equity 26.4 21.3 20.9 20.1 Net debt/(cash) to equity 2.9 9.0 12.1 11.1 Interest cover (x) 6.4 4.0 7.0 9.0
Thursday , 21 Sep tember 2017
5 Refer to last page for important disclosures.
R e g i o n a l M o r n i n g N o t e s
SECTOR UPDATE
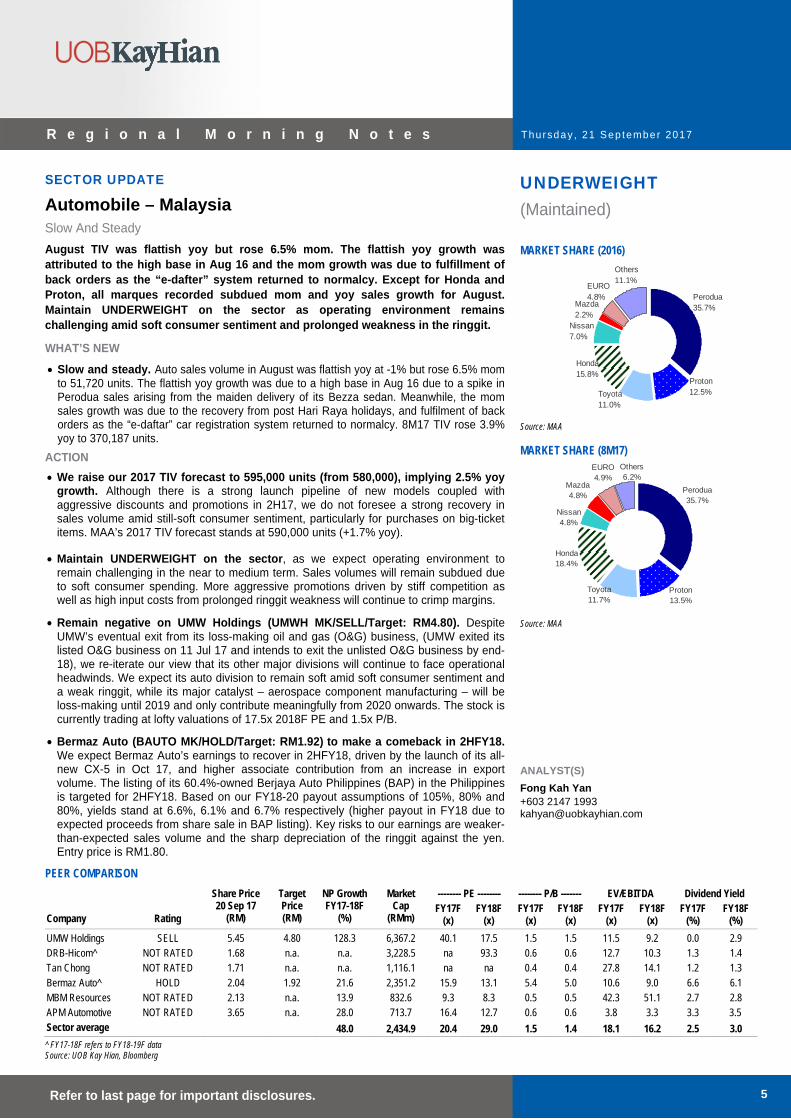
Automobile – Malaysia Slow And Steady August TIV was flattish yoy but rose 6.5% mom. The flattish yoy growth was attributed to the high base in Aug 16 and the mom growth was due to fulfillment of back orders as the “e-dafter” system returned to normalcy. Except for Honda and Proton, all marques recorded subdued mom and yoy sales growth for August. Maintain UNDERWEIGHT on the sector as operating environment remains challenging amid soft consumer sentiment and prolonged weakness in the ringgit.
WHAT’S NEW
• Slow and steady. Auto sales volume in August was flattish yoy at -1% but rose 6.5% mom to 51,720 units. The flattish yoy growth was due to a high base in Aug 16 due to a spike in Perodua sales arising from the maiden delivery of its Bezza sedan. Meanwhile, the mom sales growth was due to the recovery from post Hari Raya holidays, and fulfilment of back orders as the “e-daftar” car registration system returned to normalcy. 8M17 TIV rose 3.9% yoy to 370,187 units.
ACTION • We raise our 2017 TIV forecast to 595,000 units (from 580,000), implying 2.5% yoy
growth. Although there is a strong launch pipeline of new models coupled with aggressive discounts and promotions in 2H17, we do not foresee a strong recovery in sales volume amid still-soft consumer sentiment, particularly for purchases on big-ticket items. MAA’s 2017 TIV forecast stands at 590,000 units (+1.7% yoy).
• Maintain UNDERWEIGHT on the sector, as we expect operating environment to remain challenging in the near to medium term. Sales volumes will remain subdued due to soft consumer spending. More aggressive promotions driven by stiff competition as well as high input costs from prolonged ringgit weakness will continue to crimp margins.
• Remain negative on UMW Holdings (UMWH MK/SELL/Target: RM4.80). Despite UMW’s eventual exit from its loss-making oil and gas (O&G) business, (UMW exited its listed O&G business on 11 Jul 17 and intends to exit the unlisted O&G business by end-18), we re-iterate our view that its other major divisions will continue to face operational headwinds. We expect its auto division to remain soft amid soft consumer sentiment and a weak ringgit, while its major catalyst – aerospace component manufacturing – will be loss-making until 2019 and only contribute meaningfully from 2020 onwards. The stock is currently trading at lofty valuations of 17.5x 2018F PE and 1.5x P/B.
• Bermaz Auto (BAUTO MK/HOLD/Target: RM1.92) to make a comeback in 2HFY18. We expect Bermaz Auto’s earnings to recover in 2HFY18, driven by the launch of its all-new CX-5 in Oct 17, and higher associate contribution from an increase in export volume. The listing of its 60.4%-owned Berjaya Auto Philippines (BAP) in the Philippines is targeted for 2HFY18. Based on our FY18-20 payout assumptions of 105%, 80% and 80%, yields stand at 6.6%, 6.1% and 6.7% respectively (higher payout in FY18 due to expected proceeds from share sale in BAP listing). Key risks to our earnings are weaker-than-expected sales volume and the sharp depreciation of the ringgit against the yen. Entry price is RM1.80.
UNDERWEIGHT (Maintained) MARKET SHARE (2016)
Perodua35.7%
Proton12.5%Toyota
11.0%
Honda15.8%
Nissan7.0%
Mazda2.2%
EURO 4.8%
Others11.1%
Source: MAA MARKET SHARE (8M17)
Perodua35.7%
Proton13.5%
Toyota11.7%
Honda18.4%
Nissan4.8%
Mazda4.8%
EURO 4.9%
Others6.2%
Source: MAA ANALYST(S) Fong Kah Yan +603 2147 1993 [email protected]
PEER COMPARISON Share Price
20 Sep 17 (RM)
Target Price (RM)
NP Growth FY17-18F
(%)
Market Cap
(RMm)
-------- PE -------- -------- P/B ------- EV/EBITDA Dividend Yield
Company Rating FY17F FY18F FY17F FY18F FY17F FY18F FY17F FY18F
(x) (x) (x) (x) (x) (x) (%) (%) UMW Holdings SELL 5.45 4.80 128.3 6,367.2 40.1 17.5 1.5 1.5 11.5 9.2 0.0 2.9 DRB-Hicom^ NOT RATED 1.68 n.a. n.a. 3,228.5 na 93.3 0.6 0.6 12.7 10.3 1.3 1.4 Tan Chong NOT RATED 1.71 n.a. n.a. 1,116.1 na na 0.4 0.4 27.8 14.1 1.2 1.3 Bermaz Auto^ HOLD 2.04 1.92 21.6 2,351.2 15.9 13.1 5.4 5.0 10.6 9.0 6.6 6.1 MBM Resources NOT RATED 2.13 n.a. 13.9 832.6 9.3 8.3 0.5 0.5 42.3 51.1 2.7 2.8 APM Automotive NOT RATED 3.65 n.a. 28.0 713.7 16.4 12.7 0.6 0.6 3.8 3.3 3.3 3.5 Sector average 48.0 2,434.9 20.4 29.0 1.5 1.4 18.1 16.2 2.5 3.0 ^ FY17-18F refers to FY18-19F data Source: UOB Kay Hian, Bloomberg
Thursday , 21 Sep tember 2017
6 Refer to last page for important disclosures.
R e g i o n a l M o r n i n g N o t e s
AUG 17 TIV BREAKDOWN Aug 16 Aug 17 Jul 17 mom chg (%) yoy chg (%) 8M17 8M16 yoy chg (%) Total Industry Total Passenger 46,227 46,010 43,524 5.7 (0.5) 345,283 328,265 5.2 Total Commercial 5,992 5,710 5,029 13.5 (4.7) 39,450 41,922 (5.9) Total 52,219 51,720 48,553 6.5 (1.0) 384,733 370,187 3.9 Total National Total Passenger 26,408 25,573 25,312 1.0 (3.2) 193,319 183,531 5.3 Total Commercial 49 7 4 75.0 (85.7) 156 302 (48.3) Total 26,457 25,580 25,316 1.0 (3.3) 193,475 183,833 5.2 Total Non-National Total Passenger 19,819 20,437 18,212 12.2 3.1 151,964 144,734 5.0 Total Commercial 5,943 5,703 5,025 13.5 (4.0) 39,294 41,620 (5.6) Total 25,762 26,140 23,237 12.5 1.5 191,258 186,354 2.6 Source: MAA
PERFORMANCE OF NATIONAL & NON-NATIONAL MARQUES
National Perodua & Proton
National segment sales volume for August was subdued, growing only 1% mom and down 3.3% yoy to 25,580 units. Perodua’s August sales volume declined 1.5% mom and 12.3% yoy, while Proton’s sales volume rose 8.4% mom but was up 45.4% yoy. In 8M17, Perodua and Proton recorded yoy growth of 2.6% and 17.6% to 137,225 units and 51,799 units respectively. We attribute the strong performance from Proton in 2H17 thus far to the launch of its all-new Iriz in Jun 17 (priced at RM43,800-58,800). We also gather an all-new SUV Satria based on Geely’s Boyue is in the pipeline as well.
Non-national
Toyota August sales volume rose 2.9% mom but shed 13.1% yoy to 5,705 units. 8M17 sales volume rose 15.8% yoy to 44,971 units. Toyota is targeting to sell 70,000 units for 2017 (2016: 63,757), driven by new launches. In 4Q16, it launched the all-new Innova as well as the facelifted Vios, Camry and Altis. Last month, public preview of its C-HR (a SUV competing against Honda’s HR-V and Mazda CX-3) had begun in its showroom in Petaling Jaya.
Honda August sales volume rose 13.5% mom and 17.5% yoy to 9,733 units. 8M17 sales volume was up 27% yoy to 70,836 units, driven by: a) aggressive discounting, and b) launches of the new CKD seven-seat SUV, BR-V (launched in Jan 17), the facelifted City (launched in Mar 17), the facelifted Jazz (launched in Jul 17), and the all-new CR-V (launched in Jul 17). We gather that there will be two further launches this year. Honda targets to achieve sales of 100,000 units (+8.9% yoy).
Nissan August sales volume continued to be lacklustre, up 1.3% mom but declining 18.6% yoy to 2,551 units. 8M17 sales volume declined 32% yoy to 18,606 units. This marked Nissan’s 14th consecutive month of yoy declines in sales volume since Jul 16. Nissan’s weak performance thus far is attributed to its lack of new product offerings until 2018.
Mazda August sales volume rose 14.4% mom but decreased 18.6% yoy to 802 units. 8M17 sales volume declined 30.8% yoy to 6,274 units due to no new launches as well as its less aggressive discounts and promotions as compared with Japanese peers. However, we expect sales volume to recover on the arrival of the all-new CX-5 in Oct 17.
Source: MAA, UOB Kay Hian
MONTHLY SALES VOLUME FOR 2016 AND 2017 MONTHLY SALES VOLUME OF MAJOR MARQUES
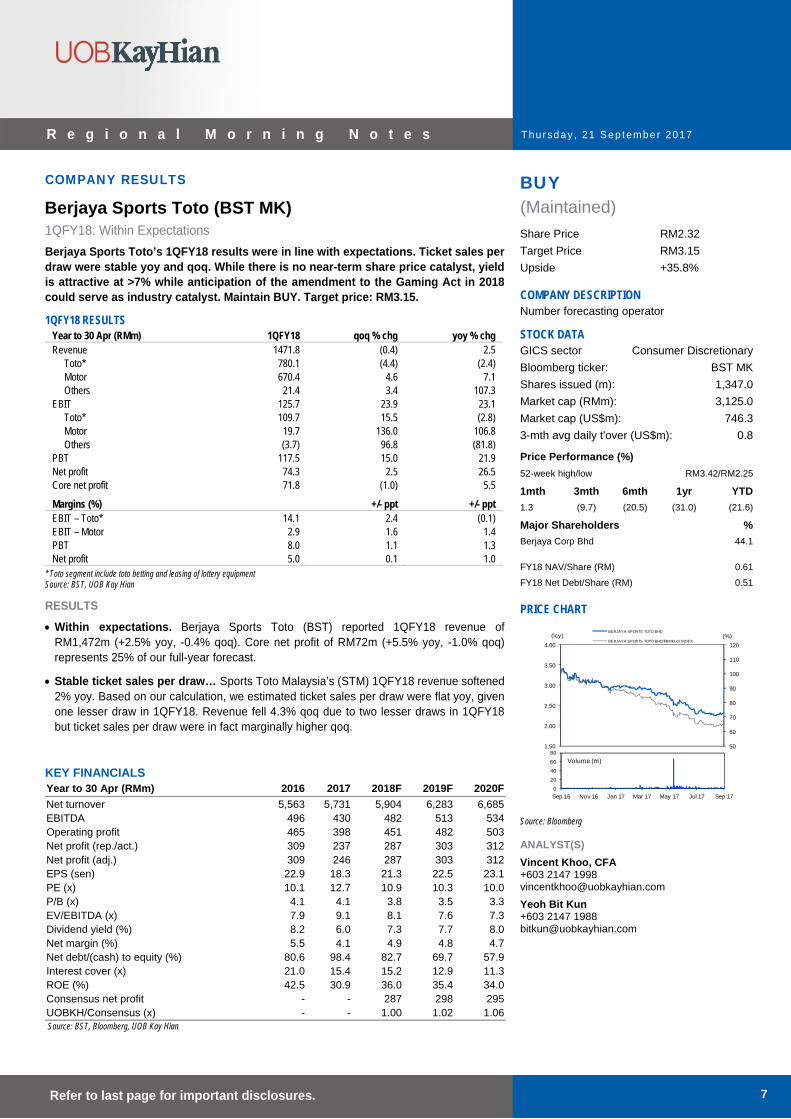
1QFY18: Within Expectations Berjaya Sports Toto’s 1QFY18 results were in line with expectations. Ticket sales per draw were stable yoy and qoq. While there is no near-term share price catalyst, yield is attractive at >7% while anticipation of the amendment to the Gaming Act in 2018 could serve as industry catalyst. Maintain BUY. Target price: RM3.15.
1QFY18 RESULTS Year to 30 Apr (RMm) 1QFY18 qoq % chg yoy % chg Revenue 1471.8 (0.4) 2.5
* Toto segment include toto betting and leasing of lottery equipment Source: BST, UOB Kay Hian
RESULTS
• Within expectations. Berjaya Sports Toto (BST) reported 1QFY18 revenue of RM1,472m (+2.5% yoy, -0.4% qoq). Core net profit of RM72m (+5.5% yoy, -1.0% qoq) represents 25% of our full-year forecast.
• Stable ticket sales per draw… Sports Toto Malaysia’s (STM) 1QFY18 revenue softened 2% yoy. Based on our calculation, we estimated ticket sales per draw were flat yoy, given one lesser draw in 1QFY18. Revenue fell 4.3% qoq due to two lesser draws in 1QFY18 but ticket sales per draw were in fact marginally higher qoq.
• …and prize payout. Despite the drop in revenue, STM’s PBT increased 2.3% yoy in 1QFY18 due to lower prize payout. We estimate 1QFY18’s prize payout at 61%, slightly better than 1QFY17’s. On a qoq basis, despite the softer revenue, PBT rose 20.8%, thanks to the lower prize payout as well as lower operating expenses.
• Philippines gaming operations: Revenue and pre-tax profit fell 4.6% yoy and 25.2% yoy in 1QFY18 respectively, mainly due to lower lease rental income from the Philippine Charity Sweepstakes Office (PCSO) and higher operating expenses.
• Motor: Impressive improvement on higher new car sales. H.R. Owen’ sales grew 7% yoy while PBT rose 125% yoy in FY1Q18, driven by higher sales of new and used vehicles coupled with certain new models available for sale during the quarter.
• 4-sen dividend. BST declared the first interim dividend per share (DPS) of 4 sen, representing a 73% payout (1QFY17: 4 sen DPS). We forecast a full-year dividend payout of 80%.
STOCK IMPACT
• Increased efforts to curb illegal operators. We understand that the authorities have recently increased efforts to curb illegal NFO operations. We understand that ticket sales in certain states have improved recently but the sustainability in such curbs remains an issue.
• Gaming Act amendment could only be a 2018 catalyst. While the proposed amendment on the Common Gaming House Act 1953 (which paves the way for an eventual liberalisation of online NFO) may have been delayed to 2018, we are still hopeful that this amendment could level the playing field within the NFO sector, noting that both BST and Magnum do not have rival Da Ma Cai’s (which is governed by the Tote Board instead of the Ministry of Finance) flexibility to offer betting via internet.
EARNINGS REVISION/RISK
• None.
• Risks include: a) losing market share to illegal bookies, b) acquisition of non-core businesses, and c) significant related-party transactions which would be unfavourable to minority shareholders.
VALUATION/RECOMMENDATION
• Maintain BUY and DCF-based target price of RM3.15, which implies 14.8x FY18F PE and 14.0x FY19F PE. BST’s share price has fallen 22% ytd, which makes its prospective yield of 7.3% appears attractive. We opine that BST’s share price weakness was in part to its investment into sister companies and non-core businesses (see RHS table) as well as in part to the negative sentiment created by an unrelated event – the Inland Revenue Board’s huge tax claims against industry peer, Magnum. Despite the attractive yield and stable outlook for BST’s business, its share price could be under pressure should the company continuously invest in related-party companies, which are non-synergistic to its core business.
Date Investment Jul 17 5.4m shares in 7-Eleven Malaysia for RM7.4m Jun 16 3.9m shares in 7-Eleven for RM5.4m Dec 16 7m shares in Berjaya Assets for RM6.8m
Dec 16 Additional 26% stake in UK automobile distributor H.R. Owen for RM83m
COMPANY DESCRIPTION Raffles Medical Group is a health care provider. The company operates medical clinics, imaging centres, and medical laboratories. Raffles provides general and specialised medical, medical evacuation, medical advisory and dental treatment services.
STOCK DATA GICS sector Health CareBloomberg ticker: RFMD SPShares issued (m): 1,770.6Market cap (S$m): 1,956.5Market cap (US$m): 1,455.03-mth avg daily t'over (US$m): 3.1Price Performance (%) 52-week high/low S$1.54/S$1.041mth 3mth 6mth 1yr YTD(2.7) (18.2) (22.5) (27.4) (23.1)Major Shareholders %Dr Loo Choon Yong 51.5
FY17 NAV/Share (S$) 0.40FY17 Net Debt/Share (S$) 0.07
While earnings outlook for the next two years will likely be crimped by start-up losses in China, we believe growth over the next 10 years will be significantly enhanced where capacity will more than quadruple. Since our downgrade in April, share price has declined nearly 22% on expansion cost concerns. RMG is trading at a 2018 15% discount to regional peers. This could be an accumulation opportunity for investors with a horizon of three years or more. Upgrade to BUY with a DCF-target price of S$1.28. WHAT’S NEW • Upgrade to BUY with a new target price of S$1.28 on steep share price decline and
long-term growth. Since our downgrade in April (to HOLD), the Raffles Medical Group’s (RMG) share price declined nearly 22%. While earnings outlook for the next two years for RMG will be dampened due to expansion plans, we reckon the group’s runway for long-term growth will be significantly enhanced over the next 10 years.
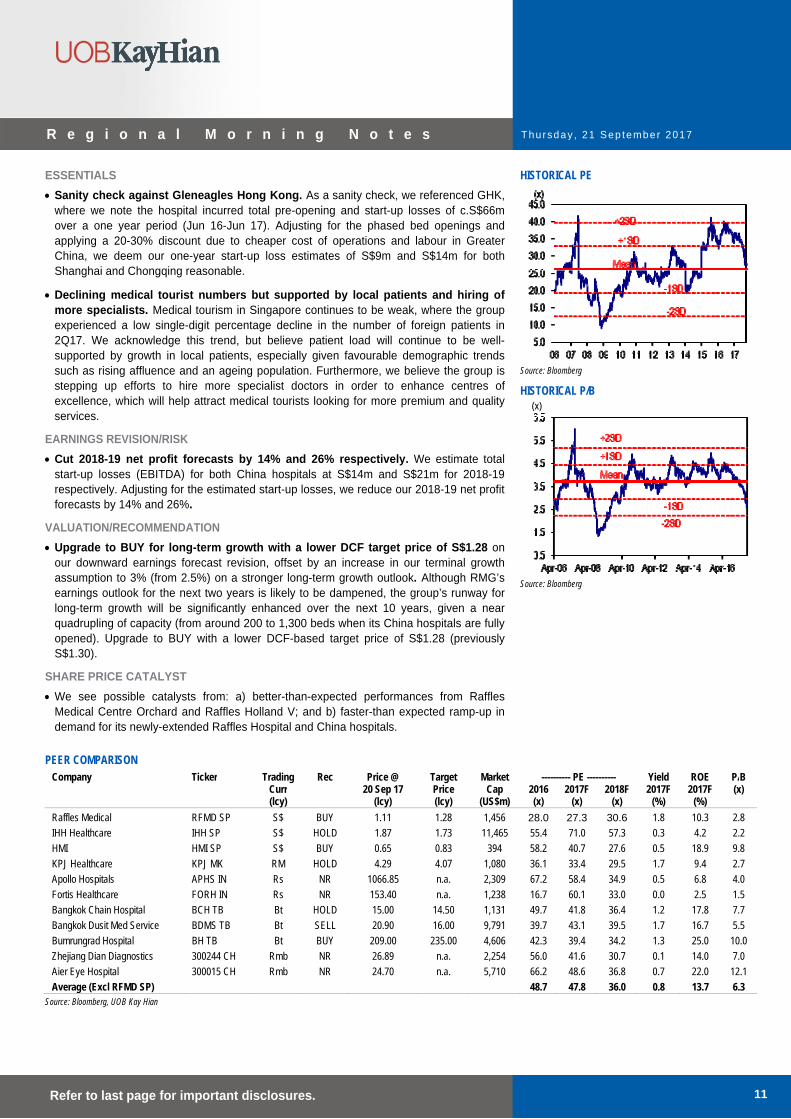
• RMG is trading at an undemanding valuation compared to peers. RMG is trading at 31x 2018F PE, which is inexpensive as peers are trading at 36x. While we note that RMG is trading at around +1SD to its long-term mean of 26x, we believe that it is justified, given that long-term growth over the next ten years will be significantly enhanced during which capacity will more than quadruple (from around 200 to 1,300 beds).
STOCK IMPACT • Raffles Chongqing on track, long-term growth from One Belt One Road. Raffles
Chongqing is targeted for completion in 2H18. We understand that the hospitals will be opened progressively in phases, where 150-180 beds (of the 700-bed capacity) will be initially opened and ramped up as demand picks up. As for doctor recruitment, we expect it to commence in the beginning of 2018, where around 12 specialists will be posted to the hospitals as medical leaders. Furthermore, we expect the group to target for 50% locally hired doctors in China. With a capacity of 700 beds, we anticipate strong long-term growth potential for Raffles Chongqing, underpinned by the One Belt One Road initiative and rising affluence in the region.
• What quantum of start-up losses should we expect? In terms of upfront costs for both Chongqing and Shanghai, we expect them to be well managed. Unlike IHH’s Gleneagles Hong Kong (GHK) where all 500 beds were opened at one go, both Raffles Chongqing and Shanghai will be opened in phases, which allows revenue growth to be more closely matched with costs and hence facilitate a faster rate of breakeven. Based on our forecasts, we estimate start-up losses (EBITDA) for Chongqing at S$14m in 2018 and S$9m for the smaller capacity Raffles Shanghai in 2019 when it opens in the second half.
ESSENTIALS • Sanity check against Gleneagles Hong Kong. As a sanity check, we referenced GHK,
where we note the hospital incurred total pre-opening and start-up losses of c.S$66m over a one year period (Jun 16-Jun 17). Adjusting for the phased bed openings and applying a 20-30% discount due to cheaper cost of operations and labour in Greater China, we deem our one-year start-up loss estimates of S$9m and S$14m for both Shanghai and Chongqing reasonable.
• Declining medical tourist numbers but supported by local patients and hiring of more specialists. Medical tourism in Singapore continues to be weak, where the group experienced a low single-digit percentage decline in the number of foreign patients in 2Q17. We acknowledge this trend, but believe patient load will continue to be well-supported by growth in local patients, especially given favourable demographic trends such as rising affluence and an ageing population. Furthermore, we believe the group is stepping up efforts to hire more specialist doctors in order to enhance centres of excellence, which will help attract medical tourists looking for more premium and quality services.
EARNINGS REVISION/RISK • Cut 2018-19 net profit forecasts by 14% and 26% respectively. We estimate total
start-up losses (EBITDA) for both China hospitals at S$14m and S$21m for 2018-19 respectively. Adjusting for the estimated start-up losses, we reduce our 2018-19 net profit forecasts by 14% and 26%.
VALUATION/RECOMMENDATION • Upgrade to BUY for long-term growth with a lower DCF target price of S$1.28 on
our downward earnings forecast revision, offset by an increase in our terminal growth assumption to 3% (from 2.5%) on a stronger long-term growth outlook. Although RMG’s earnings outlook for the next two years is likely to be dampened, the group’s runway for long-term growth will be significantly enhanced over the next 10 years, given a near quadrupling of capacity (from around 200 to 1,300 beds when its China hospitals are fully opened). Upgrade to BUY with a lower DCF-based target price of S$1.28 (previously S$1.30).
SHARE PRICE CATALYST • We see possible catalysts from: a) better-than-expected performances from Raffles
Medical Centre Orchard and Raffles Holland V; and b) faster-than expected ramp-up in demand for its newly-extended Raffles Hospital and China hospitals.
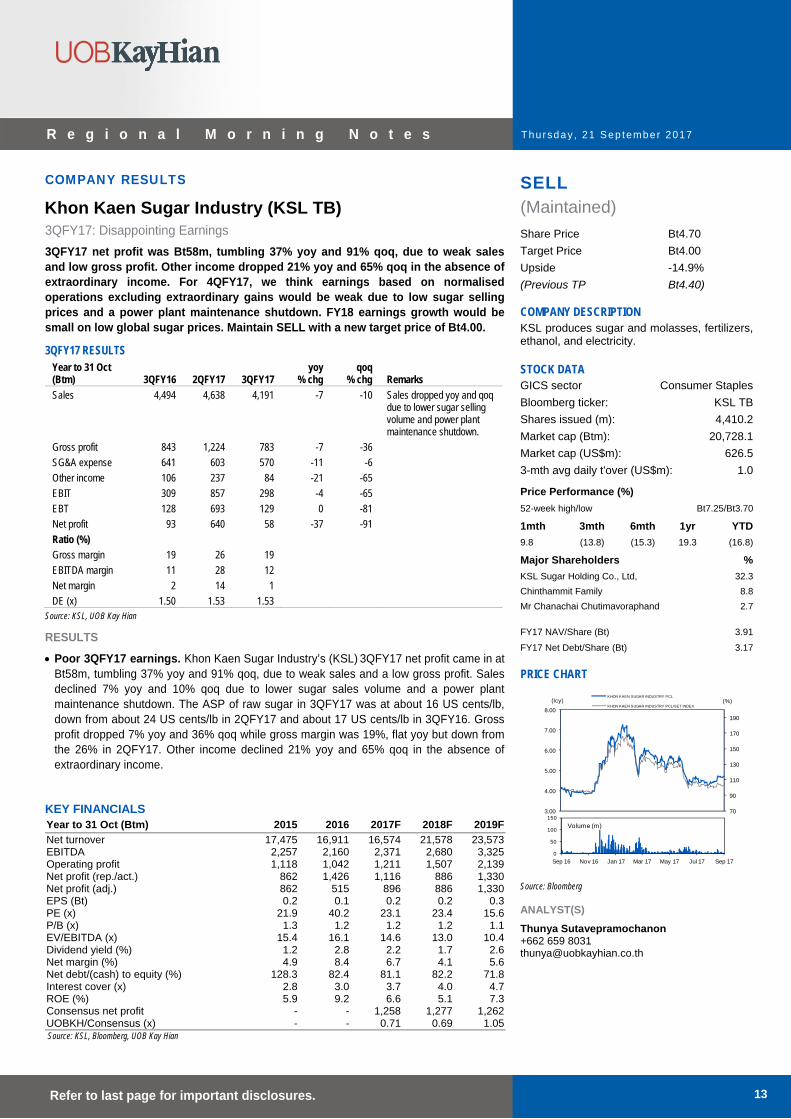
3QFY17: Disappointing Earnings 3QFY17 net profit was Bt58m, tumbling 37% yoy and 91% qoq, due to weak sales and low gross profit. Other income dropped 21% yoy and 65% qoq in the absence of extraordinary income. For 4QFY17, we think earnings based on normalised operations excluding extraordinary gains would be weak due to low sugar selling prices and a power plant maintenance shutdown. FY18 earnings growth would be small on low global sugar prices. Maintain SELL with a new target price of Bt4.00.
3QFY17 RESULTS Year to 31 Oct yoy qoq (Btm) 3QFY16 2QFY17 3QFY17 % chg % chg Remarks Sales 4,494 4,638 4,191 -7 -10 Sales dropped yoy and qoq
due to lower sugar selling volume and power plant maintenance shutdown.
• Poor 3QFY17 earnings. Khon Kaen Sugar Industry’s (KSL) 3QFY17 net profit came in at Bt58m, tumbling 37% yoy and 91% qoq, due to weak sales and a low gross profit. Sales declined 7% yoy and 10% qoq due to lower sugar sales volume and a power plant maintenance shutdown. The ASP of raw sugar in 3QFY17 was at about 16 US cents/lb, down from about 24 US cents/lb in 2QFY17 and about 17 US cents/lb in 3QFY16. Gross profit dropped 7% yoy and 36% qoq while gross margin was 19%, flat yoy but down from the 26% in 2QFY17. Other income declined 21% yoy and 65% qoq in the absence of extraordinary income.
• 4QFY17 normalised earnings likely to be weak. Key drags would be low sugar ASP and the power plant maintenance shutdown. However, there would be some extraordinary gains on the back of non-cash items in 4QFY17 from the merger with BCP which we have not included in our projections.
• FY18 earnings growth likely to be small. Management expects sugarcane input in FY18 would reach 9m tonnes, surging 29% yoy, due to favourable weather. ASP of raw sugar in FY18 is expected at 16 US cents/lb, down 16% yoy, in line with global trends. Global sugar prices are being pressured by expectations of a global sugar surplus of 6.6m tonnes in 2018 (2017: deficit 2.7m tonnes, 2016: deficit 5m tonnes). We think FY18 earnings would drop 21% yoy due to lower yoy other income (Bt241m booked from a court case win in FY17 while the effective tax rate would normalise at 20%, higher than in FY17.
EARNINGS REVISION/RISK
• We cut our FY17-18 net profit forecasts by 35% and 27% respectively to reflect the poor 3QFY17 earnings. We think consensus may revise down its FY17-18 earnings forecasts too.
• Maintain SELL with a new target price of Bt4.00, based on 1x FY18F P/B, which implies 20x FY18F PE. We have not seen any positive catalysts that could boost FY18 earnings growth.
SHARE PRICE CATALYST
• Global sugar price deficit.
• Crude oil price increase as sugar prices have a 71% correlation with oil prices.
OPERATING PROFIT BREAKDOWN (Btm) 9MFY16 9MFY17 Sugar business
Thai operation 2,443 1,318 Other countries - 4 196
Ethanol Business 292 286 Power Plant Business 617 682 Other 90 - 44
Minor Impact On Earnings From Treasury Department’s Rental Revisions, But Valuations Are Stretched; Downgrade To SELL The Treasury Department’s notice on retroactive rental charges has cleared an overhang on AOT’s stock price. However, the stock price has overcome this wall of worry, rising 50% ytd, supported by positives such as a recovery in Chinese tourist arrivals and an upward revision in duty free rental revisions at BKK and DMK. AOT trades at 40x FY17F PE and 35.5x FY18F PE. Meanwhile, the airport has Bt144b in capex commitments until 2022, which would require external funding. Downgrade to SELL with a revised target price of Bt47.70.
WHAT’S NEW • Clarity on retroactive state property rental revisions. In 2QFY17, Airports of Thailand
(AOT) had announced that the Treasury department had demanded an additional Bt20.7b in rental charges for BKK. The Treasury subsequently announced that retroactive rental revisions for 2012-16 at Suvarnabhumi Airport (BKK) will amount to Bt1.4b. However, this is in addition to the Bt1.264b that was recognised retroactively for Don Mueang (DMK) and regional airports in their reserves in 2QFY17.
• Rental revisions from 2018-22 will result in a further increase of about Bt900m p.a. In addition to a 5% share of revenue, the state will place a levy on assets based on ROA methodology. Specifically, AOT will be levied a 3% charge on commercial service properties and empty properties would be levied a 2% charge. In addition, the rates will be adjusted by 9% every three years.
STOCK IMPACT • Downgrade to SELL. The stock has risen by 49% and positives have been excessively
priced in. Expectations of a return of Chinese visitors, commercial concession revisions at Don Muaeng and BKK post-2021 have been key factors for the steep rise in share price. However, AOT has approximately Bt144b in capex commitments until 2022 and we estimate that about a third of that would have to be funded via debt. Meanwhile, valuations are excessive at 40x FY17F PE and 35x FY18F PE.
KEY FINANCIALS Year to 30 Sep (Btm) 2015 2016 2017F 2018F 2019F
• We lower our FY17 net profit forecast by Bt1.4b and our FY18 net profit forecast by Bt0.4b to take into account the new rental revisions. We have however raised our FY20-22 earnings forecasts by Bt1.2-1.6b to take into account higher duty free and retail revenue.
VALUATION/RECOMMENDATION
• Downgrade to SELL with a revised target price of Bt47.70. We raise our target price by 12% following: a) the removal of Bt1.60 per share in equity adjustments based on the Treasury Department’s initial Bt20.7b proposed levy; b) upward rental revisions for FY20-FY22; and c) rolling forward our DCF valuation to FY18-22. We value AOT based on DCF with an unchanged WACC of 7.6% and terminal growth rate of 3%. Our target price of Bt47.70 implies 28.6x FY18F PE.
SHARE PRICE CATALYST
• None.
DCF VALUATION
BT (m) BT($)
Per share NPV of OCF 199,466 14.0 NPV of Capex -119,991 -8.4 NPV of Terminal value 574,843 40.2 Enterprise Value 654,318 45.8 Less: Net (Debt) Cash 25,685 1.8 Equity Value 680,003 47.70
Disclosures/Disclaimers This report is prepared by UOB Kay Hian Private Limited (“UOBKH”), which is a holder of a capital markets services licence and an exempt financial adviser in Singapore. This report is provided for information only and is not an offer or a solicitation to deal in securities or to enter into any legal relations, nor an advice or a recommendation with respect to such securities. This report is prepared for general circulation. It does not have regard to the specific investment objectives, financial situation and the particular needs of any recipient hereof. Advice should be sought from a financial adviser regarding the suitability of the investment product, taking into account the specific investment objectives, financial situation or particular needs of any person in receipt of the recommendation, before the person makes a commitment to purchase the investment product. This report is confidential. This report may not be published, circulated, reproduced or distributed in whole or in part by any recipient of this report to any other person without the prior written consent of UOBKH. This report is not directed to or intended for distribution to or use by any person or any entity who is a citizen or resident of or located in any locality, state, country or any other jurisdiction as UOBKH may determine in its absolute discretion, where the distribution, publication, availability or use of this report would be contrary to applicable law or would subject UOBKH and its connected persons (as defined in the Financial Advisers Act, Chapter 110 of Singapore) to any registration, licensing or other requirements within such jurisdiction. The information or views in the report (“Information”) has been obtained or derived from sources believed by UOBKH to be reliable. However, UOBKH makes no representation as to the accuracy or completeness of such sources or the Information and UOBKH accepts no liability whatsoever for any loss or damage arising from the use of or reliance on the Information. UOBKH and its connected persons may have issued other reports expressing views different from the Information and all views expressed in all reports of UOBKH and its connected persons are subject to change without notice. UOBKH reserves the right to act upon or use the Information at any time, including before its publication herein. Except as otherwise indicated below, (1) UOBKH, its connected persons and its officers, employees and representatives may, to the extent permitted by law, transact with, perform or provide broking, underwriting, corporate finance-related or other services for or solicit business from, the subject corporation(s) referred to in this report; (2) UOBKH, its connected persons and its officers, employees and representatives may also, to the extent permitted by law, transact with, perform or provide broking or other services for or solicit business from, other persons in respect of dealings in the securities referred to in this report or other investments related thereto; (3) the officers, employees and representatives of UOBKH may also serve on the board of directors or in trustee positions with the subject corporation(s) referred to in this report. (All of the foregoing is hereafter referred to as the “Subject Business”); and (4) UOBKH may otherwise have an interest (including a proprietary interest) in the subject corporation(s) referred to in this report. As of the date of this report, no analyst responsible for any of the content in this report has any proprietary position or material interest in the securities of the corporation(s) which are referred to in the content they respectively author or are otherwise responsible for. IMPORTANT DISCLOSURES FOR U.S. PERSONS This research report was prepared by UOBKH, a company authorized, as noted above, to engage in securities activities in Singapore. UOBKH is not a registered broker-dealer in the United States and, therefore, is not subject to U.S. rules regarding the preparation of research reports and the independence of research analysts. This research report is provided for distribution by UOBKH (whether directly or through its US registered broker dealer affiliate named below) to “major U.S. institutional investors” in reliance on the exemption from registration provided by Rule 15a-6 of the U.S. Securities Exchange Act of 1934, as amended (the “Exchange Act”). All US persons that receive this document by way of distribution from or which they regard as being from UOBKH by their acceptance thereof represent and agree that they are a major institutional investor and understand the risks involved in executing transactions in securities. Any U.S. recipient of this research report wishing to effect any transaction to buy or sell securities or related financial instruments based on the information provided in this research report should do so only through UOB Kay Hian (U.S.) Inc (“UOBKHUS”), a registered broker-dealer in the United States. Under no circumstances should any recipient of this research report effect any transaction to buy or sell securities or related financial instruments through UOBKH. UOBKHUS accepts responsibility for the contents of this research report, subject to the terms set out below, to the extent that it is delivered to and intended to be received by a U.S. person other than a major U.S. institutional investor. The analyst whose name appears in this research report is not registered or qualified as a research analyst with the Financial Industry Regulatory Authority (“FINRA”) and may not be an associated person of UOBKHUS and, therefore, may not be subject to applicable restrictions under FINRA Rules on communications with a subject company, public appearances and trading securities held by a research analyst account.
Thursda y , 21 Sep tember 2017
20 Refer to last page for important disclosures.
R e g i o n a l M o r n i n g N o t e s
Analyst Certification/Regulation AC Each research analyst of UOBKH who produced this report hereby certifies that (1) the views expressed in this report accurately reflect his/her personal views about all of the subject corporation(s) and securities in this report; (2) the report was produced independently by him/her; (3) he/she does not carry out, whether for himself/herself or on behalf of UOBKH or any other person, any of the Subject Business involving any of the subject corporation(s) or securities referred to in this report; and (4) he/she has not received and will not receive any compensation that is directly or indirectly related or linked to the recommendations or views expressed in this report or to any sales, trading, dealing or corporate finance advisory services or transaction in respect of the securities in this report. However, the compensation received by each such research analyst is based upon various factors, including UOBKH’s total revenues, a portion of which are generated from UOBKH’s business of dealing in securities. Reports are distributed in the respective countries by the respective entities and are subject to the additional restrictions listed in the following table. General This report is not intended for distribution, publication to or use by any person or entity who is a citizen or resident of or
located in any country or jurisdiction where the distribution, publication or use of this report would be contrary to applicable law or regulation.
Hong Kong This report is distributed in Hong Kong by UOB Kay Hian (Hong Kong) Limited ("UOBKHHK"), which is regulated by the Securities and Futures Commission of Hong Kong. Neither the analyst(s) preparing this report nor his associate, has trading and financial interest and relevant relationship specified under Para. 16.4 of Code of Conduct in the listed corporation covered in this report. UOBKHHK does not have financial interests and business relationship specified under Para. 16.5 of Code of Conduct with the listed corporation covered in this report. Where the report is distributed in Hong Kong and contains research analyses or reports from a foreign research house, please note: (i) recipients of the analyses or reports are to contact UOBKHHK (and not the relevant foreign research house) in Hong Kong in respect of any matters arising from, or in connection with, the analysis or report; and (ii) to the extent that the analyses or reports are delivered to and intended to be received by any person in Hong Kong who is not a professional investor, or institutional investor, UOBKHHK accepts legal responsibility for the contents of the analyses or reports only to the extent required by law.
Indonesia This report is distributed in Indonesia by PT UOB Kay Hian Sekuritas, which is regulated by Financial Services Authority of Indonesia (OJK). Where the report is distributed in Indonesia and contains research analyses or reports from a foreign research house, please note recipients of the analyses or reports are to contact PT UOBKH (and not the relevant foreign research house) in Indonesia in respect of any matters arising from, or in connection with, the analysis or report.
Malaysia Where the report is distributed in Malaysia and contains research analyses or reports from a foreign research house, the recipients of the analyses or reports are to contact UOBKHM (and not the relevant foreign research house) in Malaysia, at +603-21471988, in respect of any matters arising from, or in connection with, the analysis or report as UOBKHM is the registered person under CMSA to distribute any research analyses in Malaysia.
Singapore This report is distributed in Singapore by UOB Kay Hian Private Limited ("UOBKH"), which is a holder of a capital markets services licence and an exempt financial adviser regulated by the Monetary Authority of Singapore.Where the report is distributed in Singapore and contains research analyses or reports from a foreign research house, please note: (i) recipients of the analyses or reports are to contact UOBKH (and not the relevant foreign research house) in Singapore in respect of any matters arising from, or in connection with, the analysis or report; and (ii) to the extent that the analyses or reports are delivered to and intended to be received by any person in Singapore who is not an accredited investor, expert investor or institutional investor, UOBKH accepts legal responsibility for the contents of the analyses or reports only to the extent required by law.
Thailand This report is distributed in Thailand by UOB Kay Hian Securities (Thailand) Public Company Limited, which is regulated by the Securities and Exchange Commission of Thailand.
United Kingdom
This report is being distributed in the UK by UOB Kay Hian (U.K.) Limited, which is an authorised person in the meaning of the Financial Services and Markets Act and is regulated by The Financial Conduct Authority. Research distributed in the UK is intended only for institutional clients.
United States of America (‘U.S.’)
This report cannot be distributed into the U.S. or to any U.S. person or entity except in compliance with applicable U.S. laws and regulations. It is being distributed in the U.S. by UOB Kay Hian (US) Inc, which accepts responsibility for its contents. Any U.S. person or entity receiving this report and wishing to effect transactions in any securities referred to in the report should contact UOB Kay Hian (US) Inc. directly.
Copyright 2017, UOB Kay Hian Pte Ltd. All rights reserved. http://research.uobkayhian.com RCB Regn. No. 197000447W