116
Regional Roads Investment Strategy Far North Queensland Regional Organisation of Councils Tourism Routes 11 January 2021

Regional Roads Investment StrategyFar North Queensland Regional Organisation of Councils
Tourism Routes
11 January 2021

Tou rism R outes Te chnical Pape rFar N ort h Qu eensl and R egio nal O rga nisatio n of C ouncils (FN QROC)

Tourism Routes
i
Regional Roads Investment Strategy
Project No: IH167200Document Title: Tourism RoutesDocument No.:Revision: 6.4Date: 11 January 2021Client Name: Far North Queensland Regional Organisation of CouncilsClient No:Project Manager: Craig GorlickAuthor: Craig GorlickFile Name: J:\IE\Projects\05_Northern\IH167200\21 Deliverables\Tourism routes\REV 6\IH167200
FNQROC RRIS Tourism Routes Rev 6.4.docx
Jacobs Australia Pty Limited
32 Cordelia StreetPO Box 3848South Brisbane QLD 4101 AustraliaT +61 7 3026 7100F +61 7 3026 7300www.jacobs.com
© Copyright 2019 Jacobs Australia Pty Limited. The concepts and information contained in this document are the property of Jacobs. Use orcopying of this document in whole or in part without the written permission of Jacobs constitutes an infringement of copyright.
Limitation: This document has been prepared on behalf of, and for the exclusive use of Jacobs’ client, and is subject to, and issued in accordance with, theprovisions of the contract between Jacobs and the client. Jacobs accepts no liability or responsibility whatsoever for, or in respect of, any use of, or relianceupon, this document by any third party.
Document history and statusRevision Date Description Author/s
1 10/03/2019 Draft for review C. Gorlick, C. Ricks, G. van der List, D.MacLaine
2 07/04/2019 Updated draft C. Gorlick
3 17/04/2019 Updated draft C. Gorlick, G. van der List
4 03/06/2019 Updated draft C. Gorlick/C. Ricks
5 19/06/2019 Updated draft C. Gorlick
6.4 11/01/2021 Final C. Gorlick
Tourism Routes
ii
Contents1. Introduction ..................................................................................................................................62. Strategic context ..........................................................................................................................73. Tropical North Queensland’s tourism industry ........................................................................ 314. Tourism within FNQROC ........................................................................................................... 395. Travel Surveys ........................................................................................................................... 516. Estimating the value and AADT of each tourist route .............................................................. 577. Tourism demand and road infrastructure improvements ........................................................ 618. Unsealed roads and increased tourism .................................................................................... 719. Stakeholder engagement ........................................................................................................... 7810. Crash analysis ............................................................................................................................ 8011. Planned infrastructure upgrades .............................................................................................. 8212. Summary of findings .................................................................................................................. 94
Appendix A. Survey questionnaireAppendix B. Questionnaire response summaryAppendix C. Crash history (2009 to 2018)

Tourism Routes
iii
Figure 3-1 Australia’s tourism GVA 2016-2017 ................................................................................................ 33Figure 3-2 Queensland proportion of total Australian tourism GVA .................................................................. 33Figure 3-3 Queensland contribution to Australian tourism GVA by trip type...................................................... 33Figure 3-4 Queensland % of tourism GVA ....................................................................................................... 34Figure 3-5 Regional Queensland % of tourism GVA ........................................................................................ 34Figure 3-6 Queensland % of tourism employment ........................................................................................... 34Figure 3-7 Regional Queensland % of tourism employment............................................................................. 34Figure 3-8 Queensland – direct tourism GVA by industry ................................................................................. 35Figure 3-9 Tropical North Queensland – direct tourism GVA by industry .......................................................... 35Figure 3-10 Total day trips .............................................................................................................................. 37Figure 3-11 Holiday trips % of total day trips.................................................................................................... 37Figure 3-12 Total overnight trips ...................................................................................................................... 37Figure 3-13 Holiday trips % of total overnight trips ........................................................................................... 37Figure 4-1 Estimating council contribution ....................................................................................................... 40Figure 4-2 Aggregated councils (yellow) .......................................................................................................... 40Figure 4-3 FNQROC tourism GVA ($m) .......................................................................................................... 41Figure 4-4 FNQROC total industry GVA ($m) .................................................................................................. 41Figure 4-5 Tourism employment ...................................................................................................................... 41Figure 4-6 All industry employment ................................................................................................................. 41Figure 4-7 International Visitors ....................................................................................................................... 42Figure 4-8 Domestic Overnight Visitors ........................................................................................................... 42Figure 4-9 International Visitor average stay.................................................................................................... 42Figure 4-10 Domestic Overnight Visitor average stay ...................................................................................... 42Figure 4-11 Domestic daytrips......................................................................................................................... 43Figure 5-1 Household travel mode .................................................................................................................. 52Figure 5-2 Social/recreational trip purpose ...................................................................................................... 53Figure 5-3 Visitor main purpose ...................................................................................................................... 54Figure 5-4 Vehicle trip destination ................................................................................................................... 55Figure 5-5 Destination type ............................................................................................................................. 56Figure 5-6 Origin/destination purpose.............................................................................................................. 56Figure 5-7 Visitor travel modes ........................................................................................................................ 56Figure 5-8 Main travel mode ........................................................................................................................... 56Figure 7-1 Peninsula Developmental Road (Laura – Coen) AADT and additional sealing ................................ 65Figure 7-2 Peninsula Developmental Road (Coen - Weipa) AADT and additional sealing ................................ 65Figure 7-3 Mulligan Highway AADT, various sites ........................................................................................... 66Figure 7-4 AADT and growth rates, Lakeland .................................................................................................. 67Figure 7-5 Sealing (Peninsula Developmental Road) ....................................................................................... 68Figure 7-6 Sealing (Burke Developmental Road) ............................................................................................. 68Figure 7-7 Seal widening ................................................................................................................................ 68Figure 7-8 Causeway/culvert/bridge widening ................................................................................................. 68Figure 7-9 Wayfinding signage ........................................................................................................................ 69Figure 7-10 Flooding signage .......................................................................................................................... 69Figure 7-11 Rest areas/stopping bays ............................................................................................................. 69Figure 8-1 Unsealed SCR ............................................................................................................................... 71Figure 11-1 QTRIP expenditure per route........................................................................................................ 82Figure 12-1 Epic Cape York crashes ............................................................................................................. 103
Table 3-1 Visitor/ population ratios .................................................................................................................. 31Table 3-2 TNQ key tourism statistics (2015) .................................................................................................... 36Table 3-3 Transport trips by mode ................................................................................................................... 38Table 3-4 Accommodation .............................................................................................................................. 38Table 4-1 FNQROC tourism GVA ranking ....................................................................................................... 40Table 4-2 Weighted average values ................................................................................................................ 43Table 4-3 Key Local Government statistics ...................................................................................................... 44Table 4-4 Gulf-Savannah tourism survey key findings ..................................................................................... 45Table 4-5 Towns visited .................................................................................................................................. 45
Tourism Routes
iv
Table 4-6 Visitors (annual average 2014-2017) ............................................................................................... 46Table 4-7 Overnights (annual average 2014-2017) .......................................................................................... 47Table 4-8 Average stay (annual average 2014-2017) ...................................................................................... 47Table 4-9 Expenditure (annual average 2014-2017) ........................................................................................ 48Table 4-10 Spend per trip................................................................................................................................ 49Table 4-11 Spend per night ($) ........................................................................................................................ 50Table 5-1 Australian passenger vehicle use .................................................................................................... 51Table 5-2 Trip purpose .................................................................................................................................... 52Table 5-3 Summary of Household Travel Survey (by region), .......................................................................... 53Table 5-4 Vehicle trips by purpose .................................................................................................................. 55Table 6-1 Annual self-drive expenditure and visitors per route ......................................................................... 57Table 6-2 Route length by Council .................................................................................................................. 59Table 6-3 Annual route expenditure ................................................................................................................ 59Table 6-4 Estimated tourist AADT ................................................................................................................... 60Table 7-1 Types of infrastructure improvements .............................................................................................. 61Table 7-2 Assumed tourist compositions ......................................................................................................... 63Table 7-3 Findings from Victoria ...................................................................................................................... 63Table 7-4 Infrastructure improvement locations ............................................................................................... 67Table 8-1 Unsealed SCR ................................................................................................................................ 72Table 8-2 LRRS unsealed roads ..................................................................................................................... 72Table 8-3 Tourist route first year value increase .............................................................................................. 75Table 8-4 Low growth scenario – proportional uplift ......................................................................................... 76Table 8-5 Low growth scenario – value increases ........................................................................................... 76Table 8-6 High growth scenario – proportional uplift ........................................................................................ 77Table 8-7 High growth scenario – value increases ........................................................................................... 77Table 9-1 Stakeholders ................................................................................................................................... 78Table 9-2 Stakeholder suggested roads for sealing ......................................................................................... 79Table 10-1 Highways with highest incidence numbers 2009 - 2018 ................................................................. 80Table 10-2 Crash risk ratio .............................................................................................................................. 81Table 11-1 QTRIP National Network ............................................................................................................... 84Table 11-2 QTRIP State Road Network ........................................................................................................... 88Table 11-3 QTRIP Local Road Network .......................................................................................................... 92

Tourism Routes
1
Executive SummaryTourism has been the fastest growing industry in Far North Queensland over the past three decades and istoday the region’s largest industry valued at over $3.1 billion dollars. Tourism along with mining and agriculture(both farming and grazing) are the mainstays of the Far North Queensland economy.
There is strong tourism growth potential for high value tourism businesses such as ecotourism, wildernessexperiences and adventure tourism activities, particularly surrounding self-drive four wheel drive adventuring,organised group sport fishing travel, wildlife spotting, mountain bike riding, exploring land and waterscapefeatures, cultural activities, historic sites and the natural environment.
The link between indigenous economic independence and tourism is clear. Cultural tourism provides a way forindigenous communities to return to their traditional country while providing economic resilience andemployment opportunities.
This however is not possible without a resilient transport infrastructure which provides safe and reliable accessto major tourist attractions. Many of the main tourist attractions within FNQROC are only accessible throughroads which are often in poor condition. The perceived quality and safety of tourist routes may act as a deterrentto potential tourists, limiting the economic benefits that flow through the tourism industry.
Strategic context
Planning strategies identify that there is strong tourism growth potential for high value tourism businesses suchas ecotourism, wilderness experiences and adventure tourism activities, particularly surrounding self-drive fourwheel drive adventuring, organised group sport fishing travel, wildlife spotting, exploring land and waterscapefeatures, cultural activities, historic sites and the natural environment.
In general, all local governments within the region agree that tourism and nature-based tourism developmentmust be undertaken in a way and in locations that ensures the development does not detract fromenvironmental values, scenic values, coastal values and town/village character that attracts visitors to theregion, as opposed to large-scale attractions that have little connection to local context, particularly those thatcan be found anywhere.
Resilient transport infrastructure to ensure connectivity across the region is identified as essential if FNQ is tohave sustainable economic growth and development. The state of the roads is a major safety concernimpacting tourism development across the region as the growth of visitors from Asia fly in through Cairns toexplore northern Australia.
The various tourism strategies identify a range of region wide tourism opportunities as well as opportunities forvarious local governments and sub-areas as follows.
Coastal (Cairns, Cassowary Coast, Douglas, Hinchinbrook, Mareeba, Tablelands, and Yarrabah)· Cairns is a tourist destination of international significance and provides a landing point for visitors
arriving by air or sea. Cairns is supported by a network of smaller towns and villages which act assub-regional activity centres and/or act a base to access a range of local tourist attractions, withseveral tourist routes beginning at or passing through Cairns.
· Cassowary Coast is a network of centres, with Innisfail containing the major regional activity centre,Tully containing a district regional activity centre and the villages of Mission Beach, Wongaling Beachand Cardwell containing village activity centres. Food tourism is encouraged along with thedevelopment of permanent or periodic food markets. Cassowary Coast is seeking to expand itsadventure tourism market by catering to high-profile events that the Tully River’s natural environmentcan offer.
· Douglas Shire, like other shires, encourages nature-based tourism as opposed to large-scaleattractions that have little connection to local context, particularly those that can be found anywhere.

Tourism Routes
2
The Wangetti Trail is a proposed 76 kilometre dual use (mountain biking and hiking) trail betweenPalm Cove and Port Douglas. This would have limited impact on existing tourist routes.
· Hinchinbrook is recognised for its fishing, mountain biking, bush walking, natural assets includingHinchinbrook Channel, Orpheus Island, National Parks, Wallaman Falls and Mount Fox, and theTYTO wetlands centre. There is strong community support for increased access to waterways andnational parks for recreational and residential tourism.
· Mareeba Shire identifies that Kuranda will continue to maintain its status as a major tourist destinationwhile Chillagoe will continue to attract more interest and visitors. Irvinebank is recognised as a keysite and a point of interest to tourists. Chillagoe and Irvinebank are also identified as potentiallyforming part of a geo-trail which would be centred on Etheridge Shire.
· Tablelands Shire identify that its proximity to Cairns International Airport and tourist base providesopportunities for increasing visitation. Large scale tourist accommodation facilities are thereforeproposed in key sites across the region and a diverse range of short term accommodation facilities arealso proposed in the region’s towns and rural areas. Yungaburra and Tinaroo will consolidate theirtourism status due to Lake Tinaroo. Herberton, Malanda and Millaa Millaa will continue to attract moreinterest and visitors.
· Yarrabah proposes that cultural tourism as well as short and multi-day walking trails will leverage offYarrabah’s proximity to Cairns
Gulf Savannah (Carpentaria, Croydon, Etheridge)· Etheridge Shire identifies the potential of a geo-trail which would connect Undara Volcanic Park,
Cobbold Gorge, Copperfield Gorge, the three fossicking areas of Flat Creek, Agate Creek andO’Brien’s Creek and Talaroo Hot Springs. It could possibly also include Chillagoe and Irvinebank (inMareeba Shire) and Mt Garnet, 40 Mile Scrub National Park and Herberton (Tablelands Shire) andCroydon as well as the Dinosaur Trail and Western Discovery Centre (outside of region). EtheridgeShire Council also identify the potential for Copperfield Gorge to be developed with camping andovernight facilities and interpretive signage.
· Croydon seek to ensure the Gulf Developmental Road (part of the Savannah Way) continuesexposure and ready access to Croydon’s businesses and attractions. The importance of LakeBelmore, located 4 kilometres from the main town centre, is identified for its importance for boating,fishing, water skiing, bird watching and picnicking by both visitors and locals. Littleton National Park isalso identified as providing opportunities for nature based tourism and recreational opportunities suchas mountain biking.
· Carpentaria Shire identifies the opportunity to better promote Burke and Wills Camp 119, the northernmost camp of the explorers as well as develop a boardwalk at Karumba link between the eastern andwestern precincts of town and providing native flora and fauna interpretation and background into theindustries that drive the port. Other opportunities include extension of the Karumba BarramundiDiscovery Centre and the Normanton Monsoon Centre.
Cape York (Cook, Hope Vale, Wujul Wajul)· Tourist development north of the Daintree River is expected to be small-scale, nature-based and
protect the unique ecological values and local character. The existing Daintree ferry will remain torestrict vehicular traffic.
· Wujal Wujal, north of the Daintree River, is located on the banks of the Bloomfield River and on theBloomfield Track. Natural attractions such as the Bloomfield Falls, Roaring Meg Falls and otherhistoric and Aboriginal cultural heritage attractions support a fledgling tourist trade.
· Hope Vale Aboriginal proposes that sealing of Battlecamp Road from the Endeavour Valley Road tothe Peninsula Development Road would not only increase all weather access and improve bananacrop transport efficiency but also tourism opportunities and reduce safety risks.
· Over 80% of Cape York cannot be accessed by land-based transport during the wet season. Theprogressive sealing of the Peninsula Developmental Road is making the Cape more accessible for
Tourism Routes
3
both tourists and road freight vehicles however east-west linkages remain poor and simply cannotcope with any increased level of heavy transport.
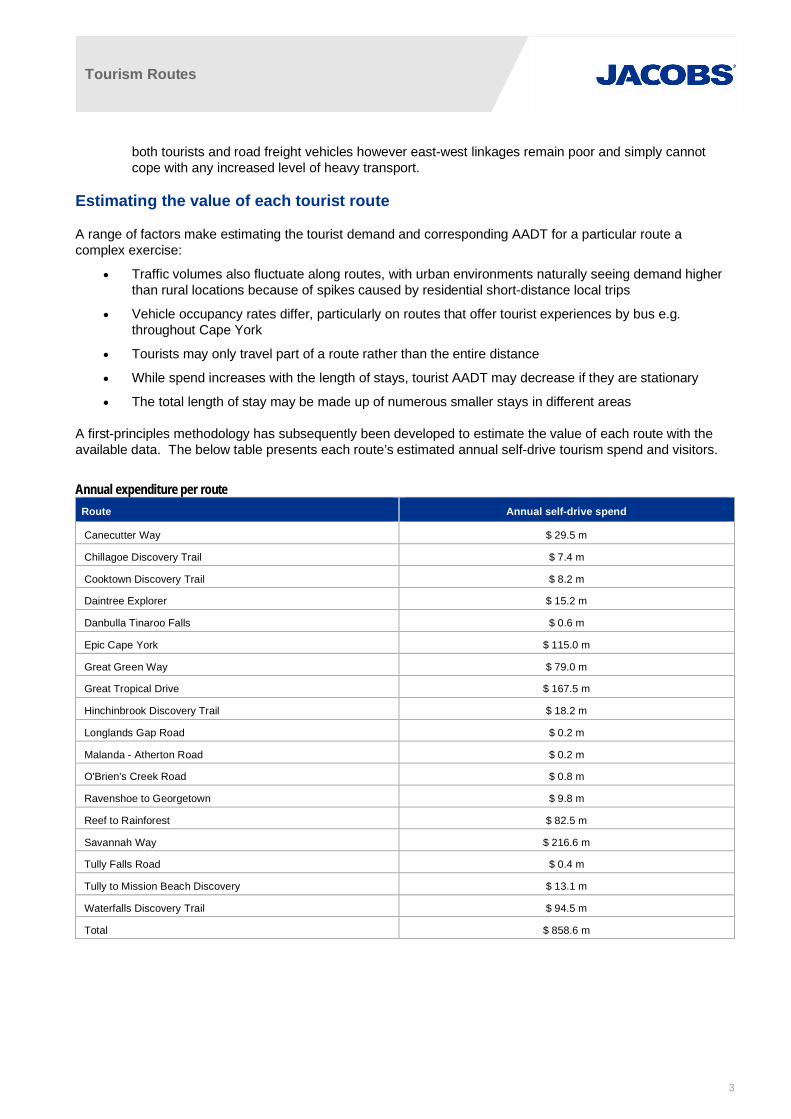
Estimating the value of each tourist route
A range of factors make estimating the tourist demand and corresponding AADT for a particular route acomplex exercise:
· Traffic volumes also fluctuate along routes, with urban environments naturally seeing demand higherthan rural locations because of spikes caused by residential short-distance local trips
· Vehicle occupancy rates differ, particularly on routes that offer tourist experiences by bus e.g.throughout Cape York
· Tourists may only travel part of a route rather than the entire distance
· While spend increases with the length of stays, tourist AADT may decrease if they are stationary
· The total length of stay may be made up of numerous smaller stays in different areas
A first-principles methodology has subsequently been developed to estimate the value of each route with theavailable data. The below table presents each route’s estimated annual self-drive tourism spend and visitors.
Annual expenditure per routeRoute Annual self-drive spend
Canecutter Way $ 29.5 m
Chillagoe Discovery Trail $ 7.4 m
Cooktown Discovery Trail $ 8.2 m
Daintree Explorer $ 15.2 m
Danbulla Tinaroo Falls $ 0.6 m
Epic Cape York $ 115.0 m
Great Green Way $ 79.0 m
Great Tropical Drive $ 167.5 m
Hinchinbrook Discovery Trail $ 18.2 m
Longlands Gap Road $ 0.2 m
Malanda - Atherton Road $ 0.2 m
O'Brien's Creek Road $ 0.8 m
Ravenshoe to Georgetown $ 9.8 m
Reef to Rainforest $ 82.5 m
Savannah Way $ 216.6 m
Tully Falls Road $ 0.4 m
Tully to Mission Beach Discovery $ 13.1 m
Waterfalls Discovery Trail $ 94.5 m
Total $ 858.6 m

Tourism Routes
4
Infrastructure investment
The various strategies and plans for FNQROC’s self-drive tourism market identify a range of opportunities toincrease tourist numbers. Road investment issues and opportunities are:
· improved rest areas to better cater for tourist needs
· more pullover areas to encourage day visitors to explore each tourist route and its attractions
· better promotion and signage of major tourism routes, including digital in-vehicle signage
· improving all-year access and facilities for caravan and camping
· the interactions between self-drive tourists and road freight movements, particularly in more regionalareas where heavy vehicles can be over 50 metres long
· poor or non-existent mobile communications
· insufficient education on how to travel through the outback for tourists
Improvements like rests areas, pullover areas and signage have direct safety flow-on benefits, particularlywhere tourists have little knowledge of a route. Those routes with relatively high crash risk ratios should beconsidered for these infrastructure investments, namely the Great Tropical Drive, Waterfalls Discovery and Reefto Rainforest.
The received responses support road sealing as the main infrastructure improvement to promote tourismgrowth, and that targeted sealing of particular roads would encourage visitors across multiple routes. Theresponses also require wider consideration of competing stakeholder views particularly where a road traversesacross councils. Bloomfield Road is one such example, where the strategic outlook at this point has not beenendorsed by the relevant road owners.
The relationship between larger infrastructure upgrades and tourist demand is difficult to define with theavailable data. Only sealing of unsealed roads appears to have a positive effect based on the analysis of theMulligan Highway. The scenarios suggest that FNQROC tourism expenditure each year can potentiallyincrease between $5.62m and $14m, generated largely by Epic Cape York and Savannah Way.
QTRIP expenditure between 2018-19 and 2021-22 suggests substantial investment is planned for the state-controlled sections of the following routes:
· Epic Cape York
· Great Green Way
· Great Tropical Drive
· Reef to Rainforest
· Waterfalls Discovery Trail
Recommendations
The analysis suggests the FNQROC could pursue investment opportunities for the progressive sealing ofSavannah Way. Implementing a data collection exercise targeted at identifying self-drive tourist preferencescan inform which unsealed sections should be given priority.
The same data collection exercise could be applied to FNQROC’s unsealed roads that connect to the improvedSCR e.g. Epic Cape York. As these routes also attract adventure tourists that prefer the road to be unsealed, abalance is needed to ensure existing tourist markets are not hampered.
Improving the estimation of each route’s tourism value requires collection of further data with two approaches:

Tourism Routes
5
· Vehicle movements across routes can be measured through roadside monitoring by camera orBluetooth loggers, or through wide-scale tracking of mobile phone tower signal pings, in-vehicle GPSdevices and/or GPS data traces obtained from smartphone location-based services, if coverage existsand/or sample size is appropriate. Length of stays in each location can also be estimated via thesedata sources, and provide a reliable sample of the number of occupants per vehicle.
· A survey of self-drive tourists to inform the spend per route. Tourism Research Australia should beconsulted in designing the survey, ensuring there is consistency with current collection methods.
Observing the impact of infrastructure upgrades on AADT growth can be improved through more targeted andregular placement of traffic counters. Ideally traffic counts are collected regularly before an upgrade todetermine a road’s natural growth. Regular counts after an upgrade that show notable variation from the naturalgrowth can be attributed to the improved infrastructure.
Tourism Routes
6
1. IntroductionTourism has been the fastest growing industry in Far North Queensland over the past three decades and istoday the region’s largest industry by generating sales of $4.2 billion1. The Far North Queensland RegionalOrganisation of Councils (FNQROC) is estimated to generate around $3.1 billion2 of these sales.
The region’s tourism industry is predominantly based on natural and cultural features. The region includes twoWorld Heritage listed areas, the rainforests of the Wet Tropics and the reefs and waters of the Great BarrierReef (GBR). To the west is the Gulf Savannah and outback and to the north is Cape York Peninsula.
Tourist activities are primarily concentrated between Mission Beach and Cape Tribulation along the east coast,and those areas of the Great Barrier Reef with direct access from Cairns, Port Douglas and Mission Beach.There is however a significant, and growing, outback and adventure tourism industry within Cassowary Coast,Tablelands, Mareeba, the Gulf Savannah and Cape York which largely caters to the drive tourism market.Cassowary Coast hosted the world rafting championships in 2019, and other activities including mountain bikingare growing within the regions.
There is strong tourism growth potential for high value tourism businesses such as ecotourism, wildernessexperiences and adventure tourism activities, particularly surrounding self-drive four wheel drive adventuring,organised group sport fishing travel, wildlife spotting, mountain bike riding, exploring land and waterscapefeatures, cultural activities, historic sites and the natural environment.
The link between indigenous economic independence and tourism is clear. Cultural tourism provides a way forindigenous communities to return to their traditional country while providing economic resilience andemployment opportunities.
This however is not possible without a resilient transport infrastructure which provides safe and reliable accessto major tourist attractions. Many of the main tourist attractions within FNQROC are only accessible throughroads which are often in poor condition. The perceived quality and safety of tourist routes may act as a deterrentto potential tourists, limiting the economic benefits that flow through the tourism industry.
Investing in road infrastructure improvements has the capacity to ‘open up’ areas and development of emergingindustries. Flood resilient roads create efficiencies for both private and business road users, particularly heavyfreight vehicles. A resilient road network offers other social welfare benefits through shortening the ‘virtualdistance’ to services in the larger regional towns and cities e.g. education, health, employment and training.
This report is structured as follows:
· The strategic outlook for tourism and its influence on the road network
· Tourism’s economic importance of the wider Far North Queensland geography
· A closer look at the role of tourism across FNQROC, and the contribution of select areas
· An understanding of tourist travel behaviours within the broader residential population
· An estimation of each route’s self-drive tourists and their economic contribution
· How infrastructure upgrades can influence tourist demand increases
· The investment outlook for the road network, and where additional investment could promote tourismgrowth
1 https://www.tra.gov.au/Economic-analysis/Economic-Value/Regional-Tourism-Satellite-Account/regional-tourism-satellite-account, , sourced 14 Oct2020
2 https://economy.id.com.au/fnqroc/tourism-value, sourced 14 Oct 2020

Tourism Routes
7
2. Strategic context2.1 Planning Strategies
Far North Queensland Regional Plan 2009-20313
The regional plan applies to the following local government areas within the FNQregion:
· Cairns Regional Council (including Douglas Shire Council)
· Tablelands Regional Council (including Mareeba Shire Council)
· Cassowary Coast Regional Council
· Yarrabah Aboriginal Council
· Wujal Wujal Aboriginal Council.
The plan identifies that tourism was the fastest growing industry in FNQ over thepast three decades and provides significant employment benefits. The region’stourism industry is predominantly based on natural and cultural features. Touristactivities are primarily concentrated between Mission Beach and CapeTribulation along the coast, and those areas of the Great Barrier Reef with direct
access from Cairns, Port Douglas and Mission Beach.
Although the tourism industry is looking to diversify into areas such as cultural and business tourism, nature-based activities are expected to remain the major drawcard and the focus of product promotion for the region.Sustainable opportunities must be identified and developed to cater for nature-based tourism needs over thelong term. The plan identifies that future opportunities in the tourism sector lie in:
· the potential to increase the region’s business tourism market
· ecotourism with the presence of two World Heritage listed sites located side by side in the region
· the expansion of cultural tourism
The plan identifies that Cairns plays a vital role in servicing the needs of the broader FNQ community. As atourist destination of international significance, it provides a landing point for visitors. Regional towns outsideCairns will continue to grow, with the main growth in Mareeba, Atherton, Innisfail, and to a lesser extent Tully.
Tourism development north of the Daintree River will be small-scale, nature-based and protect the uniqueecological values and local character. The existing Daintree ferry will remain to restrict vehicular traffic.
Tourism activities on the Atherton Tablelands will focus on the natural environment, mining and outbackexperiences. Tourist attractions such as the Savannah Way and Misty Mountain walking trails are expected todraw increasing numbers of tourists inland from the coastal plain. Ravenshoe will play an increasinglyimportant role in servicing rural, tourism and mining activities in the area. Kuranda densities will be kept low andbuilding heights limited to maintain the village character and areas of ecological significance.
Herberton is constrained by topography, tenure and lack of sewerage infrastructure and only limited futuredevelopment is proposed. Within Wujal Wujal, the Council is the main employer although natural attractionssuch as the Bloomfield Falls, Roaring Meg Falls and other historic and Aboriginal cultural heritage attractionssupport a fledgling tourist trade.
The significant biodiversity and scenic values of the Mission Beach area are also recognised. The access roadsare adjacent to the Wet Tropics World Heritage Area and through roads are adjacent to the Great Barrier Reef
3 http://www.dlgrma.qld.gov.au/resources/plan/far-north-queensland/fnq-regional-plan-2009-31.pdf, sourced 2 Feb 2019
Tourism Routes
8
Marine Park. These will primarily remain as scenic tourist drives and to service existing residential and resortareas.
The regional plan acknowledges the importance of drive tourism industry which relies on road transport.
Cape York Regional Plan 2014
The Cape York Regional Plan4 covers the local government areas of Aurukun,Cook, Hope Vale, Kowanyama, Lockhart River, Mapoon, Napranum, NorthernPeninsula Area, Pormpuraaw, Wujal Wujal and Weipa Town Area.
Economic activity in the region is characterised by large-scale enterprisescentred on mining (largely in the north-west), agriculture activity (cattle andintensive horticulture primarily in the south-eastern areas) and small- to medium-scale tourism enterprises.
The tourism industry consists largely of small tourism operators who areresponding to domestic adventure-style tourism markets of self-drive, mature-aged people who want to experience the region’s natural assets and itswilderness, four-wheel drive adventures and Indigenous cultural activities andhistoric sites.
There is strong tourism growth potential for high value tourism businesses such as ecotourism, wildernessexperiences and adventure tourism activities, particularly surrounding self-drive four wheel drive adventuring,organised group sport fishing travel, wildlife spotting, exploring land and waterscape features, cultural activities,historic sites and the natural environment.
The plan identifies that the key to the growth of this industry is ensuring safe and reliable access to these areas,improvement of infrastructure and standards (including tourist facilities), and a flexible development assessmentsystem which recognises the unique challenges of conducting a tourism business in a relatively remote location.
FNQROC Strategic Plan 2017 - 2021
FNQROC has identified five strategic economic priorities5:
a) Develop resilient transport infrastructure and connectivity
b) Provide reliable and affordable water and energy
c) Respect and manage our natural assets and environment
d) Develop equitable social infrastructure
e) Provide equitable communication network
Strategic priorities directly relevant to tourism are “Develop resilienttransport infrastructure and connectivity” and “Respect and manage ournatural assets and environment”.
Develop resilient transport infrastructure and connectivity
Resilient transport infrastructure to ensure connectivity across the region is identified as essential if FNQ is tohave sustainable economic growth and development. The Strategic Plan identifies that current situation, is farfrom satisfactory and the state of roads and ports is an inhibitor to further realise the vast untapped potentialthat Far North Queensland offers.
4 http://www.dlgrma.qld.gov.au/resources/plan/cape-york/cape-york-regional-plan.pdf, sourced 2 Feb 20195 http://www.fnqroc.qld.gov.au/files/media/original/004/0b2/9d8/a91/FNQ-Elevator-Note-Full-Suite.pdf, sourced 9 Jan 2019
Tourism Routes
9
The Strategic Plan identifies that over 80% of Cape York cannot be accessed by land-based transport duringthe wet season due to the unsealed nature of large parts of the Peninsula Development Road (PDR) and thenumerous low-level river crossings. Equally the east-west linkages are poor and simply cannot cope with anyincreased level of heavy transport. The current transport network is exacerbated with the National Highwayending south of Cairns.
The region has a large Indigenous population and their attempts to achieve economic growth and prosperity isthwarted by the poor transport infrastructure. A resilient transport infrastructure is expected to support a diversityof road users from agriculture and the resource industries to a growing tourism industry.
The state of our roads is a major safety concern impacting tourism development across the region as the growthof visitors from Asia fly in through Cairns to explore northern Australia.
The FNQ region has four major ports with the capacity to connect the resource and agricultural industries,including live export of cattle, to international markets. Tropical North Queensland is the second-fastest growingtourism destination in Australia and Cairns Port serves as a significant tourism gateway to the Great BarrierReef and a rapidly growing cruise ship market. The lack of investment inhibits development of these ports.
c) Respect and manage our natural assets and environment
The region includes two World Heritage listed areas, the rainforests of the Wet Tropics and the reefs and watersof the Great Barrier Reef (GBR). To the west we have the Gulf Rivers Strategic areas and to the north CapeYork Peninsula. The economic success of our natural assets is evidenced by the growth in our largest industry,tourism, which is valued at over $3.1 billion dollars. Improved road access will increase tourism numbers.
Respecting natural assets and upholding the integrity of the areas unique bioregions is important for thesustainable economic growth and development of FNQ. A changing climate and land use impacts on waterquality are recognised as major threats to the region's natural assets. Other examples include the threatenedmangroves of the Gulf of Carpentaria and the decline of endemic and keystone species such as the WetTropics cassowary, an icon of several destinations in the region. Further deterioration of the region's naturalassets will threaten the tourism industry and the economic prosperity of the region.
Tourism related regional opportunities
Tourism related regional opportunities (not limited to) include:
· The Wangetti Trail
- The Wangetti Trail is a proposed 76 kilometre dual use (mountain biking and hiking) trailstretching along the coastal plains and mountain hinterland between Palm Cove and PortDouglas. The trail would allow users to enter and exit at key locations which could include PalmCove, Ellis Beach, Wangetti, Oak Beach, Thala Beach and Port Douglas.
· Geotourism trail
- Geo-Tourism aims to foster sustainable tourism based on landscapes, including protecting,communicating and promoting geological heritage, building communities and working with a widerange of people. It seeks to tap into a large and rapidly growing overseas market seeking highvalue and branded nature-based tourism experiences.
- Geo-Tourism offers the opportunity to reinvigorate the domestic travel market so that the wholecommunity benefits from packaging and branding the current tourism product and experienceusing the landscape and geological factors to enhance economic growth.
- The trail recognises well patronised geosites comprising Undara Volcanic Park, Cobbold Gorge,Copperfield Gorge, the three fossicking areas of Flat Creek, Agate Creek and O’Briens Creek.
- Of critical importance the strategy also proposes collaborative pilot projects to both developopportunities for grazing properties and with the Ewamian Aboriginal Corporation to assist theredevelopment of Talaroo Hot Springs geo-site.

Tourism Routes
10
- Establishment of strong geo-trail linkages with attractions outside the Shire such as Chillagoe,Croydon, 40 Mile Scrub National Park, Mt Garnet / Herberton / Irvinebank, as well as with theDinosaur Trail and Flinders Discovery Centre of Western Queensland.
· Adventure Tourism in Cassowary Coast
- Cassowary Coast Regional Council is investing in infrastructure to further support adventuretourism. With white-water rafting, skydiving, sea kayaking and diving among its current venturesthey wish to attract further events similar to the World Rafting Championships which were held inTully in 2019.
· Indigenous tourism
- The Indigenous councils of Yarrabah, Wujal Wujal and Hope Vale continue to investigate anddevelop opportunities to grow indigenous tourism. Wujal Wujal has recently sought investment inaccommodation for the traveling public.
2.2 Local Government Planning Schemes
Cairns Regional Council – Planning Scheme 2016
The strategic framework within the planning scheme6 sets the policy direction forthe planning scheme and forms the basis for ensuring appropriate developmentoccurs within the planning scheme area for the life of the planning scheme.
The region is recognised as Far North Queensland’s key economic centreproviding major industrial, agricultural, maritime, aviation, defence, health,education, commercial, retail, recreational and entertainment facilities andopportunities.
Due to the quality of the natural environment and extent and availability ofproductive agricultural land, tourism and primary production remain the keyeconomic drivers for the region. However, the region’s economy will becomemore diversified, improving business and employment opportunities andproviding resilience against future adverse economic, social and environmentalconditions which may impact the region.
The strategic framework also identifies that the Cairns region is a national and international tourist destinationthat must continue to provide a diverse range of tourist accommodation, attractions and experiences thatrespond to the changing needs and expectations of the tourism industry.
Places of local significance will be conserved for their cultural significance, tourism value and importance to thehistory and identity of the region. The region’s natural environment, resources, ecological processes andbiodiversity values will be protected, enhanced and rehabilitated in a manner that ensures their continuation asecological, social, tourism and economic assets for present and future generations.
6 https://www.cairns.qld.gov.au/building-planning-business/planning-schemes/v1.2cp2016/v1.2-documents, sourced 19 Feb 2019

Tourism Routes
11
Carpentaria Shire Council Planning Scheme 2008
The Planning Scheme Alignment Amendment78 identifies that the towns ofNormanton and Karumba will continue to provide a focus for business,community activities and infrastructure provision within the Shire, withNormanton being the more important centre. All of the local government areaprovides for compatible Tourist Activities however important natural features oridentified resources, including mineral and extractive resources, will constrainthe use of land due to the desire to protect their values or the potential hazardthey impose.
A desired outcome of the plan is to maximise the economic base of the Shire byincreasing the Shire’s Tourism, Business, Commercial, Industrial and Agriculturalpotential. This will be done, in part, by promoting the expansion of Tourism -minor Activities throughout the rural areas of the Shire and recognising andconsolidating port related Industrial and Commercial Activities, Tourism andRecreational Activities of Karumba.
Cassowary Coast Regional Council Planning Scheme 2015
The Planning Scheme9 identifies that in 2014, the region's economy was largelyreliant on cane farming, banana farming and tourism. The goal for planning anddevelopment is to assist in diversifying this economic base to provide greatereconomic resilience and employment opportunities.
The region is comprised of a network of centres, with Innisfail containing themajor regional activity centre, Tully containing a district regional activity centreand the villages of Mission Beach, Wongaling Beach and Cardwell containingvillage activity centres.
Tourism and nature-based tourism development that is easily integrated andconsistent with the Region's natural and scenic values is envisaged as thedominant form of tourism development. All tourism and nature-based tourismdevelopment will only be undertaken in a way and in locations that ensures thedevelopment does not detract from environmental values, scenic values, coastalvalues and town/village character that attracts visitors to the Region.
Food tourism is encouraged, particularly for persons operating an agricultural activity on a rural zoned property.To further this goal, food and drink outlets will be permitted on rural zoned properties where they are small inscale. The development of permanent or periodic food markets are also encouraged.
The Coordinator-General has approved the Ella Bay integrated resort development for land located at Ella Bay,approximately 10 kilometres north of Innisfail.
7 http://www.carpentaria.qld.gov.au/planning, sourced 20 Feb 20198 On 3 July 2017, a new planning system commenced in Queensland. Council carried out an “Alignment Amendment” to its existing planningscheme to align with the new Act. The “Alignment Amendment” has also been included in this review.9 http://www.cassowarycoast.qld.gov.au/documents/1422210/42234576/CCRC%20Planning%20Scheme%202015%20%28V3%29, sourced 20 Feb
2019
Tourism Routes
12
Cook Shire Council Planning Scheme 2017
The planning scheme10 identifies the need to promote key tourism assetsincluding sealed roads, a range of accommodation options and services, fishingcharters, croc spotting, bird watching, aboriginal culture tours, horse riding,historical tours and key events, such as the Cooktown Discovery Festival.
Cook Shire’s abundance of natural and cultural assets provide opportunities forestablishment and expansion of tourism-related development and infrastructurein the following areas:
· National Parks, where amenity and environmental impacts can be managed
· RVs and camping particularly near Cooktown’s services and facilities
· Educational and cultural experiences, such as rural farm stays and Indigenousexperiences, where there is community support, adequate facilities and risksfrom natural hazards can be avoided or managed
Small-scale cultural tourism in ‘Good Living Areas’ under the Eastern KukuYalanji Local Plan, where consistent with adopted Community Development Plans and where incorporated intothe Planning Scheme.
Many communities within Cook Shire provide a range of tourist services. These include Laura and Coen whichare important service centres for tourists travelling the Peninsula Developmental Road.
Croydon Shire Council Planning Scheme 2019
The planning scheme11 identifies that the Shire's tourism sector plays animportant role in the regional economy. Croydon is located along the SavannahWay tourist route, linking Cairns in North Queensland to Broome in WesternAustralia’s Kimberley region. The route attracts many self-drive tourists and ispopular amongst the grey nomads. It is also the main highway that connectsCroydon to other centres.
The Gulf Development Road passes through the centre of Croydon’s townshipand therefore provides many tourist and economic benefits to the Shire. Counciland the community would like to ensure that the route for this road remainsunchanged (no future bypassing of the township), ensuring continued exposureand ready access to Croydon’s businesses and attractions.
With ongoing improvement of road infrastructure, self-drive tourism is increasing.Developments that enhance and value-add to the tourist experiences generallyare encouraged. Such developments include:
· further improvements to Croydon’s streetscaping
· relocation of inappropriate or aesthetically intrusive uses away from the main tourist thoroughfare
· protection, adaptive re-use and promotion of heritage buildings and places
· additional tourist accommodation in Croydon township
· provision of freedom camping
· additional camping and tourism ventures in the rural areas of the shire (including potential mountain
· bike trails and associated facilities).
10 http://www.cook.qld.gov.au/development/town-planning-and-land-management/cook-shire-council-planning-scheme/planning-scheme-2017/cook-shire-council-planning-scheme-2017-v1-3-6.pdf, sourced 19 Feb 2019
11 https://www.croydon.qld.gov.au/documents/98276/4916464/Croydon%20Shire%20Planning%20Scheme%202019.pdf, sourced 20 Feb 2019
Tourism Routes
13
It will facilitate future tourism developments by limiting planning requirements, for example, providing flexibilityfor appropriate secondary-use development, such as farmstays, on agricultural land.
The plan identifies that Croydon’s rich history and scenic landscapes are a drawcard for tourists. Developmentthat conserves the history of the shire and is sympathetic to the heritage and character values of the township isencouraged. Protection and enhancement of this character and heritage is integral to Croydon’s touristeconomy. Lake Belmore’s scenic and recreational values are to be protected for both tourists and residentsalike. Littleton National Park provides further options for nature based tourism and recreational opportunities inthe shire. Proposals exist to expand the park’s tourism infrastructure to provide a variety of activities andexperiences to visitors. The Gulflander rail service between Normanton and Croydon is also a valuable tourismasset and development that supports the promotion and continued operation of this service is encouraged.
Douglas Shire Council Planning Scheme 2018
The planning scheme12 identifies that the Shire’s physical setting, located in a wettropical climate, framed by lush World Heritage listed forests and fringed by theCoral Sea and associated World Heritage listed Barrier Reef Marine Park to theeast, makes the Shire a desirable location for its residents and for tourists alike.
The tourism and sugar industries are the principal determinants of economicactivity, employment and population growth in Douglas Shire. The developmentand construction industry and the retail service sectors are dependent on theseimportant income generating industries. Other primary production activities, suchas fisheries, although important, have a relatively minor role to play.
Mossman and Port Douglas are both defined as District regional activity centresunder the Regional Plan. District regional activity centres. Mossman is the mainadministrative, service, agricultural and industrial centre, whereas Port Douglashas a stronger tourism focus.
The Plan identifies that tourism activity needs to be Shire-appropriate with a discerning preference for nature-based tourism that has a direct association with the environmental and rural characteristics of the Shire, asopposed to large-scale attractions that have little connection to local context, particularly those that can befound anywhere.
Etheridge Shire Council Planning Scheme Alignment Amendment
The Planning Scheme Alignment Amendment1314 identifies that the towns of Georgetown, Forsayth, Kidston,Mount Surprise and Einasleigh will continue to provide a focus for business, community activities andinfrastructure provision within the Shire, with Georgetown being the more important centre.
The rural areas of the Shire will provide for, and accommodate, a range of agricultural (predominantly cattlegrazing) uses with all the local government area providing for compatible Tourism Activities.
Use of rural areas for Tourism - minor facilities such as ‘homestay’ and ‘small eco-tourism’ activities based onnatural features or rural activities are to be encouraged. Tourism - major facilities for tourists will be subject todetailed assessment. Defined uses or use classed along major tourist routes (road or rail) are to avoid anyadverse impacts on Tourism experiences.
In assessing any proposal to establish new land uses or expand and intensify existing land uses within theRural Zone, there will be a focus on the avoidance or minimisation of adverse impacts on the environment or
12 https://douglas.qld.gov.au/development/schemes-masterplans/douglas-shire-planning-scheme/, sourced 20 Feb 201913 http://www.etheridge.qld.gov.au/documents/43741283/44086033/Planning%20Provisions.pdf, sourced 20 Feb 201914 On 3 July 2017, a new planning system commenced in Queensland. Council carried out an “Alignment Amendment” to its existing planning
scheme to align with the new Act. The “Alignment Amendment” only has been reviewed.

Tourism Routes
14
adjacent and nearby Rural Activities. Defined uses or use classed along major tourist routes (road or rail) are toavoid any adverse impacts on Tourism experiences.
Hinchinbrook Shire Planning Scheme 2017
The Planning Scheme15 identifies that Hinchinbrook includes substantial portinfrastructure at Lucinda which is used for exporting sugar internationally. Theport has significant capacity to expand the volume and range of exports.
Local strengths include location, tropical agriculture, natural assets, culture,heritage, resilience and infrastructure. Hinchinbrook’s natural assets in the formof national parks, waterfalls, Herbert River, tributaries, Hinchinbrook Channel,Orpheus Island and the Great Barrier Reef are a foundation for developing astrong tourism industry.
Ingham is the main activity centre for Hinchinbrook. Hinchinbrook had apopulation of approximately 11,800 people (2011 Census). The population hasbeen declining at a rate of -0.1% (approx. 30 people annually) since 1976 and ispredicted to continue to decline over the next 20 years.
The Plan identifies that over 60,000 people visit Hinchinbrook annually. The region is recognised for its fishing,mountain biking, bush walking, natural assets including Hinchinbrook Channel, Orpheus Island, National Parks,Wallaman Falls and Mount Fox, and the TYTO wetlands centre.
The plan identifies that there is strong community support for increased access to waterways and national parksfor recreational and residential tourism. Low impact tourism uses including rock climbing, hiking, abseiling,mountain biking and accommodation, where safe, culturally and environmentally appropriate, is supportedwithin national parks and reserves. It also identifies that there are also opportunities for rural and agriculturaltourism and edu-tourism that supports rural uses and capitalises on the high quality rural amenity, access towaterways, boat ramps and natural attractions.
Hope Vale Aboriginal Shire Council Planning Scheme 2014
Hope Vale Shire spans a vast and varied landscape featuring freshwater springs,palm tree lined rivers, spectacular beaches, significant wetlands, beautifulcoloured sand dunes, rich red soil and mineral resources.
The Planning Scheme16 identifies that while Hope Vale Council will continue to bethe dominant employer in the Shire, opportunities are emerging for thecommunity to benefit from mining, plantations and agriculture; and a small butsustainable tourism industry.
Opportunities for significant investment in Hope Vale are explored, particularly inagriculture, forestry, tourism and retail. Cultural tourism and eco-tourism are recognised as potential economicdrivers. Tourist uses that recognise and depend on the values of the cultural features, natural resources maybe in the rural zone where there is a proven ongoing benefit to the community. Development proposals howevershould not damage the economic viability and future sustainable development of the natural and culturalresources of the Shire.
15 https://s3-ap-southeast-2.amazonaws.com/os-data-2/hsc/documents/hinchinbrook_shire_planning_scheme_2017_web_version.pdf, sourced 20Feb 2019
16 https://www.hopevale.qld.gov.au/sites/hopevale.qld.gov.au/files/Hope%20Vale%20Planning%20Scheme.pdf, sourced 20 Feb 2019

Tourism Routes
15
Mareeba Shire Council Planning Scheme 2016
The Planning Scheme recognises Mareeba as the major regional activity centre forthe Shire. Kuranda is identified as the premier tourist destination for Far NorthQueensland and is described as the village in the rainforest. Chillagoe andDimbulah are identified as rural activity centres within the Shire.
The plan supports the aspirations of indigenous communities to return to theirtraditional country, facilitated through the development of interpretive tourism andrural based economic development.
The need to progressively upgrade and maintain roads to a high standard tosupport a variety of uses including tourism is identified. The rail network is also
recognised as important for tourist, passenger and freight movements.
Large scale tourism accommodation facilities will be developed in appropriate locations across the Shire whilethe dry western dry savannah will continue to accommodate nature and rural based tourism development. Thecharacter and appeal of key activity centres, landscape features and scenic routes which attract tourists toMareeba Shire will be maintained and enhanced.
Kuranda will continue to maintain its status as a major international tourist destination of Far North Queenslandwhile the emerging tourist economy of Chillagoe continues to attract more interest and visitors. Irvinebank isrecognised as a key site and a point of interest to tourists.
Tablelands Regional Council – Planning Scheme 2016
The planning scheme17 identifies that the outstanding natural environment, ruralproduction, environmental facilities and scenic landscapes of the Tablelandsprovide a basis for the development of sustainable tourism enterprises. TheTablelands’ geographical proximity to Cairns International Airport and touristbase provides opportunities for increasing visitation and exposure to theTablelands.
Large scale tourist accommodation facilities are therefore proposed in key sitesacross the region and a diverse range of short term accommodation facilities areproposed in the region’s towns and rural areas. Similarly caravan andrecreational vehicle users are provided with a variety of attractive locations tostay in the region. Adventure, nature based, and food tourism experiences aredeveloped across the regions rural and natural areas. The character and appealof key towns, landscape features and scenic routes which attract tourists to theregion will be maintained and enhanced. The south-western dry land savannahaccommodates further nature and rural based tourism development.
Yungaburra and Tinaroo will consolidate their status as tourist destinations based on their unique localcharacter and proximity to Lake Tinaroo. The emerging tourist economies of Herberton, Malanda and MillaaMillaa continue to attract more interest and visitors. Tourist parks in key locations continue to provide sites toaccommodate caravans and recreational vehicles across the region. A variety of small-scale, low impact touristfacilities will be established across the rural landscape.
17 https://www.trc.qld.gov.au/download/volume-1-strategic-framework-codes/, sourced 19 Feb 2019
Tourism Routes
16
Wujal Wujal Aboriginal Shire Council
The Wujal Wujal Plan18 is a Council plan that aims to support the community’svision for the support and development of the township of Wujal Wujal andsurrounding traditional lands. Wujal Wujal is located on the banks of theBloomfield River and on the Bloomfield track.
The Council’s vision is that Wujal Wujal is an active, safe, progressive andhealthy community with increased participation in sports and improved economicopportunities available for the locals. People are culturally rich and appreciateand value the traditional Eastern Kuku Yalanji knowledge, language, skills andconnection to the natural landscape and resources.
The scenic landscapes, rainforest and the Bloomfield River are the traditional grounds of Eastern Kuku Yalanjipeople. The lands and rivers are protected, valued and managed sustainably. Land is limited and communitydevelopment is determined by a collaborative partnership between all stakeholders, representing the communityand providing a transparent decision-making process.
Yarrabah Aboriginal Shire Council Planning Scheme 2014
The Planning Scheme19 identifies that economic prosperity is an essentialcomponent to achieving the long sustainability of Yarrabah as a properlyfunctioning community. Increasing economic opportunity includes building uptourism opportunities that focus on taking advantage of adjoining Cairns’ role asan international gateway to the region. It identifies that the Shire’s abundance ofnatural and cultural assets provide opportunities for establishing tourism relateddevelopment and infrastructure such as indigenous educational and culturalexperiences.
Cultural tourism with its subsequent job generation is already an increasingly significant component andopportunity in the Yarrabah economy. Such tourism opportunities will take advantage of Yarrabah’s proximity toCairns City and its natural resource assets. Eco-tourism in the form of short and multi-day walking trails andassociated trail friendly enterprise and infrastructure based on traditional walk trails is encouraged.
18 https://wujalwujalcouncil.qld.gov.au/council/wujal-wujal-plan/, sourced 20 Feb 201919 https://www.yarrabah.qld.gov.au/yarrabah-aboriginal-shire-council-planning-scheme, sourced 20 Feb 2019
Tourism Routes
17
2.3 Tourism Strategies
Tropical North Queensland Destination Tourism Plan20
This 2018 plan identifies that Tropical North Queensland is known as one of theworld’s most inspiring nature-based destinations. It is the gateway to hundredsof accessible experiences set on the stage of the Great Barrier Reef, Earth’soldest rainforest and the outback. Inhabited by an ancient culture, TropicalNorth Queensland is shared by passionate locals.
The region has six tourism precincts:
· Cairns and Northern Beaches
· Kuranda and the Atherton Tablelands
· Port Douglas and the Daintree
· Cassowary Coast
· Cape York, Gulf Savannah and Outback
· Torres Strait
There are four Local Tourism Organisations (LTOs) in Tropical North Queensland:
· Tourism Port Douglas & Daintree
· Tropical Tablelands Tourism
· Tropical Coast Tourism
· Savannah Way Limited
Visitor profile and target markets
Airline access has made tourism the key driver of a regional economy with two World Heritage Areas – theGreat Barrier Reef and the Wet Tropics rainforest. In 1971 visitor spend was at $50 million and by 2017 wasworth $3.1 billion with tourism contributing around 18 per cent of Tropical North Queensland’s gross regionalproduct and supporting one in five jobs.
The domestic market delivers the most visitors and expenditure. Tropical North Queensland has an 8 per centshare of the state’s domestic visitors. It is the most popular regional destination in Queensland for internationalvisitors with a 33 per cent market share. China is the largest international source market, while Europe deliversHigh Value Travellers who stay longer.
The target markets identified in the plan are:
· Domestic High Value Travellers (HVTs) – in 2017 HVTs accounted for only 35 per cent of leisure tripsto the region, but 60-70 per cent of overnight visitor expenditure
· International Experience Seekers - International travellers seeking an inspiring nature-baseddestination
· Education visitors - more than 32,000 international students from 34 countries studied in Cairns in2017
Opportunities and challenges
Key Opportunities identified are as follows:
20 https://cdn2-teq.queensland.com/~/media/0a155e2bd3124b52b11e930c27193765.ashx?vs=1&d=20181102T094647, sourced 9 Jan 2019

Tourism Routes
18
· Promotion of indigenous tourism experiences
· Product development – food trails, hiking and cycling trails, bird watching
· Further development and promotion of self-drive itineraries
· Attraction of major sporting events
· Growth in direct aviation capacity – domestically and internationally
· Working Holiday Maker global campaign to re-invigorate backpacker and youth travel
· Niche and special interest segments – domestic Chinese and Indian diaspora, international studentswithin Australia, hands-on authentic local experiences
· New infrastructure developments = new product to offer
· Citizens of Great Barrier Reef – position the destination as a world leader in conservation of globalnatural assets
· Find PR opportunities with other industries to develop the brand awareness (tropical fruits)
Key challenges identified are as follows:
· Reliance on sustainability of two key iconic assets, Great Barrier Reef and the Wet Tropics rainforest.The diversity of region’s assets is not maximised.
· Negative messaging around coral bleaching on Great Barrier Reef
· Limited co-ordination of economic and destination planning between regional stakeholders.Collaboration and communication between key industry stakeholders
· Non-sustainable funding model, and heavy reliance on small number of key funding partners. Lack ofre-investment by suppliers to upgrade/enhance product and experience offering
· Large number of small tourism businesses not ‘internationally/trade ready’
· Internet connectivity – poor or non-existent in some areas
· Domestic aviation and accommodation capacity under pressure during peak periods
· Slow development of additional product pillars e.g. Indigenous, food tourism
· Labour force challenges – especially during peak periods and in more remote areas
· Limited infrastructure capacity for large events
· A vast region to cover with high costs and difficult access

Tourism Routes
19
Queensland’s Outback, Gulf and Western Downs Tourism Opportunity Plan21
The purpose of this plan is to provide direction for the sustainable development of tourism in Queensland’sOutback, Gulf and Western Downs over the next five years. With respect to the FNQROC, the plan coversCarpentaria, Croydon, and Etheridge Shires.
This plan was released circa 2012 and has largely been superseded by theOutback Destinations Tourism Plan, see above, however many of theopportunities identified remain current.
Catalyst projects
The plan identifies the top 23 catalyst tourism projects. Relevant projectswithin FNQ ROC, or which may influence roads investment withinFNQROC:
· Lawn Hill / Riversleigh Tourism Master Plan22. The developmentof a Tourism Master Plan will address future plans for visitormanagement, facilities development and asset protection withinboth areas.
· Karumba Barramundi Discovery Centre Extension. The Centre isresponsible for the breeding and stocking of thousands of barramundi fingerlings into the rivers andlakes across North-West Queensland. The Centre currently runs a small tourism business whichcould be improved.
· Normanton Monsoon Centre which would tell the story of the wet season and its impacts on thepeople and landscapes in the Gulf
· Porcupine Gorge National Park Experience23. This project is located to the north of Potential tourismdevelopment opportunities and required upgrades/improvement of the site include a lookout upgrade,upgrade of gorge/river walks in and out of the gorge, cabin/safari tent accommodation and managedaccess to rock art sites.
Region wide projects
Region-wide projects identified in the plan include:
· Touring Market and Themed Routes Action Plan to ensure consistent marketing of key tourist routes
· Integrated Camping and Caravan Strategy which identifies free camping grounds across the regionand formulates a plan to upgrade these sites where necessary and manage them in coordination withestablished commercial caravan parks.
· Voluntourism and Guiding Tour Development Strategy to ensure consistency and quality of theinformation given to tourists throughout the destination.
· Coordinated Events Strategy will identify smaller events which can lever off major regional events andextend tourism stay and encourage greater dispersal throughout the region.
· Paddock to Plate Strategy would aim to develop visitor experiences around local produce specific toeach precinct across the Region.
· Outback Historical Sites Tourism Plan would identify key strategies and actions for their preservation,presentation and management of key sites and identify opportunities to maximize their potential to addvalue to the Region’s tourism experience.
21 https://cdn1-teq.queensland.com/~/media/e91ec73c04ab4e81ba6fa14abacf1cd9.ashx?vs=1&d=20140425T002356, sourced 9 Jan 201922 The park is located 220 km south-west of Burketown. Tourism improvements have the potential to complement the tourism experience within the
FNQROC area.23 While this project is located near Hughenden, it has the potential to complement the tourism experience within the FNQROC area.

Tourism Routes
20
· Outback Birding Opportunities Plan to further develop and market birding experiences to develop across-regional birding trail featuring iconic species such as the Bulla Bulla (Cloncurry Parrot), BoraBirds (Currawinya National Park) plus confirmed and unconfirmed sightings of the Night Parrot.
· An assessment of the key Regional National Parks and associated tourism experiences should beundertaken to identify opportunities for future facility upgrades, infrastructure development andexperience delivery.
· Visitor Information and Weather Reporting Program as part of a wider formal Visitor Safety Program.Key infrastructure required as part of the Visitor Safety Program should include pointer signage andcomfort signage as well as other roadside infrastructure such as toilets, Driver Reviver stops andinterpretive signage. Work has already begun through the local and regional Minor InfrastructureGrants and this should continue through the Local Government Authorities.
· Assessment of economic potential of the Backpacker Market, followed by an action plan to developand communicate with this market including the issue of public transport access
· Identification of ‘unique attributes’ can provide the basis for town theming that in turn will informlandscaping, signage and visitor attraction opportunities.
· Accommodation Needs Analysis to identify areas requiring future investment in accommodation forboth mining communities and visitor markets.
· Industry Story-Telling Workshops to further leverage the distinctive characters, stories and heroes thatare synonymous with the Region.
Precinct projects
Precinct projects both within and outside the FNQROC area which may influence tourist routes are as follows:
· Burke Shire Council Area
- Burketown Entry Statement, development of an aesthetic and appealing statement at theWestern entry of the town
- Burketown Lagoon and Waterbird Habitat, located at the Eastern entry to town is one of the lastfree running bores. While relatively un-developed it offers potential to create a lagoon andwaterbird habitat would provide an insight to tourists of the habitats of the local flora and faunalocated within the surrounding and inaccessible Gulf delta.
- Morning Glory Festival. The mysterious morning glory cloud formation has the potential to formthe basis for an event or festival within the gulf region. Given the unpredictable nature of theformation, a festival between the towns of Burketown, Karumba and Normanton could run overthe course of a week and drive tourists between the three towns for different events whichcelebrate this incredible natural phenomenon.
- Stargazing on the Salt Plains, which takes advantage of clear night skies and spectacularstargazing opportunities
· Carpentaria Shire Council Area
- Investigate opportunities for Wet Season Tourism Opportunities utilising air travel
- Burke and Wills Camp 119, the northern most camp of the explorers is not well known andopportunities exist to enlighten the extreme distance between this camp and their final restingpoint near Thargomindah.
- Karumba Boardwalk, completion of a wooden boardwalk providing a critical link between theeastern and western precincts of town. The walk should include native flora and faunainterpretation and background into the industries that drive the port.
· Croydon Shire Council Area
- Implementation of the Croydon Shire Tourism Strategy

Tourism Routes
21
- Implementation of the Lake Belmore Recreation Management Plan. Located just 4 kilometresfrom the main town centre, the lake is used year round by locals and visitors for boating, fishing,water skiing, bird watching and picnicking.
· Etheridge Shire Council Area
- Copperfield Gorge Management Plan. Einasleigh sits on the Eastern edge of the NewcastleRange, on the banks of the Copperfield River. Once a copper mining town, it is set among someunusual scenery with flat top hills that rise out of the grasslands. A key attraction to the town isCopperfield Gorge which includes a park, with electric barbecues and shade. With the completionof the new bridge and the spectacular environment that surrounds it, this is a true hidden treasureand has potential to be developed with camping and overnight facilities and interpretive signage.A plan to formalise parking, camping and safety issues surrounding Copperfield Gorge isrequired.
- Gem Fossicking Network, development of a plan to formalise and better promote a network ofgem sites across the Etheridge Shire Council Area including gem fossicking sites are AgateCreek, Flat Creek Station and Mount Surprise.
- Ecotourism and accommodation development, with Council claiming back some of the old townreserves around Gilberton, Durram, Forsayth and Gilbert River there is now potential for growth intourism related development
- Georgetown Visitor Information Centre redevelopment
- Road infrastructure upgrades identified are:
- Kennedy Developmental Road – bitumen upgrade to link the North West
- Bitumen upgrade for road from Einasleigh to the Lynd Highway
- Annual gravel road upgrades
- Undara Settlers’ Huts to improve their range of accommodation options at Undara
- Gateway Signage, proposes the formation of a partnership with the four local councils in theGulf of Carpentaria to buy and maintain gateway signage which promote each other’s regionand products – located at entry and exit points to shires.
Gulf Savannah Tourism Strategy 2018-20
The strategy identifies that tourism is vital for the Gulf Savannah, bringing in approximately 67,000 visitors to theregion annually who spend $65 million on accommodation and services. Tourism employs approximately 14%of workers in the Gulf Savannah and offers many seasonal and part-timeroles that enable them to live (and spend) in the region.
A SWOT analysis identified the following key issues:
Strengths· Proximity to International Airport (Cairns)
· Located on major, linked drive routes
· Authentic outback experiences
· Unstructured Journey
· Remoteness / silence / space
· Wildlife and nature
· Indigenous/European/mining/agricultural heritage andexperiences
· Visitor Information Centre Network
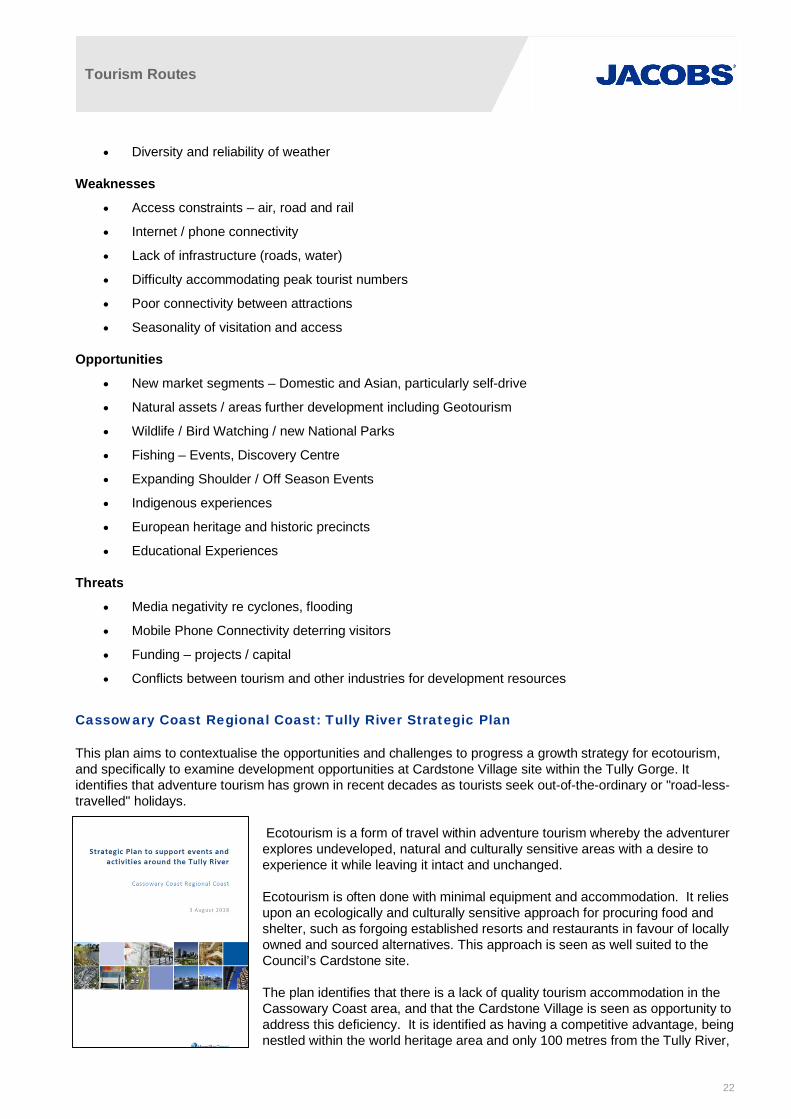
Tourism Routes
22
· Diversity and reliability of weather
Weaknesses· Access constraints – air, road and rail
· Internet / phone connectivity
· Lack of infrastructure (roads, water)
· Difficulty accommodating peak tourist numbers
· Poor connectivity between attractions
· Seasonality of visitation and access
Opportunities· New market segments – Domestic and Asian, particularly self-drive
· Natural assets / areas further development including Geotourism
· Wildlife / Bird Watching / new National Parks
· Fishing – Events, Discovery Centre
· Expanding Shoulder / Off Season Events
· Indigenous experiences
· European heritage and historic precincts
· Educational Experiences
Threats· Media negativity re cyclones, flooding
· Mobile Phone Connectivity deterring visitors
· Funding – projects / capital
· Conflicts between tourism and other industries for development resources
Cassowary Coast Regional Coast: Tully River Strategic Plan
This plan aims to contextualise the opportunities and challenges to progress a growth strategy for ecotourism,and specifically to examine development opportunities at Cardstone Village site within the Tully Gorge. Itidentifies that adventure tourism has grown in recent decades as tourists seek out-of-the-ordinary or "road-less-travelled" holidays.
Ecotourism is a form of travel within adventure tourism whereby the adventurerexplores undeveloped, natural and culturally sensitive areas with a desire toexperience it while leaving it intact and unchanged.
Ecotourism is often done with minimal equipment and accommodation. It reliesupon an ecologically and culturally sensitive approach for procuring food andshelter, such as forgoing established resorts and restaurants in favour of locallyowned and sourced alternatives. This approach is seen as well suited to theCouncil’s Cardstone site.
The plan identifies that there is a lack of quality tourism accommodation in theCassowary Coast area, and that the Cardstone Village is seen as opportunity toaddress this deficiency. It is identified as having a competitive advantage, beingnestled within the world heritage area and only 100 metres from the Tully River,

Tourism Routes
23
which is recognised for its white-water rafting. It hosted the World Rafting Championships in 2019, a 8 dayevent that attracted the world’s best rafters and spectators to the area.
Cardstone village is described as becoming an Eco-village set in tranquil, uncrowded and seemingly remote,but importantly easily accessible (20-minute helicopter flight from Cairns; 30 minute-drive from Tully and 15-minute helicopter flight to the Great Barrier Reef and easily drivable by car or bus from Cairns (2.5 hours) andTownsville (3 hours)).
Likely future tourist activities that could be offered in association with the Eco-village development include WhiteWater Rafting, wilderness hiking, Indigenous cultural experiences, zip-lining, mountain-biking, fly fishing, trailrunning and rogaining (orienteering).
The Eco-village development could be complemented by a high-quality mountain bike facility such as theproposed mountain bike park at Cardwell and for the Misty Mountains Wilderness Track area to become amountain bike adventure playground for non-core mountain bikers and trail runners.
The proposed development will have impacts on the western section of the Tully Mission Beach tourist drive, aloop, which connects Tully Gorge to Tully via Tully Gorge Road, Davidson Road and the Bruce Highway.
Inquiry into stimulating Northern Australia’s tourism industry
The Australian Parliament’s 2018 Inquiry24 examined the current state ofNorthern Australia’s tourism industry, opportunities for growth, challenges andeconomic impediments that tourism operators face in Northern Australia.
The Inquiry considered the scope for providing better access to NorthernAustralia. Road infrastructure becomes an enabler for tourists that arrive withinthe area, particularly as the majority of international and a large proportion ofdomestic tourists enter Northern Australia by plane. Improving roadinfrastructure like progressive sealing means journeys are safer and lengthenthe tourism season in areas otherwise inaccessible due to flooding. At thesame time, the Inquiry recognises that targeting some unsealed drive routescan attract adventure and 4WD tourists.
Submissions to the Inquiry suggested:
· the sealing of roads in Northern Australia has increased visitation as caravans and two-wheel drivevehicles bring new market segments
· sealing also encourages tourists to access a region more broadly, improving the overall yield
· Fully sealed circuit routes connected to several tourist sites could create new tourism businessopportunities along the route, plus increased visitation and longer stays
· unsealed roads are a significant risk to vehicles and personal safety, as are limited passingopportunities on roads passing lanes on high traffic roads, particularly those with road trains
· because most hire vehicle insurance companies do not allow for driving on dirt roads, sealing couldincrease visitation to more destinations
It appears there has been significant progress already made within the Cook Shire in promoting cultural tourism.Cooktown has been recognised as Australia’s recreational vehicle friendliest town, responding to this touristgroup seeking authentic Indigenous experiences.25
Specific reference is made to the value of grey nomads, described as ‘the bread and butter’ of tourism in theremote areas of Northern Australia.26. Of the 41 000 visitors to Longreach in the last calendar year, 80 to 85 per
24 https://www.aph.gov.au/Parliamentary_Business/Committees/Joint/Northern_Australia/TourismIndustry25 Councillor Peter Scott, Mayor, Cook Shire Council, Official Committee Hansard, Port Douglas, 3 July 2017, p. 43.26 Councillor Tony Martin, Remote Area Planning and Development Board (RAPAD), Official Committee Hansard, Brisbane, 6 July 2017, p. 25.

Tourism Routes
24
cent were grey nomads.27 Ensuring all-weather road access will attract more grey nomads to an area, enticingtravel to more remote attractions.
The Inquiry has recommended the Australian Government prioritise funding for sealing/upgrading the followingroutes within FNQROC:
· Bloomfield Track between Cape Tribulation and Wujal Wujal (Epic Cape York), noting there has beenbroad opposition from within the Douglas Shire28
· Gulf Development Road (Savannah Way)
· Peninsula Development Road to Seisa (Epic Cape York)
· Great Inland Way/Great Tropical Drive and the Savannah Way
2.4 Transport Strategies
Far North Queensland Regional Transport Plan 2018
The FNQ Regional Transport Plan29 covers the following 21 local government areas:
· Aurukun · Cairns · Cassowary Coast
· Cook · Croydon · Douglas
· Etheridge · Hope Vale · Kowanyama
· Lockhart River · Mapoon · Mareeba
· Napranum · Northern Peninsula Area · Pormpuraaw
· Tablelands · Torres Strait Island · Torres
· Weipa · Wujal Wujal · Yarrabah
The plan identifies that tourism is a major economic driver as the region providesaccess to the world heritage listed Great Barrier Reef Marine Park, and the WetTropics World Heritage Area.
It identifies that the growth of the self-drive tourism market is positivelycontributing to the region’s economy. Its further expansion is a key economicdevelopment strategy of the various local governments. With the progressivesealing of the Peninsula Developmental Road, the Far North Queensland regionwill be more reliable and accessible for both tourists and road freight vehicles,heightening the interaction between inexperienced rural/remote road users andhigh-efficiency freight vehicles. It will also result in an increased demand on thelimited rest areas available.
A rise in tourism numbers provides opportunities for tourism businesses such asecotourism, wilderness experiences, adventure tourism activities, cycle events,
Aboriginal and Torres Strait Islander cultural activities and sites, and coastal and outback tourism attractions,further increasing the attractiveness of the region as a tourist destination.
The plan identifies the following tourism related actions:
27 Councillor Tony Martin, RAPAD, Official Committee Hansard, Brisbane, 6 July 2017, pp 19-20.28 Tourism Port Douglas and Daintree, Submission 50, Attachment A, p. 3.29 https://www.tmr.qld.gov.au/About-us/Corporate-information/Publications/Regional-Transport-Plans, sourced 19 Feb 2019

Tourism Routes
25
· Determine investment priorities for new or upgraded rest areas to address driver fatigue risks,encourage safe travel, and to provide sufficient capacity and amenities to enhance customerexperiences, particularly on drive tourism routes
· Undertake planning to improve safety and customer experience on tourist routes such as the GreatInland Way, the Pacific Coast Way, the Great Tropical Drive and the Savannah Way, throughinitiatives such as signage, and targeted communication about safe driving in Far North Queensland
· Undertake a regional transport needs analysis to understand the travel needs of tourists and visitors,and strategic opportunities to inform initiatives and programs such as Drive Tourism, Tourism andTransport Connections, Natural Attractions and State Strategic Touring Route Signage Program
· Work with local government, other state government agencies and tourism bodies to support activetransport projects that also have recreational values and contribute to the lifestyle of the Far NorthQueensland region
Queensland Tourism and Transport Strategy30
The Queensland Tourism and Transport Strategy aims to improve access acrossQueensland and enhance the visitor experience to help grow the tourismindustry.
The strategy adopts a multi-modal approach encompassing all forms oftransport. It is centred around the themes of visitor information, transportservices, ticketing and products and planning and investment
State strategic touring routes identified within the plan include:
· Bruce Highway
· Cairns – Normanton (Kennedy Highway, Gulf Developmental Road andBurketown – Normanton Road
· Normanton – Karumba (Burke Developmental Road and KarumbaDevelopmental Road)
The plan identifies several actions including:
Theme 1: Visitor information· Work with tourism operators, transport operators and accommodation providers to increase the
understanding of the value of accurate, multi-modal transport information through promoting existingdata feeds and educating industry on their use
· Enhance promotion of existing drive tourism routes through continued rollout of State StrategicTouring Routes signage upgrades coordinated marketing campaigns with touring route committees
· Work with local governments to develop and implement a standardised approach to wayfinding fortransport services and infrastructure.
Theme 2: Transport services
Improve access and destination infrastructure through initiatives such as:
· the Transport and Tourism Connections Program
· the Scenic Lookout Upgrade Program
· Great Barrier Reef Island Resorts Rejuvenation Fund
30 https://publications.qld.gov.au/dataset/queensland-tourism-transport-strategy/resource/20d72300-ab2f-4b73-83c9-581d5eba0b5e, sourced 9 Jan2019

Tourism Routes
26
· the Drive Tourism Support Package
· Growing Tourism Infrastructure Program
· Support local governments and the tourism industry to develop drive tourism through:
- producing the Planner’s Guide to Managing Caravanning, Camping and RVs
- updating the Guidelines on Good Practice for Caravan Parks and Relocatable Home Parks
· Improve driver safety and enhance the drive tourism experience by conducting research into:
- visitor-focused digital in-vehicle signage
- improved trip preparation tools.
· Identify and implement opportunities to reform regulatory frameworks to enable innovative transportbusiness opportunities, reduce unnecessary burden on visitors and businesses and create efficienciesin government
Theme 3: Ticketing and products· Develop Queensland’s active tourism offering through:
- undertaking research into the economic potential of cycling related tourism
- supporting the development of long distance multi-use recreational trails
· Support the development of new and enhanced drive tourism experiences as part of the continualimprovement of the existing State Strategic Touring Route network
Theme 4: Planning and investment· Deliver planned upgrades along key tourism routes such as the Bruce Highway and Warrego Highway
to improve road capacity and safety
· Host the annual tourism and transport roundtable to provide a forum for the tourism industry to discusstransport priorities
Captain Cook Highway Strategic Plan31
The strategy suggests the Captain Cook Highway and the Bloomfield Track areamong Australia’s most iconic roads. Although outnumbered by domestic visitors,international visitors are more likely to stop at natural and other key attractions.These activities can be facilitated by:
· Effective signage that allow easy navigation of routes and access toattractions
· Introducing iconic stopping places every 30 minutes to enable visitorexploration along the routes
· Improved overtaking opportunities and safe pullover lanes to facilitateincreased stopping
Rather than pinpointing significant road upgrades, the Strategic Plan broadlyadvocates ongoing investment in road safety infrastructure and improvements to theentire route, including the Bloomfield Track.
31 https://www.aph.gov.au/DocumentStore.ashx?id=3f5e7eaa-c07f-4194-99e3-9cd22c381c5d&subId=463867 sourced 15 May 2019

Tourism Routes
27
2.5 Summary
The region’s tourism industry is predominantly based on natural and cultural features. It includes two WorldHeritage listed areas, the rainforests of the Wet Tropics and the reefs and waters of the Great Barrier Reef(GBR). To the west is the Gulf Savannah and outback and to the north is Cape York Peninsula.
Most tourist activities are concentrated along the coast between Mission Beach and Cape Tribulation, and thoseareas of the Great Barrier Reef with direct access from Cairns, Port Douglas and Mission Beach. There ishowever a significant and growing outback and adventure tourism industry within Cassowary Coast, Tablelands,Mareeba Gulf Savannah and Cape York, which largely cater to the drive tourism market. Growth in theadventure tourism industry includes proposed investment into mountain biking trails and hosting of majorsporting events such as the World Rafting Championships, held in Tully in May 2019.
Planning strategies identify that there is strong tourism growth potential for high value tourism businesses suchas ecotourism, wilderness experiences and adventure tourism activities, particularly surrounding self-drive fourwheel drive adventuring, organised group sport fishing travel, wildlife spotting, exploring land and waterscapefeatures, cultural activities, historic sites and the natural environment.
Cultural tourism is actively encouraged and is seen as a way for indigenous communities to return to theirtraditional country while providing economic resilience and employment opportunities.
In general, all local governments within the region agree that tourism and nature-based tourism developmentmust be undertaken in a way and in locations that ensures the development does not detract fromenvironmental values, scenic values, coastal values and town/village character that attracts visitors to theregion, as opposed to large-scale attractions that have little connection to local context, particularly those thatcan be found anywhere.
Resilient transport infrastructure to ensure connectivity across the region is identified as essential if FNQ is tohave sustainable economic growth and development. The state of the roads is a major safety concernimpacting tourism development across the region as the growth of visitors from Asia fly in through Cairns toexplore northern Australia.
The various tourism strategies identify a range of region wide tourism opportunities as well as opportunities forvarious local governments and sub-areas as follows. These opportunities are divided into the following sub-area and the impacts on various tourist routes:
· Coastal - this area extends between Port Douglas and Mission Beach and adjoining hinterland. Itincludes the local government areas of Cairns, Cassowary Coast, Douglas, Hinchinbrook, Mareeba,Tablelands, and Yarrabah.
· Gulf Savannah - this area encompasses Carpentaria, Croydon and Etheridge local governmentareas. It also includes Burke and Doomagee to the west.
· Cape York - this area includes Cook, Hope Vale and Wujal Wujal local government areas. It alsoincludes Kowanyama, Pormpuraaw, Mapoon, Napranum, Northern Peninsula area, Lockhardt Riverand Torres Strait local government areas.
The following section details potential opportunities by FNQROC sub-area, local government area and tourismroute that provides access to the opportunity.
Coastal
Cairns is identified as playing a vital role in servicing the needs of the region. It is a tourist destination ofinternational significance and provides a landing point for visitors arriving by air or sea. It also provides adiverse range of tourist accommodation, attractions and experiences. Cairns is supported by a network ofsmaller towns and villages which act as sub-regional activity centres and/or act a base to access a range oflocal tourist attractions. Several defined tourist routes begin at or pass through Cairns.

Tourism Routes
28
The main tourist routes within the Cassowary Coast are the Canecutter Way and Tully Mission Beach touristroutes. Tully Falls Road and the Waterfall Discovery Trail provide access to scenic attractions in theCassowary Coast hinterland while the Great Green Way and the Great Tropical Drive also pass through thearea.
Cassowary Coast is a network of centres. Innisfail is the major regional activity centre, Tully has a districtregional activity centre and the villages of Mission Beach, and Wongaling Beach and Cardwell contain villageactivity centres. Tourism development that does not detract from environmental values, scenic values, coastalvalues and town/village character that attracts visitors to the region will be pursued. Food tourism isencouraged, with the development of permanent or periodic food markets are also encouraged. The adventuretourism industry in this region has been expanding, including the World Rafting Championships held in Tully in2019. Cassowary Coast is seeking to expand its adventure tourism market by catering to other high-profileevents that the Tully River’s natural environment can offer. The Coordinator-General has also approved the EllaBay integrated resort development approximately 10 kilometres north of Innisfail.
Douglas Shire encourages nature-based tourism as opposed to large-scale attractions that have littleconnection to local context, particularly those that can be found anywhere. The Wangetti Trail is a proposed 76kilometre dual use (mountain biking and hiking) trail between Palm Cove and Port Douglas. This would havelimited impact on existing tourist routes. The main tourist routes within Douglas Shire are the Reef toRainforest tourist drive which includes Port Douglas Road, Captain Cook Highway and Mossman - Mt MolloyRoad and the Great Tropical Drive and Epic Cape York tourist routes which both include the Captain CookHighway and Mulligan Highway. The southern part of the Daintree Explorer tourist route which includes theMulligan Highway, Mossman – Daintree Road and Mossman – Mt Molloy Road passes through the shire.
Hinchinbrook is recognised for its fishing, mountain biking, bush walking, natural assets including HinchinbrookChannel, Orpheus Island, National Parks, Wallaman Falls and Mount Fox, and the TYTO wetlands centre.There is strong community support for increased access to waterways and national parks for recreational andresidential tourism. The Hinchinbrook Tropical Discovery Trail, which provides access to many of thesedestinations, is the main tourist route in Hinchinbrook. The Great Green Way and Great Tropical Drive bothinclude the Bruce Highway which passes through the shire.
Mareeba Shire identifies that Kuranda will continue to maintain its status as a major tourist destination whileChillagoe will continue to attract more interest and visitors. Irvinebank is recognised as a key site and a point ofinterest to tourists. Chillagoe and Irvinebank are also identified as potentially forming part of a geo-trail whichwould be centred on Etheridge Shire, refer to discussion below. The Shire’s planning scheme supports theaspirations of indigenous communities to return to their traditional country, facilitated through the developmentof interpretive tourism and rural based economic development. The Chillagoe Discovery Trail is the majortourist route within Mareeba Shire. The Kennedy and Mulligan Highway are also major tourist routes. Theyform part of the Reef to Rainforest, Great Tropical Drive and Epic Cape York tourist routes; and WaterfallsDiscovery Trail and Savannah Way (Kennedy Highway only).
Tablelands Shire identify that its proximity to Cairns International Airport and tourist base provides opportunitiesfor increasing visitation. Large scale tourist accommodation facilities are therefore proposed in key sites acrossthe region and a diverse range of short term accommodation facilities are proposed in the region’s towns andrural areas. Yungaburra and Tinaroo will consolidate their tourism status due to Lake Tinaroo. Herberton,Malanda and Millaa Millaa will continue to attract more interest and visitors. Tourist parks in key locationscontinue to provide sites to accommodate caravans and recreational vehicles. Mt Garnet, 40 Mile ScrubNational Park and Herberton are also identified as potentially forming part of a geo-trail which would be centredon Etheridge Shire, refer to discussion below. The Waterfall Discovery Trail is perhaps the most importantroute for tourists. It is a loop route which starts in Cairns and connects major centres and tourist destinations inthe Shire before returning to Cairns via the Bruce Highway. There are several shorter tourist routes whichservice specific areas. These are Malanda- Atherton Road, Longlands Gap Road, Tully Falls Road andDanbulla Tinaroo Falls Road. The Kennedy Highway is also a major tourist route which forms part of the Reefto Rainforest tourist route, Chillagoe Discovery Trail, Great Tropical Drive, Georgetown tourist route (westfrom Ravenshoe only) and Savannah Way.

Tourism Routes
29
Yarrabah Planning Scheme identifies that cultural tourism will take advantage of Yarrabah’s proximity to Cairnsas well as short and multi-day walking trails. Yarrabah which is south of Cairns is connected to the BruceHighway via the Pine Creek – Yarrabah Road. Pine Creek – Yarrabah Road is not a tourist route.
Gulf Savannah
Etheridge Shire identifies the potential of a geo-trail which would connect Undara Volcanic Park, CobboldGorge, Copperfield Gorge, the three fossicking areas of Flat Creek, Agate Creek and O’Brien’s Creek andTalaroo Hot Springs. It could possibly also include Chillagoe and Irvinebank (in Mareeba Shire) and Mt Garnet,40 Mile Scrub National Park and Herberton (Tablelands Shire) and Croydon as well as the Dinosaur Trail andWestern Discovery Centre (outside of region). Etheridge Shire Council also identify the potential for CopperfieldGorge to be developed with camping and overnight facilities and interpretive signage. Relevant tourism routesinclude the Chillagoe Discovery Trail, Georgetown and O’Brien’s Creek Road tourist routes and Savannah Way.
Croydon is located on the Gulf Developmental Road (part of the tourism highway network) which forms part ofthe Savannah Way tourist route. Council and the community would like to ensure that the route for this roadremains unchanged (no future bypassing of the township), ensuring continued exposure and ready access toCroydon’s businesses and attractions. The importance of Lake Belmore, located 4 kilometres from the maintown centre, is identified for its importance for boating, fishing, water skiing, bird watching and picnicking byboth visitors and locals. Littleton National Park is also identified as providing opportunities for nature basedtourism and recreational opportunities such as mountain biking32.
Normanton and Karumba are the two main towns within Carpentaria Shire. Both towns are located on theSavannah Way. Carpentaria Shire identifies the opportunity to better promote Burke and Wills Camp 119, thenorthern most camp of the explorers as well as develop a boardwalk at Karumba link between the eastern andwestern precincts of town and providing native flora and fauna interpretation and background into the industriesthat drive the port. Other opportunities include extension of the Karumba Barramundi Discovery Centre which isresponsible for the breeding and stocking of thousands of barramundi fingerlings into the rivers and lakesacross North-West Queensland. The Centre currently runs a small tourism business which could be improved.Normanton Monsoon Centre which would tell the story of the wet season and its impacts on the people andlandscapes in the Gulf is also identified.
Cape York
Tourist development north of the Daintree River is expected to be relatively small-scale, nature-based andprotect the unique ecological values and local character. Douglas Shire is currently exploring the options of abridge crossing, a single ferry or a two-ferry service. The preferred option is to be guided by communitysentiment and the possible economic benefits to the region.
Wujal Wujal, north of the Daintree River, is located on the banks of the Bloomfield River and on the BloomfieldTrack. Natural attractions such as the Bloomfield Falls, Roaring Meg Falls and other historic and Aboriginalcultural heritage attractions support a fledgling tourist trade. The Bloomfield Track forms part of the DaintreeExplorer, Epic Cape York and Great Tropical Drive tourist routes.
Hope Vale Aboriginal Shire Council identifies that completing the sealing of Battlecamp Road from theEndeavour Valley Road to the Peninsula Development Road would not only increase all weather access andimprove banana crop transport efficiency but also tourism opportunities and reduce safety risks. Tourist usesthat recognise and depend on the values of cultural features and natural resources are encouraged. EndeavourValley Rd, Battlecamp Rd and Peninsula Developmental Rd all form part of the Cooktown Discovery Trail andEpic Cape York tourist route.
Cook Shire occupies most of Cape York. FNQROC identifies that over 80% of Cape York cannot be accessedby land-based transport during the wet season. The progressive sealing of the Peninsula Developmental Road
32 Croydon Shire Council has recently finalised a business case for business case on a proposed 80.m (9 loop) Mountain Bike Trail Network.

Tourism Routes
30
is making the Cape more accessible for both tourists and road freight vehicles however east-west linkagesremain poor and simply cannot cope with any increased level of heavy transport.
Cook Shire identifies that its abundance of natural and cultural assets provide opportunities for establishmentand expansion of tourism-related development and infrastructure in the following areas:
· National Parks, where amenity and environmental impacts can be managed.
· RVs and camping particularly near Cooktown’s services and facilities.
· Educational and cultural experiences, such as rural farm stays and Indigenous experiences, wherethere is community support, adequate facilities and risks from natural hazards can be avoided ormanaged.
Relevant tourism routes are the Cooktown Discovery Trail, Daintree Explorer, Epic Cape York and GreatTropical Drive tourist routes.
Region wide issues and opportunities
Various plans and strategies identify a range of opportunities to increase tourist numbers. Relevant roadinvestment issues and opportunities identified are as follows:
· improve rest areas to better cater for tourist needs.
· better promotion and signage of major tourism routes, including digital in-vehicle signage
· improving access and facilities for caravan and camping
· the interactions between self-drive tourists and road freight movements, particularly in more regionalareas where heavy vehicles can be over 50 metres long
· poor or non-existent mobile communications
· insufficient education on how to travel through the outback for tourists

Tourism Routes
31
3. Tropical North Queensland’s tourism industryThis section presents a broader background of Tropical North Queensland’s (TNQ) tourism industry and itsimportance to Queensland as a whole. The aim is to provide a context for acloser observation of the FNQROC region within the continuing chapters.
Tourism Research Australia (TRA) (https://www.tra.gov.au) is the most reliabledata source for Queensland’s defined Tourism Regions, which are constructedfrom whole Statistical Area Level 2 (SA2). The TNQ tourism region extends fromthe eastern seaboard to the Northern Territory, and subsequently results in databeing aggregated to provide a greater level of reliability.
The economic contribution of a particular geography, industry or activity isgenerally measured in two ways:
· Gross Domestic Product (GDP) measures the net wealth generated within adefined economy. It is measured at purchasers’ (market) prices which includes any taxes and subsidies.While GDP measures the national economy, Gross State Product (GSP) and Gross Regional Product(GRP) measures smaller geographies. . GDP/GRP is the sum of all industries' Gross Value Add.
· Gross Value Add (GVA) is a measure of productivity by showing how a geography’s industry or activityincreases the value of its inputs. It is the value of sales generated by each industry, minus the cost of itsinputs. It is a more useful indicator than GDP/GRP as it excludes payments made through the taxationsystem. It also provides a better measure than output (which is represented by total gross revenue)because an industry’s high level of output may require a corresponding high level of input.
Economic contribution is primarily through direct transactions between visitors and goods/service providers e.g.visitors paying to staying in a hotel accommodation. Direction transactions also have flow-on effects to otherindustries supplying to the hotel e.g. electricity. These indirect contributions can also be significant andrepresent the broader value of a particular industry throughout an economy.
Queensland has consistently contributed around a quarter of Australia’s total tourism GVA over the last 11years, second only to New South Wales33 (Figure 3-1 and Figure 3-2). Queensland has mainly contributed tototal Australian GVA through its intrastate overnight visitors, although interstate and international overnightvisitors have closed the gap over the last 3 years (Figure 3-3).
In terms of GVA contribution within Queensland34, TNQ is rated third after Brisbane and the Gold Coast. Thesame pattern applies to tourism employment. While this is not surprising, both Brisbane and the Gold Coast’shigher population naturally attract more friends and relatives rather than holidaying tourists. TNQ notablyconsistently outperforms the other two regions on a visitor per population basis.
Table 3-1 Visitor/ population ratiosRegion 2009-10 2010-11 2011-12 2012-13 2013-14 2014-15 National rank35
Tropical North Qld 10.7 13.2 10.9 11.3 10.8 11.4 26
Brisbane 3.3 3.8 3.6 3.7 3.6 3.6 69
Gold Coast 10.2 7.2 9.8 10.9 8.9 7.3 38
TNQ is subsequently the highest contributor to Regional Queensland’s GVA i.e. omitting Brisbane and GoldCoast. The same pattern applies to tourism employment, inferring tourism’s service-based activities arecorrelated to labour rather than commodities or physical inputs.
33 Australian Government (2018), State Tourism Satellite Accounts 2016–17, Tourism Research Australia, Canberra34 Australian Government (2018), Regional Tourism Satellite Accounts 2016–17, Tourism Research Australia, Canberra35 Ranked out of all 76 Tourism Region Profiles in the latest available time period.

Tourism Routes
32
The largest directly contributing industries to TNQ’s tourism GVA are transport-related, accommodation andhospitality service providers. The proportions of these sectors notably differ from Queensland as a whole,highlighting the more prominent role of transport supporting TNQ’s tourism sector.

Tourism Routes
33
Figure 3-1 Australia’s tourism GVA 2016-2017 Figure 3-2 Queensland proportion of total Australian tourism GVA
Figure 3-3 Queensland contribution to Australian tourism GVA by trip type
21%
22%
23%
24%
25%
26%
27%
2006–07 2007–08 2008–09 2009–10 2010–11 2011–12 2012–13 2013–14 2014–15 2015–16 2016–17
Qld proportion of Aust GVA
$0.0$0.5$1.0$1.5$2.0$2.5$3.0$3.5$4.0$4.5
2006–07 2007–08 2008–09 2009–10 2010–11 2011–12 2012–13 2013–14 2014–15 2015–16 2016–17Bi
llions
Qld contribution to Australian tourism GVA by trip type
GVA - same-day travel GVA - intrastate overnight
GVA - interstate overnight GVA - International
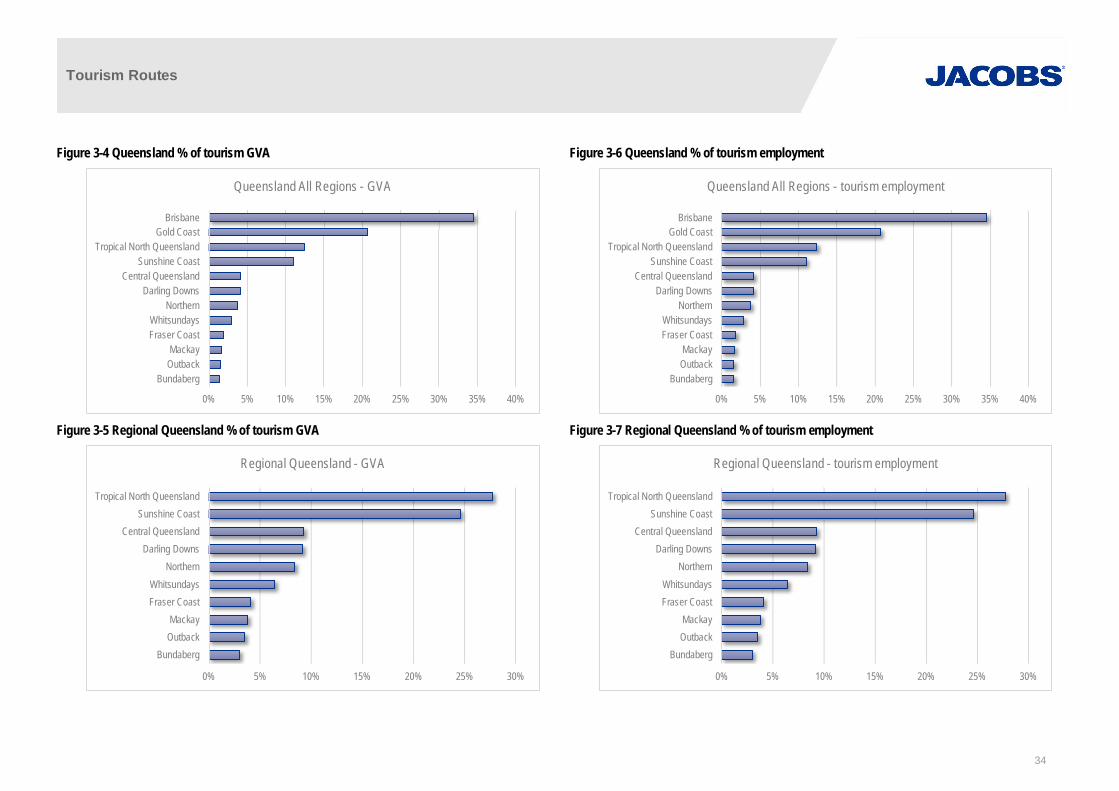
Tourism Routes
34
Figure 3-4 Queensland % of tourism GVA
Figure 3-5 Regional Queensland % of tourism GVA
Figure 3-6 Queensland % of tourism employment
Figure 3-7 Regional Queensland % of tourism employment
0% 5% 10% 15% 20% 25% 30% 35% 40%
BundabergOutbackMackay
Fraser CoastWhitsundays
NorthernDarling Downs
Central QueenslandSunshine Coast
Tropical North QueenslandGold Coast
Brisbane
Queensland All Regions - GVA
0% 5% 10% 15% 20% 25% 30%
BundabergOutbackMackay
Fraser CoastWhitsundays
NorthernDarling Downs
Central QueenslandSunshine Coast
Tropical North Queensland
Regional Queensland - GVA
0% 5% 10% 15% 20% 25% 30% 35% 40%
BundabergOutbackMackay
Fraser CoastWhitsundays
NorthernDarling Downs
Central QueenslandSunshine Coast
Tropical North QueenslandGold Coast
Brisbane
Queensland All Regions - tourism employment
0% 5% 10% 15% 20% 25% 30%
BundabergOutbackMackay
Fraser CoastWhitsundays
NorthernDarling Downs
Central QueenslandSunshine Coast
Tropical North Queensland
Regional Queensland - tourism employment
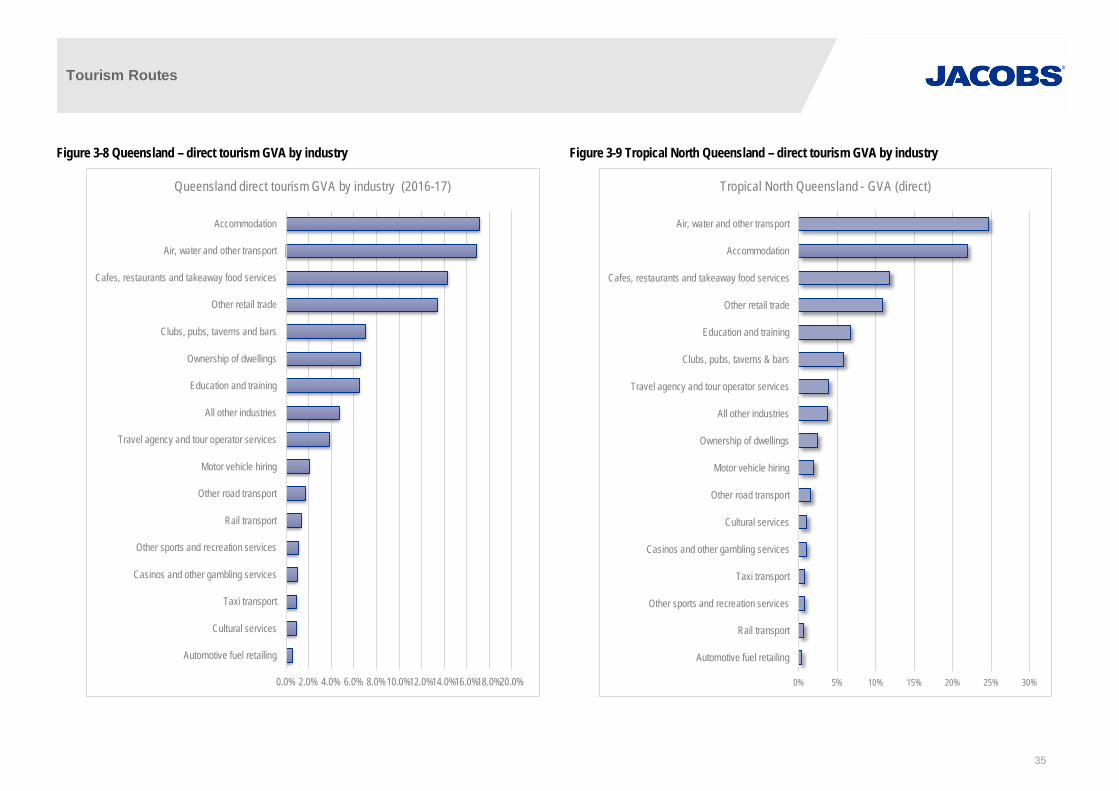
Tourism Routes
35
Figure 3-8 Queensland – direct tourism GVA by industry Figure 3-9 Tropical North Queensland – direct tourism GVA by industry
0.0% 2.0% 4.0% 6.0% 8.0%10.0%12.0%14.0%16.0%18.0%20.0%
Automotive fuel retailing
Cultural services
Taxi transport
Casinos and other gambling services
Other sports and recreation services
Rail transport
Other road transport
Motor vehicle hiring
Travel agency and tour operator services
All other industries
Education and training
Ownership of dwellings
Clubs, pubs, taverns and bars
Other retail trade
Cafes, restaurants and takeaway food services
Air, water and other transport
Accommodation
Queensland direct tourism GVA by industry (2016-17)
0% 5% 10% 15% 20% 25% 30%
Automotive fuel retailing
Rail transport
Other sports and recreation services
Taxi transport
Casinos and other gambling services
Cultural services
Other road transport
Motor vehicle hiring
Ownership of dwellings
All other industries
Travel agency and tour operator services
Clubs, pubs, taverns & bars
Education and training
Other retail trade
Cafes, restaurants and takeaway food services
Accommodation
Air, water and other transport
Tropical North Queensland - GVA (direct)

Tourism Routes
36
TRA publicly releases 2015 trip and visitor information within various categories where the data is reliable. Oftenthis means disaggregated data is not published, and inferences need to be made from what data is madeavailable.
The data revolves around:
· Trip purpose (holiday or leisure, visiting friends and relatives, business, other)
· Trip type (day, overnight)
· Visitor origin (international, domestic)
· Spending activity
Day and overnight trips have remained relatively stable within TNQ whereas Queensland has trended upwards,particularly day trips36. Noting that this covers all trip purposes, a more telling picture is presented whencomparing holiday trips as a percentage of total trips. For day trips, TNQ has fluctuated more notably thanQueensland but has trended upwards over the last 5 years. Queensland has mostly declined over the sameperiod.
For overnight trips, TNQ has again fluctuated more than Queensland although both largely are stable over thelong term. The key message however is that the proportion of holiday day trips to FNQ are generally higherthan Queensland and substantially higher for overnight trips with an average of 56%.
The key tourism statistics show that:
· International visitors stay almost twice as long than domestic overnight visitors, but only spendapproximately 20% more per trip
· Holidays are by far the primary reason for each trip (92% international, 51% domestic overnight, 48%domestic day)
· Almost 70% of domestic overnight trips originate within Queensland
· Nature based activities are secondary to food and wine
Table 3-2 TNQ key tourism statistics (2015)37
Key Statistic International Domestic overnight Domestic day
Visitors ('000) 781 2,137 2,363
Average stay and spend Average stay (nights) 9 5 -
Average spend per day/night ($) $152 $225 $131
Reason (visitors '000) Holiday 721 1,084 1,125
Visiting friends or relatives 40 461 np
Business 15 480 np
Other 20 np np
Visitors by origin ('000) Intrastate N/A 1,437 2,363
Interstate N/A 700 np
Activities (visitors '000)
(includes multipleactivities)
Culture and heritage 576 384 np
Food and wine 748 1,371 832
Nature based 734 870 np
36 Due to a change in methodology in 2014, comparisons between data from 2014 and onwards to earlier periods should be treated with caution.37 ‘np’ = the estimate is unreliable and cannot be published.
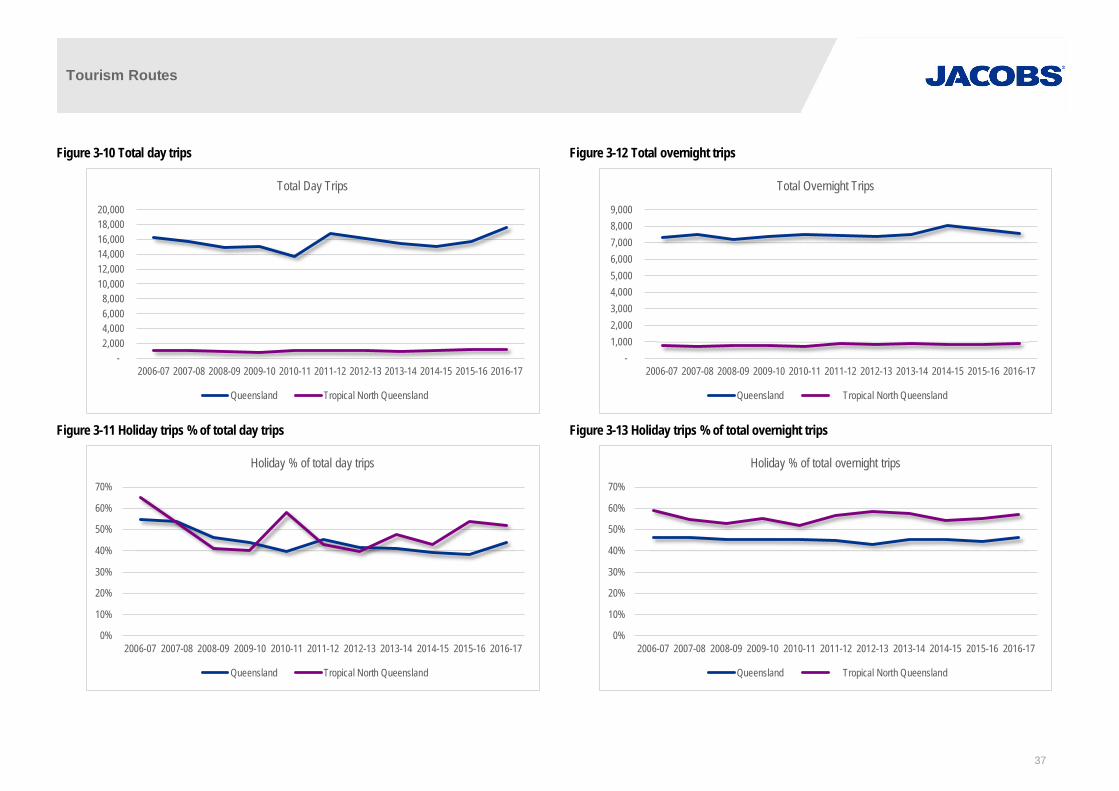
Tourism Routes
37
Figure 3-10 Total day trips
Figure 3-11 Holiday trips % of total day trips
Figure 3-12 Total overnight trips
Figure 3-13 Holiday trips % of total overnight trips
- 2,000 4,000 6,000 8,000
10,000 12,000 14,000 16,000 18,000 20,000
2006-07 2007-08 2008-09 2009-10 2010-11 2011-12 2012-13 2013-14 2014-15 2015-16 2016-17
Total Day Trips
Queensland Tropical North Queensland
0%
10%
20%
30%
40%
50%
60%
70%
2006-07 2007-08 2008-09 2009-10 2010-11 2011-12 2012-13 2013-14 2014-15 2015-16 2016-17
Holiday % of total day trips
Queensland Tropical North Queensland
- 1,000 2,000 3,000 4,000 5,000 6,000 7,000 8,000 9,000
2006-07 2007-08 2008-09 2009-10 2010-11 2011-12 2012-13 2013-14 2014-15 2015-16 2016-17
Total Overnight Trips
Queensland Tropical North Queensland
0%
10%
20%
30%
40%
50%
60%
70%
2006-07 2007-08 2008-09 2009-10 2010-11 2011-12 2012-13 2013-14 2014-15 2015-16 2016-17
Holiday % of total overnight trips
Queensland Tropical North Queensland

Tourism Routes
38
Additional statistics reveal transport mode and accommodation preferences as:
· Approximately 15% of international visitors and 53% of domestic overnight visitors are by car (67% of alltrips)
· Caravan/camping is used by approximately 6% of international visitors and 17% of domestic overnightvisitors
Table 3-3 Transport trips by modeMode International Domestic overnight Domestic day
Air 61% 47% --
Drive 15% 53% 100%
Other 24% -- --
Table 3-4 AccommodationInternational Domestic overnight
Hotel or similar Hotel or similar
67% 44%
Backpacker or hostel Friends or relatives’ property
20% 26%
Caravan/Camping Caravan/Camping
6% 17%
Other Other
8% 13%

Tourism Routes
39
4. Tourism within FNQROCUnderstanding the role of Tourism specifically within FNQROC and how councils contribute is not easilyobservable because of data limitations. TRA remains the most reliable source of information, and publiclyreleases Local Government Area Profiles for 34 of Queensland’s 76 councils. This however covers only 6 ofFNQROC’s 13 members being Cairns, Cassowary Coast, Cook, Douglas, Mareeba, Tablelands. Somedatasets are awaiting updates from annual recent travel surveys, and subsequently do not contain recentinformation.
Three publicly available data sources have informed the analysis, being:
· .ID Consulting Pty Ltd’s Economy.id (https://economy.id.com.au)
· Available Local Government Area Profiles
· Gulf-Savannah Tourism Survey
Each source has been found to offer reliable insights to individual council contributions. They are however at arelatively high level and are limited in their application.
The most informative dataset has been sourced directly from TRA, albeit with reliability limitations due to smallsample sizes. Comparing the data with the three data sources allows a form of integrity check, and the findingsfrom each source presented no major inconsistencies.
Economy.id analysis
The role of tourism within FNQROC can be assessed at a broad level with Economy.id, including the economiccontribution of the tourism industry and how it has changed over time. It however does not provide informationat lower levels such as the average spend per tourist.
Economy.id contains an economic and tourism profile for the FNQROC region as a whole, plus profiles for thesame 6 councils covered by Tourism Research Australia. Comparing these councils to the FNQROC profilesallows the estimation of how the remaining 7 FNQROC members jointly contribute to the tourism sector. Theapproach is to isolate the effect of individual councils with data from FNQROC totals, with the difference being ajoint contribution of those councils without data38.
The approach is illustrated in Figure 4-1 and Figure 4-2.
38 Further disaggregation of the remaining councils’ contribution is possible by overlaying a proxy dataset e.g. tourism-related employees within eachcouncil. This however is potentially misleading as it is likely more weighted towards locations with hotel-type accommodation and hospitalityservices rather than nature-based locations that cater to caravan/camping tourists.

Tourism Routes
40
Cairns unsurprisingly generates the largest tourism GVA, contributing nearly 70% to the FNQROC total.Douglas Shire follows by adding 17%, but interestingly has tourism contributing over 46% of its total GVA. Thishighlights the importance of tourism to Douglas Shire’s local economy. Cassowary Coast and Tablelands followwith significantly less contributions. The findings suggest that nearly 95% of FNQROC’s tourism GVA aregenerated within a 150km radius of Cairns. Direct and indirect tourism employment shows a similar pattern.
Table 4-1 FNQROC tourism GVA rankingCouncil
Council % of total FNQROC tourism GVA% of FNQROC tourism employment
(direct and indirect)
Cairns 69% 70%
Cassowary Coast 4% 5%
Cook 2% 2%
Douglas 17% 14%
Mareeba 3% 2%
Tablelands 4% 4%
Remaining Councils 2% 2%
The visitor analysis presented in the following figures suggest:
· International visitors are notably trending upwards, however this mostly limited to Cairns
· Domestic overnight visitors have largely remained stable prior to a spike in Cairns during 2017/18
· The international visitor average stay is significantly higher in Mareeba and more recently Tablelands
· The domestic overnight visitor is highest within Douglas, with Tablelands increasing over recent time
Figure 4-2 Aggregated councils (yellow)
FNQROC
Cairns,Cassowary
Coast, Cook,Douglas,Mareeba,
Tablelands
Remaining CouncilsCarpentaria,
Croydon, Etheridge,Hinchinbrook, Hope
Vale, Yarrabah,Wujal Wujal
Figure 4-1 Estimating council contribution

Tourism Routes
41
Figure 4-3 FNQROC tourism GVA ($m)
Figure 4-4 FNQROC total industry GVA ($m)
Figure 4-5 Tourism employment
Figure 4-6 All industry employment
0%
20%
40%
60%
80%
100%
120%
$0$200$400$600$800
$1,000$1,200$1,400$1,600$1,800
FNQROC Cairns Cook CassowaryCoast
Douglas Tablelands Mareeba RemainingCouncils
FNQROC tourism GVA ($m)
FNQROC tourism GVA % of FNQROC tourism GVA
0%5%10%15%20%25%30%35%40%45%50%
$0
$2,000
$4,000
$6,000
$8,000
$10,000
$12,000
$14,000
FNQROC Cairns Cook CassowaryCoast
Douglas Tablelands Mareeba RemainingCouncils
FNQROC total industry GVA ($m)
FNQROC total industry GVA Tourism % of total industry GVA
0%10%20%30%40%50%60%70%80%
0
2,000
4,000
6,000
8,000
10,000
12,000
FNQROC Cairns Cook CassowaryCoast
Douglas Tablelands Mareeba RemainingCouncils
Tourism Employment (total)
Direct Indirect % of FNQROC total tourism employment
0.0%5.0%10.0%15.0%20.0%25.0%30.0%35.0%40.0%
0
20,000
40,000
60,000
80,000
100,000
120,000
140,000
FNQROC Cairns Cook CassowaryCoast
Douglas Tablelands Mareeba RemainingCouncils
All industry employment (total)
Total employment % of total industry

Tourism Routes
42
Figure 4-7 International Visitors
Figure 4-8 Domestic Overnight Visitors
Figure 4-9 International Visitor average stay
Figure 4-10 Domestic Overnight Visitor average stay
-
200,000
400,000
600,000
800,000
1,000,000
1,200,000
2011/12 2012/13 2013/14 2014/15 2015/16 2016/17 2017/18
International Visitors
FNQROC Cairns Cassowary Coast Douglas
Mareeba Tablelands Remaining councils
-
500,000
1,000,000
1,500,000
2,000,000
2,500,000
2011/12 2012/13 2013/14 2014/15 2015/16 2016/17 2017/18
Domestic Overnight Visitors
FNQROC Cairns Cassowary Coast
Douglas Tablelands Remaining councils
- 5
10 15 20 25 30 35 40
2011/12 2012/13 2013/14 2014/15 2015/16 2016/17 2017/18
International Visitor average stay
FNQROC Cairns Cassowary Coast Douglas
Mareeba Tablelands Remaining councils
-
1
2
3
4
5
6
2011/12 2012/13 2013/14 2014/15 2015/16 2016/17 2017/18
Domestic Overnight Visitor average stay
FNQROC Cairns Cassowary Coast
Douglas Tablelands Remaining councils

Tourism Routes
43
A time series of domestic daytrips data is only available for Cairns and FNQROC as a whole. Figure 4-11illustrates fluctuations occur over time but are relatively stable over the complete analysis period. There doesappear to be a shift from Cairns to the remaining councils.
Figure 4-11 Domestic daytrips
Local Government Area Profiles
TRA has published Local Government Area Profiles for 6 of FNQROC’s 13 members (Cairns, CassowaryCoast, Cook, Douglas, Mareeba, Tablelands). The findings are presented for the 2014-2017 four-year average.
The analysis shows the weighted average night stay is 5.1 days, with each visitor spending $196. Domesticdaytrips spend $113 per trip. The weighted average spend per day/night is $185.
Table 4-2 Weighted average values
Weighted average International Domestic OvernightInternational/domestic
overnightDomestic Daytrip
Average stay (nights) 6.6 4.3 5.1 -
Average spend per night $160 $225 $196 -
Average spend per day trip - - $113
Weighted average per day/night $185
There is however significant variability between the Councils:
· International visitors generally spend more per trip across FNQROC except for Douglas
· Cairns and Douglas have much higher domestic overnight spends per trip than other councils
· Both international and domestic overnight visitors spend more per night in Cairns and Douglas
· The domestic overnight average stay is largely the same across all councils
· International visitors spend significantly greater time in Mareeba, and are likely to be mainlybackpackers either holidaying or on a working holiday:
- 80% of visitors are on holiday, with 50% of these being singular travellers
- Almost 70% of accommodation is classified as ‘other’ which excludes hotels or similar,commercial camping/caravan parks, home of friends/relatives or backpacker accommodation
-
500,000
1,000,000
1,500,000
2,000,000
2,500,000
3,000,000
2011/12 2012/13 2013/14 2014/15 2015/16 2016/17 2017/18
Domestic Daytrips
FNQROC Cairns Remaining councils

Tourism Routes
44
Table 4-3 Key Local Government statistics39
Statistic Cairns Cassowary Coast Cook Douglas Mareeba Tablelands
International
Domestic
Overnight
Domestic
Daytrip
International
Domestic
Overnight
Domestic
Daytrip
International
Domestic
Overnight
Domestic
Daytrip
International
Domestic
Overnight
Domestic
Daytrip
International
Domestic
Overnight
Domestic
Daytrip
International
Domestic
Overnight
Domestic
Daytrip
Visitors ('000) 778 1,040 937 48 195 303 6 98 np 101 308 288 11 96 240 16 140 433
Nights ('000) 4,816 4,566 - 383 639 - 95 398 - 585 1,640 - 303 300 - 174 489 -
Average stay (nights) 6.2 4.4 - 7.9 3.3 - 14.8 4.0 - 5.8 5.3 - 26.9 3.1 - 11.2 3.5 -
Spend ($m) $860 $1,175 $145 $29 $77 $21 $7 $47 np $92 $426 $27 $15 $36 $23 $14 $46 $34
Average spend per trip ($) $1,105 $1,130 $155 $608 $397 $68 $1,173 $481 np $912 $1,383 $95 $1,310 $374 $95 $899 $326 $79
Average spend per night ($) $179 $257 - $77 $121 $0 $79 $119 - $157 $260 $0 $49 $119 - $80 $94 -
39 Data may not sum totals or calculate averages due to rounding.
$0
$200
$400
$600
$800
$1,000
$1,200
$1,400
$1,600
Cairns CassowaryCoast
Cook Douglas Mareeba Tablelands Weightedaverage
Average spend per trip ($)
International Domestic Overnight
Domestic Day International/domestic overnight
$0
$50
$100
$150
$200
$250
$300
Cairns CassowaryCoast
Cook Douglas Mareeba Tablelands Weightedaverage
Average spend per night ($)
International Domestic Overnight
International/domestic overnight
0.0
5.0
10.0
15.0
20.0
25.0
30.0
Cairns CassowaryCoast
Cook Douglas Mareeba Tablelands Weightedaverage
Average stay (nights)
International Domestic Overnight
International/domestic overnight

Tourism Routes
45
Gulf-Savannah Tourism Survey
Gulf Savannah Development’s 2017 analysis40 seeks to understand the role of tourism specifically within theGulf Savannah Region. The Gulf Savannah Development area includes Burke, Doomadgee, Mornington,Carpentaria, Croydon and Etheridge Shire Councils. The analysis overlays a range of existing data sources witha visitor survey.
According to the Report, the total value of tourism to the Gulf Savannah region was $69.8 million in 2017. It wasalso estimated in this report that the average expenditure per person per day had increased in 2017 to $94.02,previously $79.11 in 2012. The average length of stay is 13.98 days, up from 11.5 days in 2012. The Reportalso notes:
· Domestic visitors stay an average length of stay of 12.3 nights in Croydon–Etheridge and 13.18 inCarpentaria
· International visitors stay an average length of stay of 14.21 in Croydon-Etheridge and 15.32 inCarpentaria
Table 4-4 Gulf-Savannah tourism survey key findingsStatistic Result
Average length of stay 13.98 days
Average expenditure $94.02 per person per day
Retiree proportion of trips 50%
State of origin Majority of visitors are from Queensland (63%)
First or return visit: 36% first time, 56% return
Most visited towns · Georgetown (88%)
· Karumba/ Normanton (80%)
· Mount Surprise (66%)
Accommodation type · 69% of visitors stayed in commercial caravan parks and
· 24% of visitors stayed at free-camp sites
Entry & exit points · 38% entered via Cairns/Mt Garnet/Mt Surprise along the Gulf Developmental Road
· 34% entered via Burke & Wills Roadhouse
· 38% departed through the Mt Surprise/Mt Garnet/Cairns
· 15% departed through Burke & Wills Roadhouse
Primary mode of transport · 96.72% travelling with 4WDs
· 50.82% travelling with caravans;
· 9.84% travelling with campervans
Table 4-5 Towns visited
Burketow
n
Croydon
Doom
adgee
Einasleigh
Forsayth
Georgetow
n
Gregory
Karum
ba
Mt Surprise
Norm
anton
54% 62% 3% 32% 41% 88% 52% 80% 66% 77%
40 Gulf Savannah Development (2018), Tourism Survey Report.

Tourism Routes
46
Unpublished data sourced from TRA
The reliability of TRA information is correlated to the size of the dataset i.e. the smaller the sample, the lowerthe reliability as a predictive value. Any interpretations of small sample sizes are treated with caution and areusually not published by the TRA. The reliability however can be increased by aggregating small samples into alarger dataset. While reliability is improved, it comes at the expense of ‘drilling down’ into smaller geographies.
TRA have provided unpublished data for the larger local governments across FNQROC, albeit with the samesample size problems. With this in mind, councils expected to have similar characteristics have been combinedto increase the reliability. Even with groupings, there are still occasional increased sample size still being toosmall to be reliable (denoted as ‘np’). The groupings are:
· Cairns and Douglas
· Cassowary Coast, Tablelands, Cook and Mareeba
· Carpentaria, Etheridge and Croydon
A key advantage of the TRA dataset is that it isolates transport modes, notably self-drive vehicles. This assistsin the understanding of the potential vehicle movements on each tourist route.
Table 4-6 Visitors (annual average 2014-2017)
Visitors (000) Cairns/ Douglas
Cassowary Coast/Tablelands/ Cook/
Mareeba Carpentaria/
Etheridge/ Croydon Tropical North
Queensland
Aircraft 1,357 70 np 1,502
Self drive vehicle 1,808 1,466 114 3,357
Bus/Coach 39 np np 53
Other - Not stated/not asked 258 42 9 306
Total Transport 3,314 1,583 131 5,020
Hotel/resort/motel or motor Inn 1,269 119 22 1,390
Rented house/apartment/flat or unit 162 25 np 189
Caravan park/ commercial camping ground 79 104 22 186
Guest house or B&B- Hostel -Othercommercial accommodation
221 34 np 255
Total Commercial Accommodation 1,688 275 43 1,936
Friends or relatives property 316 145 np 478
Caravan or camping non-commercial 37 112 18 174
Own property - Other Privateaccommodation
67 25 np 124
Sub-Total Private Accommodation 418 279 29 763
Other - Not Stated/Not Asked 1,243 1,047 61 2,408
Total Accommodation 3,314 1,583 131 5,020
Holiday 2,165 889 88 3,071
Visiting friends and relatives 478 407 np 894
Sub-Total Leisure 2,632 1,292 93 3,944
Business - Other - Not stated/not asked 694 292 40 1,096
Total Stopover Reason 3,314 1,583 131 5,020
Note: Data may not add to totals due to rounding, missing data and/or averaging

Tourism Routes
47
Table 4-7 Overnights (annual average 2014-2017)Overnights (000)
Cairns/ Douglas
Cassowary Coast/Tablelands/ Cook/
MareebaCarpentaria/
Etheridge/ Croydon Tropical North
Queensland
Aircraft 7,068 632 np 8,192
Self drive vehicle 2,957 1,617 301 5,081
Bus/Coach 119 np np 152
Other - Not stated/not asked 1,463 508 67 2,158
Total Transport 11,606 2,781 424 15,583
Hotel/resort/motel or motor Inn 5,002 314 55 5,439
Rented house/apartment/flat or unit 1,761 351 np 2,149
Caravan park or commercial campingground
417 493 108 1,104
Guest house or B&B- Hostel -Othercommercial accommodation
1,474 331 np 1,907
Sub-total Commercial Accommodation 8,654 1,489 196 10,599
Friends or relatives property 2,005 650 np 2,783
Caravan or camping - non commercial 134 326 73 653
Own property - Other PrivateAccommodation
638 202 np 1,110
Sub-Total Private Accommodation 2,777 1,178 161 4,545
Other Accommodation - Not Stated/NotAsked
175 114 67 439
Total Accommodation 11,606 2,781 424 15,583
Holiday 8,205 1,761 261 10,538
Visiting friends and relatives 1,742 510 np 2,319
Sub-Total Leisure 9,947 2,271 282 12,856
Business - Other - Not stated/not asked 1,659 510 142 2,727
Total Stopover Reason 11,606 2,781 424 15,583
Note: Data may not add to totals due to rounding, missing data and/or averaging
Table 4-8 Average stay (annual average 2014-2017)Average Stay (nights)
Cairns/ Douglas
Cassowary Coast/Tablelands/ Cook/
Mareeba Carpentaria/
Etheridge/ Croydon Tropical North
Queensland
Aircraft 5 9 np 5
Self drive vehicle 2 1 3 2
Bus/Coach 3 np np 3
Other - Not stated/not asked 6 12 8 7
Average Transport 4 2 3 3
Hotel/resort/motel or motor Inn 4 3 3 4
Rented house/apartment/flat or unit 11 14 np 11
Caravan park or commercial campingground
5 5 5 6

Tourism Routes
48
Average Stay (nights)
Cairns/ Douglas
Cassowary Coast/Tablelands/ Cook/
Mareeba Carpentaria/
Etheridge/ Croydon Tropical North
Queensland
Guest house or B&B- Hostel -Othercommercial accommodation
7 10 np 7
Average Commercial Accommodation 5 5 5 5
Friends or relatives property 6 4 np 6
Caravan or camping - non commercial 4 3 4 4
Own property - Other PrivateAccommodation
9 8 np 9
Sub-Total Private Accommodation 7 4 6 6
Other Accommodation - Not Stated/NotAsked
- - 1 -
Average Accommodation 4 2 3 3
Holiday 4 2 3 3
Visiting friends and relatives 4 1 np 3
Average Leisure 4 2 3 3
Business - Other - Not stated/not asked 2 2 4 2
Average Stopover Reason 4 2 3 3
Table 4-9 Expenditure (annual average 2014-2017)Expenditure ($M)
Cairns/ Douglas
Cassowary Coast/Tablelands/ Cook/
Mareeba Carpentaria/
Etheridge/ Croydon Tropical North
Queensland
Aircraft 1,632 52 np 1,749
Self drive vehicle 656 254 31 966
Bus/Coach 22 np np 26
Other - Not stated/not asked 414 47 5 494
Total Transport 2,724 355 41 3,234
Hotel/resort/motel or motor Inn 1,560 69 8 1,654
Rented house/apartment/flat or unit 303 28 np 334
Caravan park or commercial campingground
61 53 13 140
Guest house or B&B- Hostel -Othercommercial accommodation
194 24 np 235
Sub-total Commercial Accommodation 2,118 174 22 2,363
Friends or relatives property 217 39 np 265
Caravan or camping - non commercial 17 28 5 58
Own property - Other PrivateAccommodation
77 11 np 112
Sub-Total Private Accommodation 311 77 9 435
Other Accommodation - Not Stated/NotAsked
295 104 10 436

Tourism Routes
49
Expenditure ($M)
Cairns/ Douglas
Cassowary Coast/Tablelands/ Cook/
Mareeba Carpentaria/
Etheridge/ Croydon Tropical North
Queensland
Total Accommodation 2,724 355 41 3,234
Holiday 2,032 233 29 2,342
Visiting friends and relatives 228 44 np 277
Sub-Total Leisure 2,260 276 31 2,619
Business - Other - Not stated/not asked 464 79 10 615
Total Stopover Reason 2,724 355 41 3,234
Note: Data may not add to totals due to rounding, missing data and/or averaging
Table 4-10 Spend per tripSpend per trip ($)
Cairns/ Douglas
Cassowary Coast/Tablelands/ Cook/
Mareeba Carpentaria/
Etheridge/ Croydon Tropical North
Queensland
Aircraft 1,203 738 np 1,164
Self drive vehicle 363 173 272 288
Bus/Coach 575 np np 494
Other - Not stated/not asked 1,603 1,131 592 1,612
Average Transport 822 225 310 644
Hotel/resort/motel or motor Inn 1,230 581 363 1,190
Rented house/apartment/flat or unit 1,869 1,103 np 1,765
Caravan park or commercial campingground
773 507 567 753
Guest house or B&B- Hostel -Othercommercial accommodation
877 695 np 922
Average Commercial Accommodation 1,255 632 509 1,220
Friends or relatives property 685 268 np 554
Caravan or camping - non commercial 469 247 292 334
Own property - Other PrivateAccommodation
1,143 423 np 907
Average Private Accommodation 745 277 309 570
Other Accommodation - Not Stated/NotAsked
237 99 160 181
Average Accommodation 822 225 310 644
Holiday 939 262 335 763
Visiting friends and relatives 477 107 np 309
Average Leisure 859 214 332 664
Business - Other - Not stated/not asked 669 271 247 562
Average Stopover Reason 822 225 310 644
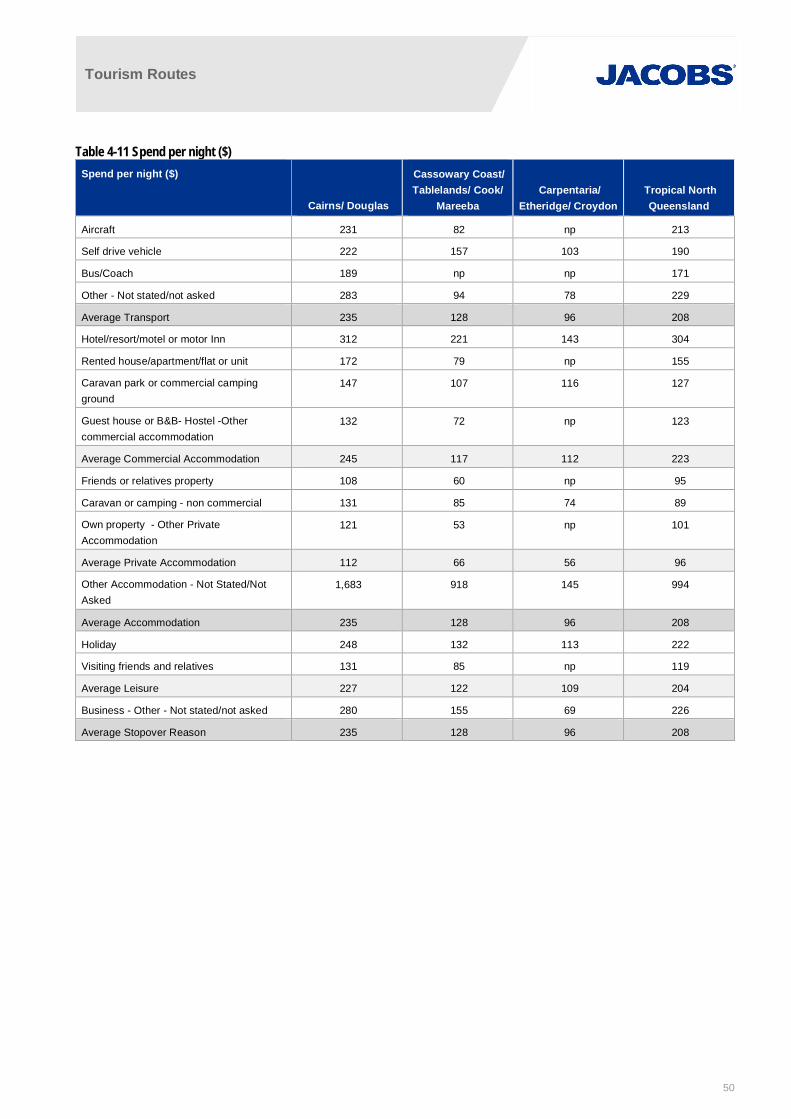
Tourism Routes
50
Table 4-11 Spend per night ($)Spend per night ($)
Cairns/ Douglas
Cassowary Coast/Tablelands/ Cook/
Mareeba Carpentaria/
Etheridge/ Croydon Tropical North
Queensland
Aircraft 231 82 np 213
Self drive vehicle 222 157 103 190
Bus/Coach 189 np np 171
Other - Not stated/not asked 283 94 78 229
Average Transport 235 128 96 208
Hotel/resort/motel or motor Inn 312 221 143 304
Rented house/apartment/flat or unit 172 79 np 155
Caravan park or commercial campingground
147 107 116 127
Guest house or B&B- Hostel -Othercommercial accommodation
132 72 np 123
Average Commercial Accommodation 245 117 112 223
Friends or relatives property 108 60 np 95
Caravan or camping - non commercial 131 85 74 89
Own property - Other PrivateAccommodation
121 53 np 101
Average Private Accommodation 112 66 56 96
Other Accommodation - Not Stated/NotAsked
1,683 918 145 994
Average Accommodation 235 128 96 208
Holiday 248 132 113 222
Visiting friends and relatives 131 85 np 119
Average Leisure 227 122 109 204
Business - Other - Not stated/not asked 280 155 69 226
Average Stopover Reason 235 128 96 208

Tourism Routes
51
5. Travel SurveysUnderstanding how much daily travel consists of self-drive tourists is further informed by various travel surveys:
· Australian Bureau of Statistics’ Survey of Motor Vehicle Use provides estimates of work-related andprivate travel at the state level
· Cairns household travel survey (2014) presents residents’ travel purposes in detail
· Cairns visitor travel survey (2014) presents travel patterns of visitors by purpose and reason
The surveys are useful in assessing travel behaviour within Cairns and its surrounding locations, but becomeless applicable to remote regions.
Survey of Motor Vehicle Use (SMVU)41
The SMVU presents estimates of motor vehicle use in Australia between 1 July 2015 and 30 June 2016,including passenger vehicle use defined within three categories. Table 5-1 shows that work-related tripsaccount for 47% of all passenger vehicle trips within Queensland.
Table 5-1 Australian passenger vehicle useGeography Business To/from work Private
New South Wales 14% 29% 57%
Victoria 22% 26% 52%
Queensland 21% 26% 53%
South Australia 23% 23% 54%
Western Australia 17% 33% 51%
Tasmania 22% 29% 49%
Northern Territory 29% 29% 42%
Australian Capital Territory 12% 27% 61%
Australia 19% 28% 53%
Cairns household travel survey (2014)
The 2014 Cairns Household Travel Survey provides insights into the daily travel behaviour of Cairns residentsincluding how and why they travel, at what time of day certain trips occur, and the average trip distance andduration. Survey results are representative of personal travel by Cairns residents on a typical school termweekday.
Analysis of the survey results42 suggest:
· Cairns households are clearly dominated by vehicle usage
· 36% of vehicle driver trips are for work purposes, either commuting or work-related
· 22% of vehicle driver trips are for accompanying someone and pickup/dropoff, which is likely to orfrom an education facility (24% of passengers are education)
· Another 21% of vehicle driver trips are to buy something or conduct personal business
· 14% of vehicle driver trips are for social or recreational purposes
41 https://www.abs.gov.au/AUSSTATS/[email protected]/Lookup/9208.0Main+Features112%20months%20ended%2030%20June%202016?OpenDocument42 Linkmode trips used as the basis of the analysis.

Tourism Routes
52
Figure 5-1 Household travel mode
Table 5-2 Trip purposeTrip purpose All modes Vehicle driver Vehicle passenger Driver and passenger
Change Mode 0% 0% 0% 0%
Accompany Someone 6% 1% 19% 6%
Buy Something 14% 16% 11% 14%
Pickup/DeliverSomething 3% 4% 2% 3%
Pickup/DropoffSomeone 16% 21% 10% 18%
Education 9% 1% 24% 8%
Work Related 7% 10% 2% 7%
Direct Work Commute 19% 26% 5% 20%
Personal Business 7% 5% 5% 5%
Social 10% 9% 12% 10%
Recreational 8% 5% 7% 6%
Other Purpose 1% 1% 2% 1%
To Buy Petrol 1% 1% 1% 1%
A comparison of Cairns’ household travel to other regional locations across Queensland suggests a similarpattern. The Cairns percentages differ slightly from the above analysis because of an alternative andundisclosed methodology used within the Qld Department of Transport and Main Roads reports. Thealternative percentages are presented in Table 5-3 to be consistent with the other locations.
0.0% 10.0% 20.0% 30.0% 40.0% 50.0% 60.0% 70.0%
Other Bus
Other
Taxi
Plane
Motorcycle
Public Bus
School Bus
Bicycle
Walking
Vehicle Passenger
Vehicle Driver
Travel mode

Tourism Routes
53
Table 5-3 Summary of Household Travel Survey (by region)43,44
Region Cairns BundabergRural
Gympie Gayndah Kingaroy Tin CanBay –
Cooloola
Gladstone MackayRural
Isaac Whitsunday
Private vehicle(driver)
58% 61.1% 65.1% 59.0% 64.4% 57.9% 58.4% 68.8% 63.7% 63.0%
Private vehicle(passenger)
28% 27.2% 23.6% 12.4% 22.1% 22.8% 25.0% 19.5% 21.6% 20.5%
Work 25% 24% 25% 25% 28% 13% 25% 28% 33% 30%
Education 11% 10% 11% 14% 12% 13% 11% 14% 12% 11%
Shopping/personal
39% 29% 32% 33% 30% 42% 29% 27% 22% 25%
Accompanyingsomeone
7% 23% 17% 12% 15% 8% 15% 18% 14% 16%
Social/recreation 17% 14% 13% 13% 15% 17% 19% 11% 17% 16%
Analysis of the survey results shows social/recreation trips further defined within Figure 5-2. Domestic daytripsare more aligned with the categories of eat/drink and other recreational, with car trips being 34% and 24%respectively.
Figure 5-2 Social/recreational trip purpose
In terms of total trips, an estimated 8.4% of all trips have the potential to be domestic daytrips. For all non-workrelated trips, this increases to 13.1%.
43 Queensland Department of Transport and Main Roads (n.d.), How Queensland Travels, Queensland Government.https://www.tmr.qld.gov.au/Community-and-environment/Research-and-education/Queensland-Travel-Survey
44 Queensland Department of Transport and Main Roads (n.d.), Household Travel in Cairns, Queensland Government.https://publications.qld.gov.au/dataset/queensland-travel-survey/resource/128fd4ac-52f1-458c-894a-9fb5f2edf5f9
0% 5% 10% 15% 20% 25% 30% 35% 40%
Social (NEC)
Ate or drank
Visited someone
Socialised (Pubs, Clubs etc)
Watched sport
Watched concert, movies etc
Recreational (NEC)
Participated in sport
Participated in concert,musical,band etc
Other recreational (eg. exercise)
Social/recreational trip purpose
Driver and Passenger Vehicle Passenger Vehicle Driver All modes

Tourism Routes
54
Cairns visitor travel survey (2014)
The Cairns Visitor Travel Survey45 provides initial insights into how tourists travel within Far North Queensland.Naturally the findings are more relevant to Cairns’ immediate environment and surrounding coastal region,particularly with the Great Barrier Reef being a major Australian tourist attraction.
The key findings are:
· Nearly 85% of all visitors are for holiday or leisure activities
· Nearly 40% of holiday trips involve a plane trip, with 25% also involving a private or rental vehicle
· Visiting friends and relatives is dominated equally by plane and private vehicle
Figure 5-3 Visitor main purpose
Looking at vehicle trips (driver or passenger), most trips are conducted within Cairns and its close surroundings:
· 68% of private vehicle trips are southbound compared to 53% of rental vehicle trips
· a higher proportion of northbound trips are rental vehicle trips at 38%, with private vehicle trips being24%
· Rental vehicle trips favour Port Douglas, while private trips tend to travel to the Tablelands/Kurandaarea
.
45 https://data.qld.gov.au/dataset/2014-cairns-region-visitor-travel-survey/resource/f81207ae-a95d-4dbc-a816-b7cfa486c2da
0% 10% 20% 30% 40% 50% 60% 70% 80% 90%
Conference
Something else
Work/business
Visting friends or relatives
Holiday/leisure
Visitor main purpose
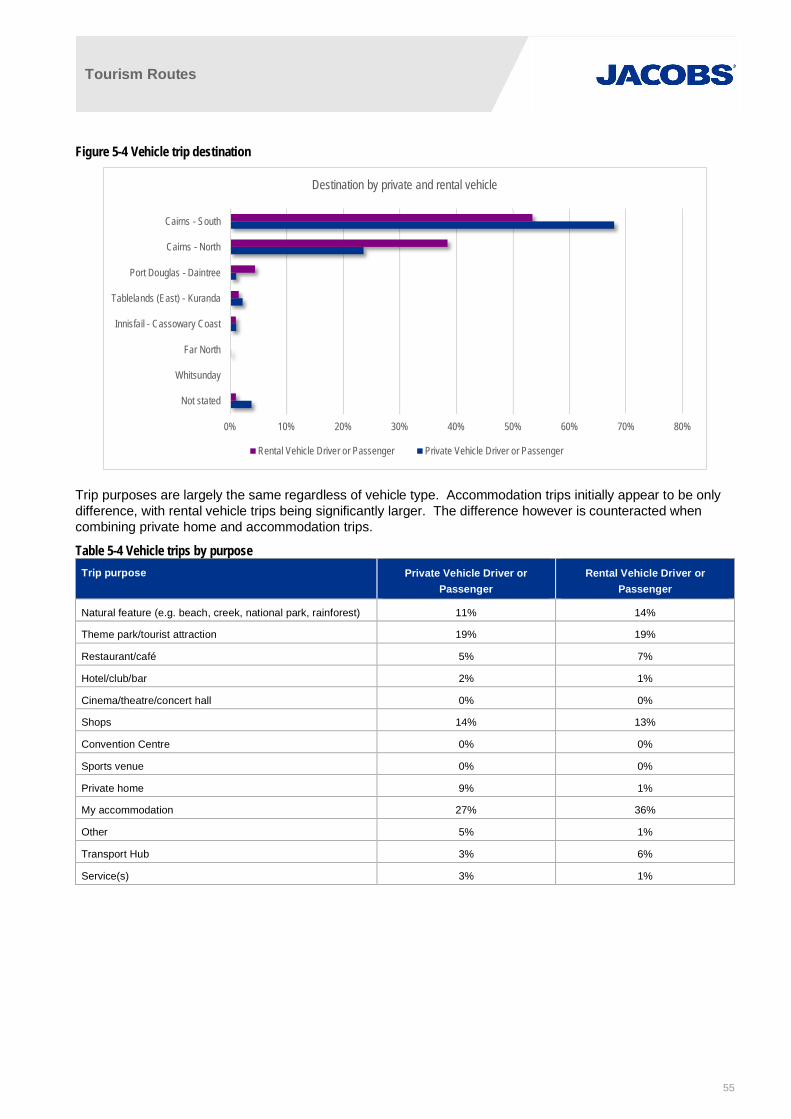
Tourism Routes
55
Figure 5-4 Vehicle trip destination
Trip purposes are largely the same regardless of vehicle type. Accommodation trips initially appear to be onlydifference, with rental vehicle trips being significantly larger. The difference however is counteracted whencombining private home and accommodation trips.
Table 5-4 Vehicle trips by purposeTrip purpose Private Vehicle Driver or
PassengerRental Vehicle Driver or
Passenger
Natural feature (e.g. beach, creek, national park, rainforest) 11% 14%
Theme park/tourist attraction 19% 19%
Restaurant/café 5% 7%
Hotel/club/bar 2% 1%
Cinema/theatre/concert hall 0% 0%
Shops 14% 13%
Convention Centre 0% 0%
Sports venue 0% 0%
Private home 9% 1%
My accommodation 27% 36%
Other 5% 1%
Transport Hub 3% 6%
Service(s) 3% 1%
0% 10% 20% 30% 40% 50% 60% 70% 80%
Not stated
Whitsunday
Far North
Innisfail - Cassowary Coast
Tablelands (East) - Kuranda
Port Douglas - Daintree
Cairns - North
Cairns - South
Destination by private and rental vehicle
Rental Vehicle Driver or Passenger Private Vehicle Driver or Passenger
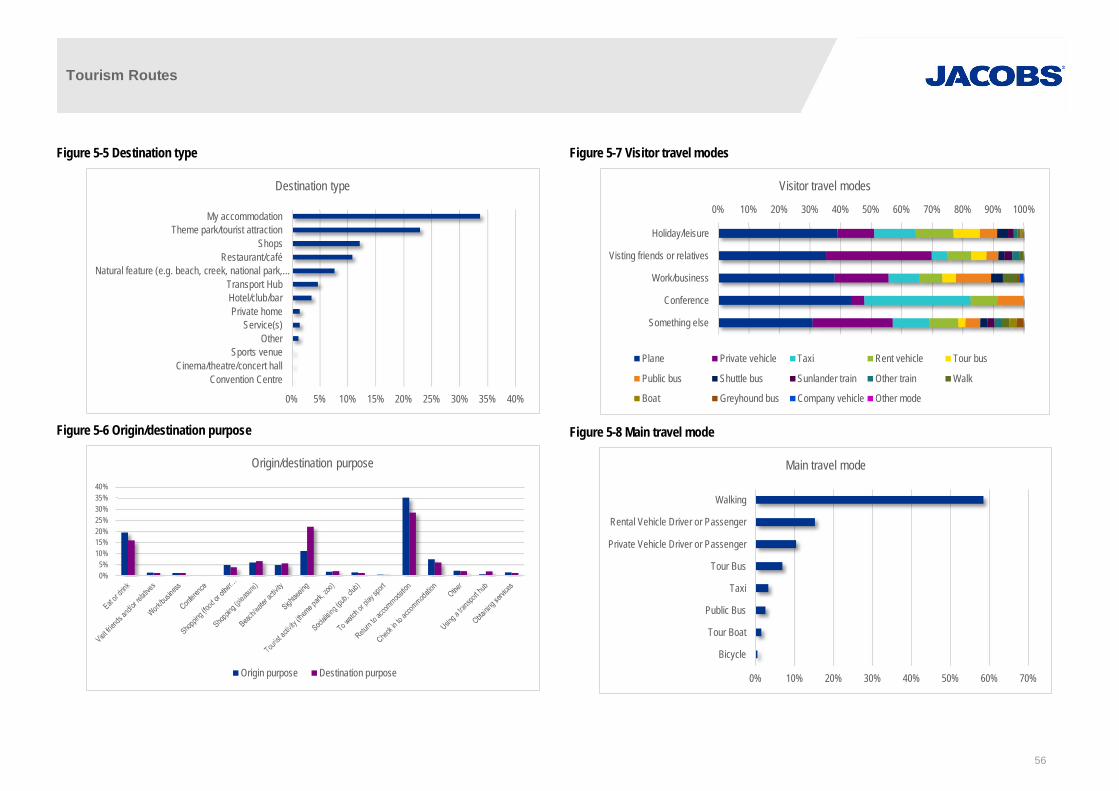
Tourism Routes
56
Figure 5-5 Destination type
Figure 5-6 Origin/destination purpose
Figure 5-7 Visitor travel modes
Figure 5-8 Main travel mode
0% 5% 10% 15% 20% 25% 30% 35% 40%
Convention CentreCinema/theatre/concert hall
Sports venueOther
Service(s)Private home
Hotel/club/barTransport Hub
Natural feature (e.g. beach, creek, national park,…Restaurant/café
ShopsTheme park/tourist attraction
My accommodation
Destination type
0%5%
10%15%20%25%30%35%40%
Origin/destination purpose
Origin purpose Destination purpose
0% 10% 20% 30% 40% 50% 60% 70% 80% 90% 100%
Holiday/leisure
Visting friends or relatives
Work/business
Conference
Something else
Visitor travel modes
Plane Private vehicle Taxi Rent vehicle Tour bus
Public bus Shuttle bus Sunlander train Other train Walk
Boat Greyhound bus Company vehicle Other mode
0% 10% 20% 30% 40% 50% 60% 70%
Bicycle
Tour Boat
Public Bus
Taxi
Tour Bus
Private Vehicle Driver or Passenger
Rental Vehicle Driver or Passenger
Walking
Main travel mode
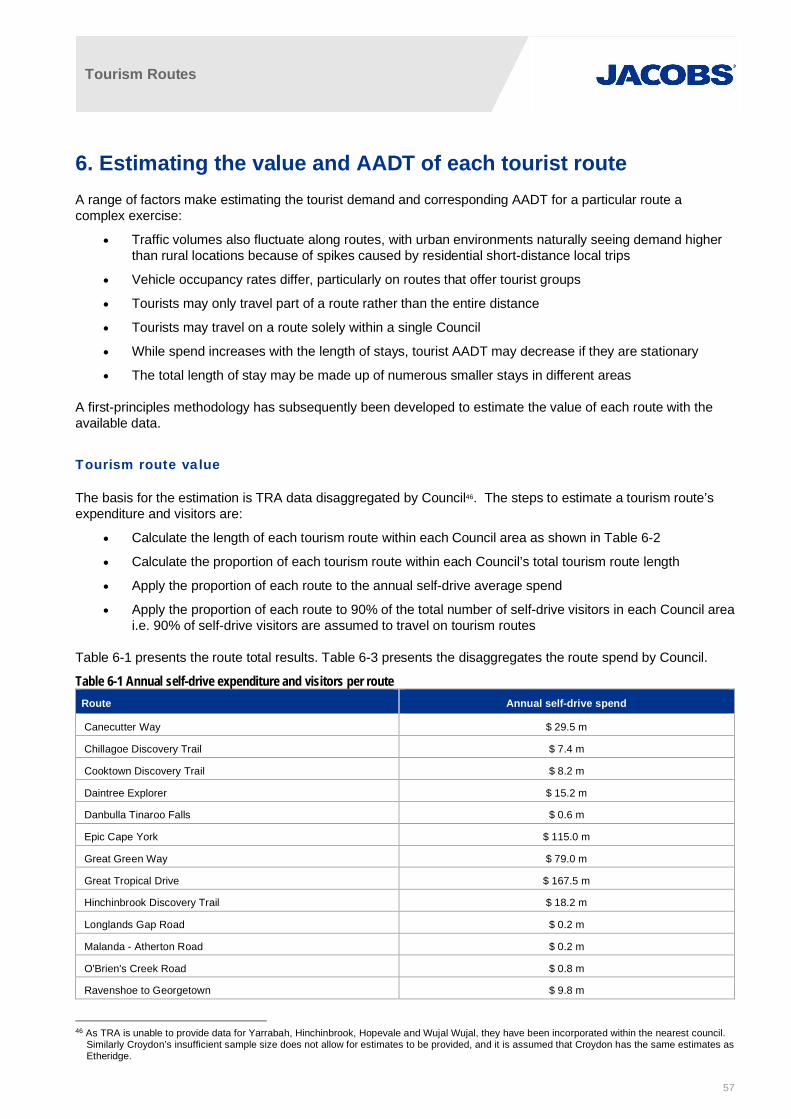
Tourism Routes
57
6. Estimating the value and AADT of each tourist routeA range of factors make estimating the tourist demand and corresponding AADT for a particular route acomplex exercise:
· Traffic volumes also fluctuate along routes, with urban environments naturally seeing demand higherthan rural locations because of spikes caused by residential short-distance local trips
· Vehicle occupancy rates differ, particularly on routes that offer tourist groups
· Tourists may only travel part of a route rather than the entire distance
· Tourists may travel on a route solely within a single Council
· While spend increases with the length of stays, tourist AADT may decrease if they are stationary
· The total length of stay may be made up of numerous smaller stays in different areas
A first-principles methodology has subsequently been developed to estimate the value of each route with theavailable data.
Tourism route value
The basis for the estimation is TRA data disaggregated by Council46. The steps to estimate a tourism route’sexpenditure and visitors are:
· Calculate the length of each tourism route within each Council area as shown in Table 6-2
· Calculate the proportion of each tourism route within each Council’s total tourism route length
· Apply the proportion of each route to the annual self-drive average spend
· Apply the proportion of each route to 90% of the total number of self-drive visitors in each Council areai.e. 90% of self-drive visitors are assumed to travel on tourism routes
Table 6-1 presents the route total results. Table 6-3 presents the disaggregates the route spend by Council.
Table 6-1 Annual self-drive expenditure and visitors per routeRoute Annual self-drive spend
Canecutter Way $ 29.5 m
Chillagoe Discovery Trail $ 7.4 m
Cooktown Discovery Trail $ 8.2 m
Daintree Explorer $ 15.2 m
Danbulla Tinaroo Falls $ 0.6 m
Epic Cape York $ 115.0 m
Great Green Way $ 79.0 m
Great Tropical Drive $ 167.5 m
Hinchinbrook Discovery Trail $ 18.2 m
Longlands Gap Road $ 0.2 m
Malanda - Atherton Road $ 0.2 m
O'Brien's Creek Road $ 0.8 m
Ravenshoe to Georgetown $ 9.8 m
46 As TRA is unable to provide data for Yarrabah, Hinchinbrook, Hopevale and Wujal Wujal, they have been incorporated within the nearest council.Similarly Croydon’s insufficient sample size does not allow for estimates to be provided, and it is assumed that Croydon has the same estimates asEtheridge.

Tourism Routes
58
Route Annual self-drive spend
Reef to Rainforest $ 82.5 m
Savannah Way $ 216.6 m
Tully Falls Road $ 0.4 m
Tully to Mission Beach Discovery $ 13.1 m
Waterfalls Discovery Trail $ 94.5 m
Total $ 858.6 m
Tourist route AADT estimates
The road network facilitates vehicle trips for multiple purposes. Trips can be short local or long-distance, work-related or private, residents or visitors, or combinations of any of those factors. The relativity of trip purposesalso changes readily between locations. The proportions can change dramatically in relatively short distancesdue to the surrounding demographic and industrial land use characteristics.
Tourist route AADT has been estimated as follows:
· Each route has been segmented into varying lengths according to Council area and ownership (Stateor Council)
· The estimated AADT has been applied to each length to calculate the weighted average AADT ofeach route within each Council area
· The number of annual visitors per route are by divided by 365 to estimate daily visitors
· An adjustment factor is applied to allow for uncertainty in individual trip distance (including within andacross council boundaries), vehicle occupancy, length of each stay
· An adjustment factor of 2 is initially applied to represent an occupancy of 2 visitors per vehicle
· The adjustment factor is amended for those routes that exceed an assumed maximum percentage of50% of the total weighted average AADT
- The routes are Epic Cape York in Cook, Cooktown Discovery Trail in Cook, Ravenshoe toGeorgetown in Etheridge, Savannah Way in Carpentaria and Croydon
- These longer routes are likely to entail multiple length of stays and higher vehicle occupancies
· The routes that do not require the adjustment factor to be amended consequently have the sametourist AADT for the three scenarios, and are considered an upper estimate
The estimates are presented in Table 6-2, Table 6-3 and Table 6-4.
The CSIRO has announced a project47 into understanding the routes each type of tourist will take, along with thebenefits of road upgrades to the tourism sector. Originally expected to be completed by mid 2019, the project’sfindings are yet to be announced.
Improving the estimation of each route’s tourism value requires collection of further data with two approaches:
· Vehicle movements across routes can be measured through roadside monitoring by camera orBluetooth loggers, or through wide-scale tracking of mobile phone tower signal pings, in-vehicle GPSdevices and/or GPS data traces obtained from smartphone location-based services, if coverage existsand/or sample size is appropriate. Length of stays in each location can also be estimated via thesedata sources, and provide a reliable sample of the number of occupants per vehicle.
· A survey of self-drive tourists to inform the spend per route. TRA should be consulted in designing thesurvey, ensuring there is consistency with current collection methods.
47 https://blogs.csiro.au/ecos/transit-tourism/

Tourism Routes
59
Table 6-2 Route length by CouncilCouncil Canecutter
WayChillagoeDiscovery
Trail
CooktownDiscovery
Trail
DaintreeExplorer
DanbullaTinaroo
Falls
Epic CapeYork
Great GreenWay
GreatTropical
Drive
HinchinbrookDiscovery
Trail
LonglandsGap Road
Malanda -Atherton
Road
O'Brien'sCreek Road
Ravenshoeto
Georgetown
Reef toRainforest
SavannahWay
Tully FallsRoad
Tully toMissionBeach
Discovery
WaterfallsDiscovery
Trail
Total
Cairns/ Yarrabah 32 - - - - 63 90 190 - - - - - 112 39 - - 130 656
Carpentaria - - - - - - - - - - - - - - 278 - - - 278
CassowaryCoast/Hinchinbrook
105 - - - - - 232 207 244 - - - - - - - 176 49 1,014
Cook/Hopevale - - 274 145 - 1,746 - 145 - - - - - - - - - - 2,311
Croydon - - - - - - - - - - - - - - 121 - - - 121
Douglas/ WujalWujal
- - - 106 - 206 - 140 - - - - - 50 - - - - 503
Etheridge - 44 - - - - - 58 - - - 40 406 - 259 - - - 807
Mareeba - 394 - 130 - 190 - 170 - - - - 39 86 66 - - 54 1,127
Tablelands - 207 - - 49 - - 203 - 16 17 - 110 60 183 39 - 130 1,012
Total 136 645 274 381 49 2,189 323 1,114 244 16 17 40 555 308 947 39 176 362 7,812
Table 6-3 Annual route expenditureCouncil Canecutter
WayChillagoeDiscovery
Trail
CooktownDiscovery
Trail
DaintreeExplorer
DanbullaTinaroo
Falls
Epic CapeYork
Great GreenWay
GreatTropical
Drive
HinchinbrookDiscovery
Trail
LonglandsGap Road
Malanda -Atherton
Road
O'Brien'sCreek Road
Ravenshoeto
Georgetown
Reef toRainforest
SavannahWay
Tully FallsRoad
Tully toMissionBeach
Discovery
WaterfallsDiscovery
Trail
Total
Cairns/ Yarrabah $ 21.7 m - - - - $ 43.0 m $ 61.6 m $ 129.9 m - - - - - $ 76.4 m $ 26.8 m - - $ 88.8 m $ 448.2 m
Carpentaria - - - - - - - - - - - - - - $ 142.2 m - - - $ 142.2 m
CassowaryCoast/Hinchinbrook
$ 7.8 m - - - - - $ 17.3 m $ 15.5 m $ 18.2 m - - - - - - - $ 13.1 m $ 3.7 m $ 75.6 m
Cook/Hopevale - - $ 8.2 m $ 4.3 m - $ 51.6 m - $ 4.3 m - - - - - - - - - - $ 68.4 m
Croydon - - - - - - - - - - - - - - $ 39.6 m - - - $ 39.6 m
Douglas/ WujalWujal
- - - $ 9.5 m - $ 18.5 m - $ 12.6 m - - - - - $ 4.5 m - - - - $ 45.0 m
Etheridge - $ 0.9 m - - - - - $ 1.2 m - - - $ 0.8 m $ 8.2 m - $ 5.2 m - - - $ 16.2 m
Mareeba - $ 4.1 m - $ 1.3 m - $ 2.0 m - $ 1.8 m - - - - $ 0.4 m $ 0.9 m $ 0.7 m - - $ 0.6 m $ 11.7 m
Tablelands - $ 2.4 m - - $ 0.6 m - - $ 2.3 m - $ 0.2 m $ 0.2 m - $ 1.3 m $ 0.7 m $ 2.1 m $ 0.4 m - $ 1.5 m $ 11.7 m
Total $ 29.5 m $ 7.4 m $ 8.2 m $ 15.2 m $ 0.6 m $ 115.0 m $ 79.0 m $ 167.5 m $ 18.2 m $ 0.2 m $ 0.2 m $ 0.8 m $ 9.8 m $ 82.5 m $ 216.6 m $ 0.4 m $ 13.1 m $ 94.5 m $ 858.6 m

Tourism Routes
60
Table 6-4 Estimated tourist AADT
Minimum SCRAADT
CanecutterWay
ChillagoeDiscovery
Trail
CooktownDiscovery
Trail DaintreeExplorer
DanbullaTinaroo Falls
Epic CapeYork
Great GreenWay
GreatTropical
Drive
HinchinbrookDiscovery
Trail LonglandsGap Road
Malanda -Atherton
Road O'Brien's
Creek Road
Ravenshoeto
Georgetown Reef to
Rainforest Savannah
Way Tully Falls
Road
Tully toMissionBeach
Discovery
WaterfallsDiscovery
Trail
Cairns/ Yarrabah 84 - - - - 166 238 503 - - - - - 296 104 - - 344
Carpentaria - - - - - - - - - - - - - - 77 - - -
CassowaryCoast/Hinchinbrook
63 - - - - - 140 125 147 - - - - - - - 106 29
Cook/Hopevale - - 82 44 - 74 - 44 - - - - - - - - - -
Croydon - - - - - - - - - - - - - - 56 - - -
Douglas/ WujalWujal
- - - 86 - 168 - 114 - - - - - 41 - - - -
Etheridge - 5 - - - - - 6 - - - 4 17 - 29 - - -
Mareeba - 21 - 7 - 10 - 9 - - - - 2 5 4 - - 3
Tablelands - 12 - - 3 - - 12 - 1 1 - 7 4 11 2 - 8
Total 147 39 82 137 3 418 378 813 147 1 1 4 25 344 280 2 106 384
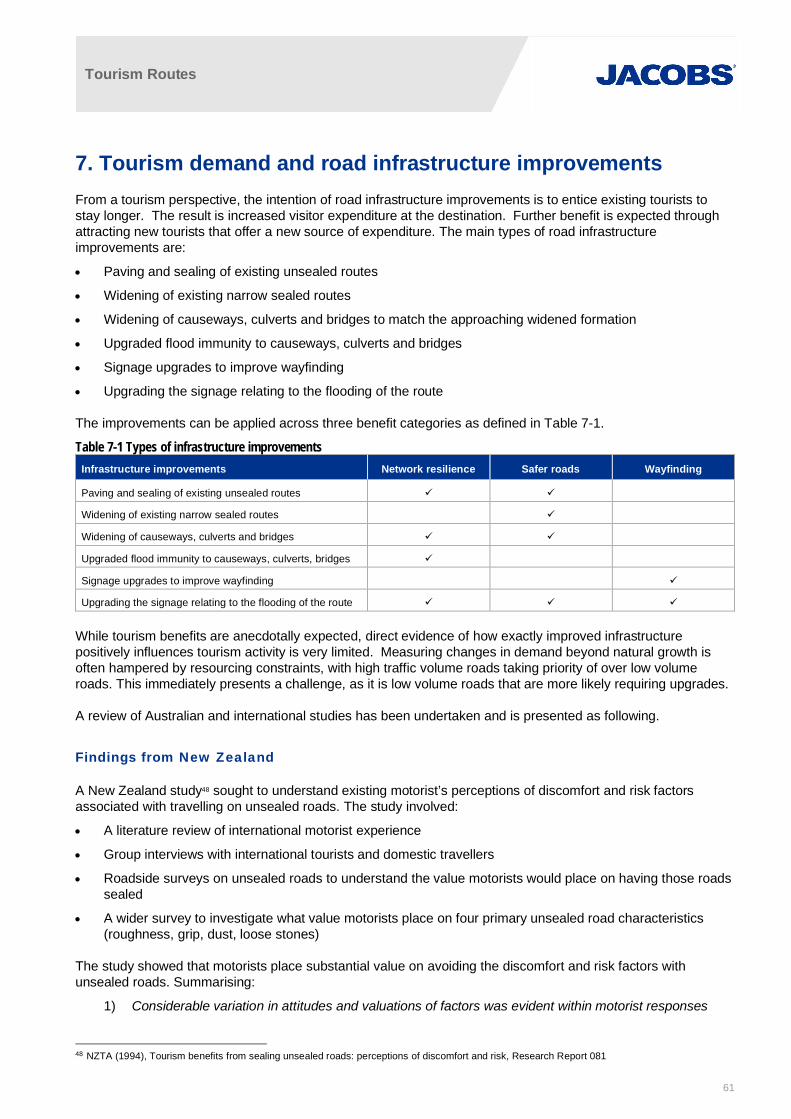
Tourism Routes
61
7. Tourism demand and road infrastructure improvementsFrom a tourism perspective, the intention of road infrastructure improvements is to entice existing tourists tostay longer. The result is increased visitor expenditure at the destination. Further benefit is expected throughattracting new tourists that offer a new source of expenditure. The main types of road infrastructureimprovements are:
· Paving and sealing of existing unsealed routes
· Widening of existing narrow sealed routes
· Widening of causeways, culverts and bridges to match the approaching widened formation
· Upgraded flood immunity to causeways, culverts and bridges
· Signage upgrades to improve wayfinding
· Upgrading the signage relating to the flooding of the route
The improvements can be applied across three benefit categories as defined in Table 7-1.
Table 7-1 Types of infrastructure improvementsInfrastructure improvements Network resilience Safer roads Wayfinding
Paving and sealing of existing unsealed routes ü ü
Widening of existing narrow sealed routes ü
Widening of causeways, culverts and bridges ü ü
Upgraded flood immunity to causeways, culverts, bridges ü
Signage upgrades to improve wayfinding ü
Upgrading the signage relating to the flooding of the route ü ü ü
While tourism benefits are anecdotally expected, direct evidence of how exactly improved infrastructurepositively influences tourism activity is very limited. Measuring changes in demand beyond natural growth isoften hampered by resourcing constraints, with high traffic volume roads taking priority of over low volumeroads. This immediately presents a challenge, as it is low volume roads that are more likely requiring upgrades.
A review of Australian and international studies has been undertaken and is presented as following.
Findings from New Zealand
A New Zealand study48 sought to understand existing motorist’s perceptions of discomfort and risk factorsassociated with travelling on unsealed roads. The study involved:
· A literature review of international motorist experience
· Group interviews with international tourists and domestic travellers
· Roadside surveys on unsealed roads to understand the value motorists would place on having those roadssealed
· A wider survey to investigate what value motorists place on four primary unsealed road characteristics(roughness, grip, dust, loose stones)
The study showed that motorists place substantial value on avoiding the discomfort and risk factors withunsealed roads. Summarising:
1) Considerable variation in attitudes and valuations of factors was evident within motorist responses
48 NZTA (1994), Tourism benefits from sealing unsealed roads: perceptions of discomfort and risk, Research Report 081
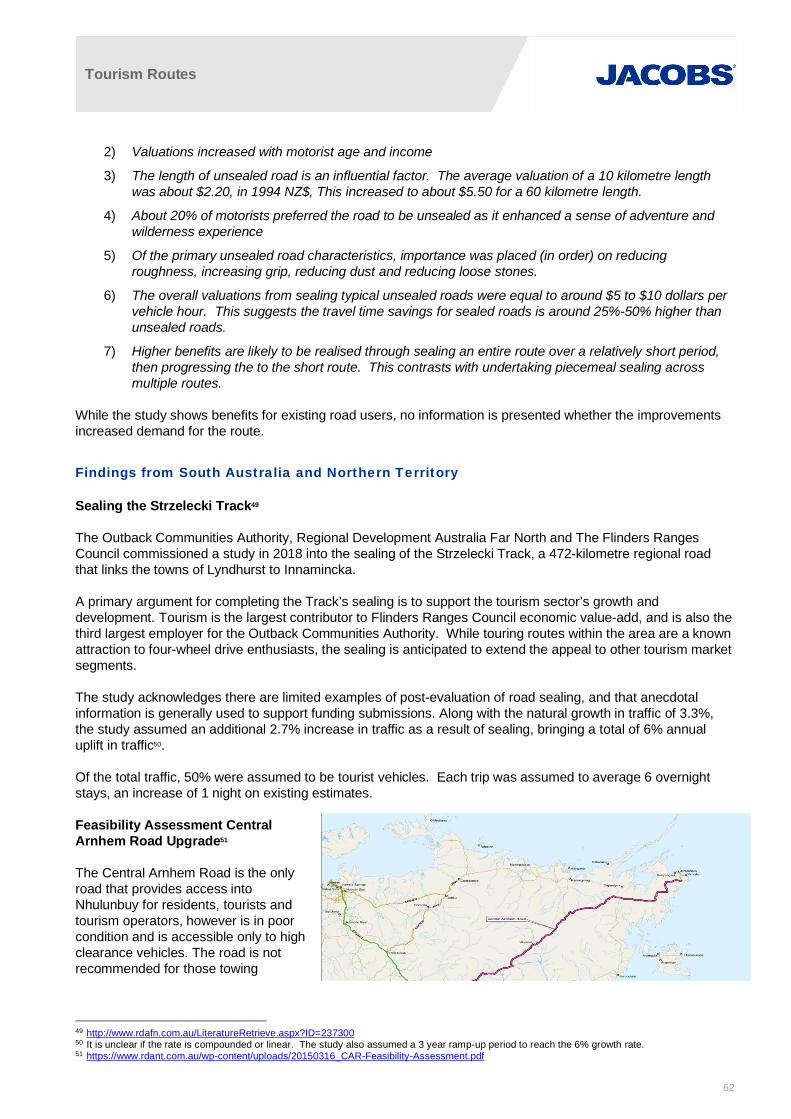
Tourism Routes
62
2) Valuations increased with motorist age and income
3) The length of unsealed road is an influential factor. The average valuation of a 10 kilometre lengthwas about $2.20, in 1994 NZ$, This increased to about $5.50 for a 60 kilometre length.
4) About 20% of motorists preferred the road to be unsealed as it enhanced a sense of adventure andwilderness experience
5) Of the primary unsealed road characteristics, importance was placed (in order) on reducingroughness, increasing grip, reducing dust and reducing loose stones.
6) The overall valuations from sealing typical unsealed roads were equal to around $5 to $10 dollars pervehicle hour. This suggests the travel time savings for sealed roads is around 25%-50% higher thanunsealed roads.
7) Higher benefits are likely to be realised through sealing an entire route over a relatively short period,then progressing the to the short route. This contrasts with undertaking piecemeal sealing acrossmultiple routes.
While the study shows benefits for existing road users, no information is presented whether the improvementsincreased demand for the route.
Findings from South Australia and Northern Territory
Sealing the Strzelecki Track49
The Outback Communities Authority, Regional Development Australia Far North and The Flinders RangesCouncil commissioned a study in 2018 into the sealing of the Strzelecki Track, a 472-kilometre regional roadthat links the towns of Lyndhurst to Innamincka.
A primary argument for completing the Track’s sealing is to support the tourism sector’s growth anddevelopment. Tourism is the largest contributor to Flinders Ranges Council economic value-add, and is also thethird largest employer for the Outback Communities Authority. While touring routes within the area are a knownattraction to four-wheel drive enthusiasts, the sealing is anticipated to extend the appeal to other tourism marketsegments.
The study acknowledges there are limited examples of post-evaluation of road sealing, and that anecdotalinformation is generally used to support funding submissions. Along with the natural growth in traffic of 3.3%,the study assumed an additional 2.7% increase in traffic as a result of sealing, bringing a total of 6% annualuplift in traffic50.
Of the total traffic, 50% were assumed to be tourist vehicles. Each trip was assumed to average 6 overnightstays, an increase of 1 night on existing estimates.
Feasibility Assessment CentralArnhem Road Upgrade51
The Central Arnhem Road is the onlyroad that provides access intoNhulunbuy for residents, tourists andtourism operators, however is in poorcondition and is accessible only to highclearance vehicles. The road is notrecommended for those towing
49 http://www.rdafn.com.au/LiteratureRetrieve.aspx?ID=23730050 It is unclear if the rate is compounded or linear. The study also assumed a 3 year ramp-up period to reach the 6% growth rate.51 https://www.rdant.com.au/wp-content/uploads/20150316_CAR-Feasibility-Assessment.pdf

Tourism Routes
63
caravans and access permits will not be granted to those towing caravans.
Tourism NT has stated that the Central and East Arnhem regions would significantly benefit from increasedtourism visitation to the area, so long as the road is maintained throughout the wet and dry seasons. Improvedroad conditions would promote and stimulate self-drive tourists to visit the region and to encourage repeatvisitation from past visitors keen to see new sights. This would provide an opportunity for tourism operators toestablish new ventures, further stimulating the local economy and driving local employment.
The Feasibility Assessment assumed the proportion of adventure travellers, caravanning/ camping tourists andvisitors to relatives and friends will increase, due to improved access in and around the region. This will reducethe overall proportion of total business travellers and travellers for other purposes.
Table 7-2 Assumed tourist compositionsTourist type Current tourist composition Tourist composition with infrastructure
improvements
Business travellers 70% 60%
Holidays (adventure travellers) 10% 14%
Holiday (caravanners/ campers) 10% 14%
Visiting friends and relatives 5% 7%
Other 5% 5%
No information is provided on how these changing proportions have been developed, or what the overall touristvolumes the changing proportions are applied to.
Findings from Victoria
The Grampians Way Ring Road Scoping Study (2012) presents a range of tourist route case studies, again withanecdotal information rather than formal post-evaluations.
Table 7-3 Findings from VictoriaRoad upgrade Description Costs Change in
Visitation to theRegion
Dispersal ofVisitation toSurroundingTownships/Regions
Change in TrafficVolume
Eildon-JamiesonRoad (VIC)
2010
Sealing of analternative 14 kmroute betweenEildon and Jamieson
$3.4 million data n/a Increase by 40% N/A
Bogong High PlainsRoad (VIC)
2009
Sealing of 31 km tocreate an Alpineloop as well as analternative route toFalls Creek viaOmeo.
$10 million Increase by 88%during off peakseason
5% of visitorsextending theirlength of stay by 1night
N/A 12% between 2008and 2011
Mansfield-Wangaratta Link(VIC)
Date unknown
Sealing and upgradeof 31 km betweenMansfield andWangaratta
N/A 40% between 2001and 2011.
Increase by 88%during off peakseason, with 5% ofvisitors extendingtheir length of stayby 1 night
40% between 2001and 2011
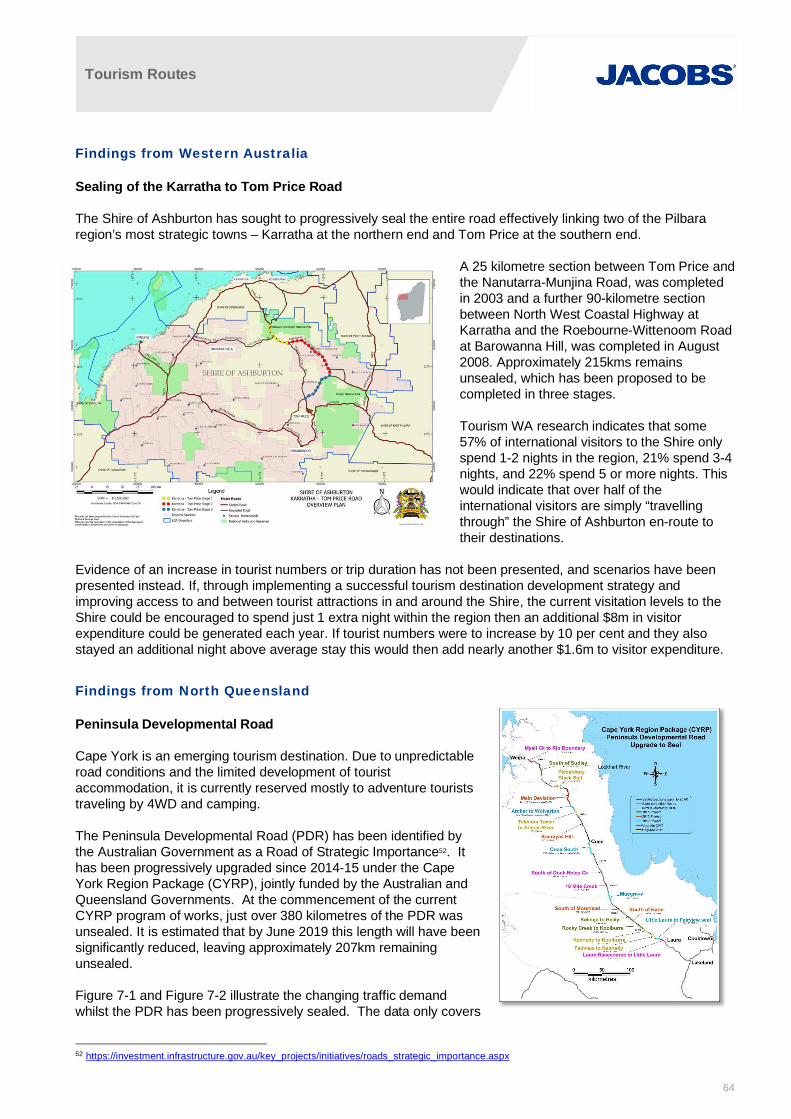
Tourism Routes
64
Findings from Western Australia
Sealing of the Karratha to Tom Price Road
The Shire of Ashburton has sought to progressively seal the entire road effectively linking two of the Pilbararegion’s most strategic towns – Karratha at the northern end and Tom Price at the southern end.
A 25 kilometre section between Tom Price andthe Nanutarra-Munjina Road, was completedin 2003 and a further 90-kilometre sectionbetween North West Coastal Highway atKarratha and the Roebourne-Wittenoom Roadat Barowanna Hill, was completed in August2008. Approximately 215kms remainsunsealed, which has been proposed to becompleted in three stages.
Tourism WA research indicates that some57% of international visitors to the Shire onlyspend 1-2 nights in the region, 21% spend 3-4nights, and 22% spend 5 or more nights. Thiswould indicate that over half of theinternational visitors are simply “travellingthrough” the Shire of Ashburton en-route totheir destinations.
Evidence of an increase in tourist numbers or trip duration has not been presented, and scenarios have beenpresented instead. If, through implementing a successful tourism destination development strategy andimproving access to and between tourist attractions in and around the Shire, the current visitation levels to theShire could be encouraged to spend just 1 extra night within the region then an additional $8m in visitorexpenditure could be generated each year. If tourist numbers were to increase by 10 per cent and they alsostayed an additional night above average stay this would then add nearly another $1.6m to visitor expenditure.
Findings from North Queensland
Peninsula Developmental Road
Cape York is an emerging tourism destination. Due to unpredictableroad conditions and the limited development of touristaccommodation, it is currently reserved mostly to adventure touriststraveling by 4WD and camping.
The Peninsula Developmental Road (PDR) has been identified bythe Australian Government as a Road of Strategic Importance52. Ithas been progressively upgraded since 2014-15 under the CapeYork Region Package (CYRP), jointly funded by the Australian andQueensland Governments. At the commencement of the currentCYRP program of works, just over 380 kilometres of the PDR wasunsealed. It is estimated that by June 2019 this length will have beensignificantly reduced, leaving approximately 207km remainingunsealed.
Figure 7-1 and Figure 7-2 illustrate the changing traffic demandwhilst the PDR has been progressively sealed. The data only covers
52 https://investment.infrastructure.gov.au/key_projects/initiatives/roads_strategic_importance.aspx

Tourism Routes
65
4 years, which is limited in value to forming a reliable understanding of whether increased economic activity andcommunity responses to the PDR’s increased accessibility will take longer.
At this point there appears to an observable increase in traffic only between Laura and Coen. The Coen-Weipasection has decreased, although the counts for 2017 have not been updated from 2016. Passenger vehiclesdecreased by 36% while heavy vehicles decreased by 50%. As road closure information is unavailable, it isunclear if traffic demand has lowered during this period due to an extended wet season.
However, the potential uplift in tourist demand across the entire PDR is restricted whilst road segments remainunsealed.
Figure 7-1 Peninsula Developmental Road (Laura – Coen) AADT and additional sealing
Figure 7-2 Peninsula Developmental Road (Coen - Weipa) AADT and additional sealing
Mulligan Highway
0
10
20
30
40
50
60
70
80
90
100
0.0
50.0
100.0
150.0
200.0
250.0
300.0
350.0
400.0
450.0
2013 2014 2015 2016 2017 2018 2019
Peninsula Dev Road (Laura - Coen)
AADT 0.0 - 138.5 kms AADT 138.5 - 246.5 kms Cumulative new sealed kms
0
10
20
30
40
50
60
70
80
90
0
20
40
60
80
100
120
140
160
2013 2014 2015 2016 2017 2018 2019
Peninsula Dev Road (Coen - Weipa)
AADT 0.0 - 219.5 kms Cumulative new sealed kms
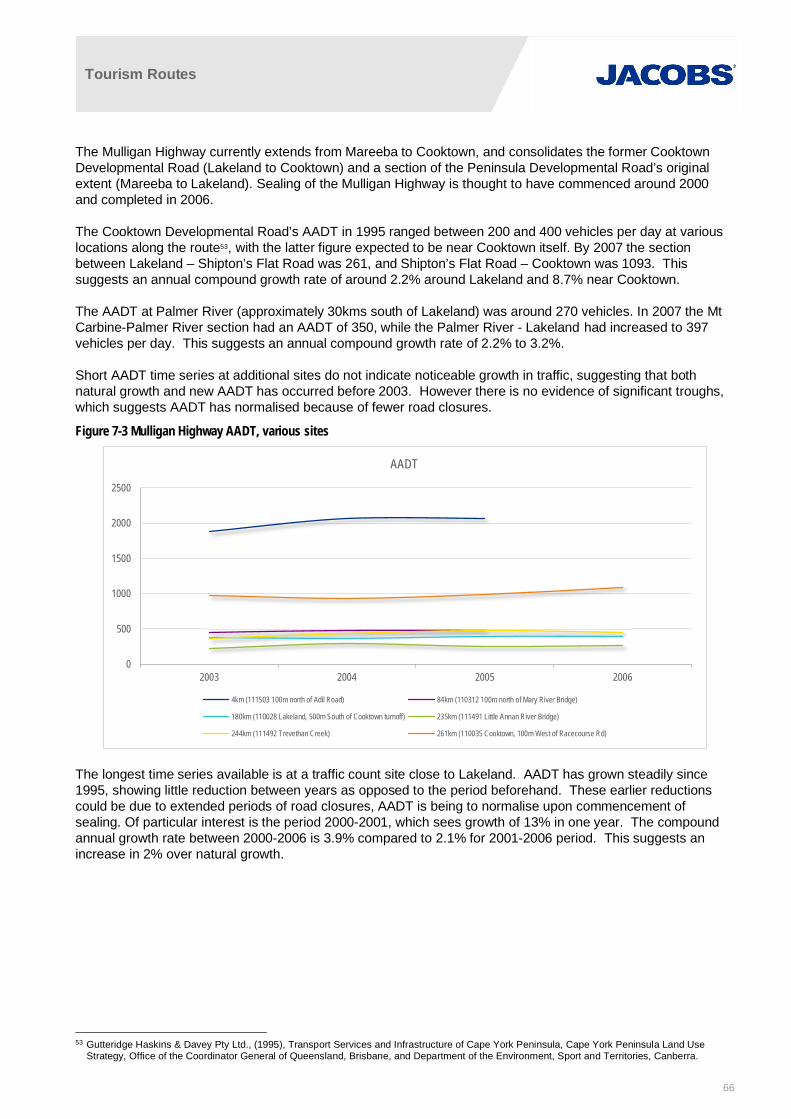
Tourism Routes
66
The Mulligan Highway currently extends from Mareeba to Cooktown, and consolidates the former CooktownDevelopmental Road (Lakeland to Cooktown) and a section of the Peninsula Developmental Road’s originalextent (Mareeba to Lakeland). Sealing of the Mulligan Highway is thought to have commenced around 2000and completed in 2006.
The Cooktown Developmental Road’s AADT in 1995 ranged between 200 and 400 vehicles per day at variouslocations along the route53, with the latter figure expected to be near Cooktown itself. By 2007 the sectionbetween Lakeland – Shipton’s Flat Road was 261, and Shipton’s Flat Road – Cooktown was 1093. Thissuggests an annual compound growth rate of around 2.2% around Lakeland and 8.7% near Cooktown.
The AADT at Palmer River (approximately 30kms south of Lakeland) was around 270 vehicles. In 2007 the MtCarbine-Palmer River section had an AADT of 350, while the Palmer River - Lakeland had increased to 397vehicles per day. This suggests an annual compound growth rate of 2.2% to 3.2%.
Short AADT time series at additional sites do not indicate noticeable growth in traffic, suggesting that bothnatural growth and new AADT has occurred before 2003. However there is no evidence of significant troughs,which suggests AADT has normalised because of fewer road closures.
Figure 7-3 Mulligan Highway AADT, various sites
The longest time series available is at a traffic count site close to Lakeland. AADT has grown steadily since1995, showing little reduction between years as opposed to the period beforehand. These earlier reductionscould be due to extended periods of road closures, AADT is being to normalise upon commencement ofsealing. Of particular interest is the period 2000-2001, which sees growth of 13% in one year. The compoundannual growth rate between 2000-2006 is 3.9% compared to 2.1% for 2001-2006 period. This suggests anincrease in 2% over natural growth.
53 Gutteridge Haskins & Davey Pty Ltd., (1995), Transport Services and Infrastructure of Cape York Peninsula, Cape York Peninsula Land UseStrategy, Office of the Coordinator General of Queensland, Brisbane, and Department of the Environment, Sport and Territories, Canberra.
0
500
1000
1500
2000
2500
2003 2004 2005 2006
AADT
4km (111503 100m north of Adil Road) 84km (110312 100m north of Mary River Bridge)
180km (110028 Lakeland, 500m South of Cooktown turnoff) 235km (111491 Little Annan River Bridge)
244km (111492 Trevethan Creek) 261km (110035 Cooktown, 100m West of Racecourse Rd)

Tourism Routes
67
Figure 7-4 Mulligan Highway AADT AADT and growth rates, Lakeland
Other works
Table 7-4 presents examples of each type of infrastructure improvements (Peninsula Developmental Road isincluded for comparison purposes), with Figure 7-5 to Figure 7-11 illustrating the corresponding AADT demand.The figures also illustrate an assumed natural growth rate of 1%, a conservative estimate to avoid overstatingany growth flowing directly from the improvements.
Table 7-4 Infrastructure improvement locationsInfrastructure improvements
Paving and sealing of existing unsealed routes · Peninsula Dev. Rd (multiple locations since 2006 with 2014 onwardsdelivered as part of Cape York Region Package54)
· Burke Dev. Rd (Chillagoe, ~ 2011)
Widening of existing narrow sealed routes · Kennedy Dev. Rd (Cadell Ck, ~2013)
· Gregory Dev. Rd (south of Kennedy Dev Rd interchange, ~2012)
Widening of causeways, culverts and bridges · Gulf Dev. Rd (Einasleigh River, ~ 2011)
· Kennedy Highway (Innot Hot Springs, ~ 2015)
Upgraded flood immunity to causeways, culverts, bridges · Mareeba, Burke Developmental Road, ~ 2010)
Signage upgrades to improve wayfinding · Mossman-Mt Molloy Rd Int, Mulligan Hwy, constructed ~ 2013
Upgrading the signage relating to the flooding of the route · Bluewater rest area, Bruce Highway, constructed ~2013
The figures suggest that, apart from road sealing, there appears to be little evidence of direct correlationbetween the infrastructure improvements and demand changes.
The sealing of the Burke Developmental Road shows a notable increase of approximately 25% before returningto pre-improvement levels three years later. The Peninsula Developmental Road shows a more dramaticincrease of around 40% just north of Laura before falling to approximately 14% only one year later.
54 https://www.tmr.qld.gov.au/Projects/Name/C/Cape-York-Region-Package-Peninsula-Developmental-Road
-40%
-20%
0%
20%
40%
60%
80%
0
50
100
150
200
250
300
350
400
450
Lakeland, 500m South of Cooktown turnoff (110028)
Lakeland, 500m South of Cooktown turnoff (110028) Annual growth %
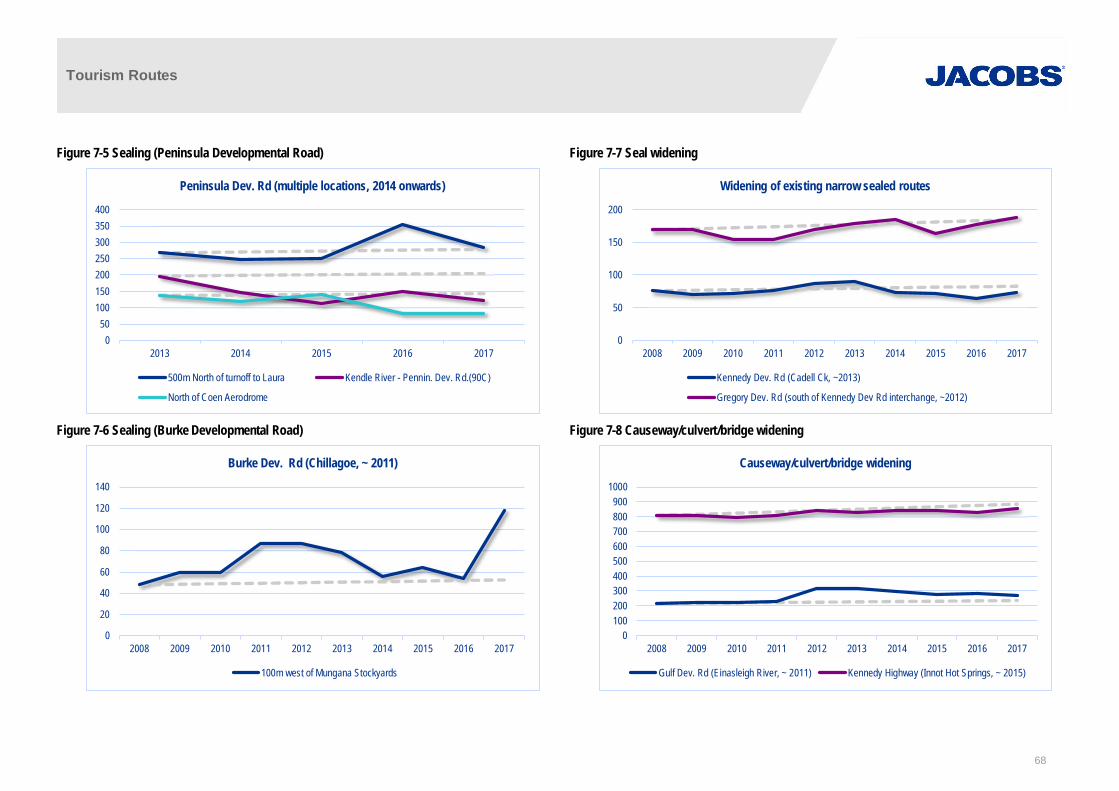
Tourism Routes
68
Figure 7-5 Sealing (Peninsula Developmental Road)
Figure 7-6 Sealing (Burke Developmental Road)
Figure 7-7 Seal widening
Figure 7-8 Causeway/culvert/bridge widening
050
100150200250300350400
2013 2014 2015 2016 2017
Peninsula Dev. Rd (multiple locations, 2014 onwards)
500m North of turnoff to Laura Kendle River - Pennin. Dev. Rd.(90C)
North of Coen Aerodrome
0
20
40
60
80
100
120
140
2008 2009 2010 2011 2012 2013 2014 2015 2016 2017
Burke Dev. Rd (Chillagoe, ~ 2011)
100m west of Mungana Stockyards
0
50
100
150
200
2008 2009 2010 2011 2012 2013 2014 2015 2016 2017
Widening of existing narrow sealed routes
Kennedy Dev. Rd (Cadell Ck, ~2013)
Gregory Dev. Rd (south of Kennedy Dev Rd interchange, ~2012)
0100200300400500600700800900
1000
2008 2009 2010 2011 2012 2013 2014 2015 2016 2017
Causeway/culvert/bridge widening
Gulf Dev. Rd (Einasleigh River, ~ 2011) Kennedy Highway (Innot Hot Springs, ~ 2015)

Tourism Routes
69
Figure 7-9 Wayfinding signage
Figure 7-10 Flooding signage
Figure 7-11 Rest areas/stopping bays
0
2000
4000
6000
8000
10000
12000
14000
2008 2009 2010 2011 2012 2013 2014 2015 2016 2017
Improved wayfinding signage (Mareeba, Burke Dev. Rd, ~ 2010)
100m south of Herberton Street Arriga Coverage site
0
200
400
600
800
1000
1200
2012 2013 2014 2015 2016 2017
Improved flooding signage (Mossman-Mt Molloy Rd Interchange,Mulligan Hwy, ~ 2013)
Mt.Molloy-100m East of Peninsula Dev.Rd. Luster Creek
0
2000
4000
6000
8000
10000
2008 2009 2010 2011 2012 2013 2014 2015 2016 2017
Additional rest areas/stopping bays (Bluewater, Bruce Highway,~2013)
10M Waterview Creek, Ingham 100m Sth Bluewater Creek Bridge
10M WiM Site Leichhardt Creek
Tourism Routes
70
The relationship between infrastructure upgrades and AADT is difficult to define with the available data. Onlyroad sealing appears to have a positive effect based on the analysis of the Mulligan Highway. The MulliganHighway suggests a compound annual growth rate of 2% can be attributed to a completely sealed route. It islikely the PDR will show similar findings with a longer time series of data, particularly as the road gets closer tobeing fully sealed.
Observing the impact of infrastructure upgrades on AADT growth can be improved through more targeted andregular placement of traffic counters. Ideally traffic counts are collected regularly before an upgrade todetermine a road’s natural growth. Regular counts after an upgrade that show notable variation from the naturalgrowth can be attributed to the improved infrastructure.

Tourism Routes
71
8. Unsealed roads and increased tourismThe previous section suggests the demand changes are more evident with road sealing. It stands to reason thatpromoting self-drive tourism can be best facilitated by targeted sealing of routes that does not deter existingadventure 4WD tourists.
Adventure 4WD tourists are expected to be more attracted to natural destinations such as national parks,rainforests or landmarks such as the tip of Cape York. Routes such as the Savannah Way arguably cater totourists travelling between towns as part of a longer journey e.g. retirees travelling around Australia. Sealingroads on these type of routes are therefore anticipated to attract more grey nomads whilst not disincentivisingadventure 4WD tourists.
Figure 8-1 illustrates that Far North Queensland’s state-controlled network contains significant lengths ofunsealed roads. Cape York lengths will however reduce with the continued sealing of the PeninsulaDevelopmental Road.
Figure 8-1 Unsealed SCR
Table 8-1 presents each route’s unsealed length and chainages on the SCR. Unsealed roads on the LRRS arepresented in Table 8-4.

Tourism Routes
72
Table 8-1 Unsealed SCRRoute Road Chainages Total
Chillagoe Discovery Herberton Petford Road 12.4-22.2, 22.9-25.5, 27.4-69.5 54.5
Burke Dev Road (Normanton –Dimbulah)
563.9-579.2, 584.1-585.6,588.3-591.6
20.1
Cooktown Discovery Endeavour Valley Road 21.6-23.7, 24.6-26.1, 26.5-28.3,28.4-29.9, 30.8-31.7, 32.3-33.9
9.4
Peninsula Dev Road (Laura –Coen)
3.1-7.0, 7.4-11.6, 12.3-16.8,19.6-30.4, 31.7-33.1, 36.1-47.3,59.8-67.1, 85-100, 110-138.2,
138.7-147, 147.4-149.5, 154.4-154.5, 154.8-155.7, 158.6-
197.7, 202.6-215, 222.6-244.7
171.5
Epic Cape York Peninsula Dev Road (Coen toWeipa)
22-33.3, 37.8-47.5, 47.7-47.9,51.5-65.2, 65.4-79.2, 83.9-112.5, 117.8-149.4, 154.4-
173.4, 194.1-219.53
153.33
Gregory Developmental Road 0.3-24.1, 24.3-75.4 74.9
Ravenshoe – Georgetown Forsayth Road 11.7-25.2 13.5
Table 8-2 LRRS unsealed roads
LGA Road Name
Start
(km)
End
(km)
Length
(km) Start End Surface Type
Unsealed
Length
(Km)
Sealed
Length
(Km)
Unsealed
% of total
length
Yarrabah
Aboriginal
Shire
Back Beach
Road
0 14.5 14.5 Pine Creek Road YASC Boundary Sealed/unsealed 8.5 6 59%
Mareeba
Shire
Black
Mountain
Road
0 48.18 48.18 Kennedy Highway Euluma Creek Road Sealed/unsealed 46.89 1.29 97%
Cook Shire Bloomfield
Road
0 38.8 38.8 Cooktown Development
Road
Wujal Wujal Boundary Sealed/unsealed 26.2 12.6 68%
Croydon
Shire
Croydon-
Richmond
Road
0 217.11 217.11 Gulf Developmental Road
(92B)
Richmond/Croydon
Boundary
Sealed/unsealed 140.353 76.759 65%
Tablelands
Region
Danbulla
Forest Drive
0 26.08 26.08 Tinaroo Falls Dam Road Boar Pocket Road Sealed/unsealed 22.29 3.79 85%
Etheridge
Shire
Forsayth -
Einasleigh
Road
0 68.1 68.1 Gregory Developmental
Road (9
Forsayth Road (6704) Sealed/unsealed 34 34.1 50%
Tablelands
Region
Gunnawarra
Road
0 52 52 Kennedy Highway Cashmere/ Wairuna
Intersection
Sealed/unsealed 30.01 21.99 58%
Mareeba
Shire
Henry
Hannam
Drive
0 11.88 11.88 Kennedy Highway Cobra Road & Emerald
Falls Ro
Sealed/unsealed 10.54 1.34 89%

Tourism Routes
73
LGA Road Name
Start
(km)
End
(km)
Length
(km) Start End Surface Type
Unsealed
Length
(Km)
Sealed
Length
(Km)
Unsealed
% of total
length
Cassowary
Coast Region
Kirrama
Range Road
0 18.8 18.8 Kennedy Creek Road Tablelands/Cassowary
Coast B
Sealed/unsealed 13.93 4.87 74%
Croydon
Shire
Nelia Bundah
Road
175 189 14 Croydon/McKinlay
Boundary
Croydon - Richmond
Road
Sealed/unsealed 12.3 1.7 88%
Etheridge
Shire
North Head
Road
0 25.57 25.57 Forsayth Road Agate Creek Road Sealed/unsealed 22.58 2.99 88%
Mareeba
Shire
Pickford Road 0 5.33 5.33 Peninsula.Developmental
Road
Mareeba Wetlands Sealed/unsealed 4.57 0.76 86%
Tablelands
Region
Silver Valley
Road
0 38.8 38.8 Kennedy Highway Herberton-Petford Road sealed/unsealed 32.5 6.3 84%
Tablelands
Region
Tully Falls
Road
0 37.25 37.25 Kennedy Highway Koombooloomba Dam Sealed/unsealed 15.04 22.21 40%
Etheridge
Shire
Agate Creek
Road
0 11.9 11.9 North Head Road Cobbold Gorge Road Unsealed 11.9 0 100%
Cook Shire Battlecamp
Road
0 75.7 75.7 McIvor Road Lakefield National Park
Road
Unsealed 75.7 0 100%
Douglas Shire Cape
Tribulation to
Bloomfield
Road
0 31 31 Cape Tribulation North Bank of
Bloomfield River
Unsealed 31 0 100%
Tablelands
Region
Cashmere-
Kirrama
Road
0 70.6 70.6 Gunnawarra, Wairuna Rd
inters
Gunnawarra, Wairuna
Rd inters
Unsealed 70.6 0 100%
Wujal Wujal
Aboriginal
Shire
China Camp
Road
0 1.9 1.9 Cape Tribulation to
Bloomfield R
WWASC Boundary unsealed 1.9 0 100%
Yarrabah
Aboriginal
Shire
Back Beach
Road
0 14.5 14.5 Pine Creek Road YASC Boundary Sealed/unsealed 8.5 6 59%
Mareeba
Shire
Black
Mountain
Road
0 48.18 48.18 Kennedy Highway Euluma Creek Road Sealed/unsealed 46.89 1.29 97%
Cook Shire Bloomfield
Road
0 38.8 38.8 Cooktown Development
Road
Wujal Wujal Boundary Sealed/unsealed 26.2 12.6 68%
Croydon
Shire
Croydon-
Richmond
Road
0 217.11 217.11 Gulf Developmental Road
(92B)
Richmond/Croydon
Boundary
Sealed/unsealed 140.353 76.759 65%
Tablelands
Region
Danbulla
Forest Drive
0 26.08 26.08 Tinaroo Falls Dam Road Boar Pocket Road Sealed/unsealed 22.29 3.79 85%
Etheridge
Shire
Forsayth -
Einasleigh
Road
0 68.1 68.1 Gregory Developmental
Road (9
Forsayth Road (6704) Sealed/unsealed 34 34.1 50%
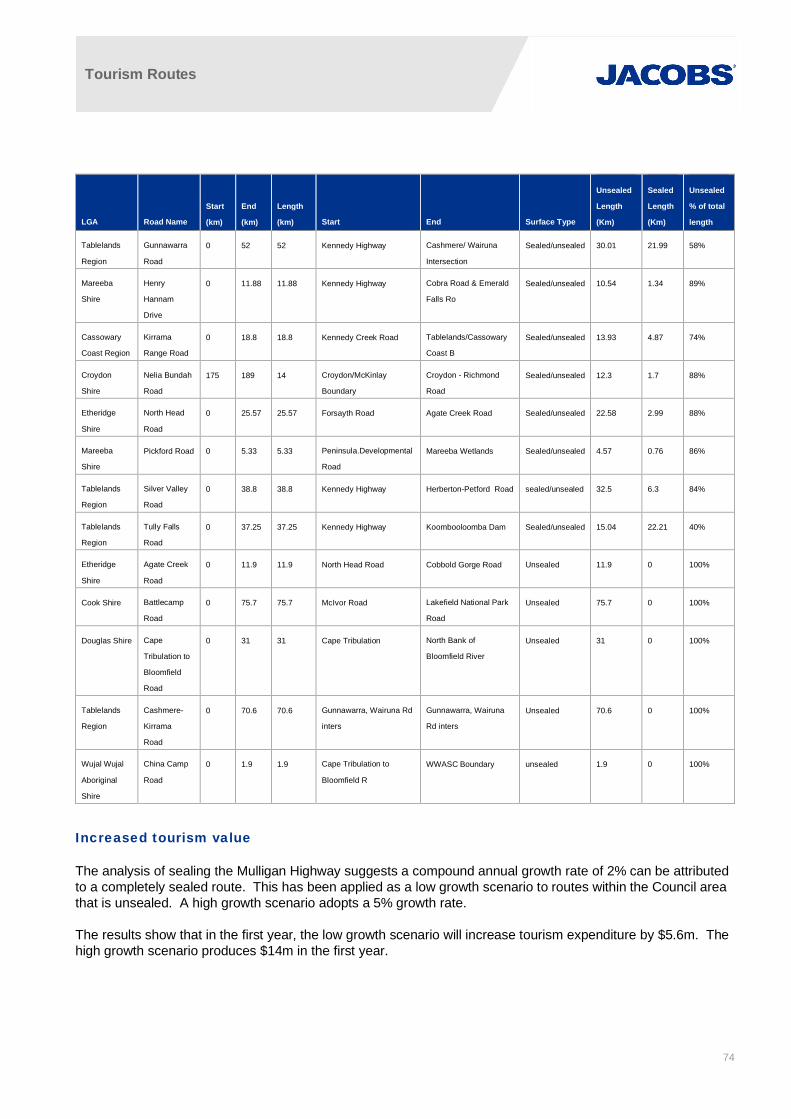
Tourism Routes
74
LGA Road Name
Start
(km)
End
(km)
Length
(km) Start End Surface Type
Unsealed
Length
(Km)
Sealed
Length
(Km)
Unsealed
% of total
length
Tablelands
Region
Gunnawarra
Road
0 52 52 Kennedy Highway Cashmere/ Wairuna
Intersection
Sealed/unsealed 30.01 21.99 58%
Mareeba
Shire
Henry
Hannam
Drive
0 11.88 11.88 Kennedy Highway Cobra Road & Emerald
Falls Ro
Sealed/unsealed 10.54 1.34 89%
Cassowary
Coast Region
Kirrama
Range Road
0 18.8 18.8 Kennedy Creek Road Tablelands/Cassowary
Coast B
Sealed/unsealed 13.93 4.87 74%
Croydon
Shire
Nelia Bundah
Road
175 189 14 Croydon/McKinlay
Boundary
Croydon - Richmond
Road
Sealed/unsealed 12.3 1.7 88%
Etheridge
Shire
North Head
Road
0 25.57 25.57 Forsayth Road Agate Creek Road Sealed/unsealed 22.58 2.99 88%
Mareeba
Shire
Pickford Road 0 5.33 5.33 Peninsula.Developmental
Road
Mareeba Wetlands Sealed/unsealed 4.57 0.76 86%
Tablelands
Region
Silver Valley
Road
0 38.8 38.8 Kennedy Highway Herberton-Petford Road sealed/unsealed 32.5 6.3 84%
Tablelands
Region
Tully Falls
Road
0 37.25 37.25 Kennedy Highway Koombooloomba Dam Sealed/unsealed 15.04 22.21 40%
Etheridge
Shire
Agate Creek
Road
0 11.9 11.9 North Head Road Cobbold Gorge Road Unsealed 11.9 0 100%
Cook Shire Battlecamp
Road
0 75.7 75.7 McIvor Road Lakefield National Park
Road
Unsealed 75.7 0 100%
Douglas Shire Cape
Tribulation to
Bloomfield
Road
0 31 31 Cape Tribulation North Bank of
Bloomfield River
Unsealed 31 0 100%
Tablelands
Region
Cashmere-
Kirrama
Road
0 70.6 70.6 Gunnawarra, Wairuna Rd
inters
Gunnawarra, Wairuna
Rd inters
Unsealed 70.6 0 100%
Wujal Wujal
Aboriginal
Shire
China Camp
Road
0 1.9 1.9 Cape Tribulation to
Bloomfield R
WWASC Boundary unsealed 1.9 0 100%
Increased tourism value
The analysis of sealing the Mulligan Highway suggests a compound annual growth rate of 2% can be attributedto a completely sealed route. This has been applied as a low growth scenario to routes within the Council areathat is unsealed. A high growth scenario adopts a 5% growth rate.
The results show that in the first year, the low growth scenario will increase tourism expenditure by $5.6m. Thehigh growth scenario produces $14m in the first year.

Tourism Routes
75
Table 8-3 Tourist route first year value increase Route Low growth scenario increase High growth scenario increase
Canecutter Way - -
Chillagoe Discovery Trail $ 0.1 m $ 0.2 m
Cooktown Discovery Trail $ 0.2 m $ 0.4 m
Daintree Explorer - -
Danbulla Tinaroo Falls - -
Epic Cape York $ 1.4 m $ 3.5 m
Great Green Way - -
Great Tropical Drive - -
Hinchinbrook Discovery Trail - -
Longlands Gap Road - -
Malanda - Atherton Road - -
O'Brien's Creek Road - -
Ravenshoe to Georgetown $ 0.2 m $ 0.4 m
Reef to Rainforest - -
Savannah Way $ 3.8 m $ 9.4 m
Tully Falls Road - -
Tully to Mission Beach Discovery - -
Waterfalls Discovery Trail - -
Total $ 5.6 m $ 14.0 m
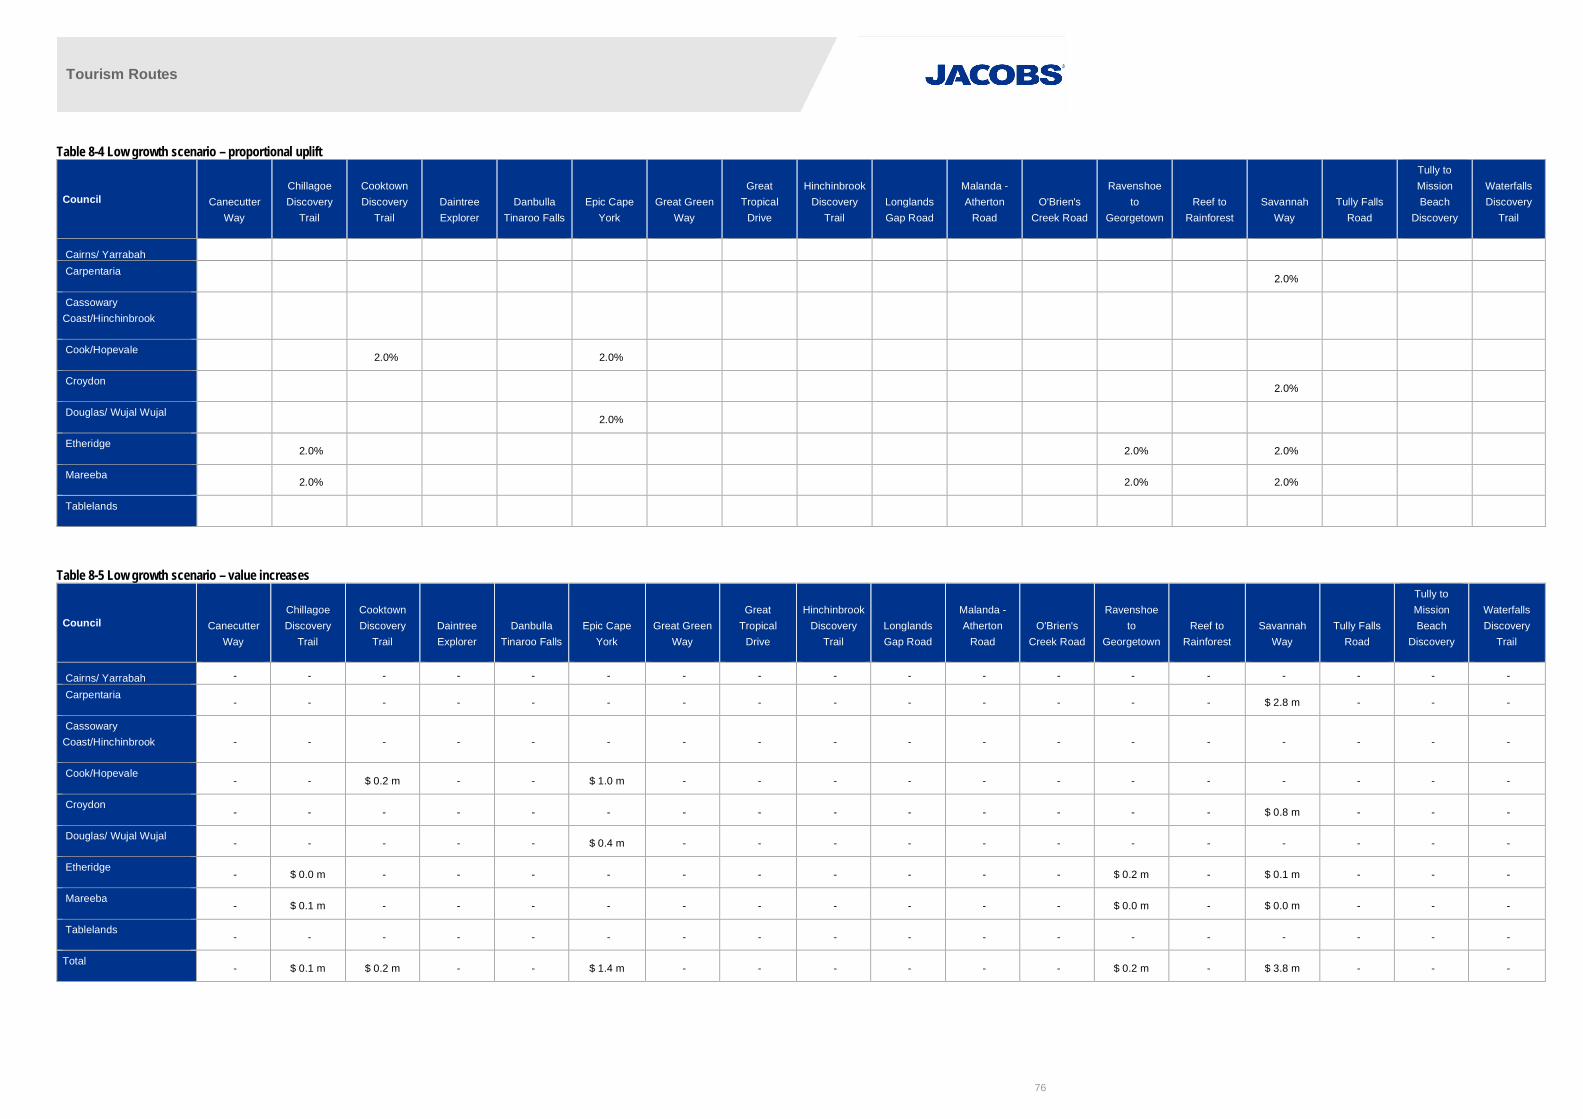
Tourism Routes
76
Table 8-4 Low growth scenario – proportional uplift
Council CanecutterWay
ChillagoeDiscovery
Trail
CooktownDiscovery
TrailDaintreeExplorer
DanbullaTinaroo Falls
Epic CapeYork
Great GreenWay
GreatTropical
Drive
HinchinbrookDiscovery
TrailLonglandsGap Road
Malanda -Atherton
RoadO'Brien's
Creek Road
Ravenshoeto
GeorgetownReef to
RainforestSavannah
WayTully Falls
Road
Tully toMissionBeach
Discovery
WaterfallsDiscovery
Trail
Cairns/ Yarrabah Carpentaria
2.0%
CassowaryCoast/Hinchinbrook
Cook/Hopevale 2.0% 2.0%
Croydon 2.0%
Douglas/ Wujal Wujal 2.0%
Etheridge 2.0% 2.0% 2.0%
Mareeba 2.0% 2.0% 2.0%
Tablelands
Table 8-5 Low growth scenario – value increases
Council CanecutterWay
ChillagoeDiscovery
Trail
CooktownDiscovery
TrailDaintreeExplorer
DanbullaTinaroo Falls
Epic CapeYork
Great GreenWay
GreatTropical
Drive
HinchinbrookDiscovery
TrailLonglandsGap Road
Malanda -Atherton
RoadO'Brien's
Creek Road
Ravenshoeto
GeorgetownReef to
RainforestSavannah
WayTully Falls
Road
Tully toMissionBeach
Discovery
WaterfallsDiscovery
Trail
Cairns/ Yarrabah - - - - - - - - - - - - - - - - - -
Carpentaria - - - - - - - - - - - - - - $ 2.8 m - - -
CassowaryCoast/Hinchinbrook - - - - - - - - - - - - - - - - - -
Cook/Hopevale - - $ 0.2 m - - $ 1.0 m - - - - - - - - - - - -
Croydon - - - - - - - - - - - - - - $ 0.8 m - - -
Douglas/ Wujal Wujal - - - - - $ 0.4 m - - - - - - - - - - - -
Etheridge - $ 0.0 m - - - - - - - - - - $ 0.2 m - $ 0.1 m - - -
Mareeba - $ 0.1 m - - - - - - - - - - $ 0.0 m - $ 0.0 m - - -
Tablelands - - - - - - - - - - - - - - - - - -
Total - $ 0.1 m $ 0.2 m - - $ 1.4 m - - - - - - $ 0.2 m - $ 3.8 m - - -

Tourism Routes
77
Table 8-6 High growth scenario – proportional uplift
Council CanecutterWay
ChillagoeDiscovery
Trail
CooktownDiscovery
TrailDaintreeExplorer
DanbullaTinaroo Falls
Epic CapeYork
Great GreenWay
GreatTropical
Drive
HinchinbrookDiscovery
TrailLonglandsGap Road
Malanda -Atherton
RoadO'Brien's
Creek Road
Ravenshoeto
GeorgetownReef to
RainforestSavannah
WayTully Falls
Road
Tully toMissionBeach
Discovery
WaterfallsDiscovery
Trail
Cairns/ Yarrabah Carpentaria
5.0%
CassowaryCoast/Hinchinbrook
Cook/Hopevale 5.0% 5.0%
Croydon 5.0%
Douglas/ Wujal Wujal 5.0%
Etheridge 5.0% 5.0% 5.0%
Mareeba 5.0% 5.0% 5.0%
Tablelands
Table 8-7 High growth scenario – value increases
Council CanecutterWay
ChillagoeDiscovery
Trail
CooktownDiscovery
TrailDaintreeExplorer
DanbullaTinaroo Falls
Epic CapeYork
Great GreenWay
GreatTropical
Drive
HinchinbrookDiscovery
TrailLonglandsGap Road
Malanda -Atherton
RoadO'Brien's
Creek Road
Ravenshoeto
GeorgetownReef to
RainforestSavannah
WayTully Falls
Road
Tully toMissionBeach
Discovery
WaterfallsDiscovery
Trail
Cairns/ Yarrabah - - - - - - - - - - - - - - - - - -
Carpentaria - - - - - - - - - - - - - - $ 7.1 m - - -
CassowaryCoast/Hinchinbrook - - - - - - - - - - - - - - - - - -
Cook/Hopevale - - $ 0.4 m - - $ 2.6 m - - - - - - - - - - - -
Croydon - - - - - - - - - - - - - - $ 2.0 m - - -
Douglas/ Wujal Wujal - - - - - $ 0.9 m - - - - - - - - - - - -
Etheridge - $ 0.0 m - - - - - - - - - - $ 0.4 m - $ 0.3 m - - -
Mareeba - $ 0.2 m - - - - - - - - - - $ 0.0 m - $ 0.0 m - - -
Tablelands - - - - - - - - - - - - - - - - - -
Total - $ 0.2 m $ 0.4 m - - $ 3.5 m - - - - - - $ 0.4 m - $ 9.4 m - - -

Tourism Routes
78
9. Stakeholder engagementStakeholder engagement is designed to obtain information from organisations that provide services directly toroad users. From a tourism perspective, this predominantly relates to self-drive routes and links to key touristlocations.
The objectives of the engagement has been to:
· Inform the study’s context and objectives
· Seek inputs that assist the study’s development
· Gain buy-in of the study’s findings and recommendations
The engagement has been undertaken in two ways:
· Direct discussions between FNQROC and key tourism organisations
· The questionnaire presented in Appendix A emailed to key tourism organisations seeking their input
Table 9-1 presents the key tourism organisations that have been forwarded the questionnaire, along with thestatus of responses.
Table 9-1 StakeholdersTourism organisations Response
Tourism Tropical North Queensland
Drive North West Queensland
Tropical Tablelands Tourism
Savannah Way Ltd Survey completed
Tropical Coast Tourist
Tourism Port Douglas and Daintree Survey completed
Tourism Trinity Beach
Tourism Palm Cove
Tourism Kuranda /Mareeba Shire Council Survey completed
Cape York Survey completed
Visit Queensland No information available
The received responses support road sealing as the main infrastructure improvement to promote tourismgrowth, and that targeted sealing of particular roads would encourage visitors across multiple routes. Theresponses also require wider consideration of competing stakeholder views particularly where a road traversesacross councils. Bloomfield Road is one such example, where the strategic outlook at this point has not beenendorsed by the relevant road owners.

Tourism Routes
79
Table 9-2 Stakeholder suggested roads for sealing
RoadCooktownDiscovery
Trail
DaintreeExplorer
Epic CapeYork
GreatTropical Drive
SavannahWay
ChillagoeDiscovery
Trail
Burketown Normanton road l
Burke Development Road l l
Kennedy Highway l l
Wills Developmental Road l
Nardoo Burketown Road l
Peninsula Developmental Road l l l l
Battlecamp Road l l
Bloomfield Road l l l
Palmerville Road
Lakefield Road l l
Marina Plains Road l
Portland Road l
Cape Tribulation Road l l l
Bloomfield Track l l l
Shiptons Flat Road l l l
Rossville Bloomfield Road l l l
The responses also suggest that Epic Cape York requires sealing of multiple roads. Keeping in mind that theroute also attracts adventure tourists that prefer the road to be unsealed, a balance is needed to ensure existingtourist markets are not hampered. A data collection exercise is necessary to better understand the profile ofcurrent and potential tourist market segments.

Tourism Routes
80
10. Crash analysisTourists may be deterred by the perceived safety risk of a route, particularly when mixing with large heavyvehicles on rough pavements or narrow road widths. From 2009 to 2018, 8500 crashes occurred acrossFNQROC. Of these, over 4200 crashes occurred on roads that are part of the 18 tourist routes. The BruceHighway has the largest number of crashes over the period, with approximately 951 crashes of which 33resulted in a fatality. The Captain Cook Highway had the second highest number of crashes with 850 crashes.
Table 10-1 Highways with highest incidence numbers 2009 - 2018Road Name Severity Number of crashes Tourist routes
Bruce Highway
Property damage only 146· Canecutter way
· Great Green Way
· Great Tropical Drive
· Hinchinbrook Discovery Trail
· Paluma
· Reef to Rainforest
· Tully to Mission Beach Discovery
· Waterfalls Discovery Trail
Minor Injury 91
Medical treatment 293
Hospitalisation 384
Fatal 33
Total 947
Captain Cook Highway
Property damage only 110
· Epic Cape York
· Great Tropical Drive
· Reef to Rainforest
· Savannah Way
· Waterfalls Discovery Trail
Minor Injury 94
Medical treatment 310
Hospitalisation 320
Fatal 16
Total 850
Kennedy Highway
Property damage only 82· Ravenshoe to Georgetown
· Chillagoe Discovery Trail
· Epic Cape York
· Great Tropical Drive
· Reef to Rainforest
· Savannah Way
· Waterfalls Discovery Trail
Minor Injury 57
Medical treatment 194
Hospitalisation 243
Fatal 25
Total 601
Gillies Range Road
Property damage only 35
· Reef to Rainforest
· Waterfalls Discovery Trail
Minor Injury 29
Medical treatment 63
Hospitalisation 108
Fatal 5
Total 240
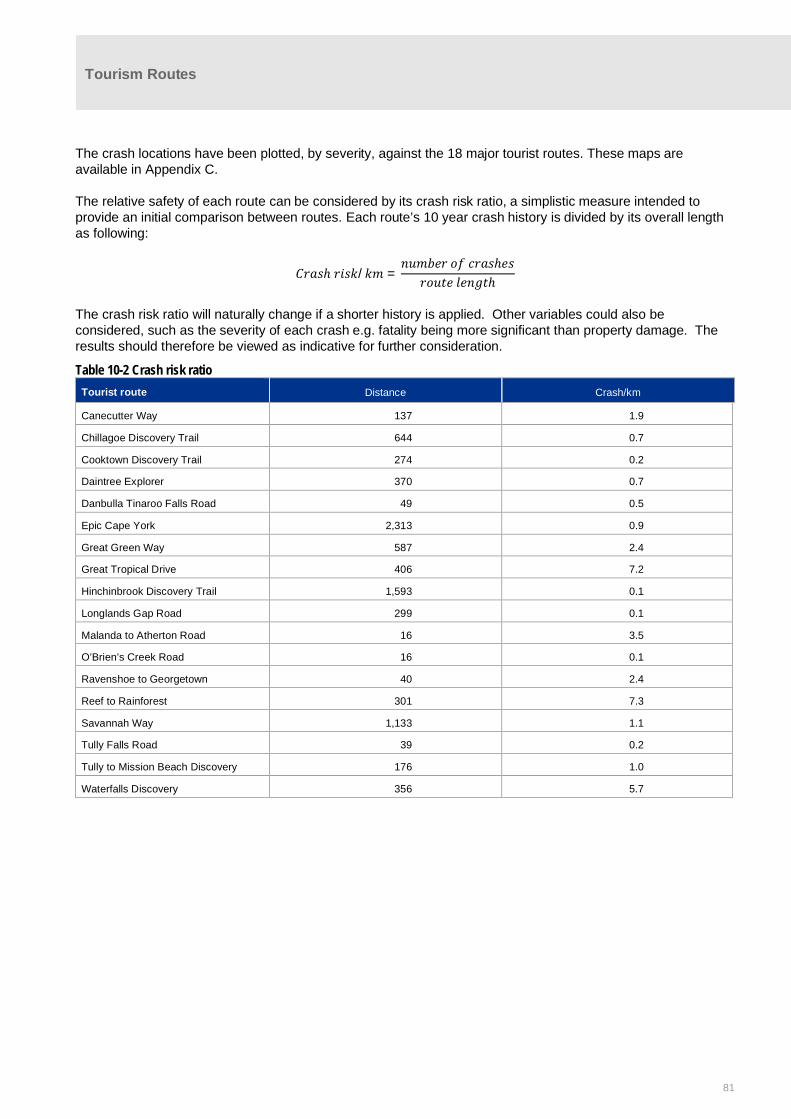
Tourism Routes
81
The crash locations have been plotted, by severity, against the 18 major tourist routes. These maps areavailable in Appendix C.
The relative safety of each route can be considered by its crash risk ratio, a simplistic measure intended toprovide an initial comparison between routes. Each route’s 10 year crash history is divided by its overall lengthas following:
ℎ / =ℎℎ
The crash risk ratio will naturally change if a shorter history is applied. Other variables could also beconsidered, such as the severity of each crash e.g. fatality being more significant than property damage. Theresults should therefore be viewed as indicative for further consideration.
Table 10-2 Crash risk ratioTourist route Distance Crash/km
Canecutter Way 137 1.9
Chillagoe Discovery Trail 644 0.7
Cooktown Discovery Trail 274 0.2
Daintree Explorer 370 0.7
Danbulla Tinaroo Falls Road 49 0.5
Epic Cape York 2,313 0.9
Great Green Way 587 2.4
Great Tropical Drive 406 7.2
Hinchinbrook Discovery Trail 1,593 0.1
Longlands Gap Road 299 0.1
Malanda to Atherton Road 16 3.5
O’Brien’s Creek Road 16 0.1
Ravenshoe to Georgetown 40 2.4
Reef to Rainforest 301 7.3
Savannah Way 1,133 1.1
Tully Falls Road 39 0.2
Tully to Mission Beach Discovery 176 1.0
Waterfalls Discovery 356 5.7

Tourism Routes
82
11. Planned infrastructure upgradesThe Queensland Transport and Roads Investment Program 2019-2020 to 2022-2023 (QTRIP) details thecurrent transport and road infrastructure projects that the Queensland Government plans to deliver over thenext 4 years.55 QTRIP investments are separated into the National Network and State Network programs. TheNational Network includes the Bruce Highway, a component of many popular tourist routes. The State Networkincorporates the strategic road network across Far North Queensland.
Figure 11-1 illustrates the expenditure occurring on each tourism route over the next four years.
Figure 11-1 QTRIP expenditure per route
Unsurprisingly, the coastal tourism routes that contain the Bruce Highway attract the majority of funding over thenext four years.
Large expenditures are allocated to major projects to improve flood proofing, such as the Cattle and FrancesCreek Upgrade.
The Cairns Southern Access Corridorcontinues to attract significant funding,with construction of Stage 3 to commencein 2020 and completed by mid-2023.Stage 4 is intended to be completed bymid 2021
These works are expected to facilitatevisitor movements by providing a moreresilient, less congested road network. Itis unlikely that they will cause anoticeable incentive for increasedvisitation, mainly because the coastalroad network is relatively mature and
integrated.
55 https://publications.qld.gov.au/dataset/queensland-transport-and-roads-investment-program-qtrip-2018-19-to-2021-22/resource/d50c165f-4055-45c3-a5e8-63716f08d1d8https://publications.qld.gov.au/dataset/queensland-transport-and-roads-investment-program-qtrip-2018-19-to-2021-22/resource/b4796e38-5eed-464d-ab2d-5e83c06b5d51
$0.00$100.00$200.00$300.00$400.00$500.00$600.00
Expenditure 2018-19 to 2021-22 ($m)

Tourism Routes
83
Major works are planned for the Peninsula Developmental Road (PDR) as part of the five year Cape YorkRegion Package (CYRP). When the CYRP concludes at the end of June 2019, a further 173km of the 527kmPDR will have been sealed. This leaves a little over 200km remaining unsealed.
Both the Epic Cape York and Cooktown Discovery Trail are expected to see an increase in tourist visitationbecause of the CYRP, although it is unclear to what extent. Both routes will continue to contain significantunsealed lengths, thereby attracting adventure tourists with 4WDs.
Limited expenditure is planned within the western councils containing large sections of unseal road. Around10kms of pavement is to be widened on the Burke Developmental Road, and the Beames Brook Bridge is beingreplaced on the Wills Developmental Road between Julia Creek and Burketown (outside of FNQROC’sboundaries).
Savannah Way is likely to see visitation remaining constant within the foreseeable future without furtherinvestment. The FNQROC RRIS could pursue investment opportunities for its progressive sealing, along withimplementing a data collection exercise aimed at identifying self-drive tourist preferences for which unsealedsections should be given priority.
Descriptions of the proposed QTRIP works and locations are within the following tables.

Tourism Routes
84
Table 11-1 QTRIP National Network
Localgovernment
Route Investment name/location Location descriptionIndicativetotal cost
$’000
Approved2019-20
Indicative 2020-21
Indicative2021-22 to
2022-23Beyond Work Description
CairnsRegional
· Great Green Way
· Great Tropical Drive
· Waterfalls Discovery Trail
Bruce Highway (Innisfail -Cairns)
Various intersections1,000 250
250 250 - Improve intersections
· Great Green Way
· Great Tropical Drive
· Waterfalls Discovery Trail
Bruce Highway (Innisfail -Cairns)
Northbound overtakinglane (43.95 - 45.15km)
4,865 50 50 570- Construct overtaking
lanes
· Great Green Way
· Great Tropical Drive
· Waterfalls Discovery Trail
Bruce Highway (Innisfail -Cairns)
Munro Street, Babinda 3,881 1,091 2,133 428-
Improve intersections
· Green Way
· Great Tropical Drive
· Reef to Rainforest
· Waterfalls Discovery Trail
Bruce Highway (Innisfail -Cairns), Cairns SouthernAccess Corridor (Stage 3)
Edmonton - Gordonvale 481,000 37,895 90,587 190,773125,000 Duplicate from two to
four lanes
· Great Green Way
· Great Tropical Drive
· Waterfalls Discovery Trail
Bruce Highway (Innisfail -Cairns)
Cairns Southern Access(Foster Roadintersection)
225,000 - - 10,000215,000 Grade separation –
road works
· Great Green Way
· Great Tropical Drive
· Waterfalls Discovery Trail
Bruce Highway (Innisfail -Cairns)
Cairns Southern Access(Kate Street – Aumuller
Street)104,070 30,301 18,680 25,353
- Widen from four to sixlanes
· Great Green Way
· Great Tropical Drive
· Waterfalls Discovery Trail
Bruce Highway (Innisfail -Cairns)
Coombs Street 1,158 250 760 148-
Improve intersection/s
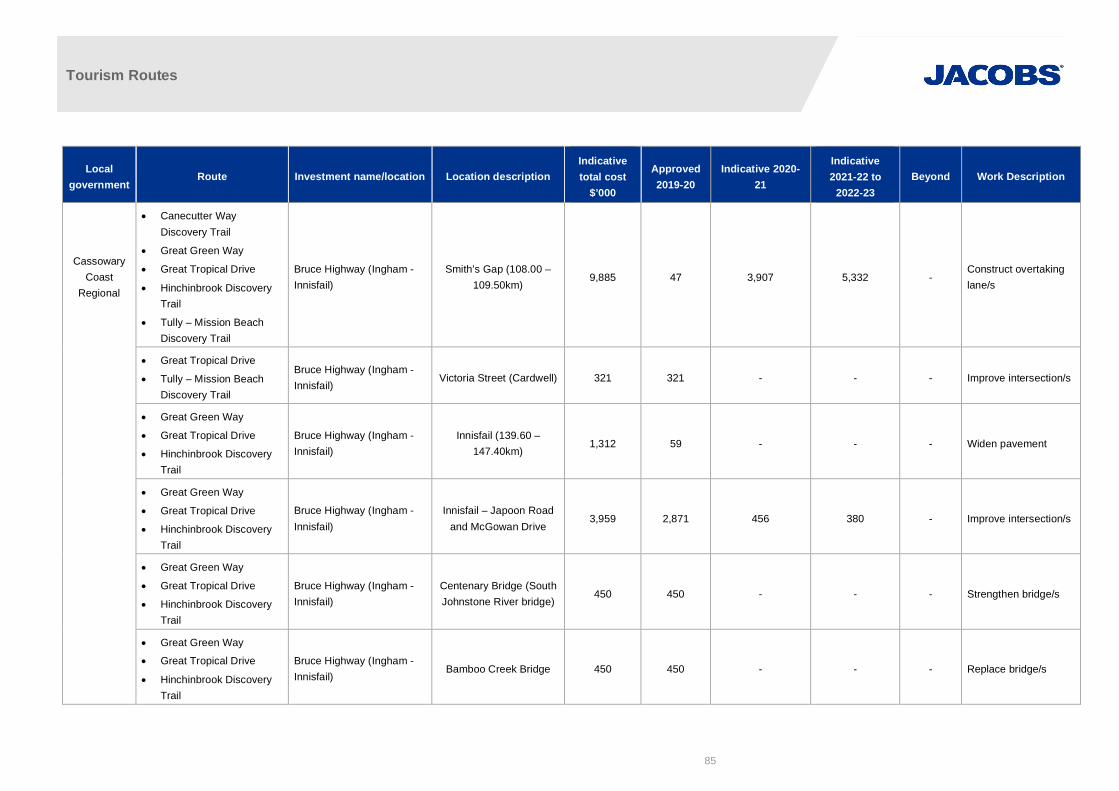
Tourism Routes
85
Localgovernment
Route Investment name/location Location descriptionIndicativetotal cost
$’000
Approved2019-20
Indicative 2020-21
Indicative2021-22 to
2022-23Beyond Work Description
CassowaryCoast
Regional
· Canecutter WayDiscovery Trail
· Great Green Way
· Great Tropical Drive
· Hinchinbrook DiscoveryTrail
· Tully – Mission BeachDiscovery Trail
Bruce Highway (Ingham -Innisfail)
Smith’s Gap (108.00 –109.50km)
9,885 47 3,907 5,332 -Construct overtakinglane/s
· Great Tropical Drive
· Tully – Mission BeachDiscovery Trail
Bruce Highway (Ingham -Innisfail)
Victoria Street (Cardwell) 321 321 - - - Improve intersection/s
· Great Green Way
· Great Tropical Drive
· Hinchinbrook DiscoveryTrail
Bruce Highway (Ingham -Innisfail)
Innisfail (139.60 –147.40km)
1,312 59 - - - Widen pavement
· Great Green Way
· Great Tropical Drive
· Hinchinbrook DiscoveryTrail
Bruce Highway (Ingham -Innisfail)
Innisfail – Japoon Roadand McGowan Drive
3,959 2,871 456 380 - Improve intersection/s
· Great Green Way
· Great Tropical Drive
· Hinchinbrook DiscoveryTrail
Bruce Highway (Ingham -Innisfail)
Centenary Bridge (SouthJohnstone River bridge)
450 450 - - - Strengthen bridge/s
· Great Green Way
· Great Tropical Drive
· Hinchinbrook DiscoveryTrail
Bruce Highway (Ingham -Innisfail)
Bamboo Creek Bridge 450 450 - - - Replace bridge/s

Tourism Routes
86
Localgovernment
Route Investment name/location Location descriptionIndicativetotal cost
$’000
Approved2019-20
Indicative 2020-21
Indicative2021-22 to
2022-23Beyond Work Description
· Great Green Way
· Great Tropical Drive
· Tully- Mission BeachDiscovery Way
Bruce Highway (Ingham -Innisfail)
Dallachy Road 11,000 275 3,406 6,950 - Install floodway/s
· Canecutter WayDiscovery Trail
· Great Green Way
· Great Tropical Drive
Bruce Highway (Innisfail -Cairns)
Behana Creek –Edmonton (55.30 –
73.20km)3,150 226 - - -
Replace/upgradeguardrail section/s andend/s
· Great Tropical Drive
· Great Green WayBruce Highway (Innisfail -Cairns)
Bluff Road 448 345 103 - - Improve intersection/s
· Great Tropical Drive
· Great Green Way
· Waterfalls Discovery Trail
Bruce Highway (Innisfail -Cairns)
North of Innisfail (5.73 –12.69km)
1,731 780 761 - - Improve intersection/s
HinchinbrookShire
· Great Green Way
· Great Tropical Drive
· Hinchinbrook DiscoveryTrail
· Paluma
Bruce Highway (Ingham -Innisfail)
Abergowrie Road -Ingham - Halifax -
Bermside Road (0 -1.73km)
810 100 587 123 - Improve intersection/s
· Great Green Way
· Great Tropical Drive
· Hinchinbrook DiscoveryTrail
Bruce Highway (Ingham -Innisfail)
Lannercost Street 250 180 - Improve intersection/s
· Great Green Way
· Great Tropical Drive
· Hinchinbrook DiscoveryTrail
Bruce Highway (Townsville- Ingham)
Hechts Road - YurugaRoad (95.10 - 99.80km)
9,064 8 5,966 2,144 - Widen pavement
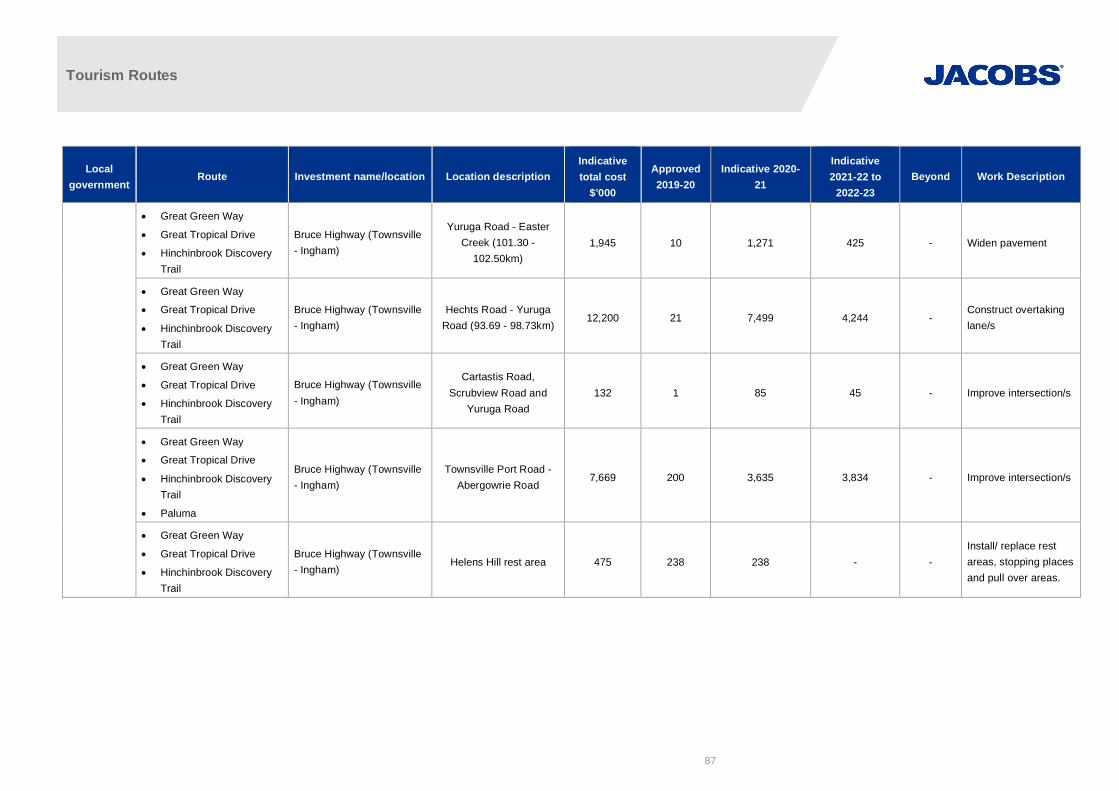
Tourism Routes
87
Localgovernment
Route Investment name/location Location descriptionIndicativetotal cost
$’000
Approved2019-20
Indicative 2020-21
Indicative2021-22 to
2022-23Beyond Work Description
· Great Green Way
· Great Tropical Drive
· Hinchinbrook DiscoveryTrail
Bruce Highway (Townsville- Ingham)
Yuruga Road - EasterCreek (101.30 -
102.50km)1,945 10 1,271 425 - Widen pavement
· Great Green Way
· Great Tropical Drive
· Hinchinbrook DiscoveryTrail
Bruce Highway (Townsville- Ingham)
Hechts Road - YurugaRoad (93.69 - 98.73km)
12,200 21 7,499 4,244 -Construct overtakinglane/s
· Great Green Way
· Great Tropical Drive
· Hinchinbrook DiscoveryTrail
Bruce Highway (Townsville- Ingham)
Cartastis Road,Scrubview Road and
Yuruga Road132 1 85 45 - Improve intersection/s
· Great Green Way
· Great Tropical Drive
· Hinchinbrook DiscoveryTrail
· Paluma
Bruce Highway (Townsville- Ingham)
Townsville Port Road -Abergowrie Road
7,669 200 3,635 3,834 - Improve intersection/s
· Great Green Way
· Great Tropical Drive
· Hinchinbrook DiscoveryTrail
Bruce Highway (Townsville- Ingham)
Helens Hill rest area 475 238 238 - -Install/ replace restareas, stopping placesand pull over areas.

Tourism Routes
88
Table 11-2 QTRIP State Road Network
Localgovernment
RouteInvestment
name/locationLocation
description
Indicativetotal cost
$’000
Approved2019-2020
Approved2020-21
Indicative2021-22 to
2022-23Beyond Work Description
CairnsRegional
· Waterfalls Discovery Trail
· Reef to Rainforest
· Daintree Explorer
· Great Tropical Drive
· Epic Cape York
Captain Cook Highway(Cairns – Mossman)
Sections: 0 – 6.80km 2,943 294 868 - -Install/retrofit
pedestrian crossing/sand facilities
· Waterfalls Discovery Trail
· Reef to Rainforest
· Daintree Explorer
· Great Tropical Drive
· Epic Cape York
Captain Cook Highway(Cairns – Mossman)
Sections: 6.80 –25.70km
21,917 3,826 5,774 8,688 - Improve intersection/s
CassowaryCoast
Regional
· Great Green Way
· Tully – Mission BeachDiscovery Trail
El Arish - Mission BeachRoad
11.47 – 11.85km 564 451 100 - - Install/replace signs
· Waterfalls Discovery TrailPalmerston Highway
(Innisfail – Ravenshoe)Various locations 1,084 884 - - - Rehabilitate pavement
Cook Shire
· Cooktown Discovery Trail
· Daintree Explorer
· Epic Cape York
· Great Tropical Drive
Peninsula DevelopmentalRoad (Coen – Weipa)
Telecom Tower –Archer River
20,500 14,508 - - - Pave and Seal
· Daintree Explorer
· Epic Cape York
· Great Tropical Drive
Peninsula DevelopmentalRoad (Lakeland – Laura)
Agnarra campground(45.72 – 45.73km)
250 150 100 - -Install/ replace rest
areas, stopping placesand pull over areas
· Daintree Explorer
· Epic Cape York
· Great Tropical Drive
Peninsula DevelopmentalRoad (Laura – Coen)
Fairview West (PartA)
10,800 2,212 - - - Pave and seal
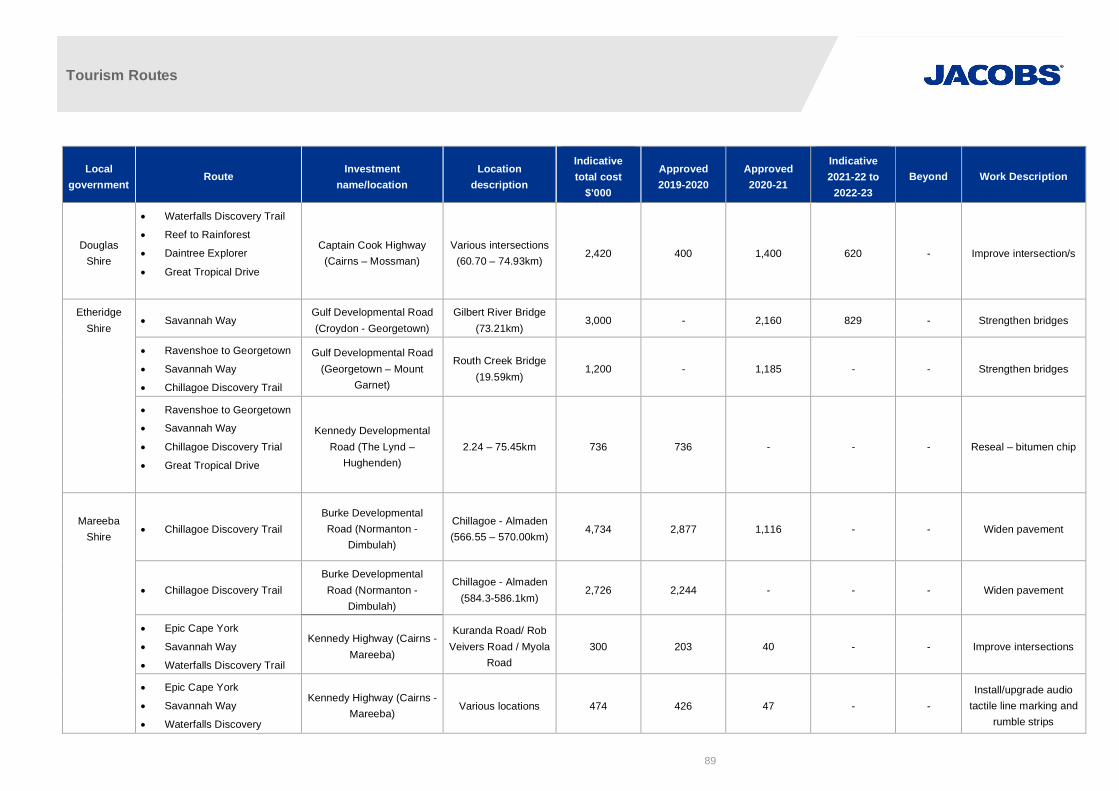
Tourism Routes
89
Localgovernment
RouteInvestment
name/locationLocation
description
Indicativetotal cost
$’000
Approved2019-2020
Approved2020-21
Indicative2021-22 to
2022-23Beyond Work Description
DouglasShire
· Waterfalls Discovery Trail
· Reef to Rainforest
· Daintree Explorer
· Great Tropical Drive
Captain Cook Highway(Cairns – Mossman)
Various intersections(60.70 – 74.93km)
2,420 400 1,400 620 - Improve intersection/s
EtheridgeShire
· Savannah WayGulf Developmental Road(Croydon - Georgetown)
Gilbert River Bridge(73.21km)
3,000 - 2,160 829 - Strengthen bridges
· Ravenshoe to Georgetown
· Savannah Way
· Chillagoe Discovery Trail
Gulf Developmental Road(Georgetown – Mount
Garnet)
Routh Creek Bridge(19.59km)
1,200 - 1,185 - - Strengthen bridges
· Ravenshoe to Georgetown
· Savannah Way
· Chillagoe Discovery Trial
· Great Tropical Drive
Kennedy DevelopmentalRoad (The Lynd –
Hughenden)2.24 – 75.45km 736 736 - - - Reseal – bitumen chip
MareebaShire
· Chillagoe Discovery TrailBurke DevelopmentalRoad (Normanton -
Dimbulah)
Chillagoe - Almaden(566.55 – 570.00km)
4,734 2,877 1,116 - - Widen pavement
· Chillagoe Discovery TrailBurke DevelopmentalRoad (Normanton -
Dimbulah)
Chillagoe - Almaden(584.3-586.1km)
2,726 2,244 - - - Widen pavement
· Epic Cape York
· Savannah Way
· Waterfalls Discovery Trail
Kennedy Highway (Cairns -Mareeba)
Kuranda Road/ RobVeivers Road / Myola
Road300 203 40 - - Improve intersections
· Epic Cape York
· Savannah Way
· Waterfalls Discovery
Kennedy Highway (Cairns -Mareeba)
Various locations 474 426 47 - -Install/upgrade audio
tactile line marking andrumble strips
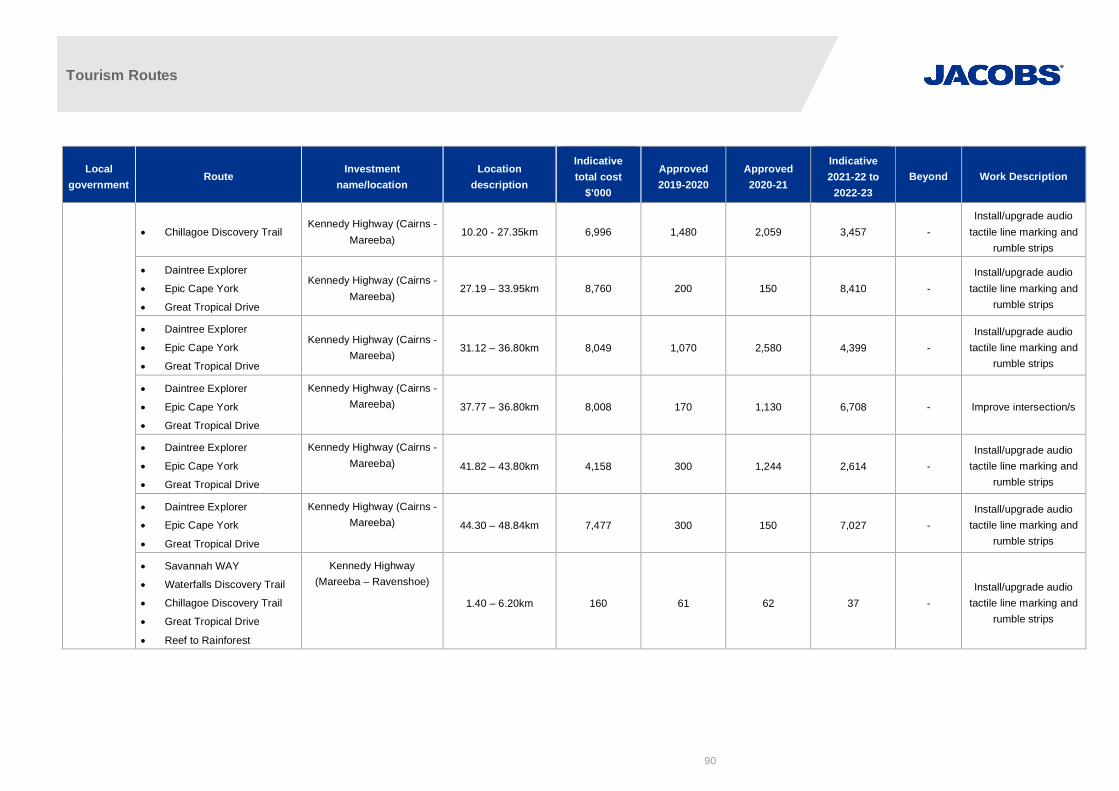
Tourism Routes
90
Localgovernment
RouteInvestment
name/locationLocation
description
Indicativetotal cost
$’000
Approved2019-2020
Approved2020-21
Indicative2021-22 to
2022-23Beyond Work Description
· Chillagoe Discovery TrailKennedy Highway (Cairns -
Mareeba)10.20 - 27.35km 6,996 1,480 2,059 3,457 -
Install/upgrade audiotactile line marking and
rumble strips
· Daintree Explorer
· Epic Cape York
· Great Tropical Drive
Kennedy Highway (Cairns -Mareeba)
27.19 – 33.95km 8,760 200 150 8,410 -Install/upgrade audio
tactile line marking andrumble strips
· Daintree Explorer
· Epic Cape York
· Great Tropical Drive
Kennedy Highway (Cairns -Mareeba)
31.12 – 36.80km 8,049 1,070 2,580 4,399 -Install/upgrade audio
tactile line marking andrumble strips
· Daintree Explorer
· Epic Cape York
· Great Tropical Drive
Kennedy Highway (Cairns -Mareeba) 37.77 – 36.80km 8,008 170 1,130 6,708 - Improve intersection/s
· Daintree Explorer
· Epic Cape York
· Great Tropical Drive
Kennedy Highway (Cairns -Mareeba) 41.82 – 43.80km 4,158 300 1,244 2,614 -
Install/upgrade audiotactile line marking and
rumble strips
· Daintree Explorer
· Epic Cape York
· Great Tropical Drive
Kennedy Highway (Cairns -Mareeba) 44.30 – 48.84km 7,477 300 150 7,027 -
Install/upgrade audiotactile line marking and
rumble strips
· Savannah WAY
· Waterfalls Discovery Trail
· Chillagoe Discovery Trail
· Great Tropical Drive
· Reef to Rainforest
Kennedy Highway(Mareeba – Ravenshoe)
1.40 – 6.20km 160 61 62 37 -Install/upgrade audio
tactile line marking andrumble strips

Tourism Routes
91
Localgovernment
RouteInvestment
name/locationLocation
description
Indicativetotal cost
$’000
Approved2019-2020
Approved2020-21
Indicative2021-22 to
2022-23Beyond Work Description
· Waterfalls Discovery Trail
· Chillagoe Discovery Trail
· Epic Cape York
· Great Tropical Drive
· Reef to Rainforest
Mareeba – Dimbulah Road
42.90 – 44.30km 3,499 400 2,292 807 - Seal shoulder/s
· Waterfalls Discovery Trail
· Chillagoe Discovery Trail
· Epic Cape York
· Great Tropical Drive
· Reef to Rainforest
Mareeba – Dimbulah Road
Byrnes Street /Rankin Street
3,473 2,743 401 - - Improve intersection/s
· Daintree Explorer
· Epic Cape York
· Great Tropical Drive
· Reef to Rainforest
Mossman – Mount MolloyRoad
2.20 – 9.40km 704 155 40 - - Install / replace signs
· Daintree ExplorerMulligan Highway (Mount
Molley – Lakeland)Rifle Creek Bridge 12,000 - - 12,000 - Replace bridge/s
TablelandsRegional
· Chillagoe Discovery Trail Atherton - Herberton Road 9.37-11.71km 644 256 100 - - Install/ replace signs
· Reef to Rainforest
· Waterfalls Discovery TrailGillies Range Road Peeramon Road 338 234 40 - - Improve intersection/s
· Reef to Rainforest
· Waterfalls Discovery TrailGillies Range Road Various locations 18,184 1,500 5,700 10,984 - Improve intersection/s
· Chillagoe Discovery TrailKennedy Highway
(Mareeba – Ravenshoe)66.40 – 66.75km 329 1,500 5,700 10,984 - Install/replace signs
· Chillagoe Discovery TrailKennedy Highway
(Mareeba – Ravenshoe)59.40 – 60.50km 368 38 215 76 - Install guardrail
· Chillagoe Discovery TrailKennedy Highway
(Mareeba – Ravenshoe)Belson Road 539 85 198 85 - Improve intersection/s
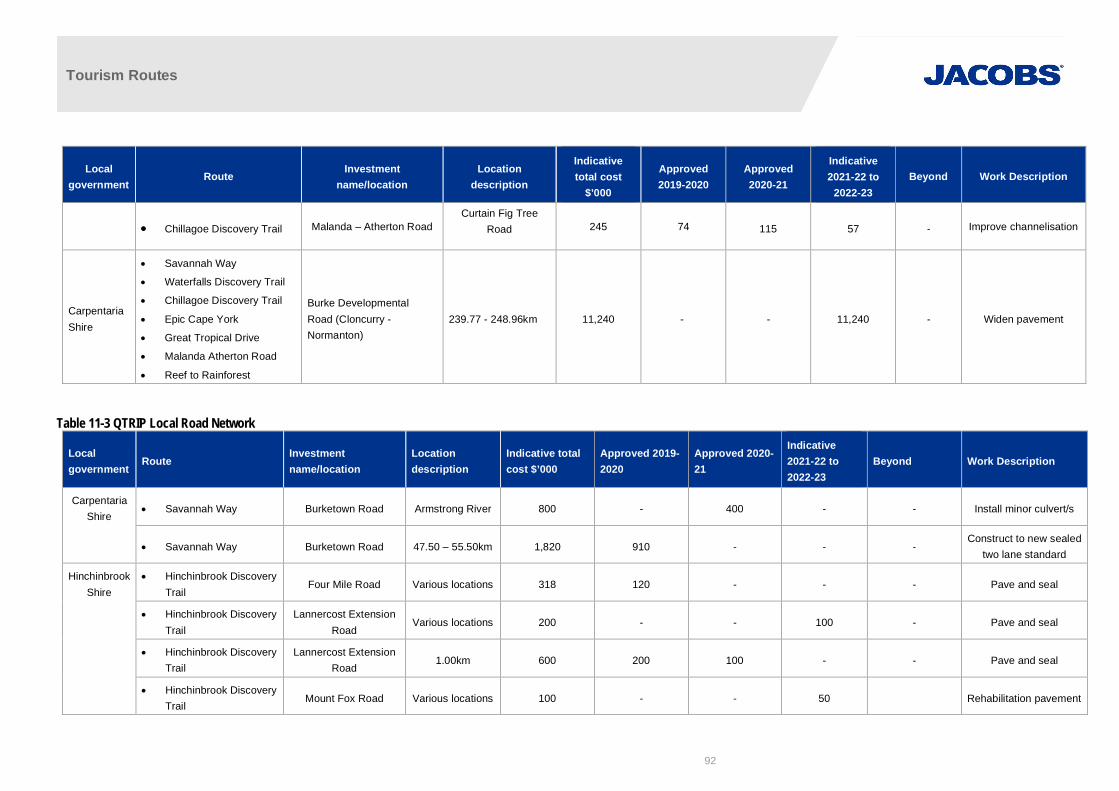
Tourism Routes
92
Localgovernment
RouteInvestment
name/locationLocation
description
Indicativetotal cost
$’000
Approved2019-2020
Approved2020-21
Indicative2021-22 to
2022-23Beyond Work Description
· Chillagoe Discovery Trail Malanda – Atherton RoadCurtain Fig Tree
Road 245 74 115 57 - Improve channelisation
CarpentariaShire
· Savannah Way
· Waterfalls Discovery Trail
· Chillagoe Discovery Trail
· Epic Cape York
· Great Tropical Drive
· Malanda Atherton Road
· Reef to Rainforest
Burke DevelopmentalRoad (Cloncurry -Normanton)
239.77 - 248.96km 11,240 - - 11,240 - Widen pavement
Table 11-3 QTRIP Local Road Network
Localgovernment
RouteInvestmentname/location
Locationdescription
Indicative totalcost $’000
Approved 2019-2020
Approved 2020-21
Indicative2021-22 to2022-23
Beyond Work Description
CarpentariaShire
· Savannah Way Burketown Road Armstrong River 800 - 400 - - Install minor culvert/s
· Savannah Way Burketown Road 47.50 – 55.50km 1,820 910 - - -Construct to new sealed
two lane standard
HinchinbrookShire
· Hinchinbrook DiscoveryTrail
Four Mile Road Various locations 318 120 - - - Pave and seal
· Hinchinbrook DiscoveryTrail
Lannercost ExtensionRoad
Various locations 200 - - 100 - Pave and seal
· Hinchinbrook DiscoveryTrail
Lannercost ExtensionRoad
1.00km 600 200 100 - - Pave and seal
· Hinchinbrook DiscoveryTrail
Mount Fox Road Various locations 100 - - 50 Rehabilitation pavement

Tourism Routes
93
Localgovernment
RouteInvestmentname/location
Locationdescription
Indicative totalcost $’000
Approved 2019-2020
Approved 2020-21
Indicative2021-22 to2022-23
Beyond Work Description
· Canecutter WayDiscovery Trail
Palm Avenue 0 – 84.73km 125 - - 50 Pave and seal
· Hinchinbrook DiscoveryTrail
Venables CrossingRoad
Various locations 358 - 179 - Pave and seal
· Hinchinbrook DiscoveryTrail
Wallaman Falls Road Various locations 1,578 50 50 100 Widen and seal
CassowaryCoast
Regional
· Chillagoe DiscoveryTrail
Ann Road Dallachy Road 789 - 399 - - Improve intersection/s
Cook Shire · Epic Cape York Charlotte Street 2.32 - 2.93km 76 38 - - - Widen and seal
TablelandsRegional
· Savannah Way
· Waterfalls DiscoveryTrail
· Reef to Rainforest
· Chillagoe DiscoveryTrail
· Great Tropical Drive
Togla – Kairi Road 1.38 – 1.54km 500 250 - - - Improve intersection/s
· Waterfalls DiscoveryTrail
Theresa Creek Road Moregatta Road 300 150 - - - Improve intersection/s
· Savannah Way
· Waterfalls DiscoveryTrail
· Reef to Rainforest
· Chillagoe DiscoveryTrail
· Great Tropical Drive
Togla – Kairi Road 1.53 – 3.08km 420 210 - - -Widen and seal
shoulder/s

Tourism Routes
94
12. Summary of findingsThe various strategies and plans for FNQROC’s self-drive tourism market identify a range of opportunities toincrease tourist numbers. Road investment issues and opportunities are:
· improved rest areas to better cater for tourist needs
· more pullover areas to encourage day visitors to explore each tourist route and its attractions
· better promotion and signage of major tourism routes, including digital in-vehicle signage
· improving all-year access and facilities for caravan and camping
· the interactions between self-drive tourists and road freight movements, particularly in more regionalareas where heavy vehicles can be over 50 metres long
· poor or non-existent mobile communications
· insufficient education on how to travel through the outback for tourists
Improvements like rests areas, pullover areas and signage have direct safety flow-on benefits, particularlywhere tourists have little knowledge of a route. Those routes with relatively high crash risk ratios should beconsidered for these infrastructure investments, namely the Great Tropical Drive, Waterfalls Discovery and Reefto Rainforest.
The relationship between larger infrastructure upgrades and tourist demand is difficult to define with theavailable data. Only sealing of unsealed roads appears to have a positive effect based on the analysis of theMulligan Highway. The scenarios suggest that tourism expenditure each year can potentially increase between$6.2m and $15.5m, generated largely by Epic Cape York and Savannah Way.
QTRIP expenditure between 2018-19 and 2021-22 suggests substantial investment is planned for the SCRsections of the following routes:
· Epic Cape York
· Great Green Way
· Great Tropical Drive
· Reef to Rainforest
· Waterfalls Discovery Trail
This suggests FNQROC could pursue investment opportunities for the progressive sealing of Savannah Way.Implementing a data collection exercise targeted at identifying self-drive tourist preferences can inform whichunsealed sections should be given priority.
The same data collection exercise could be applied to FNQROC’s unsealed roads that connect to the improvedSCRs e.g. Epic Cape York. As these routes also attract adventure tourists that prefer the road to be unsealed,a balance is needed to ensure existing tourist markets are not hampered.
Improving the estimation of each route’s tourism value requires collection of further data with two approaches:
· Vehicle movements across routes can be measured through roadside monitoring by camera orBluetooth loggers, or through wide-scale tracking of mobile phone tower signal pings, in-vehicle GPSdevices and/or GPS data traces obtained from smartphone location-based services, if coverage existsand/or sample size is appropriate. Length of stays in each location can also be estimated via thesedata sources, and provide a reliable sample of the number of occupants per vehicle.
· A survey of self-drive tourists to inform the spend per route. TRA should be consulted in designing thesurvey, ensuring there is consistency with current collection methods.

Tourism Routes
95
Observing the impact of infrastructure upgrades on AADT growth can be improved through more targeted andregular placement of traffic counters. Ideally traffic counts are collected regularly before an upgrade todetermine a road’s natural growth. Regular counts after an upgrade that show notable variation from the naturalgrowth can be attributed to the improved infrastructure.

Tourism Routes
96
Appendix A. Survey questionnaireFNQROC Regional Roads Investment Strategy: Tourism Routes
Thank you for participating within the roads prioritisation study for the Far North Region of Councils (FNQROC). Part of this study is to incorporate those roads which couldencourage tourism across Far North Queensland, particularly self-drive tourists.
1. Could you please respond to the questions in the below table. Please add more columns if needed.
Questions Destination 1 Destination 2 Destination 3 Destination 4 Destination 5
What is the tourist destinationname and location?
Usual route/roads to get to thislocation?
Approximately how many self-drive visitors a week visit thislocation?
Approximately what percentageof self-drive visitors would betowing a caravan/campingtrailer?
Do you think tourists avoid thislocation because of poor roadaccess, or is the current roadaccess adequate?
Is roadside signage directingtourists to this locationadequate?
Do you think upgrading access tothis location notably increase thenumber of self-drive tourists?

Tourism Routes
97
2. Following from your responses above, please list in the below table in order of priority the routes/roads that should be upgraded and why. Please add more rows asneeded.
In order of priority Route/roads Why?
1
2
3
4
5

Tourism Routes
98
Appendix B. Questionnaire response summaryRespondent Priority destination Route Approx. visitation Route characteristics Expected increase in visitation Priority roadworks Rationale for upgrade FNQROC tourism route
alignment
Savannah Way Burketown Savannah Way Seasonal – 30,000 perannum
50% towing
Unsealed road betweenNormanton and Burketown
Signage is adequate
Undefined but expected Sealing between Normanton andBurketown
Sealing between Burketown toNT border
Savannah Way
Cook Shire Council Quinkan Country AboriginalRock Art (Laura)
Peninsula DevelopmentRoad (PDR)
Battlecamp Road
150 cars per day
65% towing
PDR is adequate for allvehicles
Battlecamp Rd to Cooktownis recommended for 4WDonly
Undefined but expected Sealing between Laura andCooktown
Indigenous Rock Art listed on Australia’sNational Heritage List.
Creates a loop drive route for tourists fromCooktown to Laura and Lakeland
Cooktown Discovery
Epic Cape York
Cooktown Mulligan Highway
Bloomfield Road
570 cars per day
75% towing
Road access and signage isinadequate on BloomfieldRoad
No increase expected None required on MulliganHighway
Refer Bloomfield Road/Track below Great Tropical Drive
Cooktown Discovery
Daintree Explorer
Epic Cape York
Maytown Palmerville Road 55 cars per day
25% towing
Only suitable for 4WD
Signage is inadequate
Undefined but expected Sealing Create a tourist route to the historic goldmining town of Maytown
Create link through to the BurkeDevelopment Road (requires MountMulgrave Road)
Dixie Road also nominated as a touristroute and link to the Burke DevelopmentRoad
Epic Cape York
Lakefield National Park Battlecamp Road
Lakefield Road
Marina Plains Road
70 cars per day
40% towing
Unpredictable conditions ofthe unsealed road
perceived remoteness
Signage is inadequate
Undefined but expected Sealing of entire route Creates a scenic tourist route throughLakefield National Park
Alternative road to the PeninsulaDevelopment Rd
Epic Cape York
Cooktown Explorer
Portland Roads Portland Roads Road 30 cars per day
25% towing
Undefined
Signage is adequate
Undefined but expected Portland Roads and Chilli Beach arepopular camping and fishing spots fortourists.
There are new accommodation and touroperators establishing businesses in thisarea, which would benefit from the roadbeing upgraded
Epic Cape York
Bloomfield Road/Track Cape Tribulation Road
Bloomfield Road
Shipton’s Flat Road
Rossville Bloomfield Road
85 cars per day
10% towing
Only suitable for 4WD
Towing not recommended
More signage requiredadvising unsuitability for 2WDor large towing vehicles
Undefined but expected Sealing of entire route To protect the Great Barrier Reef fromsediment run off
Create an all-weather tourist drive routelinking the Wet Tropics Area in CapeTribulation and the Daintree with WujalWujal, Ayton, Rossville, Lion’s Den Hoteland Cooktown.
Daintree Explorer
Epic Cape York
Great Tropical Drive
Mareeba Shire Council Kuranda Kennedy Highway (KurandaRange)
Mulligan Highway
Byrnes Street
Rob Viever’s Drive
Therwine Street
Coondoo Street
10,000 cars per week
20% towing
Poor road conditions
Adequate signage
Undefined but expected Kennedy Highway (KurandaRange)
China tourist market and domestic marketis growing. Current road limits potential forself – drive.
Chillagoe Discovery Trail
Daintree Explorer
Epic Cape York
Great Tropical Way
O’Briens Creek Road
Reef to Rainforest
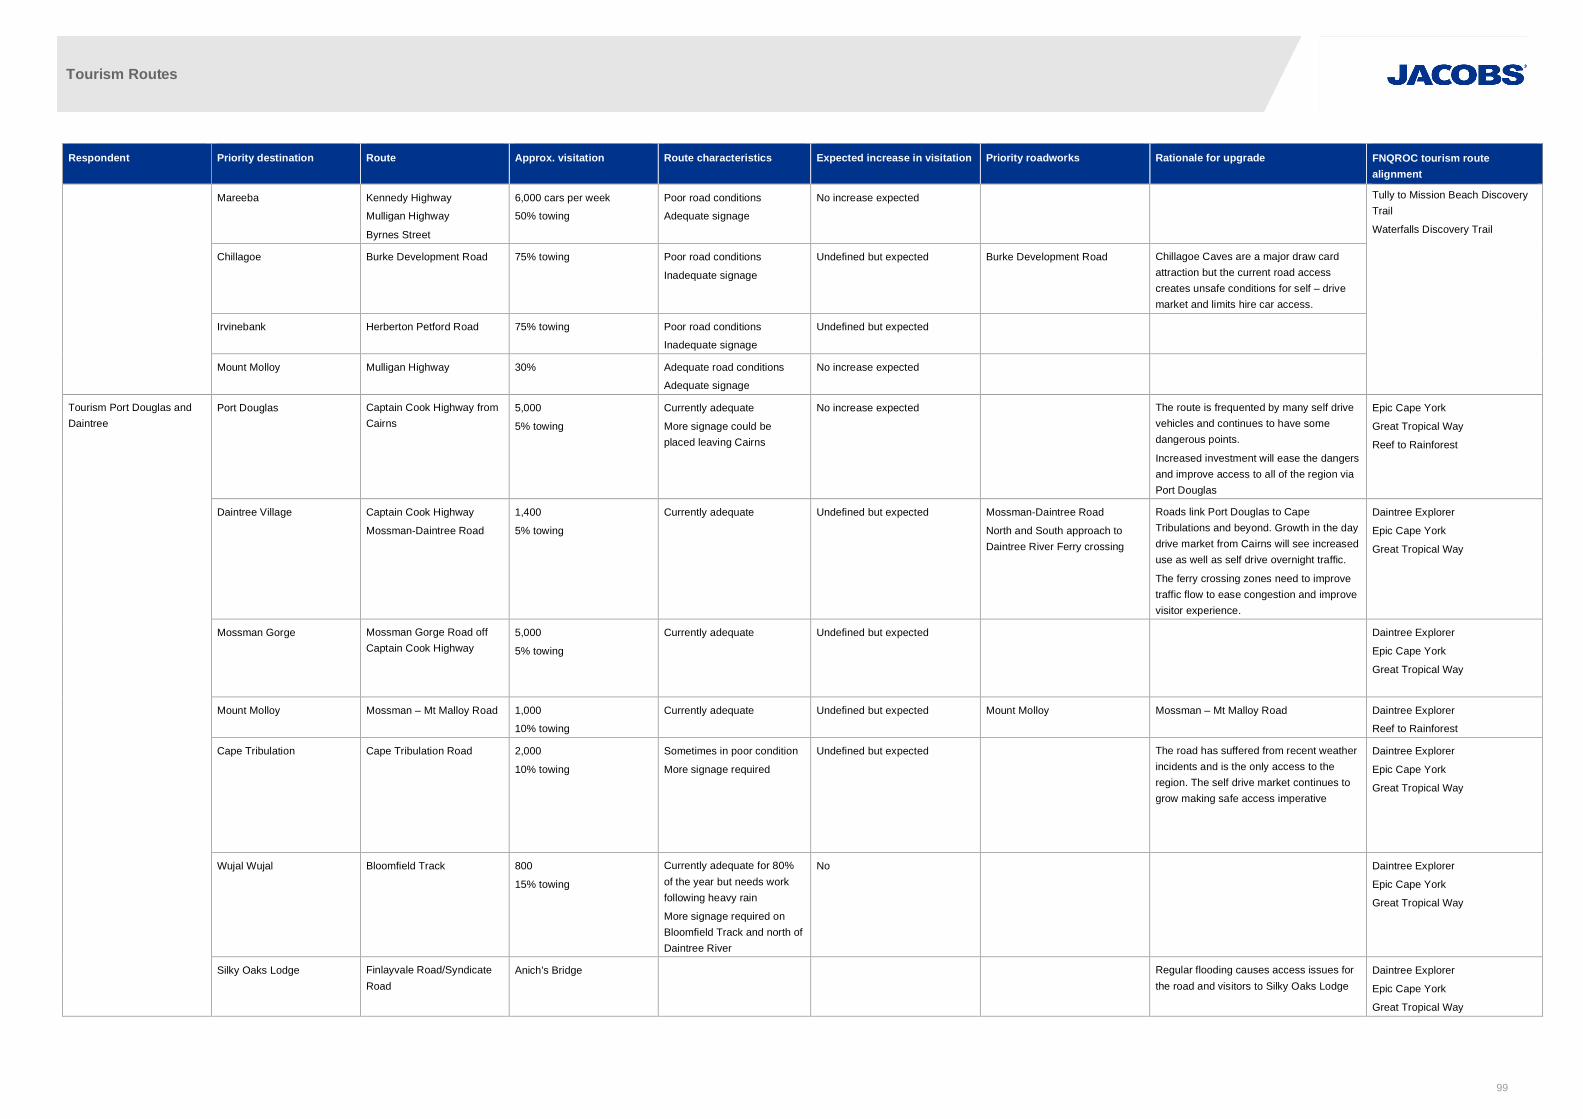
Tourism Routes
99
Respondent Priority destination Route Approx. visitation Route characteristics Expected increase in visitation Priority roadworks Rationale for upgrade FNQROC tourism routealignment
Mareeba Kennedy Highway
Mulligan Highway
Byrnes Street
6,000 cars per week
50% towing
Poor road conditions
Adequate signage
No increase expected Tully to Mission Beach DiscoveryTrail
Waterfalls Discovery Trail
Chillagoe Burke Development Road 75% towing Poor road conditions
Inadequate signage
Undefined but expected Burke Development Road Chillagoe Caves are a major draw cardattraction but the current road accesscreates unsafe conditions for self – drivemarket and limits hire car access.
Irvinebank Herberton Petford Road 75% towing Poor road conditions
Inadequate signage
Undefined but expected
Mount Molloy Mulligan Highway 30% Adequate road conditions
Adequate signage
No increase expected
Tourism Port Douglas andDaintree
Port Douglas Captain Cook Highway fromCairns
5,000
5% towing
Currently adequate
More signage could beplaced leaving Cairns
No increase expected The route is frequented by many self drivevehicles and continues to have somedangerous points.
Increased investment will ease the dangersand improve access to all of the region viaPort Douglas
Epic Cape York
Great Tropical Way
Reef to Rainforest
Daintree Village Captain Cook Highway
Mossman-Daintree Road
1,400
5% towing
Currently adequate Undefined but expected Mossman-Daintree Road
North and South approach toDaintree River Ferry crossing
Roads link Port Douglas to CapeTribulations and beyond. Growth in the daydrive market from Cairns will see increaseduse as well as self drive overnight traffic.
The ferry crossing zones need to improvetraffic flow to ease congestion and improvevisitor experience.
Daintree Explorer
Epic Cape York
Great Tropical Way
Mossman Gorge Mossman Gorge Road offCaptain Cook Highway
5,000
5% towing
Currently adequate Undefined but expected Daintree Explorer
Epic Cape York
Great Tropical Way
Mount Molloy Mossman – Mt Malloy Road 1,000
10% towing
Currently adequate Undefined but expected Mount Molloy Mossman – Mt Malloy Road Daintree Explorer
Reef to Rainforest
Cape Tribulation Cape Tribulation Road 2,000
10% towing
Sometimes in poor condition
More signage required
Undefined but expected The road has suffered from recent weatherincidents and is the only access to theregion. The self drive market continues togrow making safe access imperative
Daintree Explorer
Epic Cape York
Great Tropical Way
Wujal Wujal Bloomfield Track 800
15% towing
Currently adequate for 80%of the year but needs workfollowing heavy rain
More signage required onBloomfield Track and north ofDaintree River
No Daintree Explorer
Epic Cape York
Great Tropical Way
Silky Oaks Lodge Finlayvale Road/SyndicateRoad
Anich's Bridge Regular flooding causes access issues forthe road and visitors to Silky Oaks Lodge
Daintree Explorer
Epic Cape York
Great Tropical Way

Tourism Routes
100
Appendix C. Crash history (2009 to 2018)
All crashes along FNQROC tourist routes

Tourism Routes
101
Canecutter Way crashes
Chillagoe Discovery Trail crashes
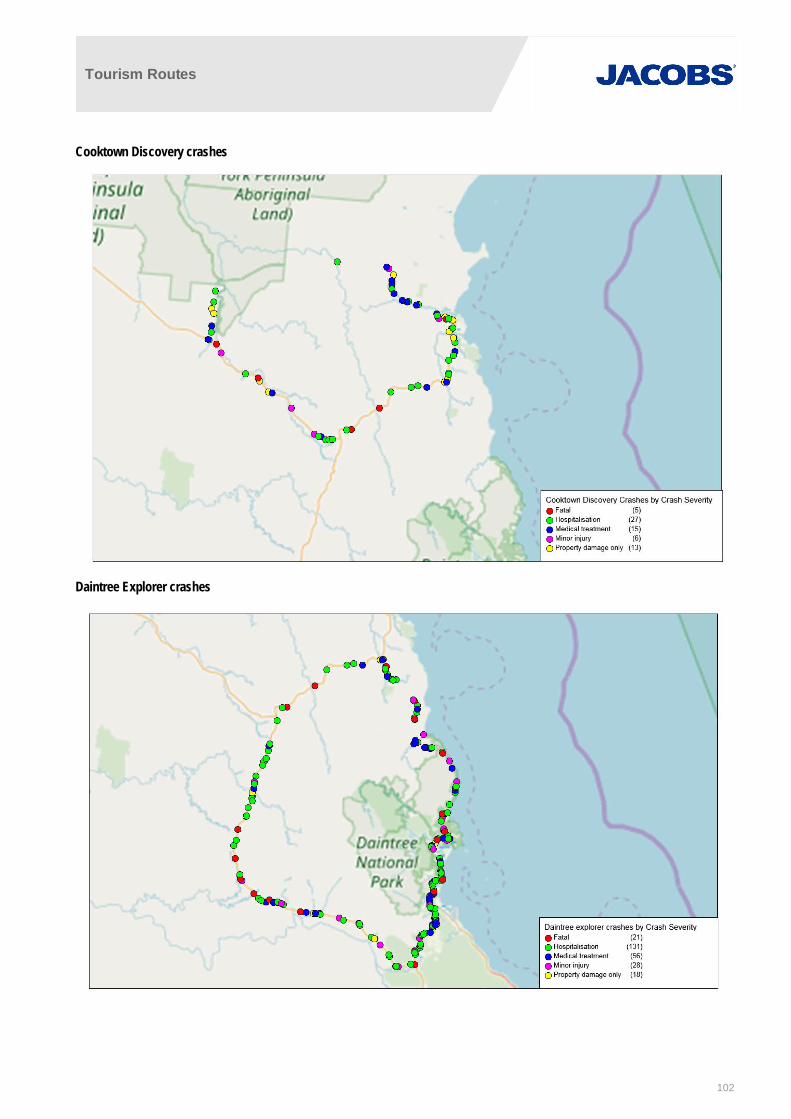
Tourism Routes
102
Cooktown Discovery crashes
Daintree Explorer crashes

Tourism Routes
103
Danbulla Tinaroo Falls Road crashes
Figure 12-1 Epic Cape York crashes

Tourism Routes
104
Great Green Way crashes
Great Tropical Way crashes
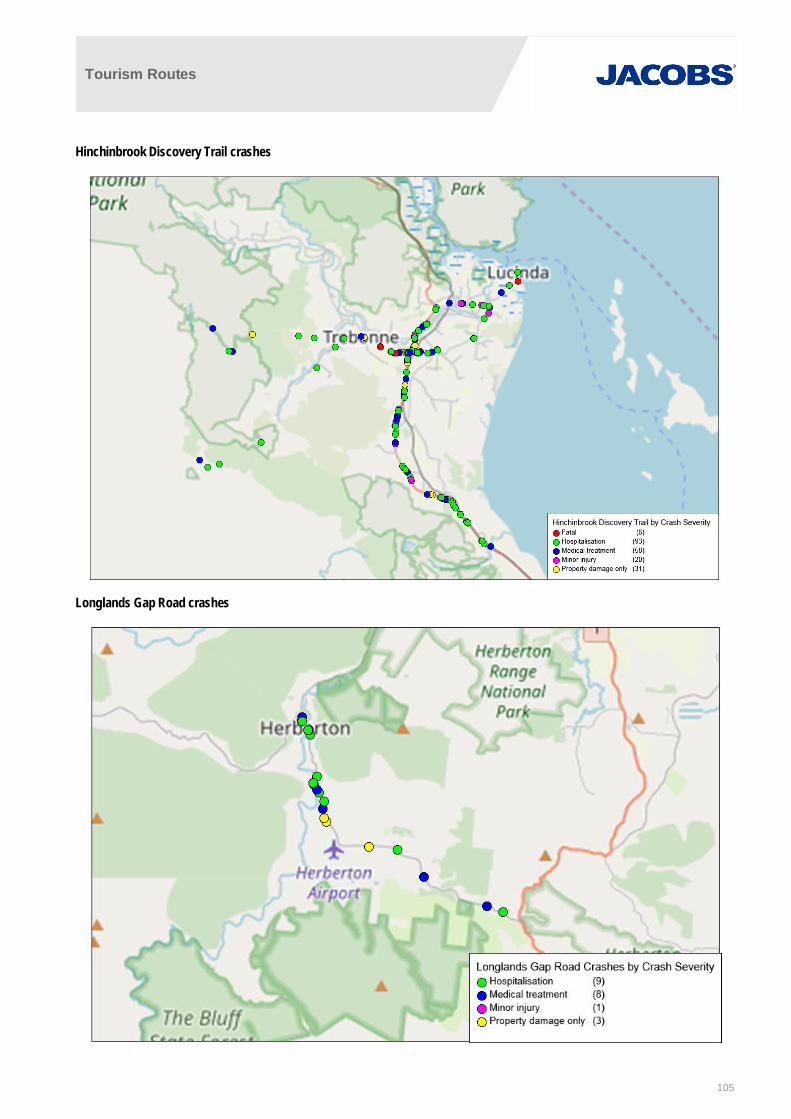
Tourism Routes
105
Hinchinbrook Discovery Trail crashes
Longlands Gap Road crashes

Tourism Routes
106
Malanda to Atherton Road crashes
O'Briens Creek Road crashes

Tourism Routes
107
Ravenshoe to Georgetown crashes
Reef to Rainforest crashes

Tourism Routes
108
Savannah Way crashes
Tully Falls Road crashes
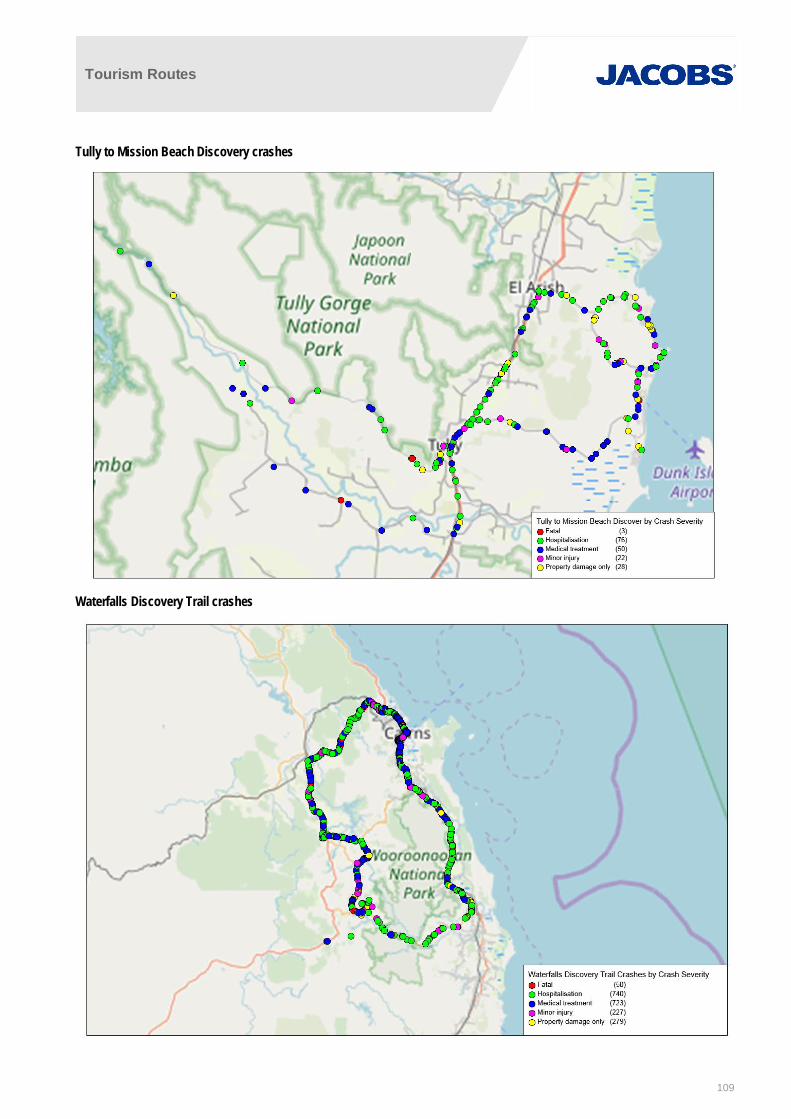
Tourism Routes
109
Tully to Mission Beach Discovery crashes
Waterfalls Discovery Trail crashes
Tourism Routes
110
Important note about your reportThe sole purpose of this report and the associated services performed by Jacobs is to develop a RegionalRoads Investment Strategy for the Far North Queensland Regional Organisation of Councils (the client). Theservices provided are set out in the contract between Jacobs and the client.
In preparing this report, Jacobs has relied upon, and presumed accurate, information (or confirmation of theabsence thereof) provided by the client. Except as otherwise stated in the report, Jacobs has not attempted toverify the accuracy or completeness of any such information. If the information is subsequently determined to befalse, inaccurate or incomplete then it is possible that our observations and conclusions as expressed in thisreport may change. The passage of time, manifestation of latent conditions or impacts of future events mayrequire further examination of the project and subsequent data analysis, and re-evaluation of the data, findings,observations and conclusions expressed in this report.
Jacobs has prepared this report in accordance with the usual care and thoroughness of the consultingprofession, for the sole purpose described above and by reference to applicable standards, guidelines,procedures and practices at the date of issue of this report. For the reasons outlined above, however, no otherwarranty or guarantee, whether expressed or implied, is made as to the data, observations and findingsexpressed in this report, to the extent permitted by law.
This report should be read in full and no excerpts are to be taken as representative of the findings. Noresponsibility is accepted by Jacobs for use of any part of this report in any other context.
This report has been prepared on behalf of, and for the exclusive use of the client, and is subject to, and issuedin accordance with, the provisions of the contract between Jacobs and the client. Jacobs accepts no liability orresponsibility whatsoever for, or in respect of, any use of, or reliance upon, this report by any third party.


