32
Regression Part II • One-factor ANOVA • Another dummy variable coding scheme • Contrasts • Multiple comparisons • Interactions
| Date post: | 18-Dec-2015 |
| Category: |
Documents |
| Upload: | shannon-parker |
| View: | 222 times |
| Download: | 0 times |

Regression Part II
• One-factor ANOVA• Another dummy variable coding scheme• Contrasts• Multiple comparisons• Interactions
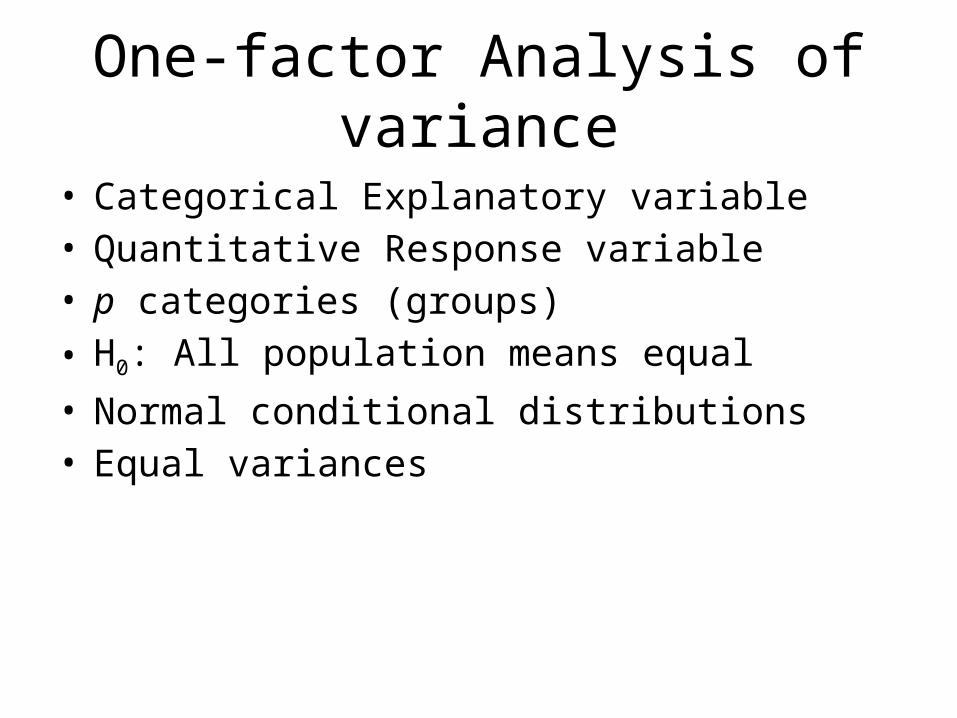
One-factor Analysis of variance
• Categorical Explanatory variable• Quantitative Response variable• p categories (groups)• H0: All population means equal• Normal conditional distributions• Equal variances
Dummy Variables
• You have seen– Indicator dummy variables with intercept– Effect coding (with intercept)
• Cell means coding is also useful at times.
A common error
• Categorical explanatory variable with p categories
• p dummy variables (rather than p-1)• And an intercept
• There are p population means represented by p+1 regression coefficients - not unique

But suppose you leave off the intercept
• Now there are p regression coefficients and p population means
• The correspondence is unique, and the model can be handy -- less algebra
• Called cell means coding
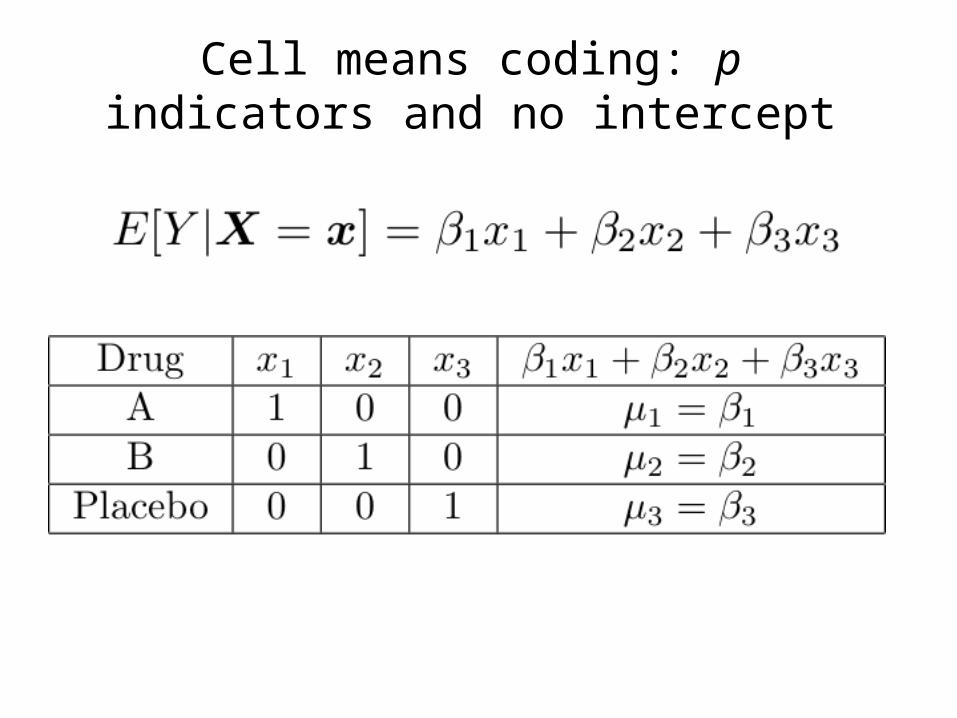
Cell means coding: p indicators and no intercept

Add a covariate: x4

Contrasts
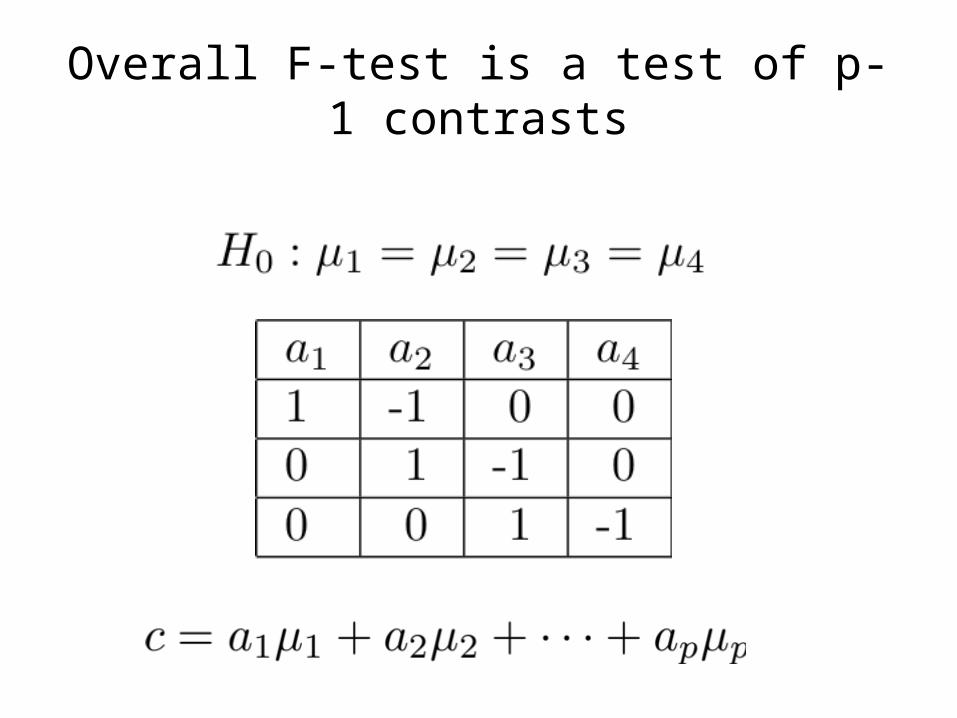
Overall F-test is a test of p-1 contrasts

In a one-factor design
• Mostly, what you want are tests of contrasts,• Or collections of contrasts.• You could do it with any dummy variable
coding scheme. • Cell means coding is often most convenient.• With β=μ, test H0: Lβ=h
• Can get a confidence interval for any single contrast using the t distribution.

Multiple Comparisons
• Most hypothesis tests are designed to be carried out in isolation
• But if you do a lot of tests and all the null hypotheses are true, the chance of rejecting at least one of them can be a lot more than α. This is inflation of the Type I error probability.
• Otherwise known as the curse of a thousand t-tests.• Multiple comparisons (sometimes called follow-up
tests, post hoc tests, probing) try to offer a solution.

Multiple Comparisons
• Protect a family of tests against Type I error at some joint significance level α
• If all the null hypotheses are true, the probability of rejecting at least one is no more than α

Multiple comparison tests of contrasts in a one-factor design
• Usual null hypothesis is μ1 = … = μp.• Usually do them after rejecting the initial
null hypothesis with an ordinary F test.• The big three are– Bonferroni– Tukey– Scheffé

Bonferroni
• Based on Bonferroni’s inequality
• Applies to any collection of k tests• Assume all k null hypotheses are true• Event Aj is that null hypothesis j is rejected.• Do the tests as usual • Reject each H0 if p < 0.05/k• Or, adjust the p-values. Multiply them by k, and
reject if pk < 0.05

Bonferroni
• Advantage: Flexible – Applies to any collection of hypothesis tests.
• Advantage: Easy to do.
• Disadvantage: Must know what all the tests are before seeing the data.
• Disadvantage: A little conservative; the true joint significance level is less than α.

Tukey (HSD)
• Based on the distribution of the largest mean minus the smallest.
• Applies only to pairwise comparisons of means.
• If sample sizes are equal, it’s most powerful, period.
• If sample sizes are not equal, it’s a bit conservative.

Scheffé
• Find the usual critical value for the initial test. Multiply by p-1. This is the Scheffé critical value.
• Family includes all contrasts: Infinitely many!• You don’t need to specify them in advance.• Based on the union-intersection principle.

General principle• The union of the critical regions is the critical
region of the overall test.• The intersection of the null hypothesis regions
is the null hypothesis region of the overall test.
• So if all the null hypotheses in the family are true, the parameter is in the null hypothesis region of the overall test.
• And the probability of rejecting at least one of the family null hypotheses is α, the significance level of the overall test.
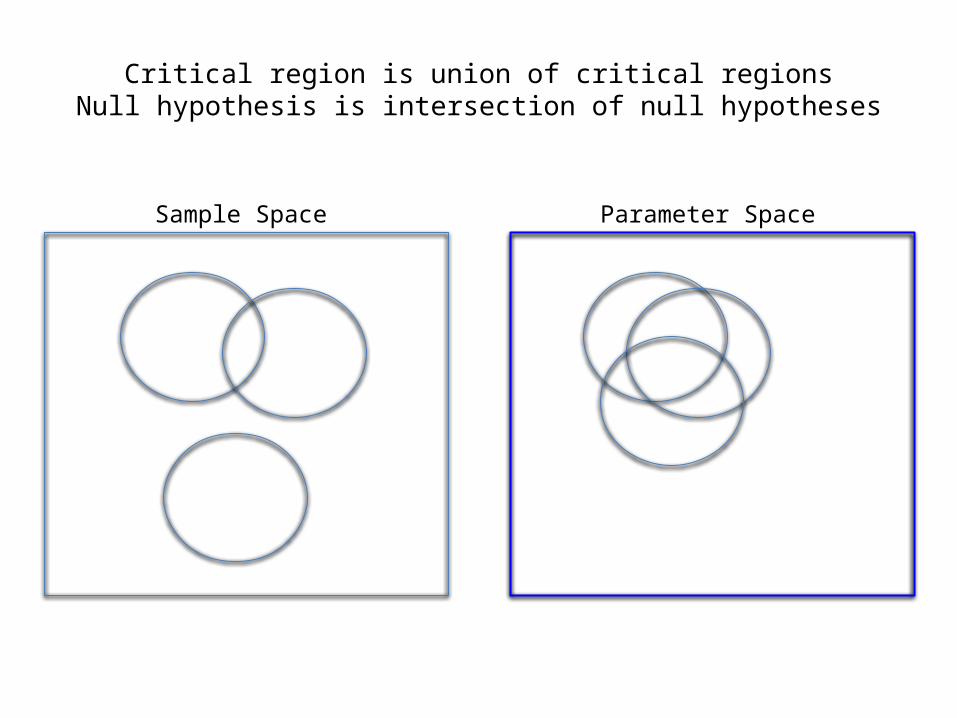
Sample Space Parameter Space
Critical region is union of critical regionsNull hypothesis is intersection of null hypotheses

Actually all you need is containment
• The union of critical regions of tests in the family must be contained in the critical region of the overall (initial) test, so if any test in the family rejects H0, the overall test does too.
• In this case the probability that at least one test in the family will wrongly reject H0 is ≤ α.
Scheffé are union-intersection tests
• Follow-up tests cannot reject H0 if the initial F-test does not. Not quite true of Bonferroni and Tukey.
• If the initial test (of p-1 contrasts) rejects H0, there is a contrast for which the Scheffé test will reject H0 (not necessarily a pairwise comparison).
• Adjusted p-value is the tail area beyond F/(p-1) using the null distribution of the initial test.

Which method should you use?
• If the sample sizes are nearly equal and you are only interested in pairwise comparisons, use Tukey because it's most powerful
• If the sample sizes are not close to equal and you are only interested in pairwise comparisons, there is (amazingly) no harm in applying all three methods and picking the one that gives you the greatest number of significant results. (It’s okay because this choice could be determined in advance based on number of treatments, α and the sample sizes.)

• If you are interested in contrasts that go beyond pairwise comparisons and you can specify all of them before seeing the data, Bonferroni is almost always more powerful than Scheffé. (Tukey is out.)
• If you want lots of special contrasts but you don't know in advance exactly what they all are, Scheffé is the only honest way to go, unless you have a separate replication data set.

Interactions
• Interaction between independent variables means “It depends.”
• Relationship between one explanatory variable and the response variable depends on the value of the other explanatory variable.
• Can have– Quantitative by quantitative– Quantitative by categorical– Categorical by categorical

Quantitative by Quantitative
For fixed x2
Both slope and intercept depend on value of x2
And for fixed x1, slope and intercept relating x2 to E(Y) depend on the value of x1

Quantitative by Categorical• One regression line for each category.• Interaction means slopes are not equal• Form a product of quantitative variable by each
dummy variable for the categorical variable• For example, three treatments and one
covariate: x1 is the covariate and x2, x3 are dummy variables

General principle
• Interaction between A and B means– Relationship of A to Y depends on value of B– Relationship of B to Y depends on value of A
• The two statements are formally equivalent

Make a table

What null hypothesis would you test for
• Equal slopes• Comparing slopes for group one vs three• Comparing slopes for group one vs two• Equal regressions• Interaction between group and x1

What to do if H0: β4=β5=0 is rejected
• How do you test Group “controlling” for x1?
• A reasonable choice is to set x1 to its sample mean, and compare treatments at that point.
• How about setting x1 to sample mean of the group (3 different values)?
• With random assignment to Group, all three means just estimate E(X1), and the mean of all the x1 values is a better estimate.

Categorical by Categorical
• Soon• But first, an example of multiple comparisons.

Copyright Information
This slide show was prepared by Jerry Brunner, Department of
Statistical Sciences, University of Toronto. It is licensed under a Creative
Commons Attribution - ShareAlike 3.0 Unported License. Use
any part of it as you like and share the result freely. These
Powerpoint slides will be available from the course website:
http://www.utstat.toronto.edu/brunner/oldclass/appliedf14


