REHABILITATION OF INFILLED NONDUCTILE CONCRETE FRAMES USING CARBON FIBER REINFORCED POLYMER Ghassan Al-Chaar, USAERDC, Champaign, IL Daniel P. Abrams, University of Illinois at Urbana-Champaign, IL Gregory E. Lamb, University of Illinois at Urbana-Champaign, IL Jonathan Trovillion, USAERDC, Champaign, IL Abstract Lessons learned from past earthquakes have led to more stringent seismic performance require- ments in current building codes. In terms of these modern seismic requirements, however, extensive inventories of older buildings are now considered to be in need of strengthening. Carbon fiber rein- forced polymer (CFRP) overlays offer one rehabilitation technique for increasing the strength and de- formation capacity of nonductile reinforced concrete frame structures. The purpose of the research pre- sented here was to investigate the effectiveness of this rehabilitation technique in improving seismic per- formance and, thus, in helping to bring older buildings into compliance with modern code requirements. A three-story, three-bay reinforced concrete frame with masonry infill panels was constructed and subjected to a series of damaging lateral forces for the purpose of assessing the effectiveness of CFRP overlays in increasing strength, stiffness, and deformation capacity. The test structure was a half- scale model designed to incorporate the essential structural characteristics of a general class of military buildings constructed in the 1950s. This specific building system lacked the seismic detailing incorpo- rated into modern construction. A prescribed cyclic loading protocol put displacement demands on the test structure representative of those expected during light, moderate, and strong earthquake motions. The damaged test structure was then strengthened with CFRP wraps intended to restore its structural in- tegrity to near-pretest condition. Prior to strengthening, damaged infill panels were replaced with new masonry and cracks in the concrete frame were injected with epoxy. Seismic performance of the reha- bilitated structure was then re-evaluated using a series of reversed and repeated lateral displacements and forces. This paper compares the load-deformation performance of the rehabilitated test structure with that of the original frame-infill system. Test results are discussed with respect to measurements of strength, stiffness, and deformation capacity as well as observed damage patterns and apparent perform- ance limit states. Keywords Masonry, rehabilitation, seismic, earthquakes, carbon fiber reinforced polymer, nonductile con- crete frames, infills.
Transcript
REHABILITATION OF INFILLED NONDUCTILE CONCRETE FRAMES USING CARBON FIBER REINFORCED POLYMER
Ghassan Al-Chaar, USAERDC, Champaign, IL
Daniel P. Abrams, University of Illinois at Urbana-Champaign, IL
Gregory E. Lamb, University of Illinois at Urbana-Champaign, IL
Jonathan Trovillion, USAERDC, Champaign, IL
Abstract Lessons learned from past earthquakes have led to more stringent seismic performance require-ments in current building codes. In terms of these modern seismic requirements, however, extensive inventories of older buildings are now considered to be in need of strengthening. Carbon fiber rein-forced polymer (CFRP) overlays offer one rehabilitation technique for increasing the strength and de-formation capacity of nonductile reinforced concrete frame structures. The purpose of the research pre-sented here was to investigate the effectiveness of this rehabilitation technique in improving seismic per-formance and, thus, in helping to bring older buildings into compliance with modern code requirements. A three-story, three-bay reinforced concrete frame with masonry infill panels was constructed and subjected to a series of damaging lateral forces for the purpose of assessing the effectiveness of CFRP overlays in increasing strength, stiffness, and deformation capacity. The test structure was a half-scale model designed to incorporate the essential structural characteristics of a general class of military buildings constructed in the 1950s. This specific building system lacked the seismic detailing incorpo-rated into modern construction. A prescribed cyclic loading protocol put displacement demands on the test structure representative of those expected during light, moderate, and strong earthquake motions. The damaged test structure was then strengthened with CFRP wraps intended to restore its structural in-tegrity to near-pretest condition. Prior to strengthening, damaged infill panels were replaced with new masonry and cracks in the concrete frame were injected with epoxy. Seismic performance of the reha-bilitated structure was then re-evaluated using a series of reversed and repeated lateral displacements and forces. This paper compares the load-deformation performance of the rehabilitated test structure with that of the original frame-infill system. Test results are discussed with respect to measurements of strength, stiffness, and deformation capacity as well as observed damage patterns and apparent perform-ance limit states. Keywords Masonry, rehabilitation, seismic, earthquakes, carbon fiber reinforced polymer, nonductile con-crete frames, infills.
2
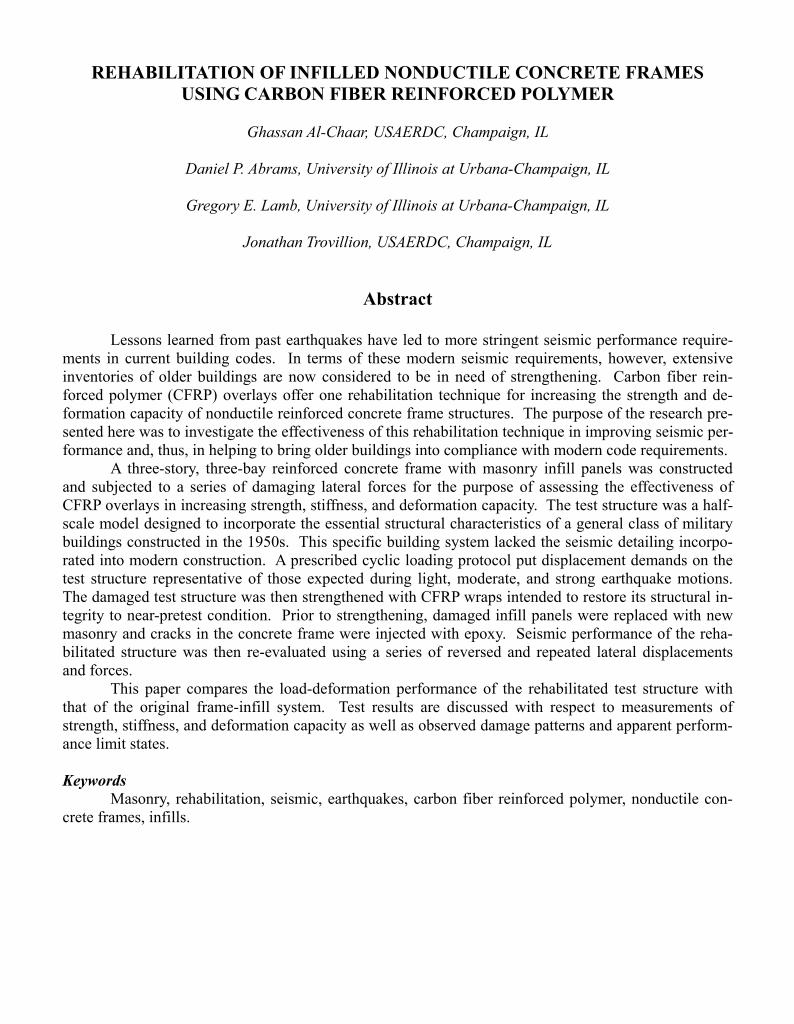
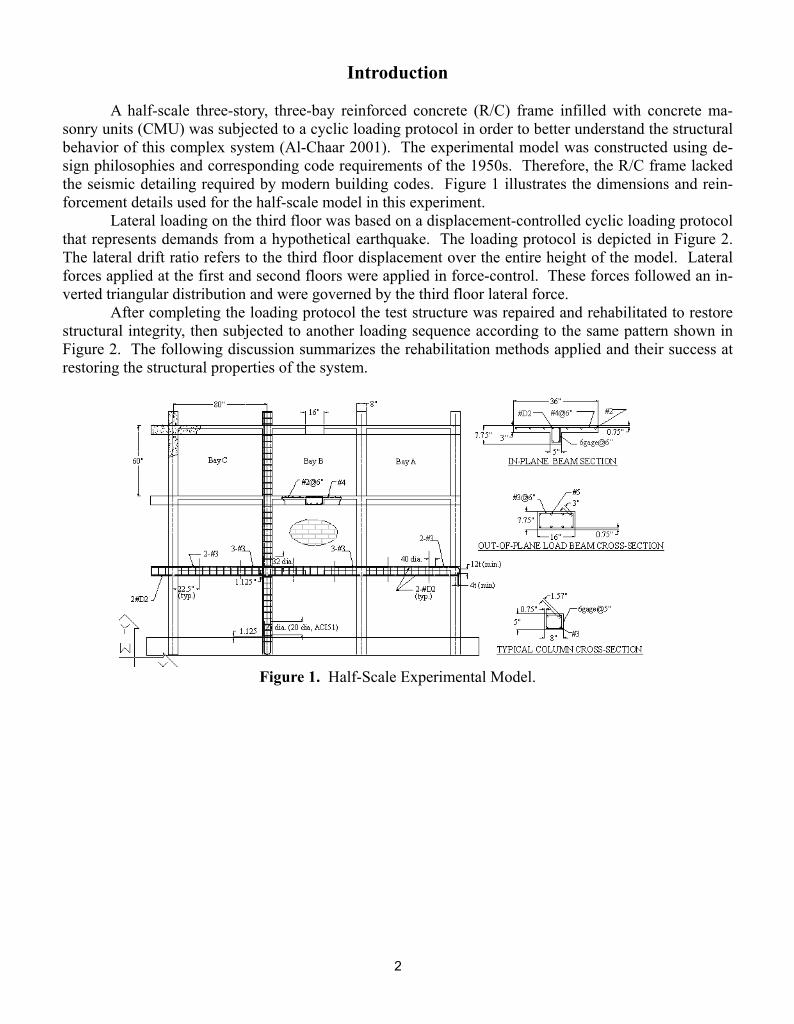
Introduction A half-scale three-story, three-bay reinforced concrete (R/C) frame infilled with concrete ma-sonry units (CMU) was subjected to a cyclic loading protocol in order to better understand the structural behavior of this complex system (Al-Chaar 2001). The experimental model was constructed using de-sign philosophies and corresponding code requirements of the 1950s. Therefore, the R/C frame lacked the seismic detailing required by modern building codes. Figure 1 illustrates the dimensions and rein-forcement details used for the half-scale model in this experiment. Lateral loading on the third floor was based on a displacement-controlled cyclic loading protocol that represents demands from a hypothetical earthquake. The loading protocol is depicted in Figure 2. The lateral drift ratio refers to the third floor displacement over the entire height of the model. Lateral forces applied at the first and second floors were applied in force-control. These forces followed an in-verted triangular distribution and were governed by the third floor lateral force. After completing the loading protocol the test structure was repaired and rehabilitated to restore structural integrity, then subjected to another loading sequence according to the same pattern shown in Figure 2. The following discussion summarizes the rehabilitation methods applied and their success at restoring the structural properties of the system.
Figure 1. Half-Scale Experimental Model.
3
-2
-1.5
-1
-0.5
0
0.5
1
1.5
2
0 20 40 60 80 100 120 140 160 180
Time (min)
Dri
ft R
atio
(%)
Figure 2. Cyclic Loading History.
Rehabilitation
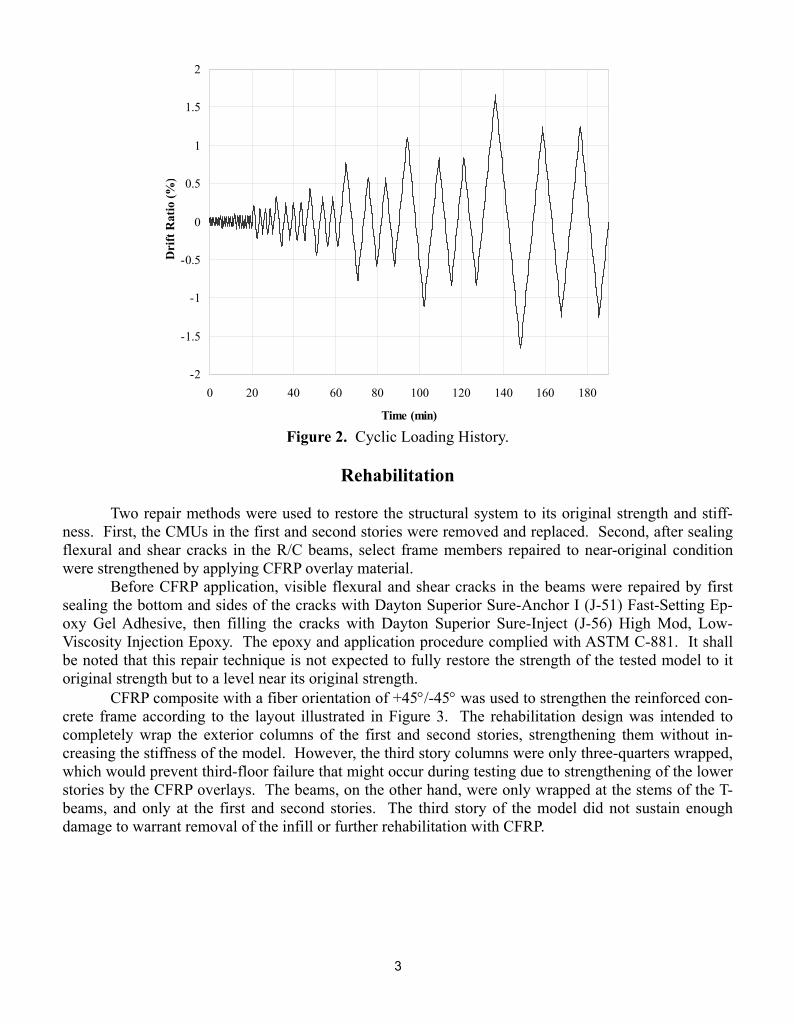
Two repair methods were used to restore the structural system to its original strength and stiff-ness. First, the CMUs in the first and second stories were removed and replaced. Second, after sealing flexural and shear cracks in the R/C beams, select frame members repaired to near-original condition were strengthened by applying CFRP overlay material. Before CFRP application, visible flexural and shear cracks in the beams were repaired by first sealing the bottom and sides of the cracks with Dayton Superior Sure-Anchor I (J-51) Fast-Setting Ep-oxy Gel Adhesive, then filling the cracks with Dayton Superior Sure-Inject (J-56) High Mod, Low-Viscosity Injection Epoxy. The epoxy and application procedure complied with ASTM C-881. It shall be noted that this repair technique is not expected to fully restore the strength of the tested model to it original strength but to a level near its original strength. CFRP composite with a fiber orientation of +45°/-45° was used to strengthen the reinforced con-crete frame according to the layout illustrated in Figure 3. The rehabilitation design was intended to completely wrap the exterior columns of the first and second stories, strengthening them without in-creasing the stiffness of the model. However, the third story columns were only three-quarters wrapped, which would prevent third-floor failure that might occur during testing due to strengthening of the lower stories by the CFRP overlays. The beams, on the other hand, were only wrapped at the stems of the T-beams, and only at the first and second stories. The third story of the model did not sustain enough damage to warrant removal of the infill or further rehabilitation with CFRP.
4
Col. d Col. c Col. b Col. a
Beam 1
Beam 2
Beam 3
Figure 3. CFRP Placement. The CFRP was applied using a wet lay-up system. The dry sheets of the material were cut to the correct dimensions and impregnated with a saturating resin. The saturating resin, along with the com-patible primer and putty, were used to bond the carbon fiber to the concrete surface. The primer was ap-plied to penetrate the surface of the concrete and provide improved adhesive bonding for the saturating resin. The putty filler was used to smooth rough corners and fill voids in the concrete in order to provide a more reliable bond between the carbon fiber and the concrete. The saturating resin provided a load path between the concrete and the carbon fibers, and between the fibers themselves. The placement of the CFRP on the first- and second-floor beams was determined according to ACI 440-00 Chapter 9 using the following assumptions with respect to flexural resistance: • Design calculations were based on the actual dimensions, reinforcing steel arrangement, and material
properties of the existing member being strengthened. • Strains in the reinforcement, concrete, and FRP were directly proportional to the distance from the
neutral axis (that is, a plane section before loading remains plane after loading). • Maximum useable compressive strain in the concrete was 0.003. • The tensile strength of concrete was neglected. • CFRP reinforcement is assumed to have a linear elastic stress-strain relationship to failure. This as-
sumption is not valid for high level of deformation where the CFRP will behave as an inelastic nonlinear material.
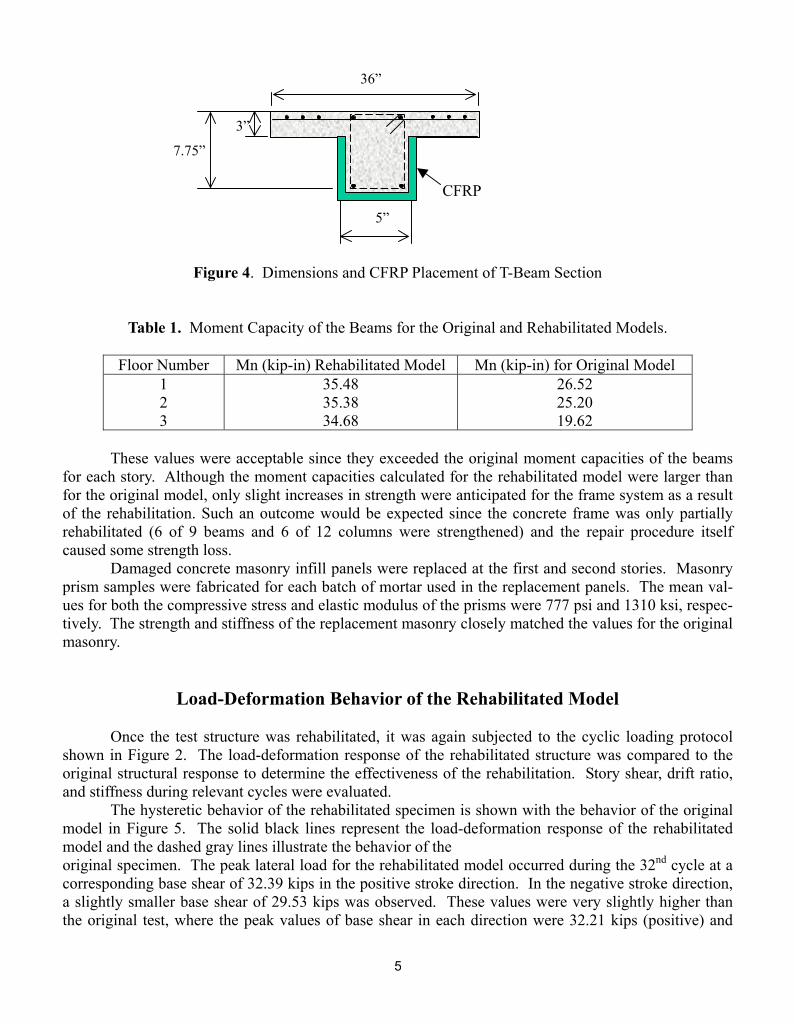
• A perfect bond existed between the concrete and FRP reinforcement. The goal of the CFRP rehabilitation was to regain the original moment capacities of the beams in the undamaged frame. A single ply of CFRP was applied to the stems of the damaged T-beams (see Fig-ure 4). The CFRP was 0.0371 inches thick, with a tensile strength of 10.85 ksi and an initial modulus of elasticity of 1281 ksi. The moment capacities were calculated following ACI 440-00 Equation 9.2 ex-cept for including the contribution of the CFRP applied to the sides of the beam. The resulting moment capacities are tabulated in Table 1 for all three floors of the original and rehabilitated models.
5
Figure 4. Dimensions and CFRP Placement of T-Beam Section
Table 1. Moment Capacity of the Beams for the Original and Rehabilitated Models.
Floor Number Mn (kip-in) Rehabilitated Model Mn (kip-in) for Original Model 1 2 3
35.48 35.38 34.68
26.52 25.20 19.62
These values were acceptable since they exceeded the original moment capacities of the beams for each story. Although the moment capacities calculated for the rehabilitated model were larger than for the original model, only slight increases in strength were anticipated for the frame system as a result of the rehabilitation. Such an outcome would be expected since the concrete frame was only partially rehabilitated (6 of 9 beams and 6 of 12 columns were strengthened) and the repair procedure itself caused some strength loss. Damaged concrete masonry infill panels were replaced at the first and second stories. Masonry prism samples were fabricated for each batch of mortar used in the replacement panels. The mean val-ues for both the compressive stress and elastic modulus of the prisms were 777 psi and 1310 ksi, respec-tively. The strength and stiffness of the replacement masonry closely matched the values for the original masonry.
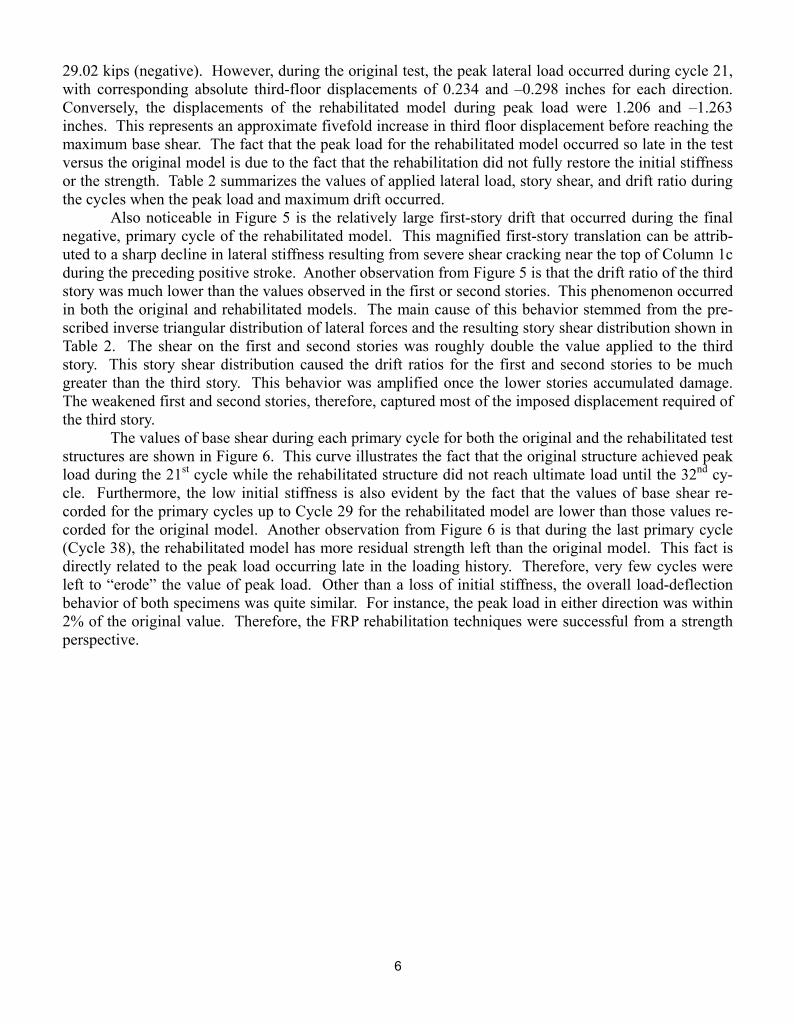
Load-Deformation Behavior of the Rehabilitated Model Once the test structure was rehabilitated, it was again subjected to the cyclic loading protocol shown in Figure 2. The load-deformation response of the rehabilitated structure was compared to the original structural response to determine the effectiveness of the rehabilitation. Story shear, drift ratio, and stiffness during relevant cycles were evaluated. The hysteretic behavior of the rehabilitated specimen is shown with the behavior of the original model in Figure 5. The solid black lines represent the load-deformation response of the rehabilitated model and the dashed gray lines illustrate the behavior of the original specimen. The peak lateral load for the rehabilitated model occurred during the 32nd cycle at a corresponding base shear of 32.39 kips in the positive stroke direction. In the negative stroke direction, a slightly smaller base shear of 29.53 kips was observed. These values were very slightly higher than the original test, where the peak values of base shear in each direction were 32.21 kips (positive) and
5”
36”
7.75”
3”
CFRP
6
29.02 kips (negative). However, during the original test, the peak lateral load occurred during cycle 21, with corresponding absolute third-floor displacements of 0.234 and –0.298 inches for each direction. Conversely, the displacements of the rehabilitated model during peak load were 1.206 and –1.263 inches. This represents an approximate fivefold increase in third floor displacement before reaching the maximum base shear. The fact that the peak load for the rehabilitated model occurred so late in the test versus the original model is due to the fact that the rehabilitation did not fully restore the initial stiffness or the strength. Table 2 summarizes the values of applied lateral load, story shear, and drift ratio during the cycles when the peak load and maximum drift occurred. Also noticeable in Figure 5 is the relatively large first-story drift that occurred during the final negative, primary cycle of the rehabilitated model. This magnified first-story translation can be attrib-uted to a sharp decline in lateral stiffness resulting from severe shear cracking near the top of Column 1c during the preceding positive stroke. Another observation from Figure 5 is that the drift ratio of the third story was much lower than the values observed in the first or second stories. This phenomenon occurred in both the original and rehabilitated models. The main cause of this behavior stemmed from the pre-scribed inverse triangular distribution of lateral forces and the resulting story shear distribution shown in Table 2. The shear on the first and second stories was roughly double the value applied to the third story. This story shear distribution caused the drift ratios for the first and second stories to be much greater than the third story. This behavior was amplified once the lower stories accumulated damage. The weakened first and second stories, therefore, captured most of the imposed displacement required of the third story. The values of base shear during each primary cycle for both the original and the rehabilitated test structures are shown in Figure 6. This curve illustrates the fact that the original structure achieved peak load during the 21st cycle while the rehabilitated structure did not reach ultimate load until the 32nd cy-cle. Furthermore, the low initial stiffness is also evident by the fact that the values of base shear re-corded for the primary cycles up to Cycle 29 for the rehabilitated model are lower than those values re-corded for the original model. Another observation from Figure 6 is that during the last primary cycle (Cycle 38), the rehabilitated model has more residual strength left than the original model. This fact is directly related to the peak load occurring late in the loading history. Therefore, very few cycles were left to “erode” the value of peak load. Other than a loss of initial stiffness, the overall load-deflection behavior of both specimens was quite similar. For instance, the peak load in either direction was within 2% of the original value. Therefore, the FRP rehabilitation techniques were successful from a strength perspective.
7
Drift Ratio (%)
-3 -2 -1 0 1 2 3
Stor
y Sh
ear (
kips
)
-40
-20
0
20
40-3 -2 -1 0 1 2 3
Stor
y Sh
ear (
kips
)
-40
-20
0
20
40-3 -2 -1 0 1 2 3
Stor
y Sh
ear (
kips
)
-40
-20
0
20
40
Floor 3
Floor 2
Floor 1
Figure 5. Load-Deformation Behavior for Each Story of the Original and Rehabilitated Test Structures.
8
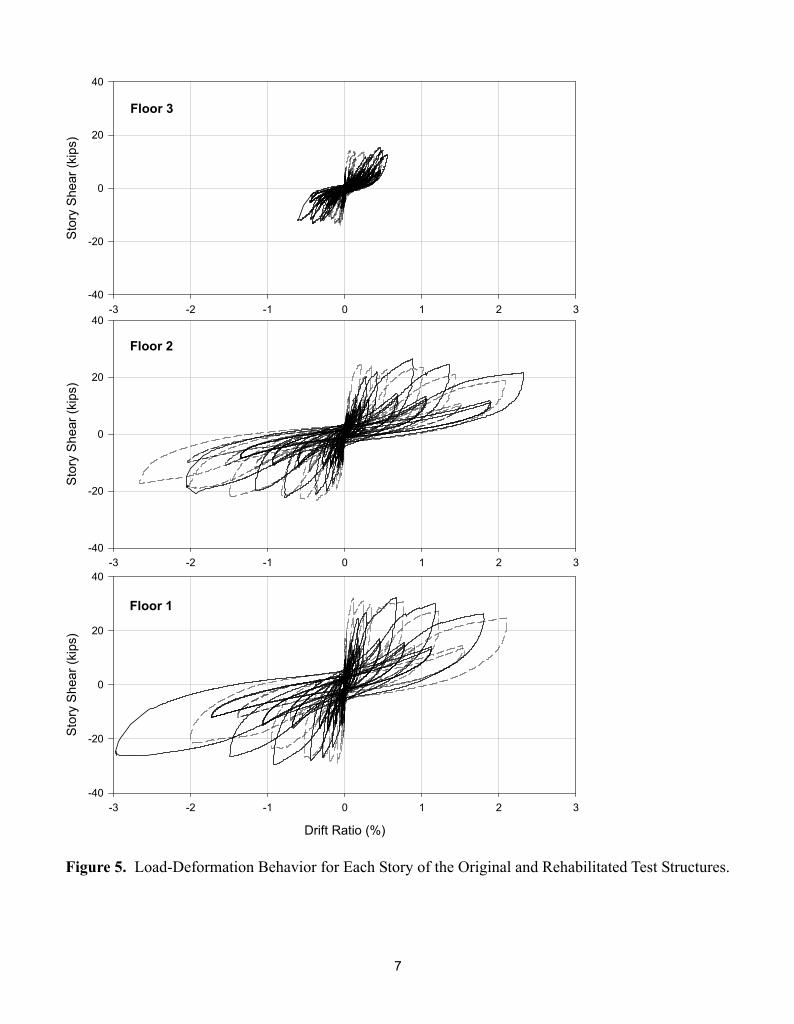
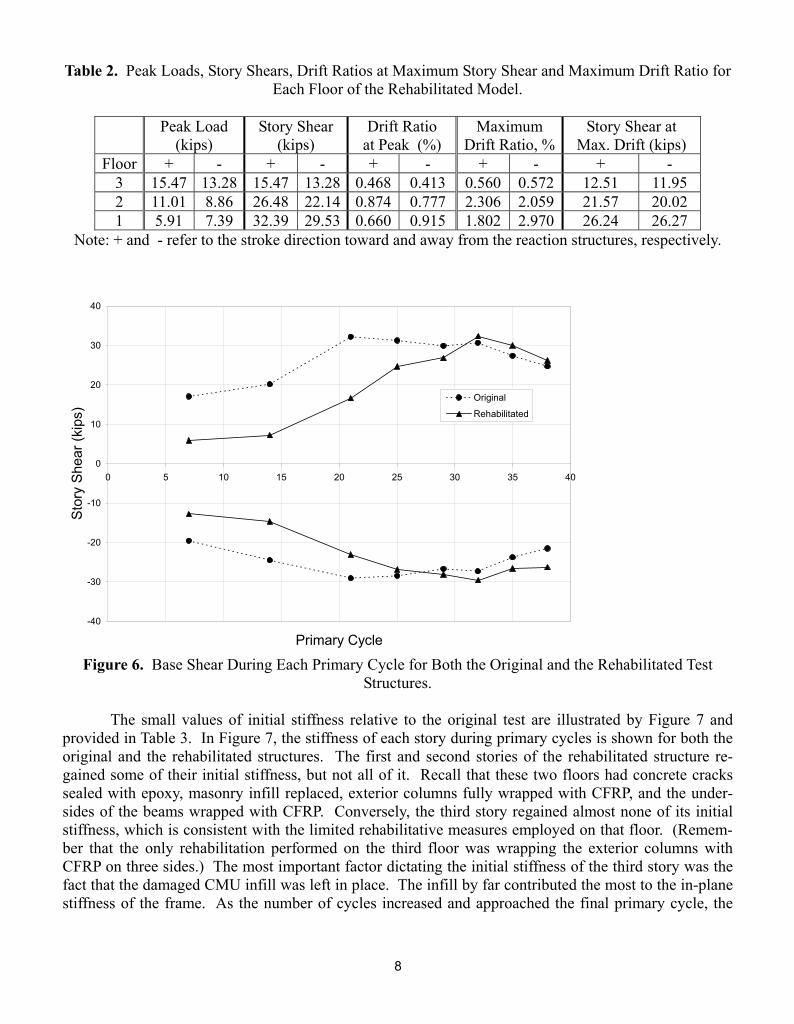
Table 2. Peak Loads, Story Shears, Drift Ratios at Maximum Story Shear and Maximum Drift Ratio for Each Floor of the Rehabilitated Model.
Note: + and - refer to the stroke direction toward and away from the reaction structures, respectively.
Figure 6. Base Shear During Each Primary Cycle for Both the Original and the Rehabilitated Test Structures.
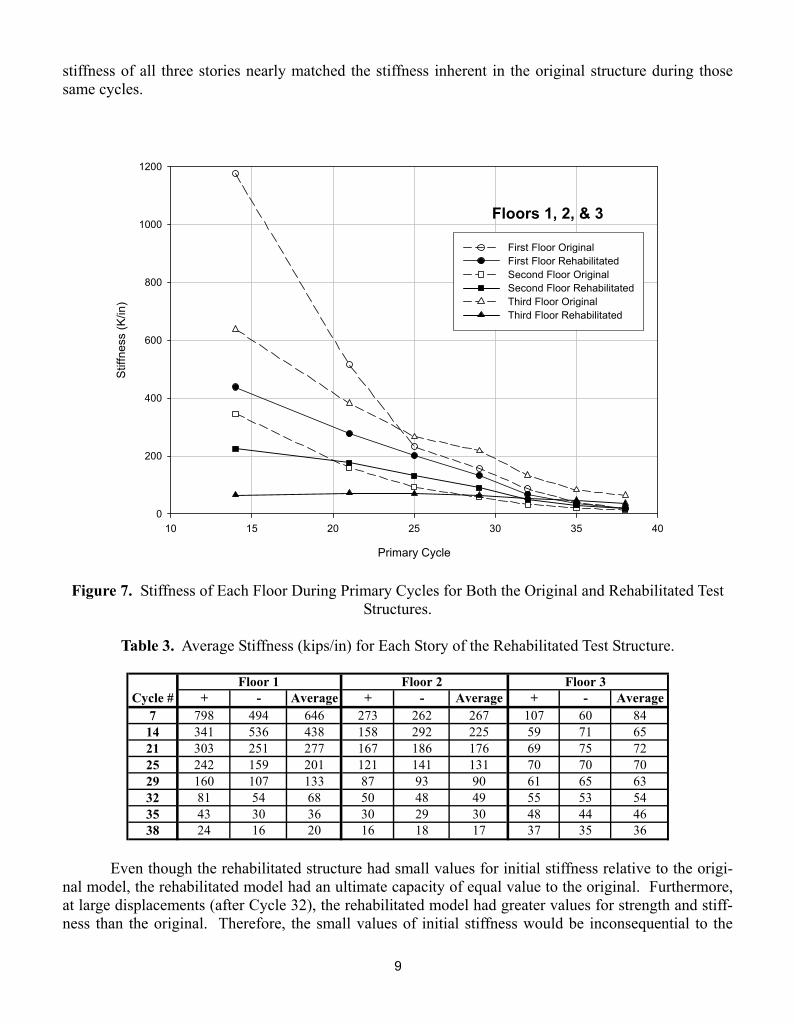
The small values of initial stiffness relative to the original test are illustrated by Figure 7 and provided in Table 3. In Figure 7, the stiffness of each story during primary cycles is shown for both the original and the rehabilitated structures. The first and second stories of the rehabilitated structure re-gained some of their initial stiffness, but not all of it. Recall that these two floors had concrete cracks sealed with epoxy, masonry infill replaced, exterior columns fully wrapped with CFRP, and the under-sides of the beams wrapped with CFRP. Conversely, the third story regained almost none of its initial stiffness, which is consistent with the limited rehabilitative measures employed on that floor. (Remem-ber that the only rehabilitation performed on the third floor was wrapping the exterior columns with CFRP on three sides.) The most important factor dictating the initial stiffness of the third story was the fact that the damaged CMU infill was left in place. The infill by far contributed the most to the in-plane stiffness of the frame. As the number of cycles increased and approached the final primary cycle, the
-40
-30
-20
-10
0
10
20
30
40
0 5 10 15 20 25 30 35 40
Primary Cycle
Stor
y Sh
ear (
kips
)
Original
Rehabilitated
9
stiffness of all three stories nearly matched the stiffness inherent in the original structure during those same cycles.
Primary Cycle
10 15 20 25 30 35 40
Stiff
ness
(K/in
)
0
200
400
600
800
1000
1200
First Floor OriginalFirst Floor RehabilitatedSecond Floor OriginalSecond Floor RehabilitatedThird Floor Original Third Floor Rehabilitated
Floors 1, 2, & 3
Figure 7. Stiffness of Each Floor During Primary Cycles for Both the Original and Rehabilitated Test Structures.
Table 3. Average Stiffness (kips/in) for Each Story of the Rehabilitated Test Structure.
Floor 1 Floor 2 Floor 3
Cycle # + - Average + - Average + - Average7 798 494 646 273 262 267 107 60 84
Even though the rehabilitated structure had small values for initial stiffness relative to the origi-nal model, the rehabilitated model had an ultimate capacity of equal value to the original. Furthermore, at large displacements (after Cycle 32), the rehabilitated model had greater values for strength and stiff-ness than the original. Therefore, the small values of initial stiffness would be inconsequential to the
10
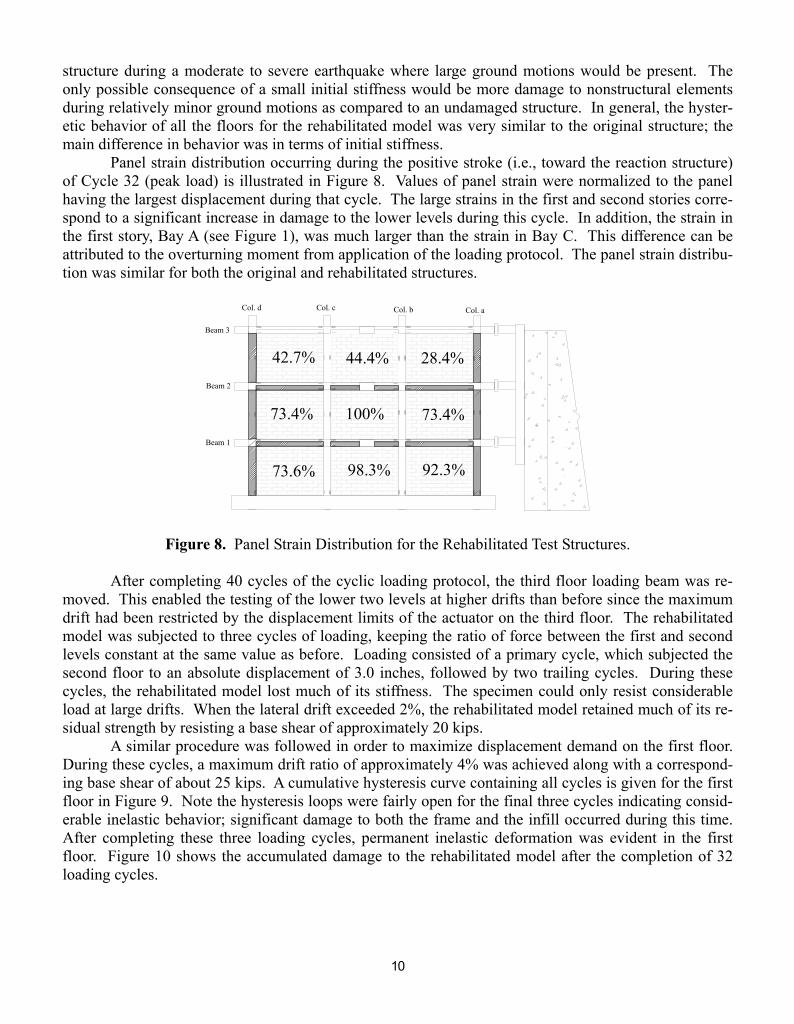
structure during a moderate to severe earthquake where large ground motions would be present. The only possible consequence of a small initial stiffness would be more damage to nonstructural elements during relatively minor ground motions as compared to an undamaged structure. In general, the hyster-etic behavior of all the floors for the rehabilitated model was very similar to the original structure; the main difference in behavior was in terms of initial stiffness. Panel strain distribution occurring during the positive stroke (i.e., toward the reaction structure) of Cycle 32 (peak load) is illustrated in Figure 8. Values of panel strain were normalized to the panel having the largest displacement during that cycle. The large strains in the first and second stories corre-spond to a significant increase in damage to the lower levels during this cycle. In addition, the strain in the first story, Bay A (see Figure 1), was much larger than the strain in Bay C. This difference can be attributed to the overturning moment from application of the loading protocol. The panel strain distribu-tion was similar for both the original and rehabilitated structures.
Col. d Col. c Col. b Col. a
Beam 1
Beam 2
Beam 3
42.7% 44.4% 28.4%
73.4% 73.4%
73.6% 98.3% 92.3%
100%100%
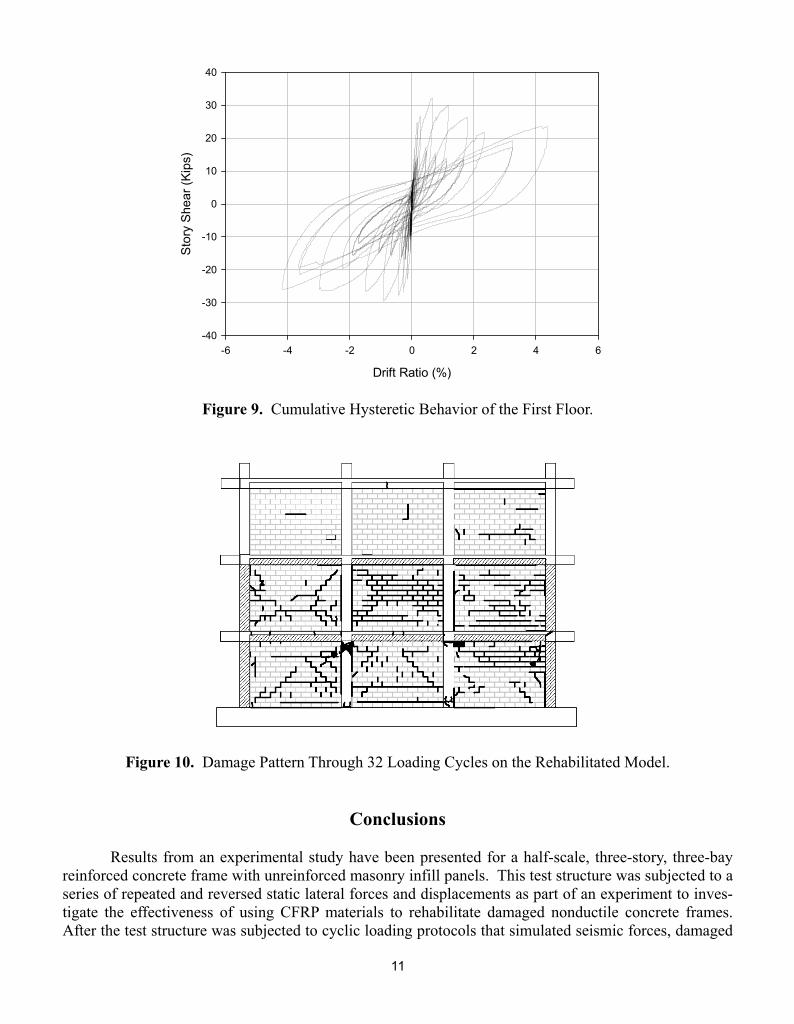
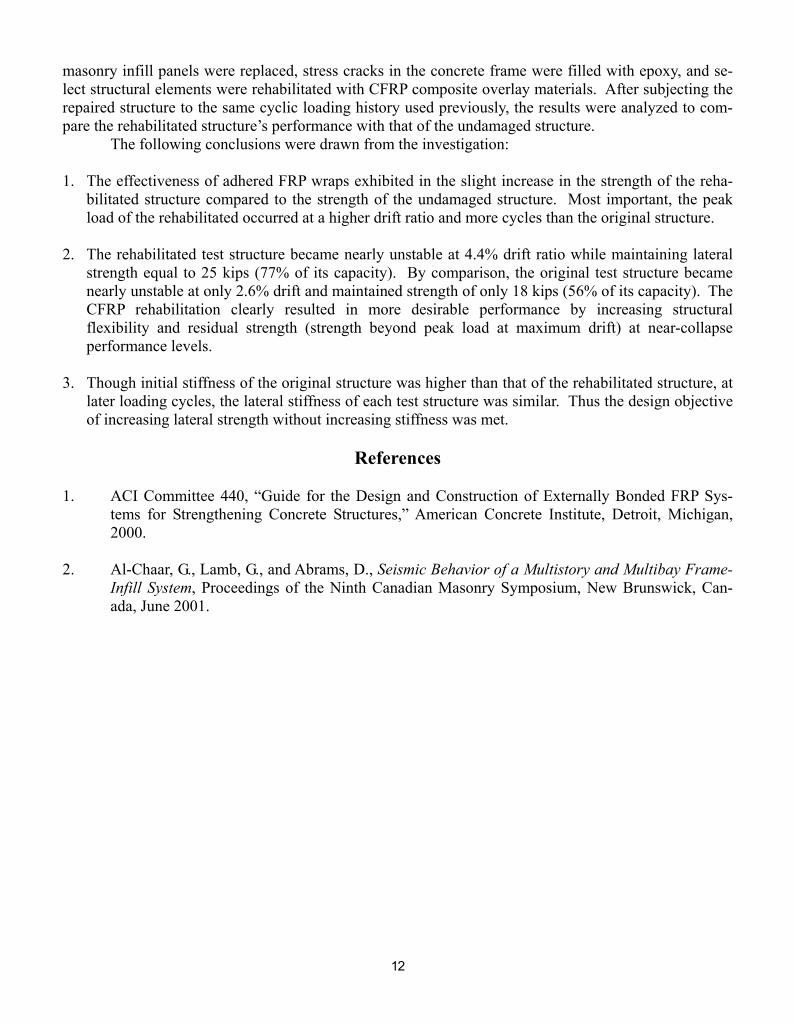
Figure 8. Panel Strain Distribution for the Rehabilitated Test Structures. After completing 40 cycles of the cyclic loading protocol, the third floor loading beam was re-moved. This enabled the testing of the lower two levels at higher drifts than before since the maximum drift had been restricted by the displacement limits of the actuator on the third floor. The rehabilitated model was subjected to three cycles of loading, keeping the ratio of force between the first and second levels constant at the same value as before. Loading consisted of a primary cycle, which subjected the second floor to an absolute displacement of 3.0 inches, followed by two trailing cycles. During these cycles, the rehabilitated model lost much of its stiffness. The specimen could only resist considerable load at large drifts. When the lateral drift exceeded 2%, the rehabilitated model retained much of its re-sidual strength by resisting a base shear of approximately 20 kips. A similar procedure was followed in order to maximize displacement demand on the first floor. During these cycles, a maximum drift ratio of approximately 4% was achieved along with a correspond-ing base shear of about 25 kips. A cumulative hysteresis curve containing all cycles is given for the first floor in Figure 9. Note the hysteresis loops were fairly open for the final three cycles indicating consid-erable inelastic behavior; significant damage to both the frame and the infill occurred during this time. After completing these three loading cycles, permanent inelastic deformation was evident in the first floor. Figure 10 shows the accumulated damage to the rehabilitated model after the completion of 32 loading cycles.
11
Drift Ratio (%)
-6 -4 -2 0 2 4 6
Stor
y Sh
ear (
Kips
)
-40
-30
-20
-10
0
10
20
30
40
Figure 9. Cumulative Hysteretic Behavior of the First Floor.
Figure 10. Damage Pattern Through 32 Loading Cycles on the Rehabilitated Model.
Conclusions Results from an experimental study have been presented for a half-scale, three-story, three-bay reinforced concrete frame with unreinforced masonry infill panels. This test structure was subjected to a series of repeated and reversed static lateral forces and displacements as part of an experiment to inves-tigate the effectiveness of using CFRP materials to rehabilitate damaged nonductile concrete frames. After the test structure was subjected to cyclic loading protocols that simulated seismic forces, damaged
12
masonry infill panels were replaced, stress cracks in the concrete frame were filled with epoxy, and se-lect structural elements were rehabilitated with CFRP composite overlay materials. After subjecting the repaired structure to the same cyclic loading history used previously, the results were analyzed to com-pare the rehabilitated structure’s performance with that of the undamaged structure. The following conclusions were drawn from the investigation: 1. The effectiveness of adhered FRP wraps exhibited in the slight increase in the strength of the reha-
bilitated structure compared to the strength of the undamaged structure. Most important, the peak load of the rehabilitated occurred at a higher drift ratio and more cycles than the original structure.
2. The rehabilitated test structure became nearly unstable at 4.4% drift ratio while maintaining lateral
strength equal to 25 kips (77% of its capacity). By comparison, the original test structure became nearly unstable at only 2.6% drift and maintained strength of only 18 kips (56% of its capacity). The CFRP rehabilitation clearly resulted in more desirable performance by increasing structural flexibility and residual strength (strength beyond peak load at maximum drift) at near-collapse performance levels.
3. Though initial stiffness of the original structure was higher than that of the rehabilitated structure, at
later loading cycles, the lateral stiffness of each test structure was similar. Thus the design objective of increasing lateral strength without increasing stiffness was met.
References
1. ACI Committee 440, “Guide for the Design and Construction of Externally Bonded FRP Sys-
tems for Strengthening Concrete Structures,” American Concrete Institute, Detroit, Michigan, 2000.
2. Al-Chaar, G., Lamb, G., and Abrams, D., Seismic Behavior of a Multistory and Multibay Frame-
Infill System, Proceedings of the Ninth Canadian Masonry Symposium, New Brunswick, Can-ada, June 2001.