Relating Hot Mix Asphalt Pavement Density to Performance Dr. Walaa S. Mogawer, PI Dr. Jo Sias Daniel, Co PI Alexander J. Austerman Prepared for The New England Transportation Consortium April 1 st , 2010 NETCR76 NETC 02-1 This report, prepared in cooperation with the New England Transportation Consortium, does not constitute a standard, specification, or regulation. The contents of this report reflect the views of the authors who are responsible for the facts and the accuracy of the data presented herein. The contents do not necessarily reflect the views of the New England Transportation Consortium or the Federal Highway Administration. i
Transcript
Relating Hot Mix Asphalt Pavement Density to Performance
Dr. Walaa S. Mogawer, PI Dr. Jo Sias Daniel, Co PI Alexander J. Austerman
Prepared for
The New England Transportation Consortium April 1st, 2010
NETCR76 NETC 02-1 This report, prepared in cooperation with the New England Transportation Consortium, does not constitute a standard, specification, or regulation. The contents of this report reflect the views of the authors who are responsible for the facts and the accuracy of the data presented herein. The contents do not necessarily reflect the views of the New England Transportation Consortium or the Federal Highway Administration.
i
ii
ACKNOWLEDGEMENTS
The following are the members of the Technical Committee that developed the scope of work for the project and provided technical oversight throughout the course of the research: Richard Bradbury, Maine Department of Transportation, Chairman Edgardo Block, Connecticut Department of Transportation Brian Kulacz, New Hampshire Department of Transportation Francis Manning, Rhode Island Department of Transportation Edward Naras, Massachusetts Highway Department Timothy Pockette, Vermont Agency of Transportation Zoeb Zavery, New York State Department of Transportation
Professor Walaa S. Mogawer, PE – Principal Investigator (PI) Alexander J. Austerman Professor Jo Sias Daniel, PE – Co-PI
NETCR76
9. Performing Organization Name and Address
Department of Civil and Environmental Engineering University of Massachusetts Dartmouth 285 Old Westport Road North Dartmouth, MA 02747
10 Work Unit No. (TRAIS)
N/A
N/A 11. Contract or Grant No.
N/A 13. Type of Report and Period Covered
12. Sponsoring Agency Name and Address
New England Transportation Consortium C/O Advanced Technology & Manufacturing Center University of Massachusetts Dartmouth 151 Martine Street Fall River, MA 02723
Final Report
14. Sponsoring Agency Code
NETC 02-1 A study conducted in cooperation with the U.S. DOT
15 Supplementary Notes
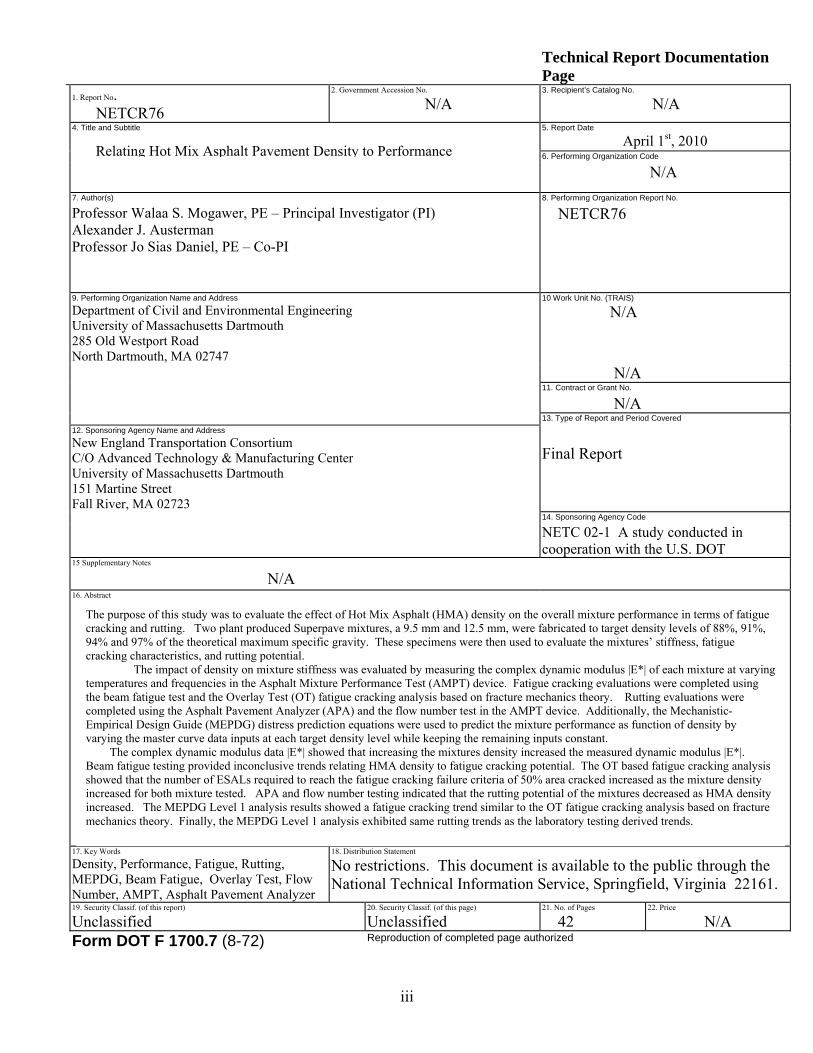
N/A 16. Abstract
17. Key Words
Density, Performance, Fatigue, Rutting, MEPDG, Beam Fatigue, Overlay Test, Flow Number, AMPT, Asp alt Pavement Analyzer h
18. Distribution Statement
No restrictions. This document is available to the public through the National Technical Information Service, Springfield, Virginia 22161.
19. Security Classif. (of this report) Unclassified
20. Security Classif. (of this page) Unclassified
21. No. of Pages
42 22. Price
N/A Form DOT F 1700.7 (8-72) Reproduction of completed page authorized
The purpose of this study was to evaluate the effect of Hot Mix Asphalt (HMA) density on the overall mixture performance in terms of fatigue cracking and rutting. Two plant produced Superpave mixtures, a 9.5 mm and 12.5 mm, were fabricated to target density levels of 88%, 91%, 94% and 97% of the theoretical maximum specific gravity. These specimens were then used to evaluate the mixtures’ stiffness, fatigue cracking characteristics, and rutting potential.
The impact of density on mixture stiffness was evaluated by measuring the complex dynamic modulus |E*| of each mixture at varying temperatures and frequencies in the Asphalt Mixture Performance Test (AMPT) device. Fatigue cracking evaluations were completed using the beam fatigue test and the Overlay Test (OT) fatigue cracking analysis based on fracture mechanics theory. Rutting evaluations were completed using the Asphalt Pavement Analyzer (APA) and the flow number test in the AMPT device. Additionally, the Mechanistic-Empirical Design Guide (MEPDG) distress prediction equations were used to predict the mixture performance as function of density by varying the master curve data inputs at each target density level while keeping the remaining inputs constant.
The complex dynamic modulus data |E*| showed that increasing the mixtures density increased the measured dynamic modulus |E*|. Beam fatigue testing provided inconclusive trends relating HMA density to fatigue cracking potential. The OT based fatigue cracking analysis showed that the number of ESALs required to reach the fatigue cracking failure criteria of 50% area cracked increased as the mixture density increased for both mixture tested. APA and flow number testing indicated that the rutting potential of the mixtures decreased as HMA density increased. The MEPDG Level 1 analysis results showed a fatigue cracking trend similar to the OT fatigue cracking analysis based on fracture mechanics theory. Finally, the MEPDG Level 1 analysis exhibited same rutting trends as the laboratory testing derived trends.
Relating Hot Mix Asphalt Pavement Density to Performance
iii
Metric Conversion Factors
iv
Table of Contents
Technical Report Documentation Page ......................................................................... iii Metric Conversion Factors.............................................................................................. iv List of Tables .................................................................................................................... vi List of Figures................................................................................................................... vi List of Acronyms ............................................................................................................. vii 1.0 Introduction................................................................................................................. 1 2.0 Objectives..................................................................................................................... 2 3.0 Experimental Plan ...................................................................................................... 3 4.0 Mixture Designs .......................................................................................................... 3 5.0 Specimen Fabrication ................................................................................................. 6 6.0 Effect of HMA Density on Mixture Stiffness............................................................ 6
7.0 Effect of HMA Density on the Mixture Fatigue Cracking Characteristics........ 10 7.1 Flexural Beam Fatigue Testing ............................................................................ 10
10.0 Summary and Conclusions..................................................................................... 32 11.0 References................................................................................................................ 33
v
List of Tables Table 1. 9.5 mm and 12.5 mm Plant Produced Mixture Properties................................................. 5 Table 2. 9.5 mm and 12.5 mm Plant Produced Mixture Volumetrics ............................................. 5 Table 3. 9.5 mm Dynamic Modulus Specimen Densities ............................................................... 6 Table 4. 12.5 mm Dynamic Modulus Specimen Densities ............................................................. 7 Table 5. Flexural Beam Fatigue Testing Results........................................................................... 11 Table 6. Calculated Endurance Limit for Asphalt Mixtures Tested for Flexural Beam Fatigue... 13 Table 7. 9.5 mm Overlay Specimen Density, Test Results, and Fracture Properties .................... 15 Table 8. 12.5 mm Overlay Specimen Density, Test Results, and Fracture Properties .................. 16 Table 9. 9.5 mm Fracture Mechanics Prediction of ESALs Resulting in 50% Fatigue Cracking
Area....................................................................................................................................... 20 Table 10. 12.5 mm Fracture Mechanics Prediction of ESALs Resulting in 50% Fatigue Cracking
Area....................................................................................................................................... 20 Table 11. 9.5 mm APA Specimen Densities and Test Results...................................................... 21 Table 12. 12.5 mm APA Specimen Densities and Test Results .................................................... 21 Table 13. 9.5 mm Flow Number Specimen Densities and Test Results........................................ 24 Table 14. 12.5 mm Flow Number Specimen Densities and Test Results...................................... 25 Table 15. Statistical Analysis of Rutting Data .............................................................................. 27 Table 16. G* and Input Values................................................................................................... 28 Table 17. Mixture Input Values..................................................................................................... 29
List of Figures Figure 1. Experimental Plan ............................................................................................................ 4 Figure 2. 9.5 mm Dynamic Modulus Data (|E*|) Comparison ........................................................ 8 Figure 3. 12.5 mm Dynamic Modulus Data (|E*|) Comparison ...................................................... 8 Figure 4. 9.5 mm Mixture Master Curve Comparison at Reference Temperature of 15ºC ............ 9 Figure 5. 12.5 mm Mixture Master Curve Comparison at Reference Temperature of 15ºC........... 9 Figure 6. Average Fatigue Life Verses Density Determined by AASHTO and ASTM Methods. 12 Figure 7. Overlay test specimen setup........................................................................................... 16 Figure 8. Two Basic Pavement Structures Used for Fatigue Analysis.......................................... 17 Figure 9. 9.5 mm Fracture Mechanics Analysis - 50 mm Thickness ............................................ 18 Figure 10. 9.5 mm Fracture Mechanics Analysis - 100 mm Thickness ........................................ 18 Figure 11. 12.5 mm Fracture Mechanics Analysis - 50 mm Thickness ........................................ 19 Figure 12. 12.5 mm Fracture Mechanics Analysis - 100 mm Thickness ...................................... 19 Figure 13. 9.5 mm Mixture APA Rutting Trend ........................................................................... 22 Figure 14. 12.5 mm Mixture APA Rutting Trend ......................................................................... 22 Figure 15. 9.5 mm Mixture Flow Number Trend.......................................................................... 26 Figure 16. 12.5 mm Mixture Flow Number Trend........................................................................ 26 Figure 17. MEPDG Bottom-Up Cracking Predictions .................................................................. 30 Figure 18. MEPDG AC Layer Rutting Predictions ....................................................................... 31
vi
vii
List of Acronyms
AADT = Average Annual Daily Traffic AADTT = Average Annual Daily Truck Traffic AASHTO = American Association of State Highway and Transportation Officials ALF =Accelerated Load Facility AMPT = Asphalt Mixture Performance Test APA = Asphalt Pavement Analyzer ASTM = American Society for Testing and Materials AVC = Asphalt Vibratory Compactor E* = Complex Dynamic Modulus EICM = Enhanced Integrated Climatic Model ESALs = Equivalent Single Axles Loads FHWA = Federal Highway Administration Gmm = Theoretical Maximum Density HMA = Hot Mix Asphalt LTPP = Long-Term Pavement Performance ms = micro-strain MEPDG = Mechanistic-Empirical Pavement Design Guide MOD = Maximum Opening Displacement NCHRP = National Cooperative Highway Research Program NMAS = Nominal Maximum Aggregate Sizes OT = Overlay Test PG = Performance Grade QA = Quality Assurance SGC = Superpave Gyratory Compactor TMD = Theoretical Maximum Density TPF = Transportation Pooled Fund TTI = Texas Transportation Institute
1.0 Introduction Transportation agencies have always been tasked with providing longer lasting roadways in order to maximize their infrastructure funding. In an effort to achieve this goal, many agencies are moving towards performance based specifications for their Hot Mix Asphalt (HMA) mixtures. These specifications go beyond the typical volumetric mix design specifications by requiring the proposed HMA mixture to pass selected performance tests. Performance specifications outline a minimum level of performance over a specified period of time. These specifications utilize relationships between measured mechanical properties and pavement performance. Typically, these relationships are related to performance of the mixture in terms of cracking and rutting. Field performance of HMA is a function of many different parameters including, but not limited to: temperature variation, degree of aging, traffic speed, and loading magnitude. Another influential component to pavement performance is the in place density of the HMA mixture. Currently, most mix design systems rely primarily on achieving an optimum density. Failure to achieve this optimum density can have a detrimental effect on the performance of the pavement if it varies widely from the optimum. Low density leads to permeability of water and air resulting in water damage, oxidation, raveling, and cracking. High density increases the likelihood of bleeding, shoving, and rutting (1, 2). Because of these potential distresses, there has been a large effort to determine a value or range of optimal desired in-place density. Since density varies throughout the life of the pavement, it must stay high enough to prevent permeability of water and air, and low enough after a few years to prevent plastic flow. Previous research efforts have shown that the in-place voids should never fall below approximately three percent during the life of the pavement (2). Beyond its importance to pavement performance, HMA density is also a critical parameter for calculating pay factors under Quality Assurance (QA) specifications being utilized by many transportation agencies. If the specified density is not achieved during construction, pay adjustments (disincentives) maybe levied against the contractor to reflect the expected decrease in performance of the HMA (3, 4). Overall, it is important to gain a better understanding of how sensitive laboratory performance tests and analysis approaches are to HMA density as this information will aid transportation agencies in their efforts to develop and refine performance based specifications. Several tests and analysis approaches have been developed that can be utilized in a performance based specification to better understand the density-performance relationship. In terms of fatigue cracking evaluation, beam fatigue testing has been widely used and accepted (5). More recently, endurance limits and Overlay Test (OT) based fracture mechanics approaches have been utilized to evaluate fatigue cracking in HMA. The rutting potential of HMA has been evaluated utilizing the Asphalt Pavement Analyzer (APA) or similar rutting device. More recently, the flow number test has been used to evaluate rutting susceptibility using the Asphalt Mixture Performance Test (AMPT) developed under National Cooperative Highway Research Program (NCHRP) 9-
1
29 “Simple Performance Tester for Superpave Mix Design.” Finally, both cracking and rutting of HMA can be evaluated with the Mechanistic Empirical Pavement Design Guide (MEPDG) software that uses performance prediction equations. The research conducted herein was focused on measuring the effect of density on the stiffness and performance (fatigue and rutting) of HMA using both conventional and new advancements in testing and analysis approaches for HMA mixtures (6, 7). In this report, the term density refers to density expressed as percentage of Theoretical Maximum Density (TMD) or more commonly expressed as Gmm. Air voids refers to voids in total mix, calculated as follows:
mmG
mbG
1100Voids
Two mixtures were included in this study; a Superpave 9.5 mm and a Superpave 12.5 mm. Both mixtures were prepared at four different target density levels (88%, 91%, 94%, and 97%). Stiffness of each mixture at each density level was evaluated by measuring the dynamic modulus in the AMPT and constructing the corresponding master curves. Fatigue cracking was evaluated using beam fatigue testing and the Overlay Test (OT) based fatigue cracking prediction approach using fracture mechanics theory developed by researchers at the Texas Transportation Institute (TTI) (8). The fracture mechanics based procedure was used to predict the percent area cracked. Rutting was evaluated using the APA and by measuring the flow number with the AMPT device. Lastly, the mixture master curves were used as inputs to the MEPDG software (Version 1.0) to predict the effect of density on bottom up cracking and rutting. 2.0 Objectives The main objective of this study was to determine the effect of in-place density on the performance of HMA mixtures. Specifically, the objectives were to:
1. Compare the mixture stiffness differences due to density changes through construction and comparison of mixture dynamic modulus versus frequency master curves.
2. Evaluate the impact of HMA density on mixture fatigue cracking using beam
fatigue testing and fracture mechanics analysis of OT data.
3. Evaluate the impact of HMA density on mixture rutting potential using the APA and flow number test in the AMPT.
4. Utilize the MEPDG distress prediction equations and master curves to predict
bottom up cracking and rutting.
2
5. Compare MEPDG distress predictions to laboratory test results. Determine if laboratory tests provide the same cracking and rutting trends as MEPDG predictions.
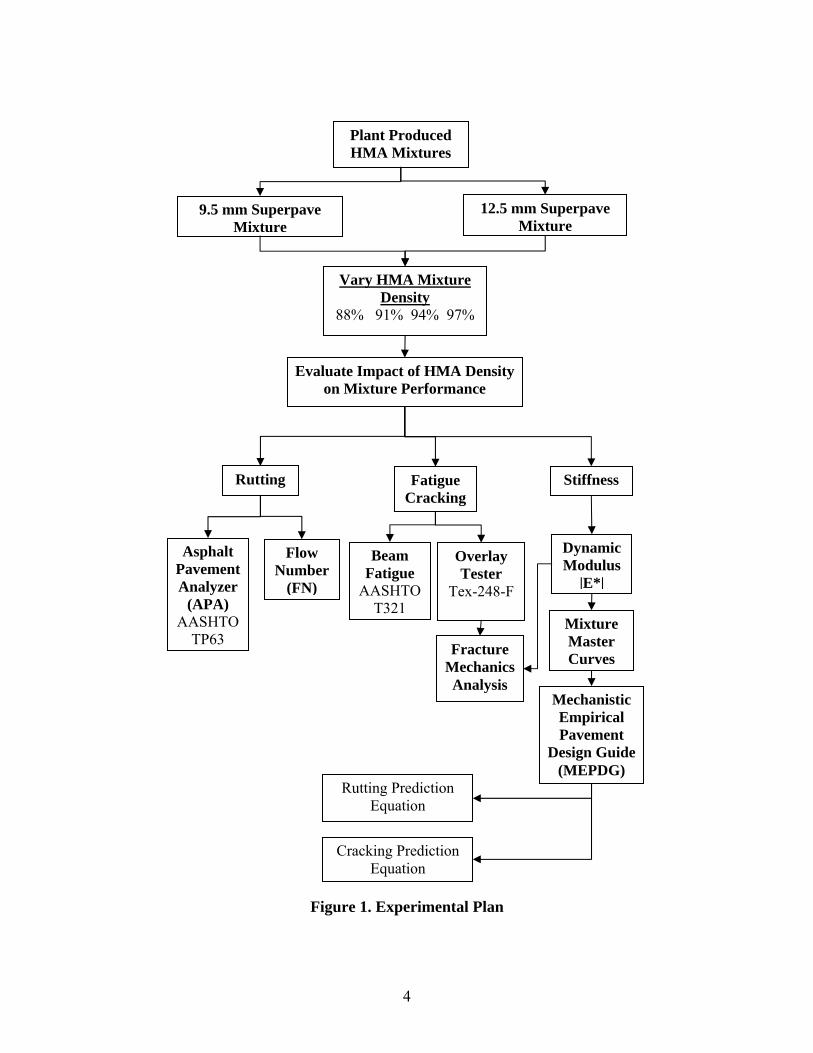
3.0 Experimental Plan To achieve the objectives of this study, two plant produced Superpave mixtures (9.5 mm and 12.5 mm) were used. Test specimens for each mixture were compacted to reach target density levels of 88%, 91%, 94%, and 97% of the theoretical maximum specific gravity (Gmm). The testing plan included three main testing and evaluation groups: stiffness, fatigue cracking, and rutting. Additionally, the MEPDG distress prediction equations were used to predict the mixture performance as function of density by varying the master curve data inputs at each target density level while keeping the remaining inputs constant. The complete experimental plan for this study is shown in Figure 1. 4.0 Mixture Designs Two plant produced Superpave mixtures with different Nominal Maximum Aggregate Sizes (NMAS) were selected for use in this study. Superpave mixtures, 9.5 mm and 12.5 mm, were obtained from a regional contractor. These mixtures were then reheated to the compaction temperature to fabricate the test specimens without any additional aging. The properties of these mixtures are shown in Tables 1 and 2. Each mixture conformed to the Superpave requirements as outlined in AASHTO M323 “Superpave Volumetric Mix Design”. The design ESALs level for each mixture was 0.3 to <3 million resulting in a corresponding required gyratory compactive effort of NDES = 75. Based on AASHTO M323, both mixtures were fine graded. Both mixtures were prepared with the regionally accepted standard Performance Grade (PG) PG64-28 binder.
3
9.5 mm Superpave Mixture
12.5 mm Superpave Mixture
Vary HMA Mixture Density
88% 91% 94% 97%
Evaluate Impact of HMA Density on Mixture Performance
Rutting Fatigue Cracking
Asphalt Pavement Analyzer
(APA) AASHTO
TP63
Flow Number
(FN)
Beam Fatigue
AASHTO T321
Overlay Tester
Tex-248-F
Fracture Mechanics Analysis
Stiffness
Dynamic Modulus
|E*|
Mechanistic Empirical Pavement
Design Guide (MEPDG)
Rutting Prediction Equation
Cracking Prediction Equation
Mixture Master Curves
Plant Produced HMA Mixtures
Figure 1. Experimental Plan
4
Table 1. 9.5 mm and 12.5 mm Plant Produced Mixture Properties
Sieve Size 9.5 mm Mixture
Gradation
9.5 mm Superpave
Specification Range
12.5 mm Mixture
Gradation
12.5 mm Superpave
Specification Range
19.0 mm 100 - 100 100 min. 12.5 mm 100 100 min. 98.9 90-100 9.5 mm 98.6 90-100 86.8 90 max. 4.75 mm 71.3 90 max. 56.5 - 2.36 mm 55.0 32-67 43.8 28-58 1.18 mm 47.0 - 37.8 -
0.600 mm 32.3 - 27.0 - 0.300 mm 18.9 - 15.1 - 0.150 mm 9.8 - 7.1 - 0.075 mm 4.9 2-10 3.4 2-10
Table 2. 9.5 mm and 12.5 mm Plant Produced Mixture Volumetrics
Sieve Size 9.5 mm Mixture
Gradation
9.5 mm Superpave
Specification Range
12.5 mm Mixture
Gradation
12.5 mm Superpave
Specification Range
Air Voids at NDES, % 4.0 - 4.8 - VMA at NDES, % 15.3 15% min 15.1 14% min. VFA at NDES, %
77.8 65-78 67.4 65-78
Dust to Binder Ratio 1.0 0.6 -1.2 0.8 0.6 -1.2 Gmm 2.607 - 2.631 -
- = Not Applicable
5
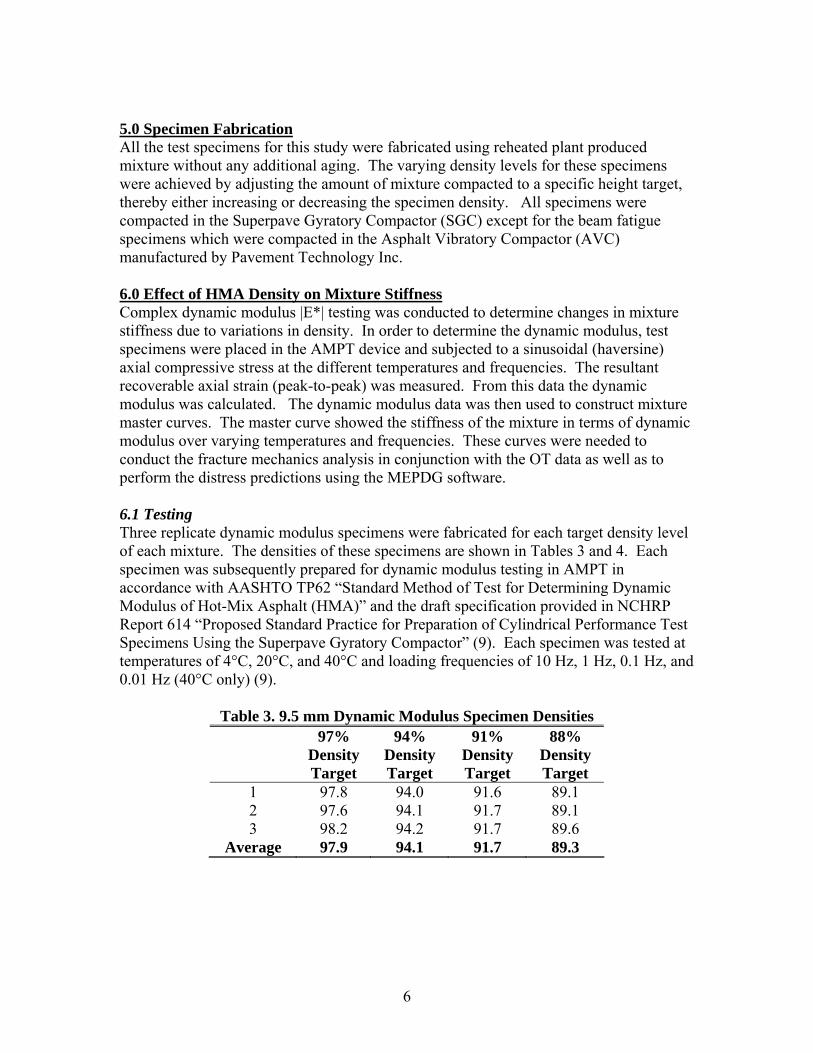
5.0 Specimen Fabrication All the test specimens for this study were fabricated using reheated plant produced mixture without any additional aging. The varying density levels for these specimens were achieved by adjusting the amount of mixture compacted to a specific height target, thereby either increasing or decreasing the specimen density. All specimens were compacted in the Superpave Gyratory Compactor (SGC) except for the beam fatigue specimens which were compacted in the Asphalt Vibratory Compactor (AVC) manufactured by Pavement Technology Inc. 6.0 Effect of HMA Density on Mixture Stiffness Complex dynamic modulus |E*| testing was conducted to determine changes in mixture stiffness due to variations in density. In order to determine the dynamic modulus, test specimens were placed in the AMPT device and subjected to a sinusoidal (haversine) axial compressive stress at the different temperatures and frequencies. The resultant recoverable axial strain (peak-to-peak) was measured. From this data the dynamic modulus was calculated. The dynamic modulus data was then used to construct mixture master curves. The master curve showed the stiffness of the mixture in terms of dynamic modulus over varying temperatures and frequencies. These curves were needed to conduct the fracture mechanics analysis in conjunction with the OT data as well as to perform the distress predictions using the MEPDG software. 6.1 Testing Three replicate dynamic modulus specimens were fabricated for each target density level of each mixture. The densities of these specimens are shown in Tables 3 and 4. Each specimen was subsequently prepared for dynamic modulus testing in AMPT in accordance with AASHTO TP62 “Standard Method of Test for Determining Dynamic Modulus of Hot-Mix Asphalt (HMA)” and the draft specification provided in NCHRP Report 614 “Proposed Standard Practice for Preparation of Cylindrical Performance Test Specimens Using the Superpave Gyratory Compactor” (9). Each specimen was tested at temperatures of 4°C, 20°C, and 40°C and loading frequencies of 10 Hz, 1 Hz, 0.1 Hz, and 0.01 Hz (40°C only) (9).
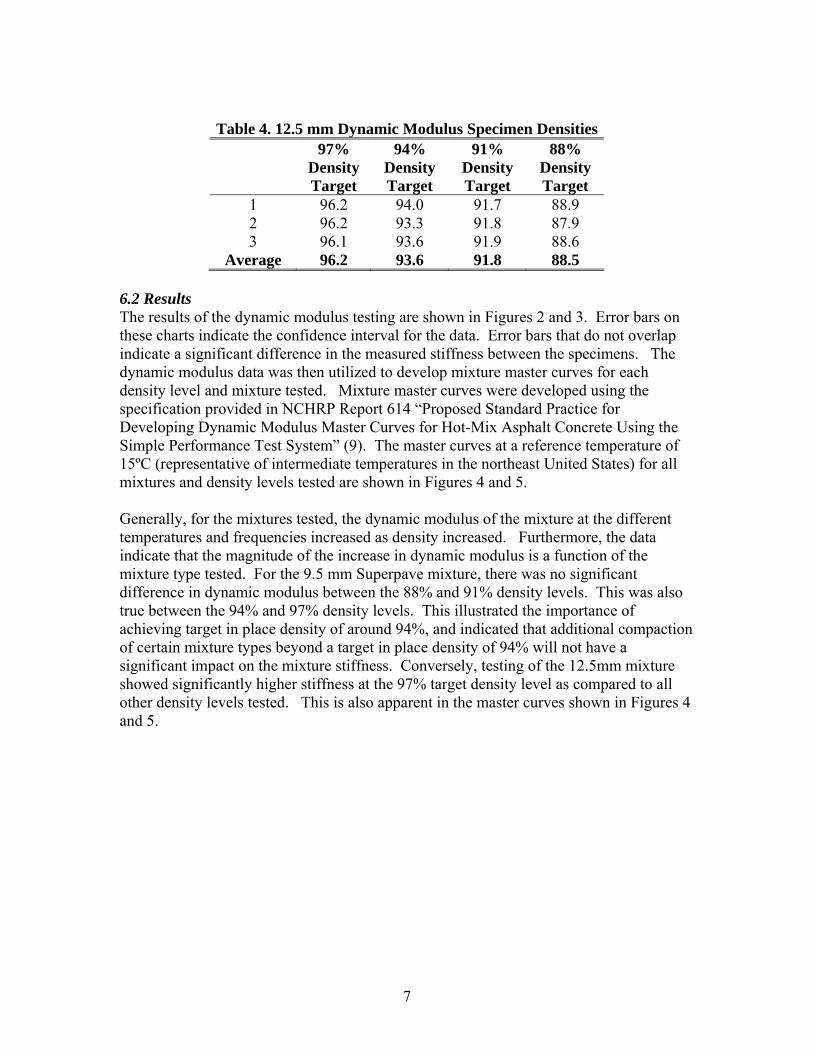
Table 3. 9.5 mm Dynamic Modulus Specimen Densities
Average 96.2 93.6 91.8 88.5 6.2 Results The results of the dynamic modulus testing are shown in Figures 2 and 3. Error bars on these charts indicate the confidence interval for the data. Error bars that do not overlap indicate a significant difference in the measured stiffness between the specimens. The dynamic modulus data was then utilized to develop mixture master curves for each density level and mixture tested. Mixture master curves were developed using the specification provided in NCHRP Report 614 “Proposed Standard Practice for Developing Dynamic Modulus Master Curves for Hot-Mix Asphalt Concrete Using the Simple Performance Test System” (9). The master curves at a reference temperature of 15ºC (representative of intermediate temperatures in the northeast United States) for all mixtures and density levels tested are shown in Figures 4 and 5. Generally, for the mixtures tested, the dynamic modulus of the mixture at the different temperatures and frequencies increased as density increased. Furthermore, the data indicate that the magnitude of the increase in dynamic modulus is a function of the mixture type tested. For the 9.5 mm Superpave mixture, there was no significant difference in dynamic modulus between the 88% and 91% density levels. This was also true between the 94% and 97% density levels. This illustrated the importance of achieving target in place density of around 94%, and indicated that additional compaction of certain mixture types beyond a target in place density of 94% will not have a significant impact on the mixture stiffness. Conversely, testing of the 12.5mm mixture showed significantly higher stiffness at the 97% target density level as compared to all other density levels tested. This is also apparent in the master curves shown in Figures 4 and 5.
7
1
10
100
1,000
10,000
100,000
4°C - 0.1Hz
4°C - 1.0Hz
4°C - 10Hz
20°C - 0.1Hz
20°C - 1.0Hz
20°C -10Hz
40°C - 0.01Hz
40°C - 0.1Hz
40°C - 1.0Hz
40°C - 10Hz
Ave
rag
e D
ynam
ic M
od
ulu
s, M
Pa
88% Density (89.3%)91% Density (91.7%)94% Density (94.1%)97% Density (97.9%)
Figure 2. 9.5 mm Dynamic Modulus Data (|E*|) Comparison
1
10
100
1,000
10,000
100,000
4°C - 0.1Hz
4°C - 1.0Hz
4°C - 10Hz
20°C - 0.1Hz
20°C - 1.0Hz
20°C -10Hz
40°C - 0.01Hz
40°C - 0.1Hz
40°C - 1.0Hz
40°C - 10Hz
Ave
rag
e D
ynam
ic M
od
ulu
s, M
Pa
88% Density (88.5%)91% Density (91.8%)94% Density (93.6%)97% Density (96.2%)
Figure 3. 12.5 mm Dynamic Modulus Data (|E*|) Comparison
88% Density (88.5%)91% Density (91.8%)94% Density (93.6%)97% Density (96.2%)
Figure 5. 12.5 mm Mixture Master Curve Comparison at Reference Temperature of
15ºC
9
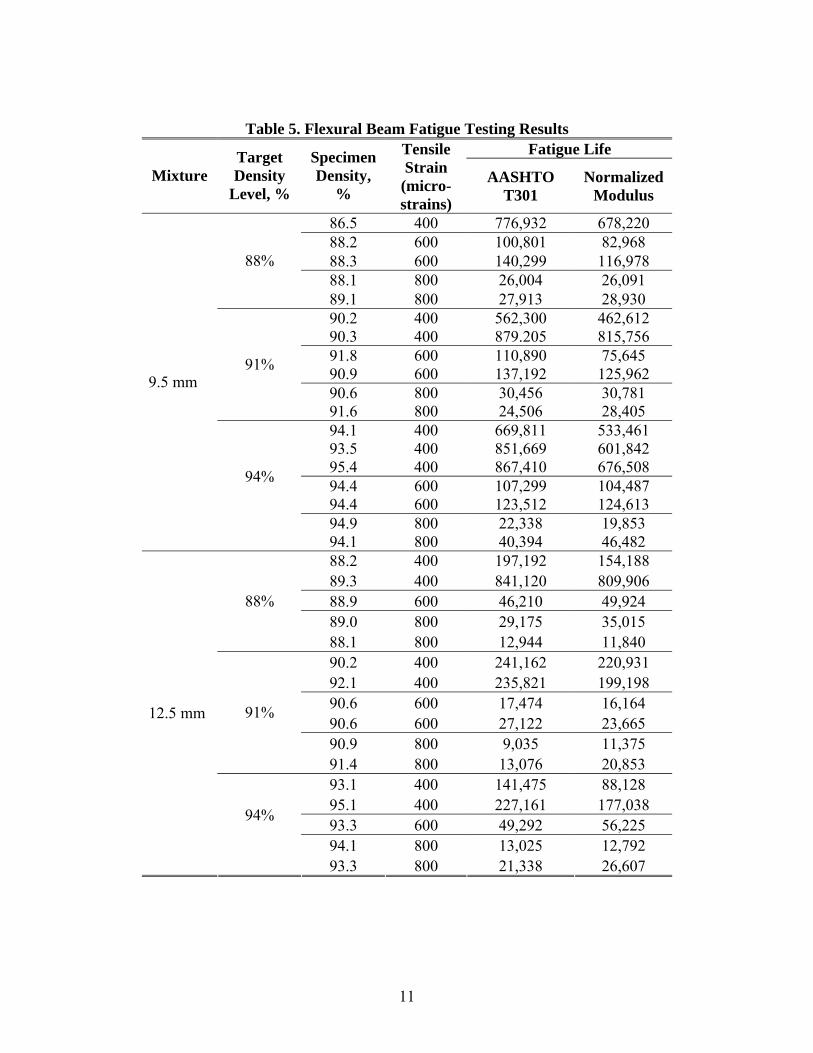
7.0 Effect of HMA Density on the Mixture Fatigue Cracking Characteristics In order to evaluate the fatigue cracking characteristics of the HMA mixtures at different density levels, beam fatigue testing and OT based fracture mechanics analysis were conducted. 7.1 Flexural Beam Fatigue Testing One of the most common and historically used laboratory test procedures to evaluate the fatigue cracking resistance of asphalt mixtures is the four point flexural beam fatigue test. This flexural fatigue test is the only standard test method for fatigue testing of HMA (5). The typical test protocols for conducting this test are AASHTO T321 “Determining the Fatigue Life of Compacted Hot Mix Asphalt (HMA) Subjected to Repeated Flexural Bending” (10) and ASTM D7460 “Determining Fatigue Failure of Compacted Asphalt Concrete Subjected to Repeated Flexural Bending” (11). Under these test protocols, a cyclic haversine displacement is applied to the beam specimen at a specified loading (frequency) rate and constant test temperature. This test procedure has been used to estimate the fatigue life of HMA layers under repeated loading; however, the final field performance will be a function of many different parameters. 7.1.1 Testing Beam fatigue specimens were compacted to an initial sample size of 400 mm in length, 150 mm in width, and 100 mm in height. These specimens were then cut to the final beam dimensions (50± 6 mm height x 63± 6 mm wide x 380± 6 mm long) as required by AASHTO T321 and ASTM D7460. The final specimen densities obtained are shown in Table 5. Numerous attempts were made to fabricate the 97% density specimens; however these specimens were not able to be fabricated with the asphalt vibratory compactor. The test temperature was selected to be 15ºC to coincide with the other fatigue testing (OT based fracture mechanics) conducted under this study. Each beam fatigue test was conducted in strain control mode at a loading frequency of 10 Hz applied using a haversine waveform. Specimens were tested at strain levels of 400 micro strain (ms), 600 ms, and 800 ms. For most cases, two replicates were tested; only one beam was tested at the 600 ms level for the 12.5 mm mixture (88% and 94% density targets) due to limited number of specimens. The results of the beam fatigue testing and analysis are shown in Table 5. Table 5 also contains a summary of the beam fatigue testing and fatigue lives determined using both AASHTO T321 (50% Stiffness Reduction) and ASTM D7460 (Normalized Complex Modulus x Cycles vs Cycles).
10
Table 5. Flexural Beam Fatigue Testing Results Fatigue Life
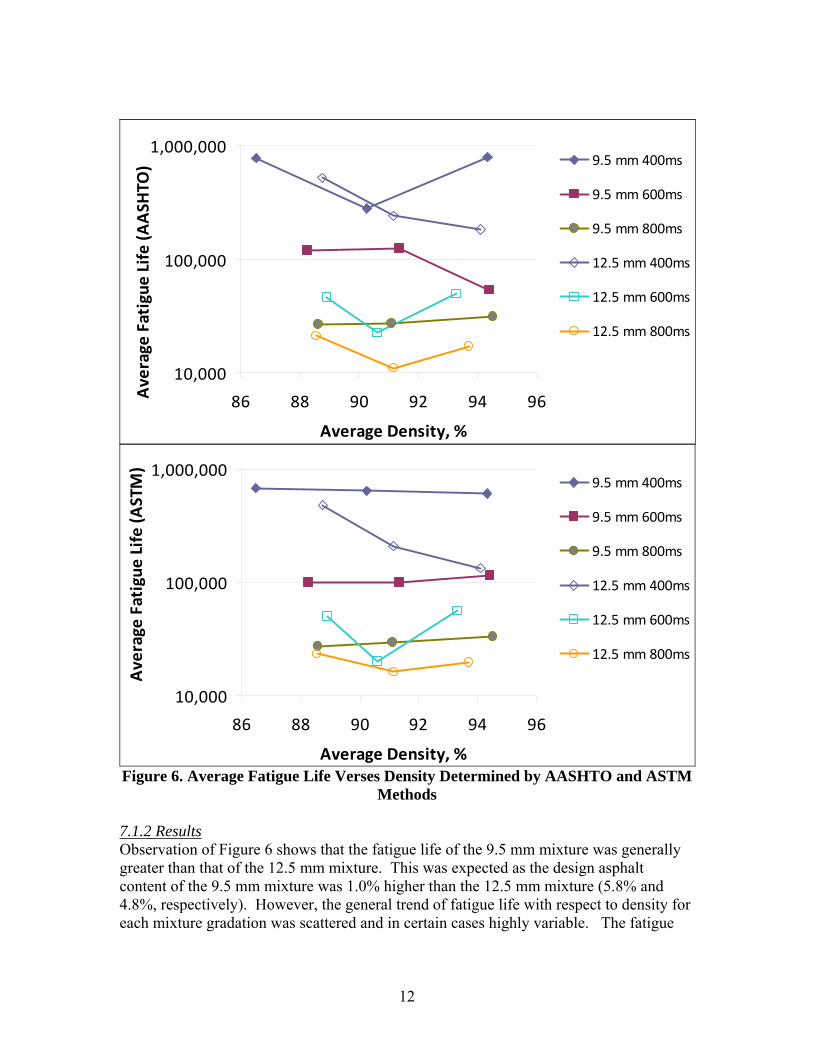
Figure 6. Average Fatigue Life Verses Density Determined by AASHTO and ASTM
Methods 7.1.2 Results Observation of Figure 6 shows that the fatigue life of the 9.5 mm mixture was generally greater than that of the 12.5 mm mixture. This was expected as the design asphalt content of the 9.5 mm mixture was 1.0% higher than the 12.5 mm mixture (5.8% and 4.8%, respectively). However, the general trend of fatigue life with respect to density for each mixture gradation was scattered and in certain cases highly variable. The fatigue
12
life determinations for the 9.5 mm mixture were relatively close for all three target densities at the different strain levels tested. The results for the 12.5 mm mixture showed, for the majority of specimens, variable results at each tensile strain level as shown in Table 5. At the lower tensile strains, the 88% target density samples achieved the highest average fatigue life but also exhibited the highest variability (approximately 640,000 cycles difference) among individual specimens. The Endurance Limit of each of the mixtures was predicted from the flexural beam fatigue data using the methodology proposed in NCHRP Project 9-38 “Endurance Limit of Hot Mix Asphalt Mixtures to Prevent Fatigue Cracking in Flexible Pavements” (12), and is shown in Table 6. The Endurance Limit is defined as the strain level, at a given temperature, below which no bottom-up fatigue damage occurs in the asphalt mixture. The Endurance Limit for the 9.5 mm mixture does not indicate a sensitivity to density. However, the 12.5 mm mixture showed a decrease in Endurance Limit with an increase in density, which is opposite to what would be expected. These may have been a result of the high variability in the original test data; more testing would need to be performed to confirm these trends.
Table 6. Calculated Endurance Limit for Asphalt Mixtures Tested for Flexural Beam Fatigue
Mixture Gradation
Target Density Level, %
Endurance Limit (micro-strains)
88 157 91 146 9.5 mm 94 143 88 120 91 93 12.5 mm 94 45
Overall, the beam fatigue testing conducted for this study yielded inconclusive findings about the influence of HMA density on fatigue performance. This agrees with previous research which concluded that beam fatigue testing was not significantly affected by variations in the specimen density (6). However, other previous beam fatigue testing research has suggested that lower density (high air void contents) in the mixture can greatly reduce pavement fatigue life (13). These varying viewpoints were neither wholly supported nor disproved with beam fatigue results in this study. 7.2 Overlay Test Based Fracture Mechanics Approach Another approach undertaken to investigate the relationship between HMA density and fatigue cracking performance was based on a recently introduced methodology utilizing the OT. In this approach, the OT is used to determine fracture properties (A and n) of HMA mixtures. The fracture mechanics based approach developed by Zhou et al. (8) assumes that fatigue cracking is a combination of crack initiation and crack propagation process. Thus, both the crack initiation and the crack propagation are included in the
13
fatigue analysis. The approach has three key components: fatigue life model, fatigue damage model, and fatigue area model. A detailed description of the procedure is presented by Zhou et. al (8). This procedure was verified using data obtained from the Federal Highway Administration (FHWA) Accelerated Load Facility (ALF) fatigue test sections. These test sections were constructed and tested under pooled fund study TPF-5(019) (8). 7.2.1 Fatigue Life (Nf) Model The load repetitions (Nf) to cause a crack to initiate and propagate through asphalt surface layer is the sum of the number of load repetitions needed for micro-cracks to coalesce to initiate a macro-crack (crack initiation, Ni) and the number of load repetitions required for the macro-crack to propagate to the surface (crack propagation, Np):
pif NNN (1)
Crack initiation life Ni is estimated using the following equations: 21
1
k
i kN
(2)
Ekk log83661.020145.397001.61
210 (3)
nk 2 (4) where ε is maximum tensile strain at the bottom of asphalt layer; E is dynamic modulus; and n is fracture property. Crack propagation life Np is calculated based on the well-known Paris’ law:
h
cnp dc
KAN
0
1 (5)
In equation 5, c0 is initial crack length (based on Lytton’s recommendation [14], c0=7.5 mm is used for later analysis); h is asphalt layer thickness; K is stress intensity factor calculated from finite element program such as CrackPro (15); and A and n are fracture properties determined from the OT testing. 7.2.2 Fatigue Damage Model The fatigue damage (D) caused by a specified number of load repetitions (n) is estimated using Miner’s law:
fN
nD (6)
7.2.3 Fatigue Area Model A sigmoidal model is proposed for predicting fatigue area:
De
areafatiguelog89.71
100%_
(7)
14
Where D is fatigue damage estimated from Equation 6. The fatigue cracking area is expressed as a percentage of the wheel path. 7.2.4 Specimen Fabrication and Testing Three specimens were fabricated at each density level for each mixture included in this study. Specimens were cut to the dimensions required for the OT as outlined in Texas Department of Transportation Specification Tex-248-F “Overlay Test” (16). The densities obtained for these OT specimens are shown in Tables 7 and 8. Each specimen was conditioned for three hours at the testing temperature of 15ºC. Testing was conducted with a Maximum Opening Displacement (MOD) of 0.6 mm applied over a ten second interval. Test termination (failure) occurred when the load required to open or close the MOD dropped 93% from the initial load required for the MOD. The typical specimen setup for OT testing is shown in Figure 7. Generally, specimens failing in shorter cycles have less fatigue life. However, in some cases this trend may be the opposite due to the fracture properties (A and n) of the mixture. Thus, the OT cycles to failure alone cannot always be used to rank the fatigue performance of the mixture. The OT test results and the determined fracture properties for each mixture are shown in Tables 7 and 8. Fracture properties (A and n) of most 97% density mixtures could not be determined because these specimens failed very quickly during the OT testing.
Table 7. 9.5 mm Overlay Specimen Density, Test Results, and Fracture Properties
7.2.5 Fracture Mechanics Analysis and Results Two basic pavement structures with 50 mm and 100 mm thick asphalt layers were assumed as shown in Figure 8. For each pavement structure, all layers except the asphalt layer were kept constant. The various mixtures in this study were used for the asphalt layer. A total of 12 pavement structures (2 mixtures×3 densities ×2 asphalt layer thicknesses) were analyzed. Both 97% density mixtures (9.5 mm and 12.5 mm) were excluded from the analysis due to either limited or no fracture property data. For the fatigue performance analysis, a traffic level of 2.7 million ESALs in 20 years with a 2.4% annual growth rate (that is consistent to the original mixture design level of 0.3 to less than 3 million ESALs in 20 years) was assumed. A weather station located in Boston, MA was used as the input to the Enhanced Integrated Climatic Model (EICM) model to predict pavement temperatures. For each specific pavement structure, asphalt layer monthly modulus was determined based on monthly pavement temperature from EICM, dynamic modulus master curve, and traffic vehicle speed (v=72 km/h) and associated loading frequency. The predicted fatigue cracking area developments for these two mixtures with three levels of density are presented in Figures 9 through 12.
50 mm Asphalt Layer
200 mm Base E = 345 MPa
150 mm SubbaseE = 240 MPa
Subgrade55 MPa
Pavement Structure #1
100 mm Asphalt Layer
200 mm Base E = 345 MPa
150 mm Subbase E = 240 MPa
Subgrade55 MPa
Pavement Structure #2
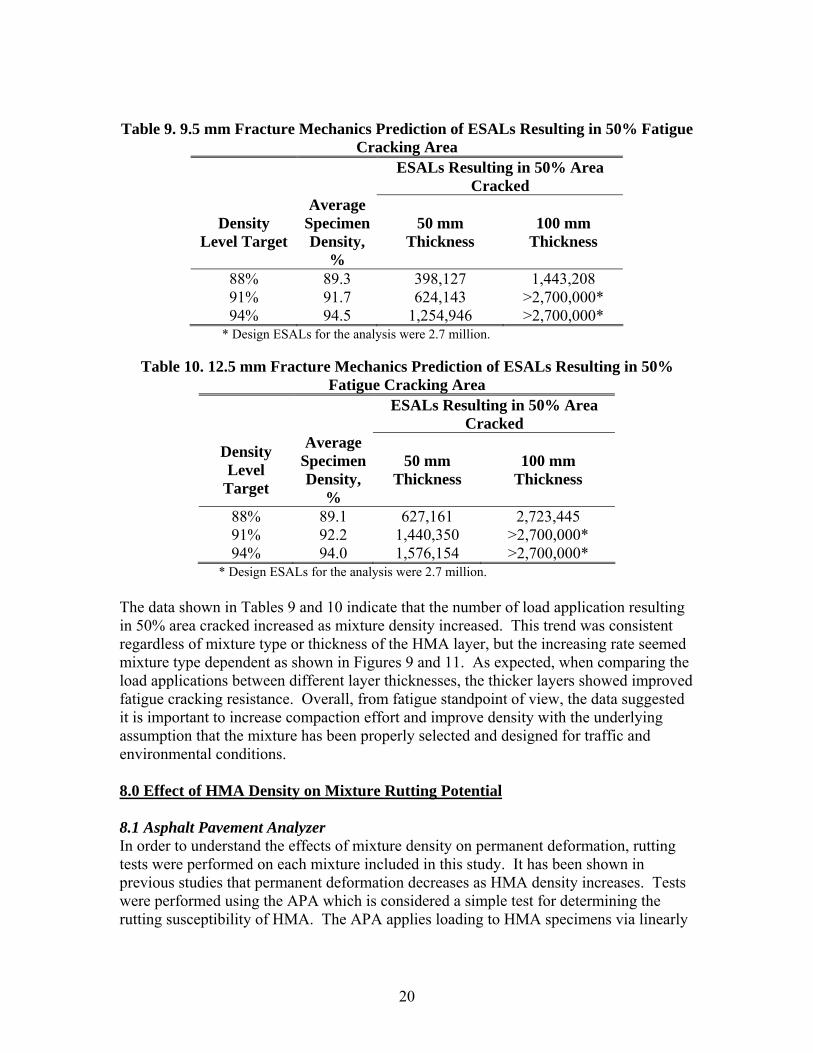
Figure 8. Two Basic Pavement Structures Used for Fatigue Analysis It is apparent that the compaction density has a significant influence on mixture performance in terms of fatigue cracking. Improving compaction and accordingly increasing density substantially improves the fatigue performance of HMA mixtures. For example, in case of 50 mm thick asphalt layer, if the density of the 9.5 mm mixture increases from 88% to 94%, the pavement fatigue life corresponding to 50% fatigue area of the wheel path will increase roughly three times from approximately 398,000 to 1,250,000 ESALs. Tables 9 and 10 show the number of ESALs applications corresponding to the fatigue failure limit of 50% fatigue cracking area of the wheel path.
* Design ESALs for the analysis were 2.7 million. The data shown in Tables 9 and 10 indicate that the number of load application resulting in 50% area cracked increased as mixture density increased. This trend was consistent regardless of mixture type or thickness of the HMA layer, but the increasing rate seemed mixture type dependent as shown in Figures 9 and 11. As expected, when comparing the load applications between different layer thicknesses, the thicker layers showed improved fatigue cracking resistance. Overall, from fatigue standpoint of view, the data suggested it is important to increase compaction effort and improve density with the underlying assumption that the mixture has been properly selected and designed for traffic and environmental conditions. 8.0 Effect of HMA Density on Mixture Rutting Potential 8.1 Asphalt Pavement Analyzer In order to understand the effects of mixture density on permanent deformation, rutting tests were performed on each mixture included in this study. It has been shown in previous studies that permanent deformation decreases as HMA density increases. Tests were performed using the APA which is considered a simple test for determining the rutting susceptibility of HMA. The APA applies loading to HMA specimens via linearly
20
moving steel wheels that press upon pressurized rubber hoses (690±35 kPa) resulting in a loading of 445±22 N. The trafficking imparted by the APA causes permanent deformation (rutting) of the HMA specimens which can be quantifiably measured. 8.1.1 Specimen Fabrication and Testing APA specimens were fabricated in the SGC and were then cut to a height of 75 mm. The density of these cut specimens is shown in Tables 11 and 12. Each of these cut specimens was tested in the APA in accordance with AASHTO TP63 “Determining the Rutting Susceptibility of Hot Mix Asphalt (HMA) Using the Asphalt Pavement Analyzer (APA)” (17). The test temperature for the APA testing was 64ºC which coincided with the high temperature of the PG64-28 binder used in this project. Each specimen was tested for 8,000 cycles and the rut depth recorded. The results of the APA testing are shown in Tables 11 and 12 and graphically in Figures 13 and 14. Both mixtures showed a decrease in rut depth with increasing density.
Table 11. 9.5 mm APA Specimen Densities and Test Results
Density Level
Target
Actual Specimen
Density, %
Replicate No.
Rut Depth at 8,000 Cycles,
mm
Average Rut Depth at
8,0000 cycles, mm
Average Specimen Density,
% 87.4 1 12.38
88% 87.7 2 12.80
12.59 87.6
91.2 1 9.65 91%
91.3 2 9.08 9.36 91.3
94.2 1 8.51 94%
94.1 2 7.79 8.15 94.1
98.4 1 5.35 97%
98.7 2 5.56 5.46 98.5
Table 12. 12.5 mm APA Specimen Densities and Test Results
Density Level
Target
Actual Specimen Density,
%
Replicate No.
Rut Depth at 8,000
Cycles, mm
Average Rut Depth at
8,0000 cycles, mm
Average Specimen Density,
% 86.2 1 12.38
88% 85.5 2 11.06
11.72 85.9
91.8 1 6.86 91%
91.7 2 7.86 7.36 91.7
94.5 1 5.21 94%
94.5 2 5.25 5.23 94.5
95.8 1 5.02 97%
96.0 2 4.24 4.63 95.9
21
0
2
4
6
8
10
12
14
86 88 90 92 94 96 98 100
Density, %
Ru
t D
epth
, m
m
Figure 13. 9.5 mm Mixture APA Rutting Trend
0
2
4
6
8
10
12
14
84 86 88 90 92 94 96 98 100
Density, %
Ru
t D
epth
, m
m
Figure 14. 12.5 mm Mixture APA Rutting Trend
22
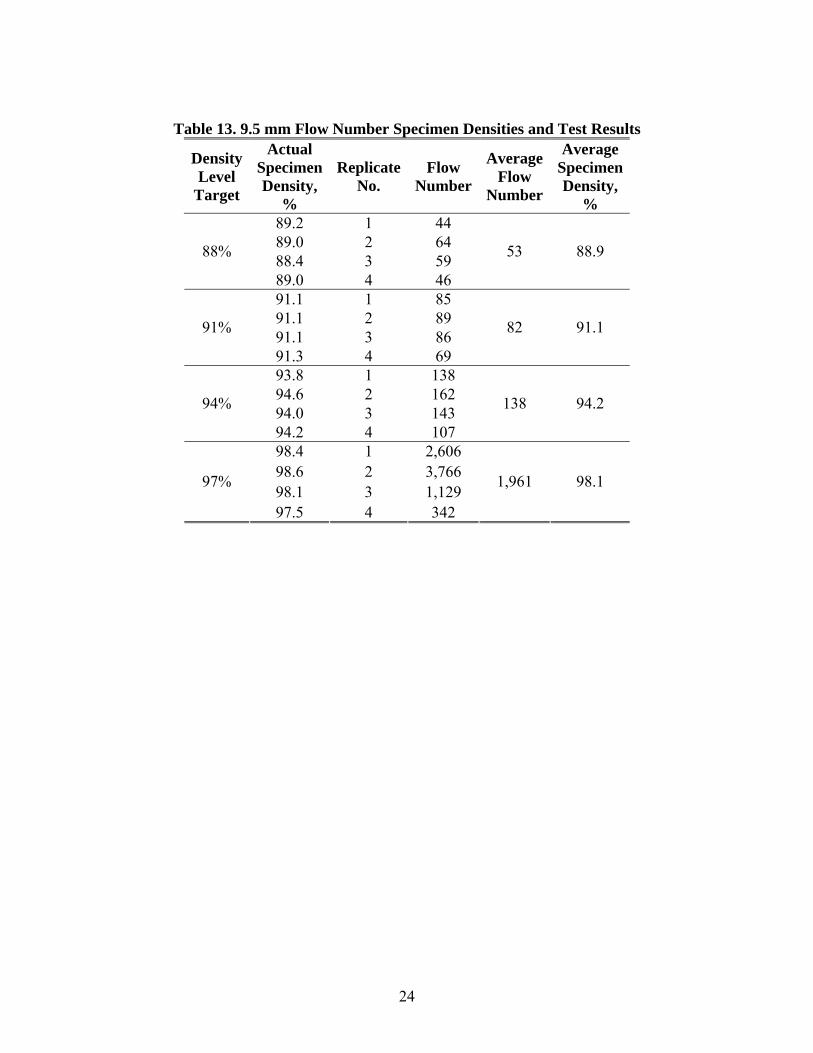
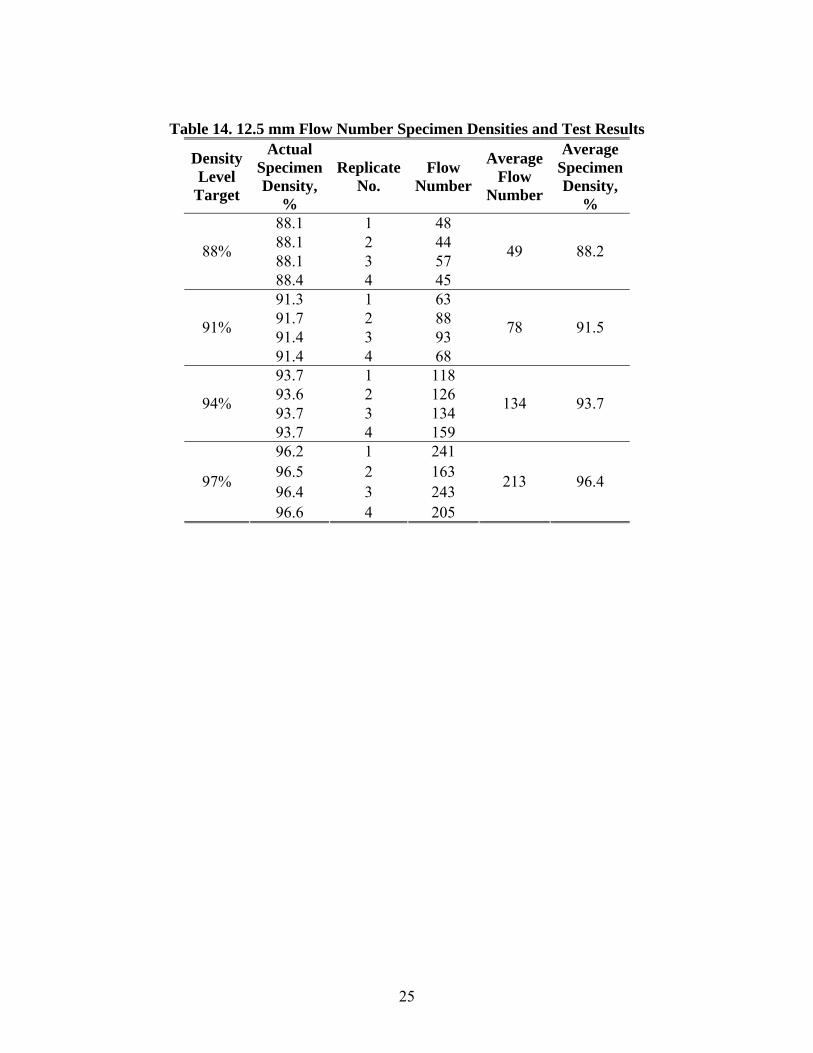
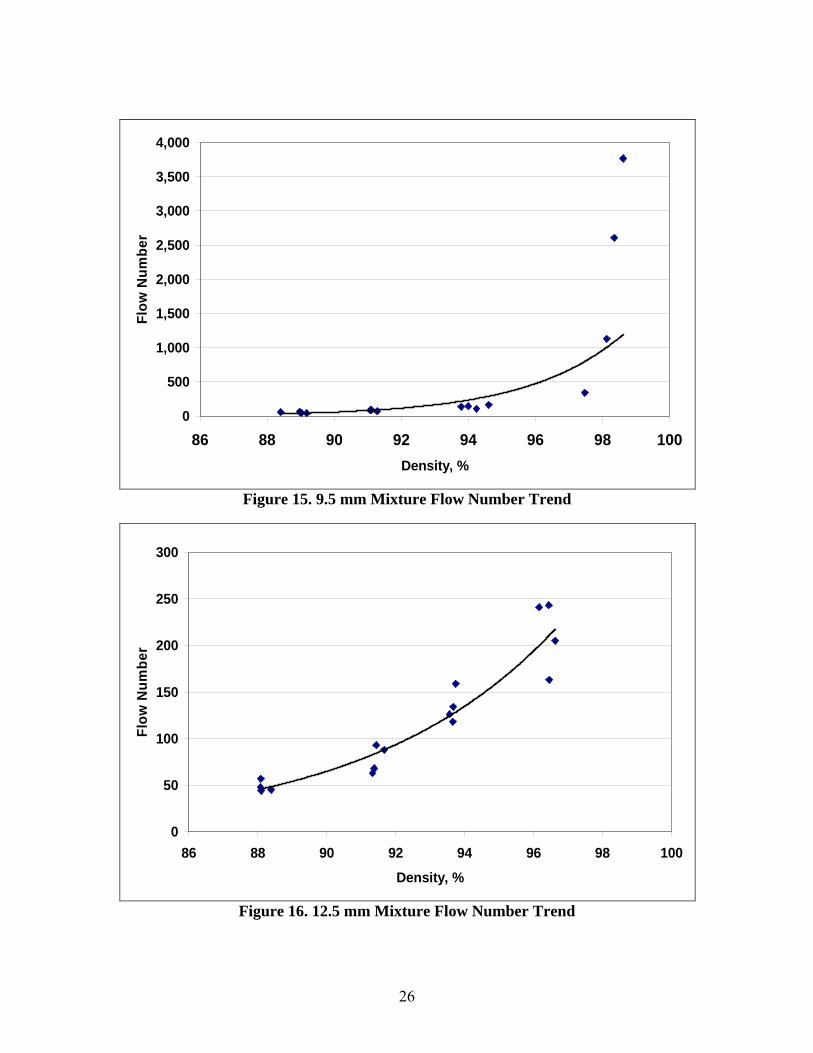
8.2 Flow Number Flow number testing was conducted in addition to the APA testing in an effort to evaluate the effect of HMA density on rutting performance. The theory behind flow number test has been well documented by Witczak in NCHRP Report 580 “Specification Criteria for Simple Performance Tests for Rutting” (18). The flow number test is conducted in the AMPT on standard sized AMPT specimens. During the test, the specimen is subjected to a repeated compressive axial load for 0.1 sec followed by a rest period of 0.9 seconds (19). The flow number is defined as the number of load applications at which the permanent strain rate reaches a minimum, which also corresponds to the onset of tertiary flow of the mixture (18,19). The flow number value provides an indication of the mixtures’ relative resistance to permanent deformation. 8.2.1 Specimen Fabrication and Testing Specimens were fabricated in a manner similar to the fabrication of the dynamic modulus specimens in accordance with AASHTO TP62 and the draft specification provided in NCHRP Report 614 (9). Four replicate flow number specimens were fabricated for each target density level of each mixture for this study as shown in Tables 13 and 14. The use of four replicate specimens was recommended in the NCHRP Project 9-33 draft report (5). The flow number test was conducted according the specifications provided in NCHRP Report 629 (19). Each flow number specimen was conditioned at the test temperature of 50ºC for three hours prior to testing. The test temperature was determined in accordance with the recommendation provided in the NCHRP Project 9-33 draft report (5). This report suggested using a test temperature obtained from the LTPPBind software corresponding to the seven day average maximum temperature located 20 mm from the pavement surface with 50% reliability. For the majority of the New England states, this temperature was 50ºC. Flow number specimens were tested in the AMPT unconfined and a 600 kPa deviator stress was utilized as recommended in the NCHRP Project 9-33 draft report (5). Double latex greased membranes were utilized for each specimens end friction reducers in lieu of Teflon sheets which were shown to significantly impact the flow number results (19). The results of the flow number testing are shown in Tables 13 and 14 and in Figures 15 and 16. The raw data and the trends showed that as density is increased, the rutting resistance also increased. The two mixture types showed similar performance at the various density ranges, regardless of the difference in NMAS and binder content. The 9.5 mm mixture showed that the flow number increased dramatically at densities above 98%; the 12.5 mm specimens had a maximum density of less than 97%, so it is unknown if this behavior is consistent between the mixtures.
23
Table 13. 9.5 mm Flow Number Specimen Densities and Test Results
Density Level
Target
Actual Specimen Density,
%
Replicate No.
Flow Number
Average Flow
Number
Average Specimen Density,
% 89.2 1 44 89.0 2 64 88.4 3 59
88%
89.0 4 46
53 88.9
91.1 1 85 91.1 2 89 91.1 3 86
91%
91.3 4 69
82 91.1
93.8 1 138 94.6 2 162 94.0 3 143
94%
94.2 4 107
138 94.2
98.4 1 2,606 98.6 2 3,766 98.1 3 1,129
97%
97.5 4 342
1,961 98.1
24
Table 14. 12.5 mm Flow Number Specimen Densities and Test Results
Density Level
Target
Actual Specimen Density,
%
Replicate No.
Flow Number
Average Flow
Number
Average Specimen Density,
% 88.1 1 48 88.1 2 44 88.1 3 57
88%
88.4 4 45
49 88.2
91.3 1 63 91.7 2 88 91.4 3 93
91%
91.4 4 68
78 91.5
93.7 1 118 93.6 2 126 93.7 3 134
94%
93.7 4 159
134 93.7
96.2 1 241 96.5 2 163 96.4 3 243
97%
96.6 4 205
213 96.4
25
0
500
1,000
1,500
2,000
2,500
3,000
3,500
4,000
86 88 90 92 94 96 98 100
Density, %
Flo
w N
um
ber
Figure 15. 9.5 mm Mixture Flow Number Trend
0
50
100
150
200
250
300
86 88 90 92 94 96 98 100
Density, %
Flo
w N
um
ber
Figure 16. 12.5 mm Mixture Flow Number Trend
26
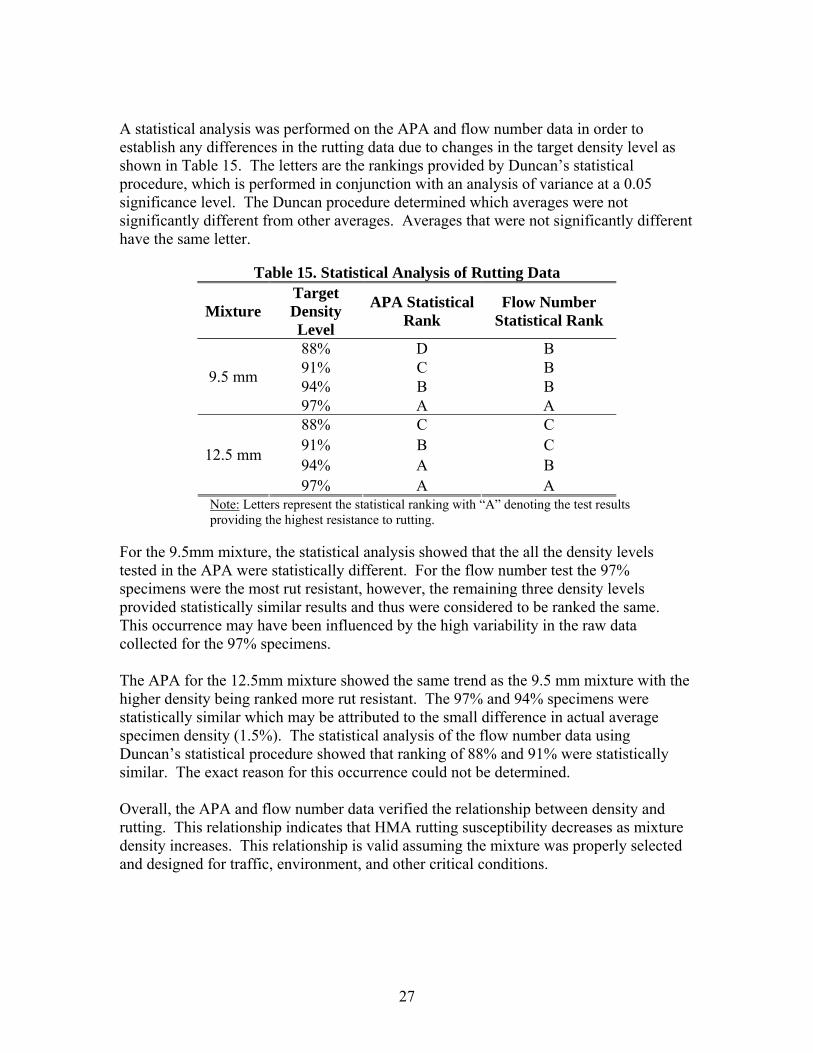
A statistical analysis was performed on the APA and flow number data in order to establish any differences in the rutting data due to changes in the target density level as shown in Table 15. The letters are the rankings provided by Duncan’s statistical procedure, which is performed in conjunction with an analysis of variance at a 0.05 significance level. The Duncan procedure determined which averages were not significantly different from other averages. Averages that were not significantly different have the same letter.
Table 15. Statistical Analysis of Rutting Data
Mixture Target Density Level
APA Statistical Rank
Flow Number Statistical Rank
88% D B 91% C B 94% B B
9.5 mm
97% A A 88% C C 91% B C 94% A B
12.5 mm
97% A A Note: Letters represent the statistical ranking with “A” denoting the test results providing the highest resistance to rutting.
For the 9.5mm mixture, the statistical analysis showed that the all the density levels tested in the APA were statistically different. For the flow number test the 97% specimens were the most rut resistant, however, the remaining three density levels provided statistically similar results and thus were considered to be ranked the same. This occurrence may have been influenced by the high variability in the raw data collected for the 97% specimens. The APA for the 12.5mm mixture showed the same trend as the 9.5 mm mixture with the higher density being ranked more rut resistant. The 97% and 94% specimens were statistically similar which may be attributed to the small difference in actual average specimen density (1.5%). The statistical analysis of the flow number data using Duncan’s statistical procedure showed that ranking of 88% and 91% were statistically similar. The exact reason for this occurrence could not be determined. Overall, the APA and flow number data verified the relationship between density and rutting. This relationship indicates that HMA rutting susceptibility decreases as mixture density increases. This relationship is valid assuming the mixture was properly selected and designed for traffic, environment, and other critical conditions.
27
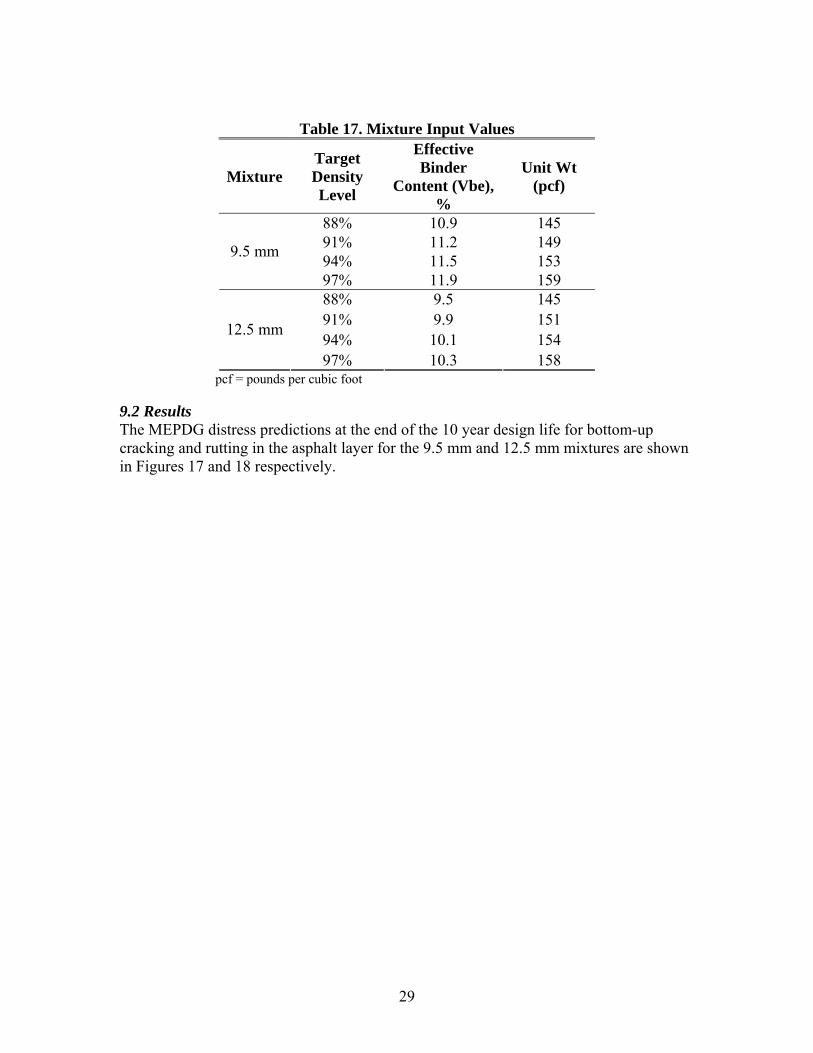
9.0 Mechanistic-Empirical Pavement Design Guide (MEPDG) Distress Equation Predictions Pavement performance predictions were made using the MEPDG Version 1.0 software (20). The MEPDG analysis was utilized to establish if trends obtained from the software were similar to those from the laboratory testing. The dynamic modulus master curves generated from the laboratory testing were used in Level 1 analysis runs. Details of the MEPDG inputs and distress predictions are summarized below. 9.1 Inputs A default input file generated from a previous study (21) was used as a template for the suite of runs conducted. The analysis of the pavement section was conducted for a design life of 10 years as a new flexible pavement. Summer months were used for pavement construction and traffic open days. The climate data was obtained from the MEPDG climate database (22) for the city of Boston, MA (Logan airport). Traffic data were obtained from available traffic databases for a typical medium to high traffic volume 4-lane highway. The AADT (average annual daily traffic) was 35,674 with 8% trucks thus yielding a two-way AADTT (average annual daily truck traffic) of 2854, with a traffic growth of 2.4% (23, 24). Detailed traffic data and inputs are outlined elsewhere (25). The pavement structure consisted of a single 150 mm AC layer, 300 mm crushed stone aggregate base, 375 mm crushed gravel aggregate subbase, and A3 subgrade. Detailed properties of the unbound layers are outlined elsewhere (25). Level 1 inputs for the AC layer included: mix dynamic modulus |E*| at multiple frequencies and temperatures, binder shear dynamic modulus (|G*|) and phase angle (δ) at three temperatures, effective binder content (Vbe) by volume, as-constructed air voids (Va), and mixture unit weight (γ). The measured dynamic modulus values from laboratory testing were used for the Level 1 mixture inputs. Binder properties for a typical PG 64-28 binder were used for the required Level 1 input values and are shown in Table 16. The effective binder content and unit weights for each mixture are shown in Table 17. The measured dynamic modulus values already accounted for the difference in air void content, so a constant as-constructed air void content of 7% was used in the software to avoid ‘double counting’ the air void (density) differences.
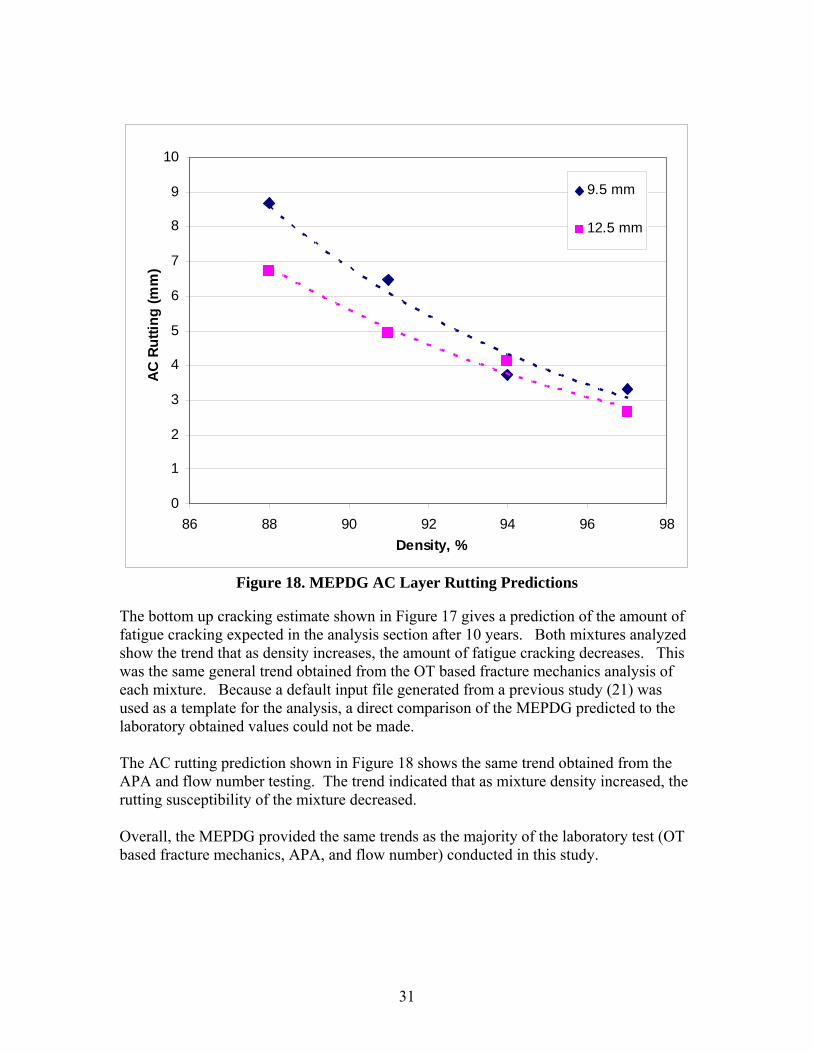
9.2 Results The MEPDG distress predictions at the end of the 10 year design life for bottom-up cracking and rutting in the asphalt layer for the 9.5 mm and 12.5 mm mixtures are shown in Figures 17 and 18 respectively.
29
0
1
2
3
4
5
6
86 88 90 92 94 96 98
Density, %
Bo
tto
m U
p C
rack
ing
(%
)
9.5 mm
12.5 mm
Figure 17. MEPDG Bottom-Up Cracking Predictions
30
0
1
2
3
4
5
6
7
8
9
10
86 88 90 92 94 96 98
Density, %
AC
Ru
ttin
g (
mm
)
9.5 mm
12.5 mm
Figure 18. MEPDG AC Layer Rutting Predictions
The bottom up cracking estimate shown in Figure 17 gives a prediction of the amount of fatigue cracking expected in the analysis section after 10 years. Both mixtures analyzed show the trend that as density increases, the amount of fatigue cracking decreases. This was the same general trend obtained from the OT based fracture mechanics analysis of each mixture. Because a default input file generated from a previous study (21) was used as a template for the analysis, a direct comparison of the MEPDG predicted to the laboratory obtained values could not be made. The AC rutting prediction shown in Figure 18 shows the same trend obtained from the APA and flow number testing. The trend indicated that as mixture density increased, the rutting susceptibility of the mixture decreased. Overall, the MEPDG provided the same trends as the majority of the laboratory test (OT based fracture mechanics, APA, and flow number) conducted in this study.
31
10.0 Summary and Conclusions This report presents the results of a research project evaluating the relationship between HMA density and performance in terms of fatigue cracking and rutting. A 9.5 mm and 12.5 mm mixture were used to fabricate specimens at densities of 88%, 91%, 94%, and 97% of maximum theoretical specific gravity. Dynamic modulus, beam fatigue, overlay test, APA, and flow number test were performed. Pavement predictions using the MEPDG Version 1.0 software were performed. Based on the testing and analysis conducted in this study, the following conclusions were made: Complex dynamic modulus |E*| data measured with the AMPT indicated that the test
was sensitive to the mixture density with the trend being increases in density led to increases in mixture stiffness. This trend was consistent for both mixtures tested.
Beam fatigue testing provided inconclusive trends relating HMA density to fatigue
cracking potential. Testing data and endurance limits analysis on the 9.5 mm mixture indicated that density had little to no impact on the fatigue performance of the mixture. This finding was similar to previous research by Pilar and Haddock (6). Conversely, endurance limit analysis of the 12.5 mm mixture indicated that fatigue performance decreased as density increased. This trend was opposite to the trend noted by Harvey and Tsai (13). This suggests further research and analysis is needed to validate the sensitivity of the beam fatigue test in evaluating HMA fatigue cracking for mixtures of different densities.
OT based fracture mechanics analysis showed that the number of ESALs to reach the
fatigue cracking failure criteria (50% area cracked) increased as mixture density increased. This trend was consistent regardless of mixture type or thickness of the HMA layer. This method could be a viable method for evaluating the fatigue cracking susceptibility of HMA mixtures.
The results of the APA rut tests and flow number test showed that as density
increased, the rutting potential decreased. This trend was consistent for both mixtures tested. Therefore both the APA and flow number tests were sensitive to density.
The MEPDG prediction equations indicated that fatigue cracking potential was
reduced as density increased; this agreed with the trend obtained by the OT based fracture mechanics approach, but not with the trends obtained from the beam fatigue. The MEPDG prediction equations indicated that rutting potential decreased with an increase in density, which agreed with the both the APA rut test and the flow number test.
Overall, the test and analysis approaches used in this study were sensitive to density
and therefore could be a useful tool in developing performance based specifications. However, more mixtures need to be tested in order to further develop and validate the relationship between HMA density and performance.
32
11.0 References
1. Edward T. Harrigan. “Significance of ‘As-Constructed’ HMA Air Voids to Pavement Performance from an Analysis of LTPP Data” National Cooperative Highway Research Program Research Results Digest, Number 269, September 2002.
2. E. Ray Brown “Density of Asphalt Concrete – How Much is Needed?” National
Center for Asphalt Technology (NCAT), Report 90-3, 1990. 3. Y.R. Kim, S.J. Lee, Y. Seo, O. El-Haggan. “Determination of Price Reduction
Factors for Density-Deficient Asphalt Pavements”. ASTM Journal of Testing and Evaluation, Volume 36, Issue 4, July 2008.
4. W.G. Buttlar, and M. Harrell. “Development of End-Result and Performance-Related
Specifications for Asphalt Pavement Construction in Illinois.” Conference Proceedings of Crossroads 2000, Iowa State University Ames, 1998.
5. Donald Christensen and Ramon Bonaquist “A Mix Design Manual for Hot Mix
Asphalt - DRAFT COPY” National Cooperative Highway Research Program (NCHRP) Project 9-33, 2008.
6. Eliana del Pilar Vivar and John E. Haddock “HMA Pavement Performance and
Durability” U.S. Department of Transportation, FHWA/IN/JTRP-2005/14, April 2006.
7. Geoffrey M. Rowe, Salman K. Hakimzadeh, and Phillip B. Blankenship. “Evaluation
of Aspects of E* Test Using HMA Specimens with Varying Void Contents” Transportation Research Board Annual Meeting DVD, Paper No. #09-3729, 2009.
8. Fujie Zhou, Sheng Hu, Tom Scullion, Dar-Hao Chen, Xicheng Qi, and German
Claros. “Development and Verification of the Overlay Tester Based Fatigue Cracking Prediction Approach” Journal of the Association of Asphalt Paving Technologists (AAPT), Vol. 76, 2007.
9. Ramon Bonaquist “Refining the Simple Performance Tester for Use in Routine
Practice” National Cooperative Highway Research Program (NCHRP), Report 614, 2008.
10. “Standard Specifications for Transportation Materials and Methods of Sampling and
Testing” American Association of State Highway and Transportation Officials (AASHTO), 28th Edition, 2008.
11. “Annual Book of ASTM Standards” American Society for Testing and Materials
(ASTM), Volume 04.03, 2008.
33
12. Advanced Asphalt Technologies, LLC “An Experimental Plan for Validation of an
Endurance Limit for HMA Pavements” National Cooperative Highway Research Program (NCHRP) Web-only Document 134, December 2008. Internet Address: http://onlinepubs.trb.org/onlinepubs/nchrp/nchrp_w134.pdf Last accessed July 2009
13. John T. Harvey and Bor-Wen Tsai. “Effects of Asphalt Content and Air Void Content
on Mix Fatigue and Stiffness” Transportation Research Record: Journal of the Transportation Research Board, No. 1543, 1996.
14. R. L. Lytton, J. Uzan, E. G. Fernando, R. Roque, D. Hiltumen, and S. M. Stoffels.
“Development and Validation of Performance Prediction Models and Specifications for Asphalt Binders and Paving Mixes” National Research Council, Strategic Highway Research Program (SHRP) A-357, 1993.
15. S. Hu., X. Hu, F. Zhou, and L. Walubita. “SA-CrackPro: A New Finite Element
Analysis Tool for Pavement Crack Propagation” Transportation Research Record, No. 2068, 2008.
16. “Tex-248-F: Overlay Test” Texas Department of Transportation, January 2009. 17. “2008 AASHTO Provisional Standards” American Association of State Highway and
Transportation Officials (AASHTO), June 2008 Edition 18. M.W. Witczak “Specification Criteria for Simple Performance Tests for Rutting”
National Cooperative Highway Research Program (NCHRP), Report 580, 2007. 19. Ramon Bonaquist “Ruggedness Testing of the Dynamic Modulus and Flow Number
Tests with the Simple Performance Tester” National Cooperative Highway Research Program (NCHRP), Report 629, 2008.
20. NCHRP 1-37A Design Guide Software
Internet Address: http://www.trb.org/mepdg/software.htm Last accessed April 2009
21. J.S. Daniel, G. R. Chehab and D. Ayyala. “Sensitivity of RAP Binder Grade on
Performance Predictions in the MEPDG” Accepted for publication in the Journal of the Association of Asphalt Pavement Technologists, 2009.
22. NCHRP 1-37A Climatic Data
Internet Address: http://www.trb.org/mepdg/climatic_state.htm Last accessed April 2009
34
35
23. New Hampshire Department of Transportation. “Traffic Volume Reports” Internet Address: http://www.nh.gov/dot/business/engineers.htm Last accessed July 2005
24. Federal Highway Administration. LTPP DataPave Online.
Internet Address: http://www.datapave.com/ Last accessed July 2005
25. G. Chehab and J.S. Daniel. “Evaluating RAP Mixtures using the Mechanistic
Empirical Pavement Design Guide Level 3 Analysis” Transportation Research Record: Journal of the Transportation Research Board, No. 1962, 2006.