Journal of Plankton Research Vol.8 no 3 pp.537-548. 1986
Relationship between action spectra for chlorophyll afluorescence and photosynthetic O2 evolution in algae
A.Neori, M.Vernet1, O.Holm-Hansen and F.T.Haxo1
Food Chain Research Group, Scripps Institution of Oceanography, A-018,and l Marine Biology Research Division, Scripps Institution ofOceanography, A-002, University of California, La Jolla, CA 92093, USA
Abstract. Relative excitation spectra of chlorophyll a fluorescence are shown to be very close to relativeaction spectra of photosystem II O2 evolution in seven micro- and macro-algae of five phyla. The conditionsunder which this correspondence should hold, based on theoretical considerations, and the applications ofthis correspondence to interpretation of fluorescence excitation spectra of chlorophyll a from natural popula-tions are discussed. The spectra presented are interpreted in relation to the light-harvesting pigments andtheir association with the two photosystems.
Introduction
Knowledge of the spectral response of algal photosynthesis to light is essential to anunderstanding of the interactions between light, algae and primary production in theoceans. Photosynthetic O2 evolution action spectra have commonly been used inlaboratory studies to estimate the wavelength dependence of photosynthesis (Haxo, 1960;Fork and Amesz, 1969; Larkum and Barrett, 1983, pp. 69-71). This methodologicalapproach is, however, inconvenient for oceanographic field work due to its complexi-ty, its insensitivity and the susceptibility of some algal species to the manipulations in-volved. This led to the choice of in vivo action (excitation) spectra of chlorophyll a(chl a) fluorescence as an increasingly useful alternative in biological oceanography(Yentsch and Yentsch, 1979; Mitchell and Kiefer, 1984; Neori et al., 1984). Such ap-plications emphasize the need for a precise definition of the relationship between thetwo kinds of spectra, and of the conditions which ensure this relationship in a varietyof algal pigment types.
Since the pioneer investigations by Dutton et al. (1943) and in particular those byDuysens (1952) on the role of accessory pigments and energy transfer in photosyn-thesis, action spectra for chl a fluorescence have become an essential laboratory toolin the study of photosynthesis (e.g. Goedheer, 1972; Butler, 1978; Mathis and Paillotin,1981). A close relationship between in vivo chl a fluorescence from photosystem II(PSII) and photochemical activity of PSII was suggested (reviewed by Butler, 1978;Mathis and Paillotin, 1981). Fluorescence from photosystem I (PSI) at room temperatureis considered to be negligible. In spite of the large volume of data published on eitherchl a fluorescence action spectra or on photosynthesis action spectra, there are nosystematic in vivo comparisons between the two, as far as we know.
The conditions under which these two kinds of spectra should be approximately similarcan be derived from models of the photochemical apparatus. One, which is often cited,was suggested by Butler (1978, 1980, 1984). According to this model, an excited chla molecule in PSII can lose its energy in one of three ways: (1) a non-radiative thermal
decay, i.e. heat (D); (2) photochemistry — the reduction of an acceptor in a PSII reac-tion center, leading to CO2 fixation and O2 evolution (PII), or (3) chl a fluorescence(FH), which includes variable (Fv) and constant (Fo) components.
A fourth pathway, that of energy transfer from the light-harvesting pigments of PSIIdirectly to PSI, or spillover (e.g. Mohanty and Govindjee, 1973), could be added.For our purposes, however, spillover can be considered with pathway 1 (D) above,as such energy dissipation does not result directly in either fluorescence or O2 evolu-tion (Butler, 1984).
Butler (1980) argued that the yields of both PSII photochemistry W>PII) andfluorescence ($FII) depend on only one variable - the fraction (A) of open to totalPSII reaction centers. #PII is highest when A = 1 (that is all reaction centers are open),while <£FII is highest when A = 0 (when all reaction centers are closed). Two conse-quences of Butler's theory are: (i) under conditions which keep A at a constant valueappropriate for either fluorescence or O2 evolution, as defined above, the yields <£PIIand 0FII should stay constant at all wavelengths [see Prezelin and Ley (1980) and Krauseand Weis (1984) for possible complications which may be applicable to naturalpopulations]; and (ii) as long as A is constant, photochemistry and chl a fluorescenceshould both be linear functions of the number of light photons absorbed by PSII. Asa result, considering that in healthy cells Fo is much smaller than Fv when A = 0(Mathis and Paillotin, 1981), and of quite similar spectral response (Kitajima and Butler,1975), the shapes of the action spectra of #PII and <j>Fll should be rather similar.The value of A can be kept at the desired level in a variety of ways. For actionspectra of PSII O2 evolution, Joliot and Joliot (1968) designed a modulated light beamsystem in which the value of A could be kept constant by a strong background lightbeam. For measurements of chl a fluorescence action spectra, the value of A can bekept at the desired level (close to zero) by addition of DCMU (3-(3,4-dichlorophenyl)-1,1-dimethylurea). After a short exposure to light, DCMU-treated algae have all PSIIreaction centers closed (i.e. A = 0), and <j>FU is at a higher value, which is nearlylight independent within the time-scale (minutes) and with the weak excitation lightintensities used for fluorescence measurements (Joliot, 1965; Slovacek and Hannan,1977; Butler, 1978; Mathis and Paillotin, 1981).
In this paper, we compare action spectra for in vivo chl a fluorescence of DCMU-treated cells, and for PSII photochemistry of normal cells (as measured by O2 evolu-tion). We test experimentally the predicted relationship between these spectra, underdefined conditions, for seven different algae representing the major algal pigment types.
Materials and methodsMicroalgae
Unialgal cultures were grown in standard media as indicated below, and were con-tinuously illuminated at low light levels by 'Cool White' fluorescent light, which resultedin light-limited growth rates of 0.1 -0 .2 doublings day"1. All cultures wefe activelygrowing when sampled, as determined by cell counts.
Chroomonas sp. (Provasoli isolate; Cryptophyta), was grown in 'D' medium (Provasoliand MacLaughlin, 1963), in batch culture, shaken daily, illuminated as 10 /tE m~2
s" 1 and at a temperature of 18-20°C.
538
Chlorophyll a fluorescence and O2 evolution in algae
Rhodomonas D3 (Provasoli isolate, SIO code no. CR13; Cryptophyta), was grown underthe same conditions as Chroomonas.
Glenodinium sp. (Bernard isolate, SIO code no. PY33; Pyrrophyta), was grown in'GPM' medium (Loeblich, 1975), in a semi-continuous turbidostat, illuminated at 30 /xEm~2 s~ l, at a temperature of 18°C. The culture was stirred by a magnetic stirrer, andbubbled with air.
Chaetoceros gracilis (SIO code no. BA13; Bacillariophyta), a small cell size species,was grown under the same conditions as Glenodinium above.
Macroalgae
Healthy, endophyte-free specimens of Porphyra perforata (Rhodophyta), and of Ulvasp. (probably californica; Chlorophyta), were collected from rocky intertidal beachesin La Jolla. Blades were kept at low light levels (20 pE m~2 s"1) in unenriched, flowingor frequently changed filtered sea water, and remained in healthy condition for weeks.Spectra of these vegetative blades were measured one or two days after collection.
Phycodrys sp. (strain JS-SC No. 119; Rhodophyta), a thin-bladed species, was grownin an aquarium with flowing filtered sea water, at an irradiance of 3 fiE m~2 s"1.
In-vivo fluorescence action spectra of chl a
Spectra were measured with a Perkin Elmer MPF 44A spectrofluorometer, and werecorrected using the rhodamine B method (Yguerabide, 1968). The excitation band widthwas 3 nm and emission was set at 680 nm with a 10 nm band width. A Corning CS2-61 blocking cutoff filter was placed in front of the emission monochromator.Microalgae, suspended in growth medium, were placed in a standard 1-cm fluorescenceglass cuvette. At the concentrations used (specified in figure legends), cell densitiesdid not significantly alter spectral shape, as tested on dilution series. For macroalgae,small, visibly homogeneous pieces, with a size of approximately 2 x 5 mm (slightlylarger than the focused excitation beam) were cut from very thin vegetative blades.They were placed vertically in a drop of sea water, and held by water adhesion to ablack brass block at a 45° angle to the exciting beam and to the emission monochromatorline of view. All measurements were made at room temperature (20-22°C), withinseveral minutes after the samples had been withdrawn. Prior to measurement, the sampl-ed algae were incubated for 1 min in white light (~20 /tE m~2 s"1) in the presenceof 50-100 iiM DCMU (Joliot, 1965; Papageorgiou and Govindjee, 1968), added aseither a methanolic or an ethanolic solution. No deleterious effects were observed foreither of the solvents, which were added at 1 % v/v or less (see also data of Holt andFrench in Macdowall, 1949, Table V). The fluorescence yields of the DCMU-treatedcells were stable for the duration of the measurements.
Photosynthetic action spectra
Spectra were measured polarographically using a modulated beam, bare platinum oxy-gen electrode system (Joliot and Joliot, 1968; Joliot, 1972), essentially as describedpreviously (Prezelin et al., 1976). The action spectrum apparatus was modified by theincorporation of a microcomputer which continuously monitored wavelength, light in-
539
A.Neori et al.
tensity and the modulated oxygen electrode signal. The computer controlled the lightlevel at each wavelength, rotating a calibrated circular gradient UV-VIS-NIR neutraldensity disk (Oriel Corp., model 28650) in order to keep the monochromatic modulatedbeam quantum flux incident to the electrode mount at a constant, operator-determinedlevel during a scan. The light detector was a calibrated silicon photodiode (EG andG model UV-444BQ). Final quantum corrections were made with a thermopile (Ket-tering Scientific Research, Model 68). The monochromatic light was isolated by a Bauschand Lomb 500 mm grating (1200 grooves mm"1) monochromator from a 150 W xenonarc lamp. Entrance and exit slits were 3 and 2 mm respectively, producing a spectralband width of 5 nm. The measurements were taken point by point at 3- to 4-nm inter-vals, starting at the short wavelength. The monochromator was automatically driven,and stopped for about 30 s at each point. After a few seconds for light level adjustmentand signal stabilization, seven readings were taken by the computer at 2-s intervals.The median value of these was selected and stored by the computer as the datum formodulated oxygen evolution at that wavelength. In this operational mode, a full spec-trum (375—740 nm) was completed in about 50 min. Slower sweeps, and the collec-tion of more points at each wavelength, did not affect the spectra. Due to the 8-bitresolution of our data acquisition system, wavelength readings were accurate to±1.5 nm. A continous bright background beam was provided by a 50 W tungsten lamp,focused through a Calflex-C (IR reflecting) filter and a red or far-red cutoff filter, asdefined in the figure legends.
Preparations of microalgae on a recessed electrode were handled as described byPrezelin et al. (1976). With macroalgae, a raised electrode was used, so that the re-taining dialysis membrane held the algal blade in close contact with the platinum sur-face. A piece approximately 3 x 3 mm was cut from a vegetative and visiblyhomogeneous blade, for mounting on the electrode. For each preparation, the intensityof the background beam was adjusted to maximize the modulated signal. The modulatedbeam intensity was kept in the linear region of a P versus I curve which was run im-mediately prior to each wavelength sweep. Specific conditions can be found in the figurelegends.
Fluorescence and O2 evolution action spectra were determined on the same day. Ali-quots of the same culture or like pieces from the same blade were used. The fluorescencespectra were digitized and stored by the computer. Values between experimental datapoints were interpolated at 1 nm intervals. To reduce random noise in the data, theaction spectra for O2 evolution had to be smoothed by a moving average of 9 nm, andin some cases (described in figure legends) the average of several replicate spectra hadto be calculated. The spectra are given in relative units, and they are scaled to coincideat 480-500 nm.
Results
The action spectra for chl a fluorescence and for O2 evolution are presented as plotsof relative response versus wavelength. Our PSH O2 evolution spectra look similar topreviously published PSII spectra from related algae (Vidaver, 1966; Ley and Butler,1976). In all algae there were only minor differences in the shapes of the fluorescencespectra between normal and DCMU-treated cells, although the absolute fluorescence
540
Chlorophyll a fluorescence and O2 evolution in algae
10
»Q75
05 -
UJO25 ,
0.0
1 1 1 1 1 1 . . 1 . . 1 1
- PORPHYRA a -l ' • ' i ' • ' i ' ' ' i
- PHYCODRYS b ~
4 0 0 500 600 700 400WAVELENGTH (nm)
500 600 700
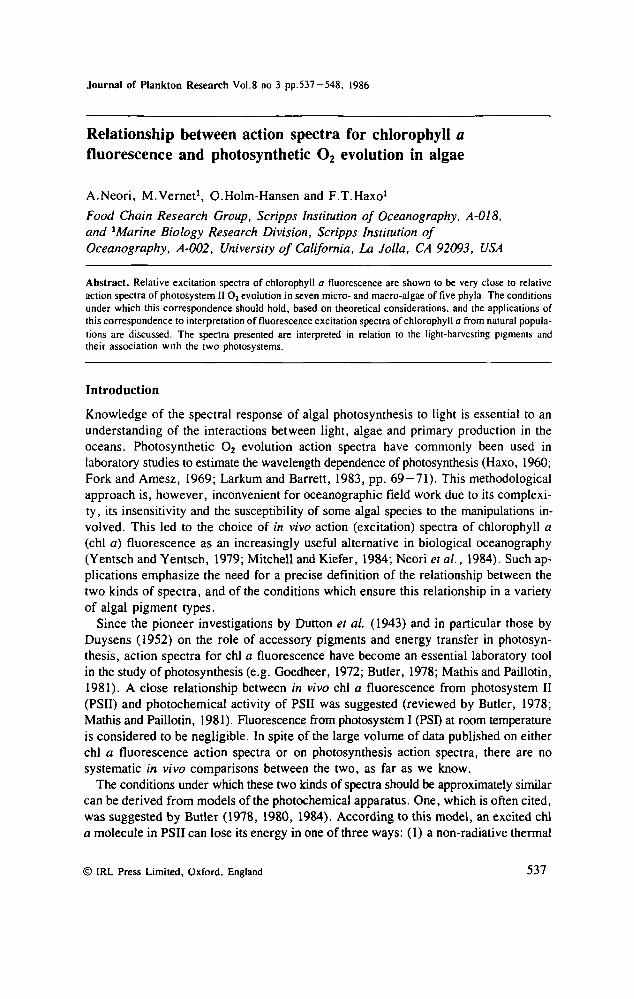
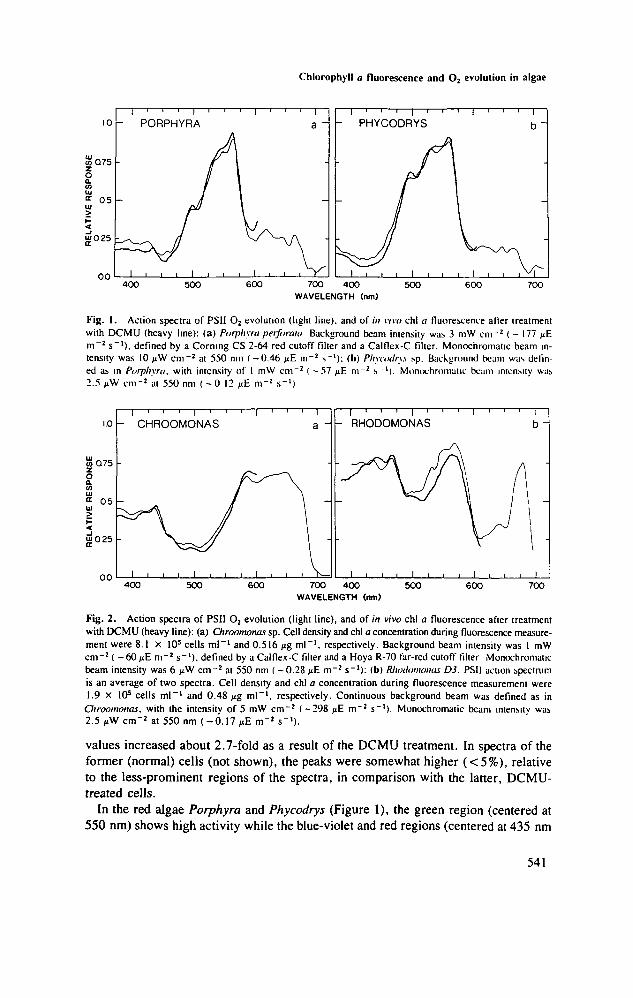
Fig. 1. Action spectra of PSII O2 evolution (light line), and of in vivo chl a fluorescence after treatmentwith DCMU (heavy line): (a) Porphyra perforaui Background beam intensity was 3 mW cm"2 ( - 177 jtEm~2 s"1), defined by a Corning CS 2-64 red cutoff filter and a Calflex-C filter. Monochromatic beam in-tensity was 10 /iW cm"2 at 550 nm ( -0.46 1): (b) Pliyaxlr\s sp. Background beam was defin-ed as in Porphyra. with intensity of 1 mW cm"2 ( - 5 7 fi£ m~2 s '). Monochromatic beam intensity was2.5 jiW cm"2 at 550 nm ( - 0 12 ^E m~2 s"1)
| 1 1 1 1 1 1 1
CHROOMONAS
0 04 0 0 500 600 700 400
WAVELENGTH (nm)500 600 700
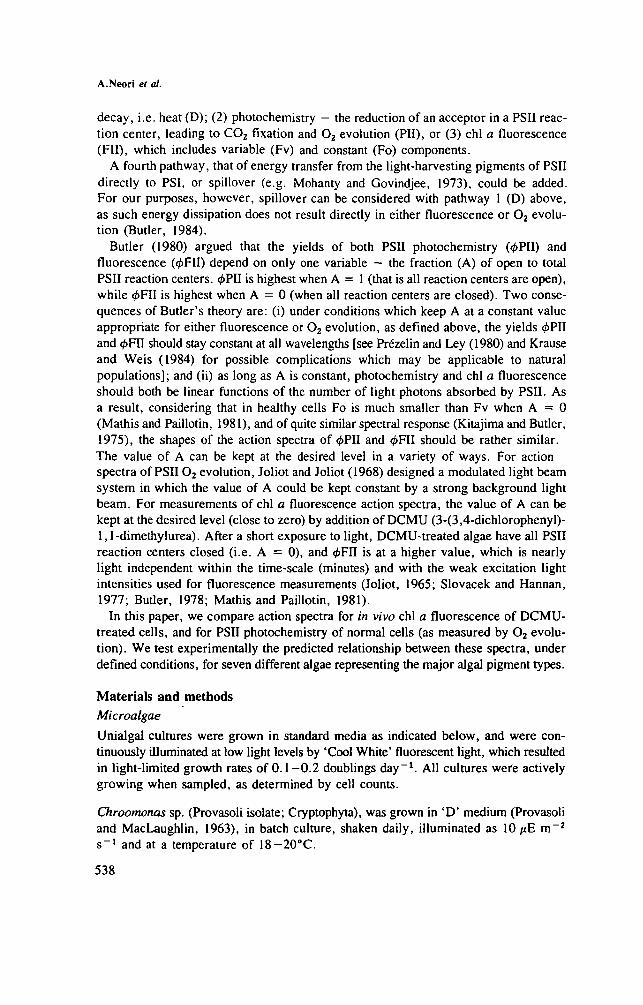
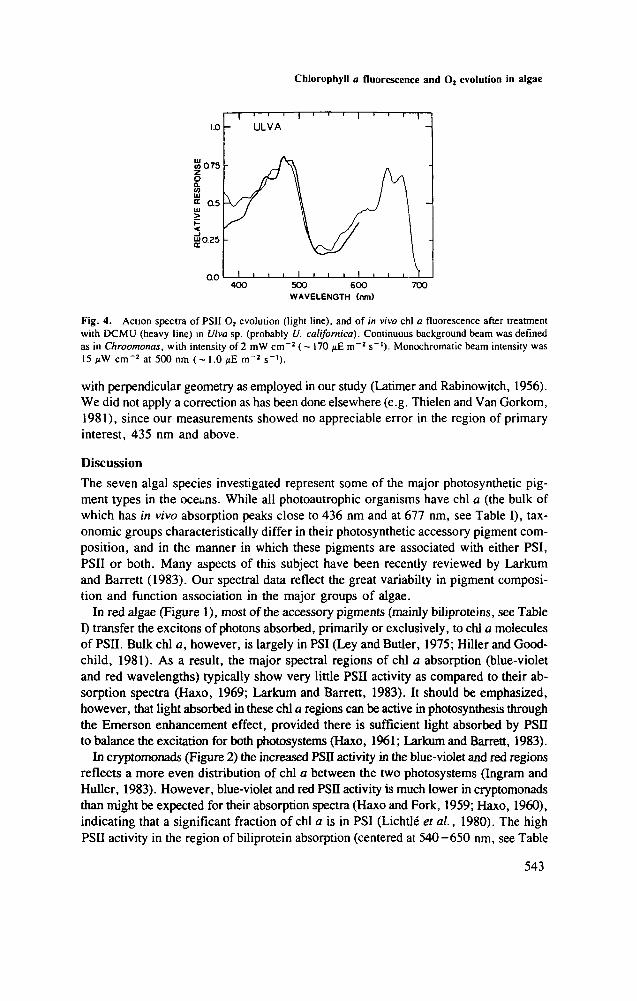
Fig. 2. Action spectra of PSII O2 evolution (light line), and of in vivo chl a fluorescence after treatmentwith DCMU (heavy line): (a) Chroomonas sp. Cell density and chl a concentration during fluorescence measure-ment were 8.1 X 10⁵ cells ml"1 and 0.516 jig ml"1, respectively. Background beam intensity was 1 mWcm"2 ( - 6 0 / J E m~2 s"1). defined by a Calflex-C filter and a Hoya R-70 far-red cutoff filter Monochromaticbeam intensity was 6 >iW cm~2 at 550 nm (— 0.28 pE m~2 s"1): (b) Rhoilomonas D3. PSII action spectrumis an average of two spectra. Cell density and chl a concentration during fluorescence measurement were1.9 x 10s cells ml"1 and 0.48 fig ml"1, respectively. Continuous background beam was defined as in
Chroomonas. with the intensity of 5 mW cm"2 ( -298 /iE m"2 s"1). Monochromatic beam intensity was2.5 pW cm"2 at 550 nm ( -0 .17 / iE m"2 s"1).
values increased about 2.7-fold as a result of the DCMU treatment. In spectra of theformer (normal) cells (not shown), the peaks were somewhat higher (<5%), relativeto the less-prominent regions of the spectra, in comparison with the latter, DCMU-treated cells.
In the red algae Porphyra and Phycodrys (Figure 1), the green region (centered at550 nm) shows high activity while the blue-violet and red regions (centered at 435 nm
541
A.Neori et at.
£025
0.0400 500 600 700 400
WAVELENGTH (nm)500 600 700
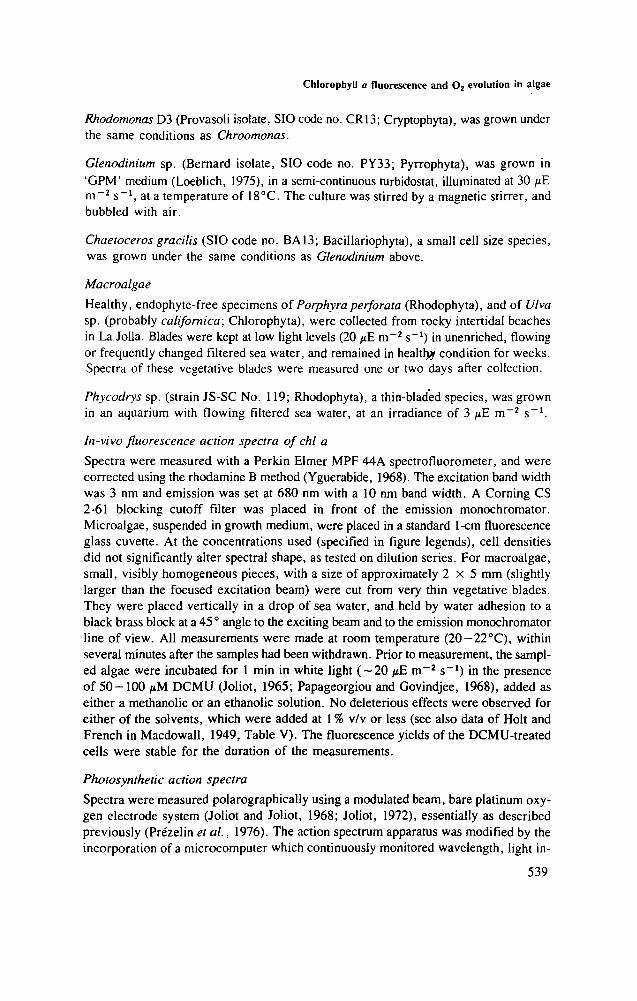
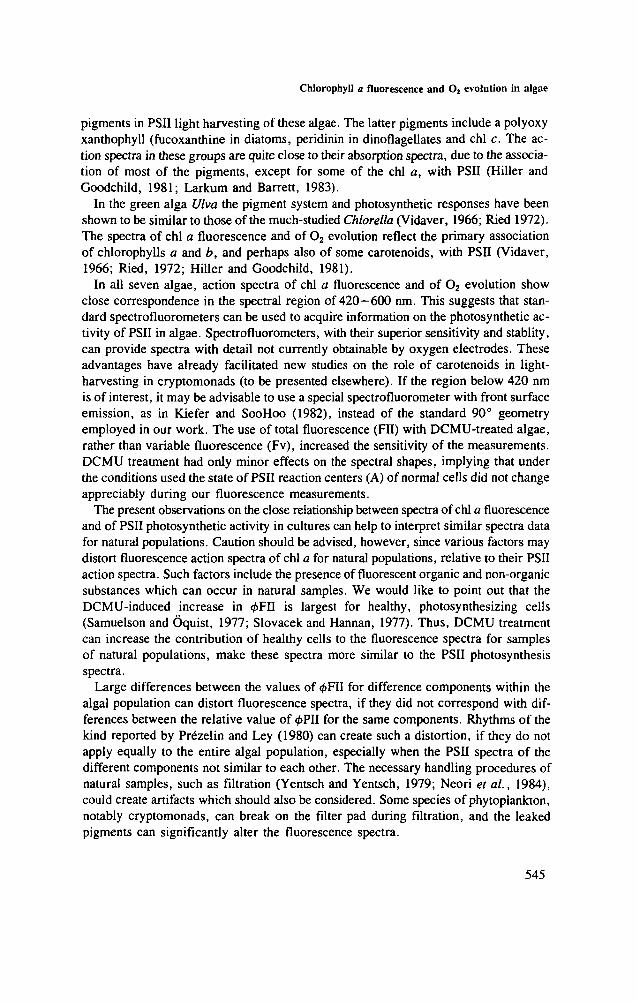
Fig. 3. Action spectra of PSII O2 evolution (light line), and of in vivo chl a fluorescence after treatmentwith DCMU (heavy line): (a) Glenodinium sp. PSII spectrum is an average of three spectra. Cell densityand chl a concentration during fluorescence measurements were 1.7 X 10s cells ml"1 and 0.214 jig ml"1,respectively. Continuous background beam was defined as in Chroomonas with intensity of 1.5 mW cm"2
( - 127 fiE m~2 s"1). Monochromatic beam intensity was cm"2 at 550 nm ( - 0 . 4 /xE m"2 s"1);(b) Chaeloceros gracilis. Cell density and chl a concentration during fluorescence measurement were 10s
cells ml"1 and 0.291 jtg ml"1, respectively. Continuous background beam was defined as in Chroomonas,with intensity of 3 mW cm"2 (~255 yS. m"2 s"1). Monochromatic beam intensity was 7.5 /iW cm"2 at550 nm ( - 0 . 5 nE m~2 s"1).
and 675 nm, respectively) show relatively little response. The action spectra for chla fluorescence closely match those for PSII O2 evolution activity.
In the cryptomonads Chroomonas and Rhodomonas (Figure 2), the blue and redregions, as well as the green region in Rhodomonas (phycoerythrin-rich) and the orangeregion (centered at 620 nm) in Chroomonas (phycocyanin-rich) display prominent ac-tivity. The match between the spectra of chl a fluorescence and PSSI O2 evolution isvery close in Chroomonas. In Rhodomonas, the fluorescence spectrum deviates fromthe PSII O2 evolution spectrum by up to 20%.
The dinoflagellate Glenodinium and the diatom Chaetoceros (Figure 3), belong toa collective group of algae containing chl a and c and a major polyoxy xanthophyll(peridinin and fucoxanthin, respectively). In both, the blue-violet, blue (centered at470 nm) and red regions show higher activity than in the green region, with a distinctshoulder in the blue-green (centered at 520 nm). The match between the chl afluorescence spectrum and the PSII O2 evolution spectrum is very close in both algae.Interestingly, the action spectra of the two algae are also very similar to each otherand to the spectra of several other diatoms and dinoflagellates we have examined (Neoriand Haxo, unpublished). Such a similarity between these two algal orders was notedby Yentsch and Yentsch (1979).
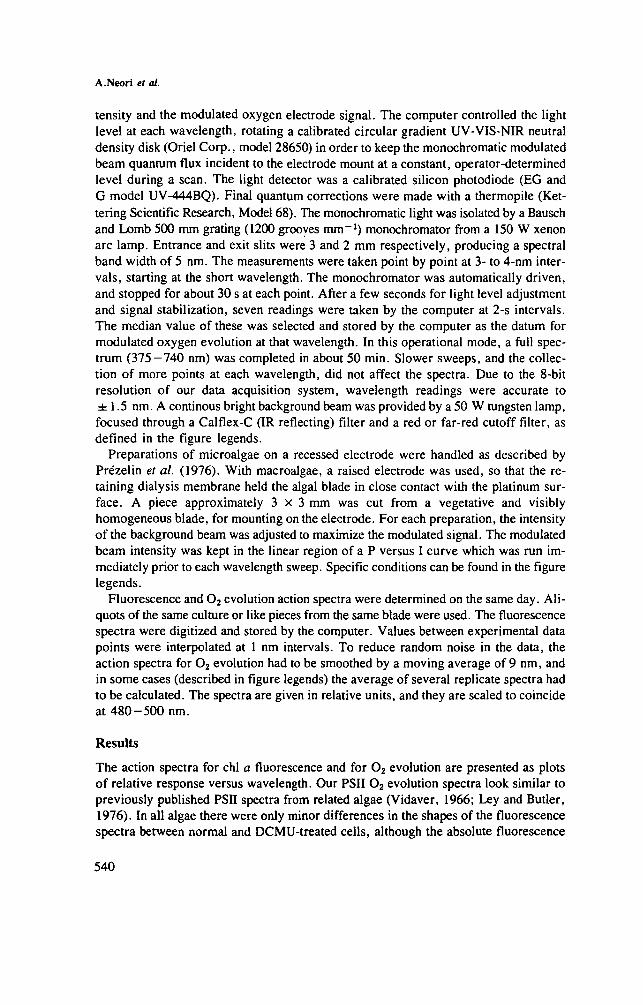
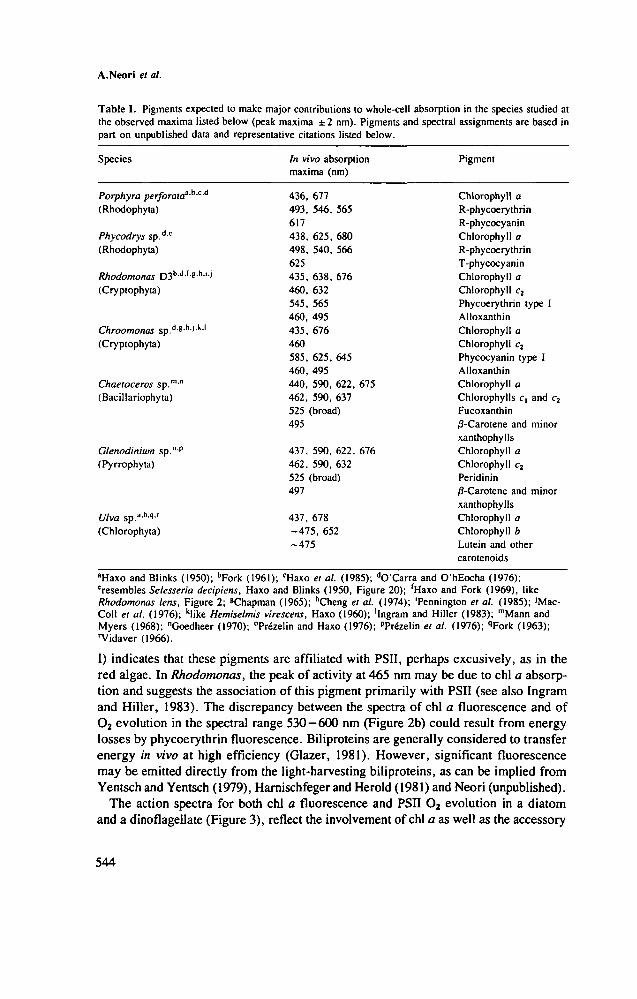
In the chl a- and ^-containing green ;Jga Ulva (Figure 4), the most active regionsare the red and the blue, with distinct shoulders in the blue-violet and in the orangeregions. The match between spectra of chl a fluorescence and PSII O2 evolution is good.
In some of the figures, at wavelengths shorter than 420 nm, the spectra of chl afluorescence increasingly deviate from those of PSSI O2 evolution. We attribute thisdiscrepancy to selective light scattering by the algae. This scattering increases exponen-tially with decreasing wavelength at that region when using a standard spectrofluorometer
542
Chlorophyll a fluorescence and O2 evolution in algae
0.0400 500 600
WAVELENGTH (nm)700
Fig. 4. Action spectra of PSI1 O2 evolution (light line), and of in vivo chl a fluorescence after treatmentwith DCMU (heavy line) in Ulva sp. (probably U. californica). Continuous background beam was definedas in Chroomonas, with intensity of 2 mW cm"2 ( - 170 /iE m~2 s~'). Monochromatic beam intensity was15 cm"2 at 500 nm (~ 1.0 i>£ m~2 s"1)-
with perpendicular geometry as employed in our study (Latimer and Rabinowitch, 1956).We did not apply a correction as has been done elsewhere (e.g. Thielen and Van Gorkom,1981), since our measurements showed no appreciable error in the region of primaryinterest, 435 nm and above.
Discussion
The seven algal species investigated represent some of the major photosynthetic pig-ment types in the oceans. While all photoautrophic organisms have chl a (the bulk ofwhich has in vivo absorption peaks close to 436 nm and at 677 nm, see Table I), tax-onomic groups characteristically differ in their photosynthetic accessory pigment com-position, and in the manner in which these pigments are associated with either PSI,PSII or both. Many aspects of this subject have been recently reviewed by Larkumand Barrett (1983). Our spectral data reflect the great variabilty in pigment composi-tion and function association in the major groups of algae.
In red algae (Figure 1), most of the accessory pigments (mainly biliproteins, see TableI) transfer the excitons of photons absorbed, primarily or exclusively, to chl a moleculesof PSn. Bulk chl a, however, is largely in PSI (Ley and Butler, 1975; Hiller and Good-child, 1981). As a result, the major spectral regions of chl a absorption (blue-violetand red wavelengths) typically show very little PSII activity as compared to their ab-sorption spectra (Haxo, 1969; Larkum and Barrett, 1983). It should be emphasized,however, that light absorbed in these chl a regions can be active in photosynthesis throughthe Emerson enhancement effect, provided there is sufficient light absorbed by PSIIto balance the excitation for both photosystems (Haxo, 1961; Larkum and Barrett, 1983).
In cryptomonads (Figure 2) the increased PSII activity in the blue-violet and red regionsreflects a more even distribution of chl a between the two photosystems (Ingram andHuller, 1983). However, blue-violet and red PSII activity is much lower in cryptomonadsthan might be expected for their absorption spectra (Haxo and Fork, 1959; Haxo, I960),indicating that a significant fraction of chl a is in PSI (Lichtle et al., 1980). The highPSII activity in the region of biliprotein absorption (centered at 540-650 nm, see Table
543
A.Neori el al.
Table I. Pigments expected to make major contributions to whole-cell absorption in the species studied atthe observed maxima listed below (peak maxima ±2 nm). Pigments and spectral assignments are based inpart on unpublished data and representative citations listed below.
Phycoerythrin type IAlloxanthinChlorophyll aChlorophyll c2
Phycocyanin type IAlloxanthinChlorophyll aChlorophylls ct and c2
Fucoxanthin/3-Carotene and minorxanthophyllsChlorophyll aChlorophyll c2
Peridinin0-Carotene and minorxanthophyllsChlorophyll aChlorophyll bLutein and othercarotenoids
aHaxo and Blinks (1950); bFork (1961); cHaxo et al. (1985); dO'Carra and O'hEocha (1976);'resembles Selesseria decipiens, Haxo and Blinks (1950, Figure 20); rHaxo and Fork (1969), likeRhodomonas lens, Figure 2; 8Chapman (1965); hCheng et al. (1974); 'Pennington el al. (1985); JMac-Coll et al. (1976); klike Hemiselmis virescens, Haxo (1960); 'Ingram and Hiller (1983); mMann andMyers (1968); "Goedheer (1970); "Prezelin and Haxo (1976); PPr^zelin et al. (1976); qFork (1963);"Vidaver (1966).
I) indicates that these pigments are affiliated with PSII, perhaps excusively, as in thered algae. In Rhodomonas, the peak of activity at 465 nm may be due to chl a absorp-tion and suggests the association of this pigment primarily with PSII (see also Ingramand Hiller, 1983). The discrepancy between the spectra of chl a fluorescence and ofO2 evolution in the spectral range 530—600 nm (Figure 2b) could result from energylosses by phycoerythrin fluorescence. Biliproteins are generally considered to transferenergy in vivo at high efficiency (Glazer, 1981). However, significant fluorescencemay be emitted directly from the light-harvesting biliproteins, as can be implied fromYentsch and Yentsch (1979), Harnischfeger and Herald (1981) and Neori (unpublished).
The action spectra for both chl a fluorescence and PSII O2 evolution in a diatomand a dinoflagellate (Figure 3), reflect the involvement of chl a as well as the accessory
544
Chlorophyll a fluorescence and O2 evolution in algae
pigments in PSII light harvesting of these algae. The latter pigments include a polyoxyxanthophyll (fucoxanthine in diatoms, peridinin in dinoflagellates and chl c. The ac-tion spectra in these groups are quite close to their absorption spectra, due to the associa-tion of most of the pigments, except for some of the chl a, with PSII (Hiller andGoodchild, 1981; Larkum and Barrett, 1983).
In the green alga Ulva the pigment system and photosynthetic responses have beenshown to be similar to those of the much-studied Chlorella (Vidaver, 1966; Ried 1972).The spectra of chl a fluorescence and of O2 evolution reflect the primary associationof chlorophylls a and b, and perhaps also of some carotenoids, with PSII (Vidaver,1966; Ried, 1972; Hiller and Goodchild, 1981).
In all seven algae, action spectra of chl a fluorescence and of O2 evolution showclose correspondence in the spectral region of 420-600 nm. This suggests that stan-dard spectrofluorometers can be used to acquire information on the photosynthetic ac-tivity of PSII in algae. Spectrofluorometers, with their superior sensitivity and stablity,can provide spectra with detail not currently obtainable by oxygen electrodes. Theseadvantages have already facilitated new studies on the role of carotenoids in light-harvesting in cryptomonads (to be presented elsewhere). If the region below 420 nmis of interest, it may be advisable to use a special spectrofluorometer with front surfaceemission, as in Kiefer and SooHoo (1982), instead of the standard 90° geometryemployed in our work. The use of total fluorescence (FII) with DCMU-treated algae,rather than variable fluorescence (Fv), increased the sensitivity of the measurements.DCMU treatment had only minor effects on the spectral shapes, implying that underthe conditions used the state of PSII reaction centers (A) of normal cells did not changeappreciably during our fluorescence measurements.
The present observations on the close relationship between spectra of chl a fluorescenceand of PSII photosynthetic activity in cultures can help to interpret similar spectra datafor natural populations. Caution should be advised, however, since various factors maydistort fluorescence action spectra of chl a for natural populations, relative to their PSIIaction spectra. Such factors include the presence of fluorescent organic and non-organicsubstances which can occur in natural samples. We would like to point out that theDCMU-induced increase in 0FII is largest for healthy, photosynthesizing cells(Samuelson and Oquist, 1977; Slovacek and Hannan, 1977). Thus, DCMU treatmentcan increase the contribution of healthy cells to the fluorescence spectra for samplesof natural populations, make these spectra more similar to the PSII photosynthesisspectra.
Large differences between the values of 0FII for difference components within thealgal population can distort fluorescence spectra, if they did not correspond with dif-ferences between the relative value of #PII for the same components. Rhythms of thekind reported by Pr6zelin and Ley (1980) can create such a distortion, if they do notapply equally to the entire algal population, especially when the PSII spectra of thedifferent components not similar to each other. The necessary handling procedures ofnatural samples, such as filtration (Yentsch and Yentsch, 1979; Neori et al., 1984),could create artifacts which should also be considered. Some species of phytoplankton,notably cryptomonads, can break on the filter pad during filtration, and the leakedpigments can significantly alter the fluorescence spectra.
545
A.Neori el al.
The relationship between PSII action spectra and total photosynthesis action spectrawarrants further discussion. In populations comprised of diatoms and dinoflagellates,fluorescence spectra as shown here may well give a good approximation of the spectralresponse of absorption and of overall photosynthetic potential, since most of the pigmentsare associated with PSII. On the other hand, in populations dominated by biliprotein-containing red algae and cyanobacteria, there would be a large difference between thespectrum of chl a fluorescence and the spectrum for potential overall photosynthesis,due to the preferential association of chl a and of the accessory pigments with differentphotosystems. This is also true of the biliprotein-containing cryptomonads, but to alesser extent. In such cases, the use of chl a fluorescence spectra, which are relatedto PSII activity alone, can lead to major underestimates of the photosynthetic potentialsof populations.
Bearing in mind the possible distortions, whose magnitude and importance cannotbe evaluated until measurements of the photosynthetic action spectra for a range offield samples are possible, the present study (as well as additional studies in progress)of laboratory cultures suggest that fluorescence excitation spectra of chl a in vivo whenapplied to such field samples provide a fair measure of PSII activity.
Acknowledgements
We acknowledge with gratitude the inspiration provided by the late W.L.Butler andhis help with instrumentation. Supported in part by NSF-DPP grant 82-12362 to O.H.H.,DOE contract DE-AT03-82ER60031, and a grant to A.N. O.H.H. and F.T.H. fromthe Fund for Ocean Research. Travel to the Ilnd GAP workshop was facilitated bya DOE grant to the convenors, by a UCSD Chancellor's Associates Grant and by theSIO graduate department. We thank Joan G.Stewart for providing specimens ofPhycodrys, R.A.Lewin for providing specimens of Porphyra, D.S.Berns for providingthe culture of Chroomononas, J.Lance for help with cultures, J. and E. Yguerabide forthe use of their spectrofluorometer, R.C.Booth, Y.Blatt and L.Petrosian for technicaladvice, and T.A.Nichols for the design and construction of our data acquisition system.This study was the partial fulfilment for a Ph.D. degree by A.N.
References
Butler.W.L.. (1978) Energy distribution in the photochemical apparatus of photosynthesis. Ann. Rev. PlantPhysiol, 29, 345-378.
Butler.W.L. (1980) Energy transfer between PSII units in a connected package model of the photochemicalapparatus of photosynthesis. Proc. Natl. Acad. Sci. USA, 77. 4697-4701.
Butler,W.L. (1984) Exciton transfer out of open photosystem II reaction centers. Phowchem. Photobiol.,40, 513-518.
Chapman,D.J. (1965) Studies on the carotenoids of the flagellate cryptophyceae, and the chloroplast pigmentsof the endosymbiotic algae in Cyanophora paradoxa and Glaucocystis nostochinearum. Ph.D. Thesis,University of California, San Diego, 169 pp.
Cheng.J.Y., Don-Paul,M. and Antia.N.J. (1974) Isolation of an unusually stable cw-isomer of alloxanthinfrom a bleached autolysed culture of Chroomonas salina grown photoheterotrophically on glycerol. Obser-vations on cis-trans isomerization of alloxanthin. J. Protozooi, 21, 761-768.
Dutton.H.J., Manning,W.M. and Duggar.D.M. (1943) Chlorophyll fluorescence and energy transfer in thediatom Nitzchia closterium. J. Phys. Chem.. 47, 308-313.
Duysens.L.N.M. (1952) Transfer of excitation energy in photosynthesis. Ph.D. Thesis, State Universityof Utrecht, The Netherlands.
546
Chlorophyll a fluorescence and O2 evolution in algae
Fork.D.C. (1961) Studies on photosynthetic enhancement in relation to chlorophyll a activity and accessorypigment function. Ph.D. Thesis, University of California, 128 p.
Fork.D.C. (1963) Observations of the function of chlorophyll a and accessory pigments in photosynthesis.In Kok.B. and Jagendorf,A.T. (eds), Photosynthetic Mechanisms of Green Plants. National Academy ofSciences—National Research Council, Washington, DC, pp. 352-361.
Fork.D.C. and Amesz,J. (1969) Action spectra and energy transfer in photosynthesis. Ann. Rev. Plant Phvswl..20, 305-328.
Glazer.A.N. (1981) Photosynthetic accessory proteins with bilin prosthetic groups. In Hatch.M.D. and Board-man,N.K. (eds), The Biochemistry of Plants. Academic Press, New York, Vol. 8, pp. 51-96.
Goedheer.J.C. (1970) On the pigment system of brown algae. Photosynthetica, 4, 97-106.Goedheer.J.C. (1972) Fluorescence in relation to photosynthesis. Ann. Rev. Plant Physiol., 23, 87-112Harnischfeger.H. and Herold.B. (1981) Aspects of energy-transfer between phycobilins and chlorophyll in
Chroomonas spec. (Cryptophycea). Ber. Deutsch. Bot. Ces. Bd., 94, 6 5 - 7 3 .Haxo.F.T. (1960) The wavelength dependence of photosynthesis and the role of accessory pigments. In
Allen,M.B. (ed.), Comparative Biochemistry of Photoreactive Systems. Academic Press, New York,pp. 339-360.
Haxo.F.T. (1961) Some implications of recent studies on the role of accessory pigments to photosynthesisin submarine daylight. In Pacific Science Congr., 10th (Honolulu), Abstracts, p. 159.
Haxo.F.T. and Blinks,L.R. (1950) Photosynthetic action spectra of marine algae. J. Gen. Physiol., 33,389-422.
Haxo.F.T. and Fork.D.C. (1959) Photosynthetically active accessory pigments of cryptomonads. Nature,184, 1051-1052.
Haxo.F.T., O'hEocha,C. and Norris,P. (1955) Comparative studies of chromatographically separatedphycoerythrins and phycocyanins. Arch. Biochem. Biophys., 54, 162 — 173.
Hiller,R.G. and Goodchild,D.J. (1981) Thylakoid membrane and pigment organization. In Hatch,M D. andBoardman.N.K. (eds), The Biochemistry of Plants, Academic Press, New York, Vol. 8, pp. 2 -49 .
Ingram,K. and Hiller.R.G. (1983) Isolation and characterization of a major chlorophyll alcl light-harvestingprotein from a Chroomonas species (Cryptophyceae). Biochim. Biophys. Ada, 722, 310-319.
Joliot.P. (1965) Etudes simultanees des cinetique de fluorescence et demission d'oxygene photosyntheti-que. Biochim. Biophys. Acta, 102, 135-148.
Joliot.P. (1972) Modulated light source use with the oxygen electrode. Methods Enzymol., 24B, 123 -134.Joliot.P. and Joliot.A. (1968) A polarographic method for detection of oxygen production and reduction
of Hill reagents by isolated chloroplasts. Biochim. Biophys. Acta, 153, 625-634.Kiefer.D.A. and SooHoo.J.B. (1982) Spectral absorption by marine particles of coastal waters off Baja Califor-
nia. Umnol. Oceanogr, 27, 492-499.Kitajima.M. and Butler,W.L. (1975) Excitation spectra for photosystem I and photosystem II in chloroplasts
and the spectral characteristics of the distribution of quanta between the two photosystems. Biochim. Biophys.Acta, 408, 297-305.
Krause.G.H. and Weis.E. (1984) Chlorophyll a fluorescence as a tool in plant physiology. II. Interpretationof fluorescence signals. Photosyn. Res., 5, 139-157.
Larkum.A.W.D. and Barrett.J. (1983) Light harvesting processes in algae. In Woolhouse.H.W. (ed.). Ad-vances in Botanical Research. Academic Press, London, Vol. 10, pp. 1-219.
Latimer.P. and Rabinowitch.E. (1956) Selective scattering of light by pigment containing plant cells. J. Chem.Phys., 24, 480.
Ley.A.C. and Butler,W.L. (1976) Efficiency of energy transfer from photosystem II to photosystem I inPorphyridium cruentum. Proc. Nail. Acad. Sci. USA, 77, 3957-3960.
Lichtle.C. Jupin.H. and Duval.J.C. (1980) Energy transfers from photosystem II to photosystem 1 in Cryp-tomonas rufescens (Cryptophyceae). Biochim. Biophys. Acta, 591, 104-112.
Loeblich,A.R.,III (1975) A sea water medium for dinoflagellates and the nutrition of Cachonina niei. J.Phycol., 11, 80 -86 .
MacColl.R., Berns.D.S. and Gibbons.O. (1976) Characterization of cryptomonad phycoerythrin and phyco-cyanin. Arch. Biochem. Biophys., 177, 265-275.
Macdowall.F.D.H. (1949) The effects of some inhibitors of photosynthesis upon the photochemical reduc-tion of a dye by isolated chloroplasts. Plant Physiol., 24, 462 -480.
Mann.J.E. and Myers,J. (1968) On pigments, growth and photosynthesis of Phaeodactylum tricornutum.J. Phycol, 4, 349-355.
Mathis.P. and Paillotin,G. (1981) Primary processes of photosynthesis. In Hatch.M.D. and Boardman.N K.
547
A.Neori et al.
(ed). The Biochemistry of Plants. Academic Press, New York, Vol. 8, pp. 98 -161 .Mitchell.B.G. and Kiefer.D.A. (1984) Determination of absorption and fluorescence excitation spectra forphytoplankton. In Holm-Hansen.O.. Bolis.L. and Gilles.R. (eds). Marine Phytoplankron and Productivity.
Springer-Verlag, Berlin, pp. 157-169.Mohanry.P. and Govindjee (1973) Light-induced changes in the fluorescence yield of chlorophyll a in Anacystis
nidulans n. The fast changes and the effect of photosynthetic inhibitors on both the fast and slow fluorescenceinduction. Plant Cell Physioi, 14, 611-629.
Neori.A., Holm-Hansen.O., Mitchell.B.G. and Kiefer.D.A. (1984) Photoadaptation in marine phytoplankton:changes in spectral absorption and excitation of chlorophyl a fluorescence. Plant Physioi., 76, 518-524.
O'Carra.P. and O'hEocha.C. (1976) Algal biliproteins and phycobilins. In Goodwin.T.W. (ed.). Chemistryand Biochemisty of Plant Pigments. Academic Press, London, Vol. 1, 2nd edn, pp. 328-376.
Papageorgiou.P. and Govindjee (1968) Light-induced changes in the fluorescence yield of chlorophyll a invivo. I. Anacystis nidulans. Biophys. J., 8, 1299 — 1315.
Pennington.F.C, Haxo.F.T., Borch.G. and Liaaen-Jensen,S. (1985) Carotenoids of Cryptophyceae. Biochem.Syst. Ecol., 13, 215-219.
Pre'zelin.B.B. and Haxo.F.T. (1976) Purification and characterization of peridinin-chlorophyll a-proteinsfrom the marine dinoflagellates Glenodinium sp and Conyaulaxpolyedra. Planta (Berl.), 128, 133 — 141.
Pre'zelin.B.B., Ley.A.C. and Haxo.F.T. (1976) Effects of growth irradiance on the photosynthetic actionspectra of the marine dinoflagellate. Glenodiniuin sp. Planta (Berl.). 130, 251-256.
Prezelin.B.B. and Ley,A.C. (1980) Photosynthesis and chlorophyll a fluorescence rhythms of marinephytoplankton. Mar. Biol., 55, 295-307.
Provasoli.L. and MacLaughlin.J.J.A. (1963) Limited heterotrophy of some photosynthetic dinoflagellates.In Oppenheimer.C.H. (ed.), Symposium on Marine Microbiology. Charles C.Thomas Publishers, Springfield,IL, pp. 105-113.
Ried.A. (1972) Improved action spectra of light reactions I and II. In Forti.G., Avron.M. and Melandri.A.(eds), IlndInternational Congress on Photosynthesis Research. Dr W.Junk N.V. Publishers, The Hague,pp. 763-772.
Samuelson.G. and Oquist.G. (1977) A method for studying photosynthetic capacity of unicellular algae bas-ed on in vivo chlorophyll fluorescence. Physioi. Plant., 40, 315-319.
Slovacek.R.E. and Hannan.P.J. (1977) In vivo fluorescence determination of phytoplankton chlorophyll a.limnol. Oceanogr., 22, 919-924.
Thielen.A.P.G.M. and Van Gorkom,H.J. (1981) Quantum efficiency and antenna size of PS Ila, II/3 andI in tobacco chloroplasts. Biochim. Biophys. Ada, 635, 111-120.
Vidaver.W. (1966) Separate action spectra for the two photochemical systems of photosynthesis. Plant Physioi.,41, 87-89.
Yemsch.C.S. and Yentsch.C.M. (1979) Fluorescence spectral signatures: the characterization of phytoplanktonpopulations by the use of excitation and emission spectra. J. Mar. Res., 37, 471—483.
Yguerabide.J. (1968) Fast and accurate method for measuring photon flux in the range 2500—6000 A. Rev.Sci. Instr., 39, 1048-1052.