Page 1
Proceedings of the International Conference on Industrial Engineering and Operations Management
Bandung, Indonesia, March 6-8, 2018
© IEOM Society International
Relationship between Safety Climate Factors and Safety
Performance in Chemical Industries
Shalini Tayaparan, Jafri Mohd Rohani, Khidzir Zakaria, Fatin Amrina A Rashid, Mohd
Izuddin M Ithnan Department of Materials, Manufacturing & Industrial Engineering,
Faculty of Mechanical Engineering,
Universiti Teknologi Malaysia,
81310 Skudai, Johor Bahru, Malaysia
[email protected] , [email protected] , [email protected] , [email protected] ,
[email protected]
Abstract
Safety is an important issue in the rapid industrialization especially in chemical industries. The objective
of this study is to investigate relationship between safety climate factors and safety performance in
chemical industries and proposes a new framework. This study uses safety management, work pressure,
safety competence, safety procedures, safety communication and safety supervision as independent
variables that explain the relationship towards safety performance in chemical industry at Pasir Gudang,
Johor. A survey instrument was developed, and 220 responses were collected. Factor analysis and
multiple linear regression was used to analyze the data collected using SPSS software. As a result, safety
climate factors (safety management and work pressure, safety competence, safety communication and
safety procedures) were able to explain 47.2% of variation safety performance. Nonetheless, it was found
that reflections of safety climate factors on safety performance could not be similar with each industry,
since findings would fluctuate due to geographical context and individual context. Despite the limitations,
this study contributes to the literature by revealing table factor structures, where appropriate level of
reliability and validity measures of safety climate factors and safety performance scales were developed.
Keywords
Safety Climate Factors; Safety Performance; Factor Analysis; Multiple Regression; SmartPLS; Chemical
Industries
1. IntroductionIndustrial accidents are considered as a major social challenge. According to International Labor
Organization (ILO), it was reported that approximately 360 million fatal and 337 million non-fatal work-related
accidents occur worldwide every year which holds the estimated cost of US $5 Billion worldwide (Hon, Chan, &
Yam, 2014). The recent rapid industrialization, occupational safety is being a severe issue that shall be considered in
all industrial and human activities. Unawareness and improper safety management could indirectly report the
phenomenon of industrial accidents. Thus, a well-established method is required to evaluate the link between
existing organizational characteristics and safety at work including risk for accidents.
Historically, in the industrial sector, the accident reduction approach has focused on examining “lagging”
data or commonly known as past events, such as lost-time accident rates and incident rates (Rhona Flin, 2007).
Based on lagging data, the injury or fatality needed to occur before the company took action to eliminate or reduce
exposure to the hazard. Therefore, reporting was after an incident rather than a proactive attempt to prevent injury.
However, these Traditional methods of improving safety within industry focused primarily on accident
investigations to determine specific causes has been recommended for changes in the future by adopting an
approach to prevent injuries and fatalities by focusing on predictive measures to monitor safety culture (R Flin,
Mearns, O’Connor, & Bryden, 2000). Current safety management and injury prevention study suggests human
behavior may have a greater role in preventing injuries or fatalities than was first suspected. Safety climate factors
derive an approach to relate human behavior with accident preventions
2956
Page 2
Proceedings of the International Conference on Industrial Engineering and Operations Management
Bandung, Indonesia, March 6-8, 2018
© IEOM Society International
1.1 Safety Climate Factors Safety climate factor has been defined as sum of employee’s shared perceptions of policies, procedures, and
practices relating to safety in their working environment by Zohar, who first introduced safety climate as crucial
construct for study of variables linked to accidents and injuries in the work place (Liu et al., 2015). Safety climate
factors have been widely used for over 3 decades across diverse industries since they reflect characteristic of
organizations since the attitudes of a specific group of people toward safety issues are important. Safety climate also
provides a snapshot of organization state if safety at a discrete point in time (Vinodkumar & Bhasi, 2009). Safety
climate factors will help to raise safety motivation, which then will increase safety knowledge of workers. Good
safety knowledge among workers will make the workers be more confident in perceiving the safety and thus will
leads to positive safety behaviour. Positive safety behaviour at the end will reduce the accidents and injuries which
will reflect good safety performance (Rhona Flin, 2007). Zohar in 1980 first developed safety climate using 40 items questionnaires in multiple industries in Israel.
He concluded eight dimensions of safety climate through factor analysis which were safety training, management
attitude towards safety, effects of safe conduct on promotion, states of safety officer, effects of state of conduct on
social states and states of safety committee. However, further studies have been conducted by other researchers who
have developed more factors such as employees’ perception of management activities. Vinodkumar and Bhasi
(2009) hhighlighted that, there were more studies had been conducted in the past three decades and many new
factors were developed through the study on safety climate. Those factors include material factors ( plant decision,
production equipment, personal protective equipment), policies and practices ( safety provokes, training,
enforcement, daily routines, housekeeping), safety related conditions (work stress, social relations with coworkers),
behavioral and attitude factors (personal motivation, safety knowledge, optimism, risk justification, fatalism, apathy)
and level of concern and action by different people in work place (management, supervision, safety specialists, and
safety committee).
Barbaranelli et.al (2015) explained that Zohar, founder of safety climate factors have highlighted some
important safety climate dimensions to be considered when conceptualizing and measuring safety climate factors in
industries (Barbaranelli et al., 2015). Those important climate factors include management values, safety
communication, safety training, and safety system. Apart from this, Flin et al (2000) also have identified five most
frequently occurring factors from 18 safety climate scales of different industries which were management or
supervision, safety system, risk pressure, and competence (R Flin et al., 2000). Besides these, safety rules and
procedures and worker’s involvement in safety also being concerned as the most fundamental safety climate factors
in industries (Zhou, Fang, & Wang, 2008).
1.2 Safety Performance Safety performance is defined as evaluative ‘actions or behaviors that individuals exhibit in almost all jobs to
promote the health and safety of workers, clients, the public and the environment’ (Burke, Sarpy, E.Tesluk, &
Smith-Crowe, 2002). In other words, safety performance is defined as ‘activities which a department head carries
out to ensure safety (Wu, Chang, Shu, Chen, & Wang, 2011).
It was common to use self-report data of accidents or injuries to measure the safety performance of an
organization in the past decades. However, continuous studies conducted had been found out that the accidents and
injuries data are unreliable since the frequency of them are indefinable and unpredictable although the accuracy of
self-reported injuries could be as high as 80% (M. Dominic Cooper & Phillips, 2004).
Thus, in light of the deficiency in using self-reported injuries and accidents as indicators of safety
performance, (Hon et al., 2014) explained that safety behavior can be used as a measure of safety performance and
this safety behavior has been adapted as safety performance indicators by researchers in their study until present
which will be more discussed in the literature review section. Despites to safety behavior, the two fundamental
safety performance indicators used by researchers are safety compliance and safety participation.
Safety compliance is defined as adherence to rules and procedures developed by companies and regulatory
bodies by Zohar (2011). In other words, it also can be simplified as following rules in core safety activities which
include obeying safety regulations, following correct procedures, and using appropriate equipment (Neal & Griffin,
2006). Meanwhile, safety participation is defined a behavior that indirectly contribute to an individual’s personal
safety.
1.3 The need of Safety Climate Survey in Chemical Industries Chen, McCabe, and Hyatt (2017) reported that the risks in chemical industries have been increasing recently due to
the increased complexity if the systems and thus accidents in chemical industries can be caused by new, unforeseen
mechanisms. Therefore, well-managed safety engineering is dominant to predict these unexpected risks in chemical
2957
Page 3
Proceedings of the International Conference on Industrial Engineering and Operations Management
Bandung, Indonesia, March 6-8, 2018
© IEOM Society International
industries. Furthermore, it was explained that the concern on safety of chemical industries had been acknowledged
only through Bhopal Gas Tragedy in India in 1984 which was caused by reliance of human life by company
management, ignorance of complacency of workers, and total irresponsible attitude from regulatory
agencies(Vinodkumar & Bhasi, 2009). Furthermore, the author explained that these negligence of any of the above
factors possible to cause such catastrophic accidents in chemical industries worldwide. As a supportive tool for this
Beale has reported that some major accidents in chemical industries such as Major explosion in Toulouse, France in
2001 which caused 29 fatalities, high pressure gas pipeline explosion in Belgium in 2004 which caused 24 fatalities,
and major explosion at BP Texas in 2005 which caused 12 fatalities (WIEF, 2012). These major accidents share the
common causes which are some of the dimensions of the safety climate factors as been developed by previous
studies (Zohar, 2010).
In Malaysia, there are less accident statistics (lagging indicator) in chemical industries available and
reliable to measure the safety performance. According to the accident statistical data in 2016 by Department of
Environment (DOE, majority of the accidents occurs in constructions area and there are no any cases reported due to
chemical industry hazards, injuries and accidents. Hence, this creates a space for using the leading indicator of
safety climate to measure the safety performance, as safety climate is a strong predictor of safety performance. The
finding have reported that safety climate factors cannot be exactly replicated in different cultural set ups and there is
no universal set of safety climate factors which may be applicable to various industries, cultures and regions (Zohar,
2010). Hence, there is a need to develop safety climate questionnaire for the chemical industries in Johor,
specifically in Pasir Gudang which have been proved as the largest chemical industrial area in Johor.
2. Methodology The study methods to develop the relationship between safety climate factors and safety performance indicators are
using quantitative method. The quantitative method includes survey instrument development, followed by
exploratory analysis and lastly confirmatory studies (CFA). Survey instrument was developed through literature
review which then proceeded with validation from industrial experts and academicians, followed by pilot study and
then reliability analysis. Exploratory study was conducted through principal component analysis (PCA), since CFA
is the most recommended tool in a multi-indicator measurement model where it could assess the non-dimensionality
of the developed theoretical model (Shang & Lu, 2009). Meanwhile, confirmatory studies were conducted through
SmartPLS
2.1 Sample and Population Pasir Gudang is classified as one of the largest strategic industrial hub in Malaysia. Iskandar Malaysia
metropolis 2025 master plan has decided to use Pasir Gudang as a key economic zone (Flagship D-Eastern Gate
Development) for manufacturing industry.
Pasir Gudang consists of two major industrial areas which are Pasir Gudang Industrial Park and Tanjung
Langsat Industrial Complex. These both areas are classified as the most highly invested industry location by World
Islamic Economic Forum Foundation (MIDA, 2009; WIEF, 2012). Moreover, WIEF (2012) also have listed out
petrochemical products and chemical and chemical products as two of the five core sectors of industry in Johor
(WIEF, 2012). According to MIDA (2009), tank farms with a 1000 metre berth and hazardous cargo jetty, and three
hazardous liquid bulk terminals to handle liquid petroleum gas, chemicals and petrochemicals have been developed
in Tanjung Langsat (Carder & Ragan, 2003). The most common chemical products which are being produced in
Pasir Gudang are ethylene, propylene, polyethylene, poly propylene, ethyl benzene, styrene monomer, expandable
polystyrene, and ethylene vinyl acetate (MIDA, 2009). A total of 300 survey instruments were distributed and 220
responses were returned in 4 selected companies in Pasir Gudang.The response rate is 73%.
2.2 Survey Instrument Development First level of survey instrument was developed through literature reviews which consisted of 6 scales for
safety climate factors: Safety supervision, safety commitment, safety communication, work pressure, safety
competence and safety procedures and safety performance indicator: safety behavior which constructs were related
to safety compliance and safety participation. This drafted questionnaire contained 40 items which then submitted to
industrial and educational experts to evaluate the rationality of the items. Upon validation and recommendation by
experts, the survey instrument was re-amended to second level with 36 items of safety climate factors and safety
performance indicators.
Upon validation by experts, a pilot test was conducted N=30 involving 8 supervisors and 22 first line
managers. The questionnaire contained three parts, Part A: Demographic information, Part B: Safety Climate
2958
Page 4
Proceedings of the International Conference on Industrial Engineering and Operations Management
Bandung, Indonesia, March 6-8, 2018
© IEOM Society International
Factors and Part C: Safety Performance Indicators. A 5-point Likert-type scale (1 = strongly disagree, 5 = strongly
agree) was used to collect the workers’ responses. The collected data were then preceded for quantitative validation
by using Cronbach’s Alpha to measure the internal consistency reliability of the scales.
Upon collecting the pilot data, the negative statements were recorded before running in SPSS. The safety
climate factors and safety performance indicators scales with lower internal coefficient were removed to achieve the
Cronbach’s Alpha of 0.60 and above (Bhatnagar, Kim, & Many, 2014). However, some items were still remained
unchanged although has the Cronbach’s Alpha lower than 0.40 since this poorly correlated data could be due to the
lower number of participants (Carder & Ragan, 2003).
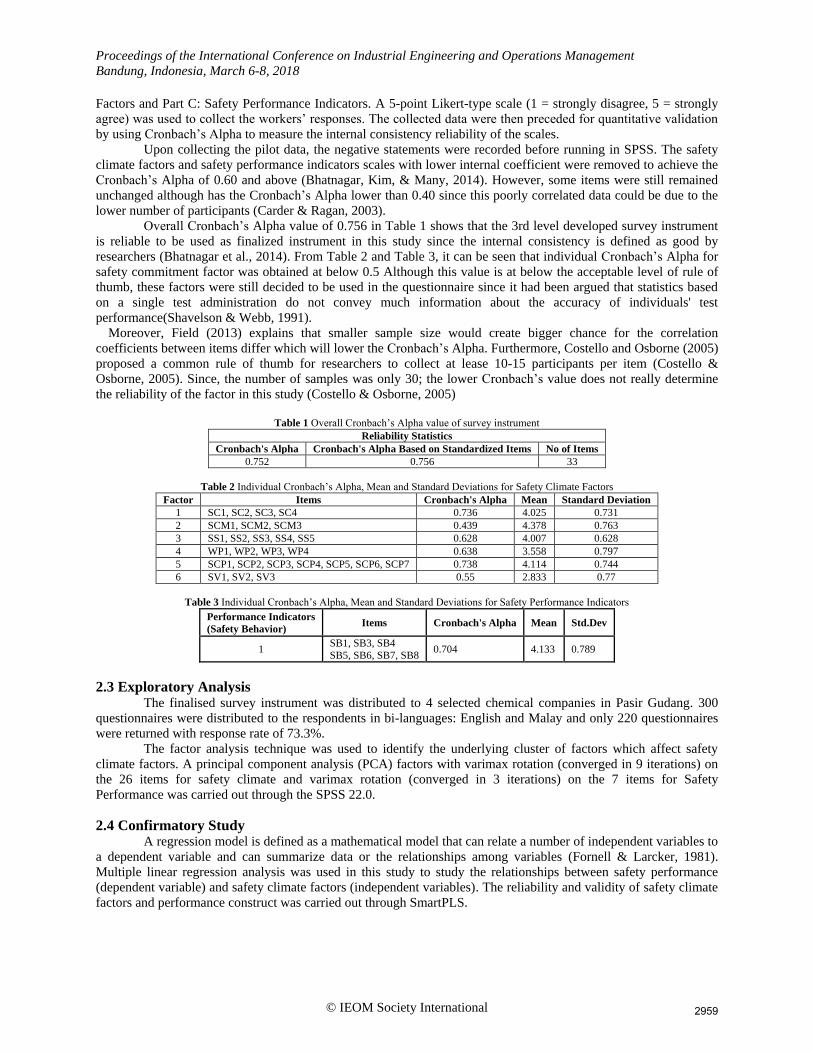
Overall Cronbach’s Alpha value of 0.756 in Table 1 shows that the 3rd level developed survey instrument
is reliable to be used as finalized instrument in this study since the internal consistency is defined as good by
researchers (Bhatnagar et al., 2014). From Table 2 and Table 3, it can be seen that individual Cronbach’s Alpha for
safety commitment factor was obtained at below 0.5 Although this value is at below the acceptable level of rule of
thumb, these factors were still decided to be used in the questionnaire since it had been argued that statistics based
on a single test administration do not convey much information about the accuracy of individuals' test
performance(Shavelson & Webb, 1991).
Moreover, Field (2013) explains that smaller sample size would create bigger chance for the correlation
coefficients between items differ which will lower the Cronbach’s Alpha. Furthermore, Costello and Osborne (2005)
proposed a common rule of thumb for researchers to collect at lease 10-15 participants per item (Costello &
Osborne, 2005). Since, the number of samples was only 30; the lower Cronbach’s value does not really determine
the reliability of the factor in this study (Costello & Osborne, 2005)
Table 1 Overall Cronbach’s Alpha value of survey instrument
Reliability Statistics
Cronbach's Alpha Cronbach's Alpha Based on Standardized Items No of Items
0.752 0.756 33
Table 2 Individual Cronbach’s Alpha, Mean and Standard Deviations for Safety Climate Factors
Factor Items Cronbach's Alpha Mean Standard Deviation
1 SC1, SC2, SC3, SC4 0.736 4.025 0.731
2 SCM1, SCM2, SCM3 0.439 4.378 0.763
3 SS1, SS2, SS3, SS4, SS5 0.628 4.007 0.628
4 WP1, WP2, WP3, WP4 0.638 3.558 0.797
5 SCP1, SCP2, SCP3, SCP4, SCP5, SCP6, SCP7 0.738 4.114 0.744
6 SV1, SV2, SV3 0.55 2.833 0.77
Table 3 Individual Cronbach’s Alpha, Mean and Standard Deviations for Safety Performance Indicators
Performance Indicators
(Safety Behavior) Items Cronbach's Alpha Mean Std.Dev
1 SB1, SB3, SB4
SB5, SB6, SB7, SB8 0.704 4.133 0.789
2.3 Exploratory Analysis
The finalised survey instrument was distributed to 4 selected chemical companies in Pasir Gudang. 300
questionnaires were distributed to the respondents in bi-languages: English and Malay and only 220 questionnaires
were returned with response rate of 73.3%.
The factor analysis technique was used to identify the underlying cluster of factors which affect safety
climate factors. A principal component analysis (PCA) factors with varimax rotation (converged in 9 iterations) on
the 26 items for safety climate and varimax rotation (converged in 3 iterations) on the 7 items for Safety
Performance was carried out through the SPSS 22.0.
2.4 Confirmatory Study A regression model is defined as a mathematical model that can relate a number of independent variables to
a dependent variable and can summarize data or the relationships among variables (Fornell & Larcker, 1981).
Multiple linear regression analysis was used in this study to study the relationships between safety performance
(dependent variable) and safety climate factors (independent variables). The reliability and validity of safety climate
factors and performance construct was carried out through SmartPLS.
2959
Page 5
Proceedings of the International Conference on Industrial Engineering and Operations Management
Bandung, Indonesia, March 6-8, 2018
© IEOM Society International
3.0 Results and Discussion
3.1 Demographic Analysis Among N=220 respondents, there were only 3.6% of female respondents and 96.4% were male. Moreover, survey
results also revealed that 47.7% of the respondents were supervisors, followed by 38.2% of operators and only
14.1% of technicians. Furthermore, most of the survey respondents are from the middle age (40 to 49) years old
which represented 38.2%, followed by age range 50 to 59 years old with 33.6%, age range 31 to 39 years old with
20.9% and 7.3% respondents with below 30 years old. The respondents were also asked to share their working
experience in the company in order to see whether they really understood and appreciated the importance of safety
climate at their working environment (Shang & Lu, 2009). The survey revealed that most of the respondents were
with working experience of 16 to 20 years which consumed 30.0%, followed by working experience of 11 to 15
years with 28.2%. There 26.8% of respondents who work less than 5 years and 15% of workers with less than 10
years working experience.
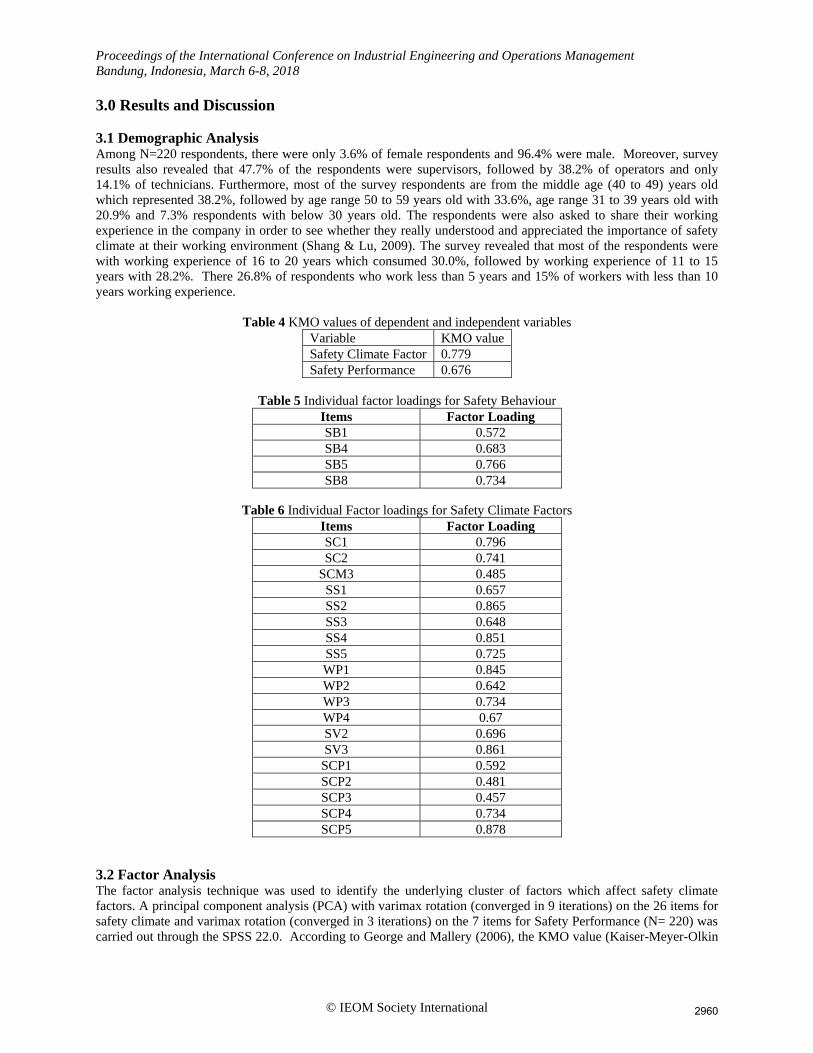
Table 4 KMO values of dependent and independent variables
Variable KMO value
Safety Climate Factor 0.779
Safety Performance 0.676
Table 5 Individual factor loadings for Safety Behaviour
Items Factor Loading
SB1 0.572
SB4 0.683
SB5 0.766
SB8 0.734
Table 6 Individual Factor loadings for Safety Climate Factors
Items Factor Loading
SC1 0.796
SC2 0.741
SCM3 0.485
SS1 0.657
SS2 0.865
SS3 0.648
SS4 0.851
SS5 0.725
WP1 0.845
WP2 0.642
WP3 0.734
WP4 0.67
SV2 0.696
SV3 0.861
SCP1 0.592
SCP2 0.481
SCP3 0.457
SCP4 0.734
SCP5 0.878
3.2 Factor Analysis The factor analysis technique was used to identify the underlying cluster of factors which affect safety climate
factors. A principal component analysis (PCA) with varimax rotation (converged in 9 iterations) on the 26 items for
safety climate and varimax rotation (converged in 3 iterations) on the 7 items for Safety Performance (N= 220) was
carried out through the SPSS 22.0. According to George and Mallery (2006), the KMO value (Kaiser-Meyer-Olkin
2960
Page 6
Proceedings of the International Conference on Industrial Engineering and Operations Management
Bandung, Indonesia, March 6-8, 2018
© IEOM Society International
Measure of Sampling Adequacy) should be greater than the acceptable threshold of 0.5 and a value greater than 0.6
is classified as mediocre, greater than 0.7 is defined as middling, value of greater than 0.8 is meritorious and value
of KMO more than 0.9 is marvellous in order for a factor analysis to be proceeded (Shang & Lu, 2009). In this
study, the KMO value for safety climate factors were obtained as 0.779 and KMO for safety performance was
obtained as 0.676 (Table 4). KMO value of 0.676 and 0.779 which is above the threshold value indicates that the
data is appropriate for factor analysis. Initially there were seven individual factors proposed for safety behaviour to
measure safety performance, however only four safety behaviour items were remained after factor analysis. All the
individual factor loadings were more than 0.4 which is the minimum criteria for accepting individual factors in
factor analysis (Pallant, 2011) which could be referred in Table 5 for safety behaviour and Table 6 for safety climate
factors.
Meanwhile for safety climate factors, 7 of 26 factors were excluded during factor analysis for subsequent
analysis. Those six items (SV1, SC4, SC3, SCM1, SCM2, SCP6 and SCP7) were excluded since these factors act as
only 2 items per latent variable.
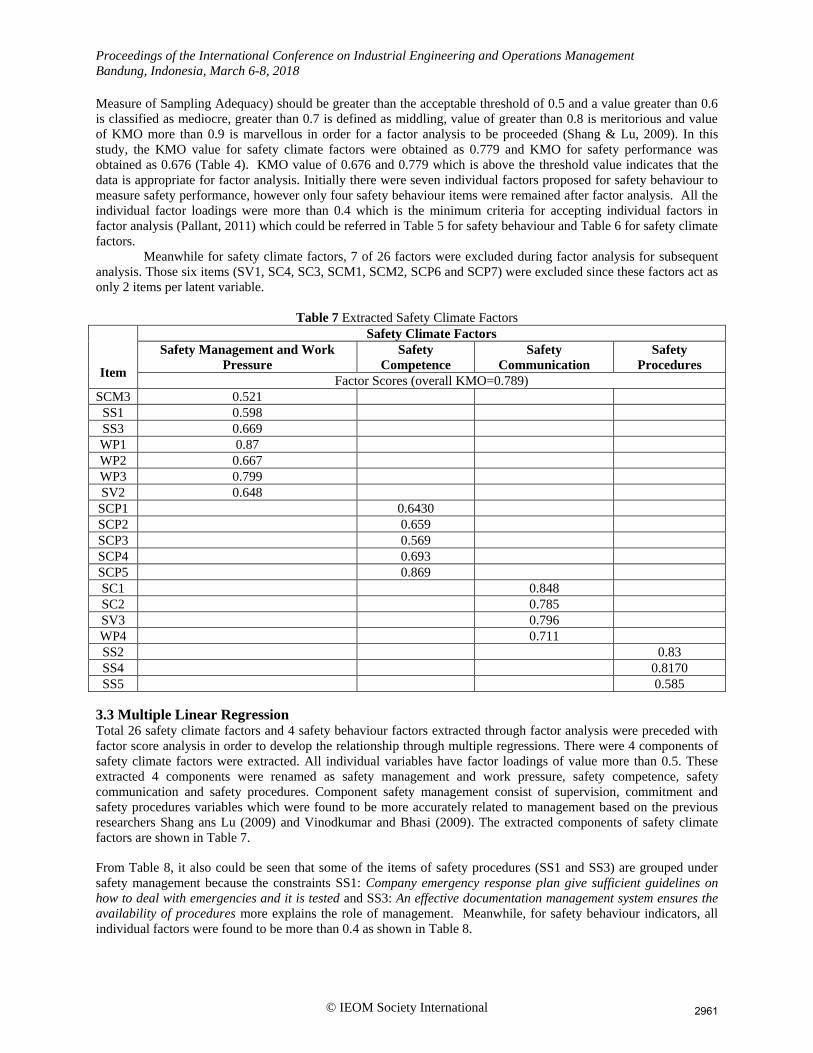
Table 7 Extracted Safety Climate Factors
Item
Safety Climate Factors
Safety Management and Work
Pressure
Safety
Competence
Safety
Communication
Safety
Procedures
Factor Scores (overall KMO=0.789)
SCM3 0.521
SS1 0.598
SS3 0.669
WP1 0.87
WP2 0.667
WP3 0.799
SV2 0.648
SCP1 0.6430
SCP2 0.659
SCP3 0.569
SCP4 0.693
SCP5 0.869
SC1 0.848
SC2 0.785
SV3 0.796
WP4 0.711
SS2 0.83
SS4 0.8170
SS5 0.585
3.3 Multiple Linear Regression Total 26 safety climate factors and 4 safety behaviour factors extracted through factor analysis were preceded with
factor score analysis in order to develop the relationship through multiple regressions. There were 4 components of
safety climate factors were extracted. All individual variables have factor loadings of value more than 0.5. These
extracted 4 components were renamed as safety management and work pressure, safety competence, safety
communication and safety procedures. Component safety management consist of supervision, commitment and
safety procedures variables which were found to be more accurately related to management based on the previous
researchers Shang ans Lu (2009) and Vinodkumar and Bhasi (2009). The extracted components of safety climate
factors are shown in Table 7.
From Table 8, it also could be seen that some of the items of safety procedures (SS1 and SS3) are grouped under
safety management because the constraints SS1: Company emergency response plan give sufficient guidelines on
how to deal with emergencies and it is tested and SS3: An effective documentation management system ensures the
availability of procedures more explains the role of management. Meanwhile, for safety behaviour indicators, all
individual factors were found to be more than 0.4 as shown in Table 8.
2961
Page 7
Proceedings of the International Conference on Industrial Engineering and Operations Management
Bandung, Indonesia, March 6-8, 2018
© IEOM Society International
Table 8 Extracted Safety Behaviour Items
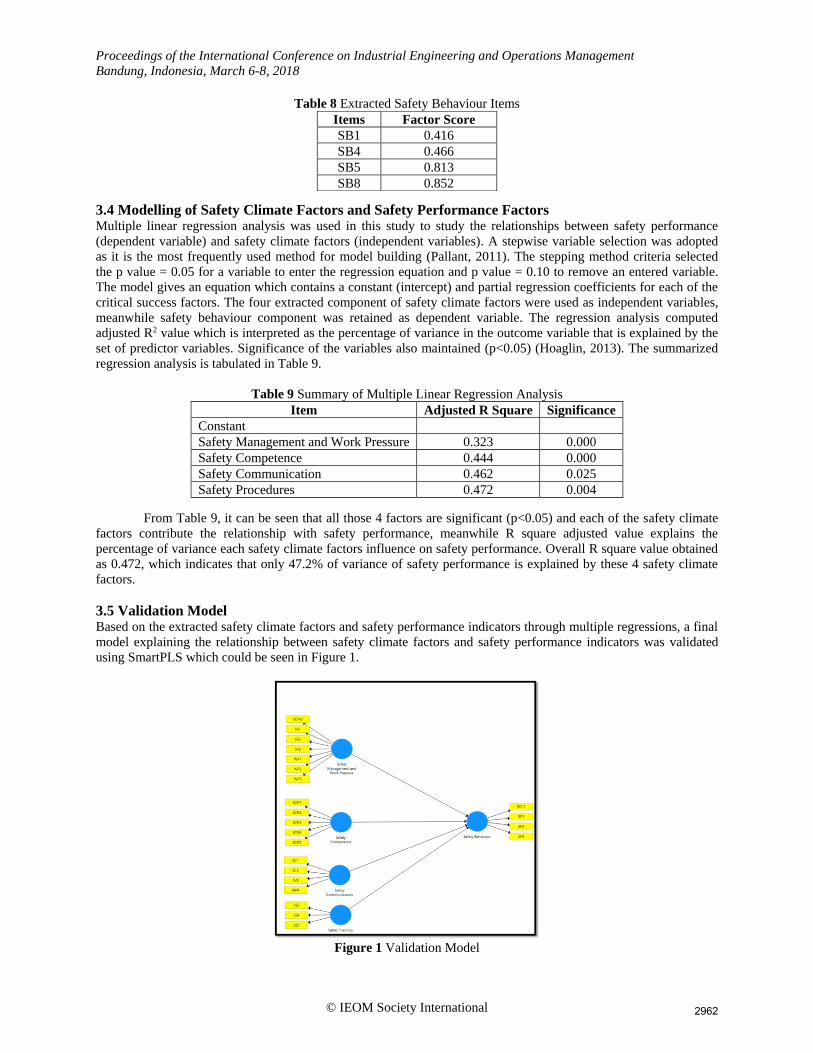
3.4 Modelling of Safety Climate Factors and Safety Performance Factors Multiple linear regression analysis was used in this study to study the relationships between safety performance
(dependent variable) and safety climate factors (independent variables). A stepwise variable selection was adopted
as it is the most frequently used method for model building (Pallant, 2011). The stepping method criteria selected
the p value = 0.05 for a variable to enter the regression equation and p value = 0.10 to remove an entered variable.
The model gives an equation which contains a constant (intercept) and partial regression coefficients for each of the
critical success factors. The four extracted component of safety climate factors were used as independent variables,
meanwhile safety behaviour component was retained as dependent variable. The regression analysis computed
adjusted R2 value which is interpreted as the percentage of variance in the outcome variable that is explained by the
set of predictor variables. Significance of the variables also maintained (p<0.05) (Hoaglin, 2013). The summarized
regression analysis is tabulated in Table 9.
Table 9 Summary of Multiple Linear Regression Analysis
Item Adjusted R Square Significance
Constant
Safety Management and Work Pressure 0.323 0.000
Safety Competence 0.444 0.000
Safety Communication 0.462 0.025
Safety Procedures 0.472 0.004
From Table 9, it can be seen that all those 4 factors are significant (p<0.05) and each of the safety climate
factors contribute the relationship with safety performance, meanwhile R square adjusted value explains the
percentage of variance each safety climate factors influence on safety performance. Overall R square value obtained
as 0.472, which indicates that only 47.2% of variance of safety performance is explained by these 4 safety climate
factors.
3.5 Validation Model Based on the extracted safety climate factors and safety performance indicators through multiple regressions, a final
model explaining the relationship between safety climate factors and safety performance indicators was validated
using SmartPLS which could be seen in Figure 1.
Figure 1 Validation Model
Items Factor Score
SB1 0.416
SB4 0.466
SB5 0.813
SB8 0.852
2962
Page 8
Proceedings of the International Conference on Industrial Engineering and Operations Management
Bandung, Indonesia, March 6-8, 2018
© IEOM Society International
3.6 Model Evaluation Measurement model evaluation is aimed to evaluate the consistency and validity of the observed variables.
Consistency of the observed variables is explained through construct reliability tests and validity of the observed
variables is explained through convergent validity (Joseph F. Hair, Black, Babin, & Anderson, 2010).
3.7 Consistency of Observed Variables Cronbach's alpha and Composite Reliability (CR). Cronbach's alpha and CR indicate how well a set of manifest
variables appraises a single latent construct. However, compared to Cronbach alpha, composite reliability is
considered a better measure of internal consistency because it employs the standardized loadings of the observed
variables (Fornell & Larcker, 1981). Litwin (1995) suggested that value of for composite reliability should be more
than 0.70; however, for analysis through Partial Least Square Structural Equation Modelling, the suggested value of
composite reliability is within 0.60 to 0.90 (Litwin, 1995). In this study, the composite reliability for each construct
were obtained to be within the suggested range of 0.60 to 0.90 which proves that the observed variables are
consistent with each other (Table 10)
Table 10 Composite Reliability and AVE values of Safety Climate Factors
Composite Reliability
(0.60~0.90)
Average Variance Extracted (AVE)
(>0.5)
Safety Behaviour 0.799 0.599
Safety Competence 0.879 0.593
Safety Communication 0.703 0.578
Safety Management and Work Pressure 0.905 0.579
Safety Procedures 0.917 0.787
3.8 Convergent Validity Convergent validity of the constructs is often determined through outer loadings which measures individual
reliability of the variables, and Average Variance Extracted (AVE) test on variables which determines the amount of
variance captured by latent variable from its relative observed variables due to measurement errors (Fornell &
Larcker, 1981). According to Ringle, Sinkovics, and Hensele ,(2009), observed variables with outer loading 0.7 or
higher are considered highly satisfactory, however loading value of 0.5 is still regarded as acceptable criteria (Liu et
al., 2015). Joseph F. Hair et al. (2010) argued that a minimum 50% of the variance from observed variable should be
captured by latent variables which implies that AVE value of the construct should be greater than 0.5 (Ringle et al.,
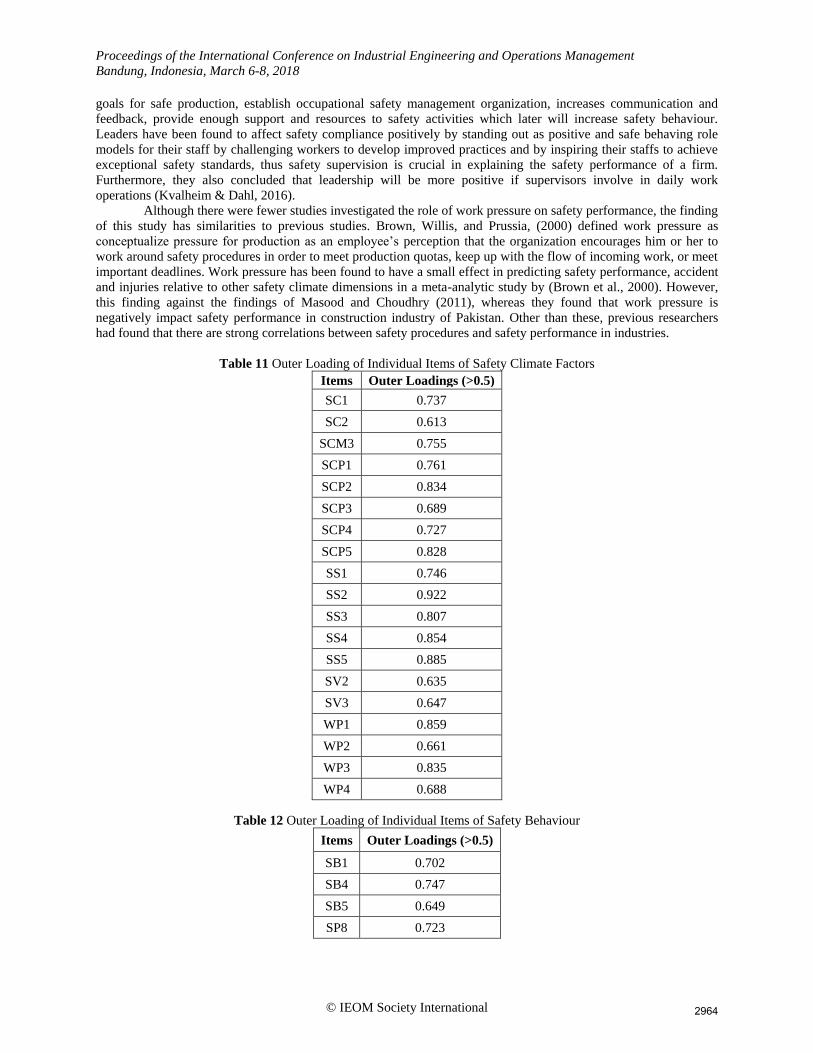
2009). In this study, the outer loadings obtained for each individual variable are more than 0.6 (Table 11 and Table
12), meanwhile AVE values obtained as more than 0.5 which indicates that the construct of the finalised model is
valid (Table 10).
3.9 Discussion A positive significant relationship was found between safety management and work pressure, safety
procedures, safety competence and safety communication and safety performance. Jazayeri and Dadi (2017)
explained that International Civil Aviation Organization (ICAO) has defined safety management systems as
“systematic approach to managing safety, including the necessary organizational structures, accountabilities,
policies and procedures” meanwhile International Labour Organization (ILO) has defined safety management
systems as “A set of interrelated or interacting elements to establish occupational safety and health policy and
objectives, and to achieve those objective (Jazayeri & Dadi, 2017). Safety management is considered to be a crucial
factor in explaining the safety performance of a firm where Choudhry, Fang, and Mohamed (2007) explains the role
of safety management in construction industry. Implication of safety management could be able to reduce the
number of injuries to personnel and operatives in the workplace and also minimize the risk of major accidents.
Moreover, systematic safety management is believed to minimize production interruptions and reduce material and
equipment damage which indirectly minimize legal cost of accident litigation, fines, and also reduce expenditures of
emergency supplies. Although those implications are focussed only in construction industry, it strongly believed that
chemical industries also could have the same positive implications if proper safety management is take place.
Moreover, the finding of safety management approach is similar to some of the previous studies by Liu et
al (2015) who concluded that management has a key role in safety and accountable for safety performance of a
company. Liu et al. (2015) furthermore explains that when the top management is committed to safety, they may set
2963
Page 9
Proceedings of the International Conference on Industrial Engineering and Operations Management
Bandung, Indonesia, March 6-8, 2018
© IEOM Society International
goals for safe production, establish occupational safety management organization, increases communication and
feedback, provide enough support and resources to safety activities which later will increase safety behaviour.
Leaders have been found to affect safety compliance positively by standing out as positive and safe behaving role
models for their staff by challenging workers to develop improved practices and by inspiring their staffs to achieve
exceptional safety standards, thus safety supervision is crucial in explaining the safety performance of a firm.
Furthermore, they also concluded that leadership will be more positive if supervisors involve in daily work
operations (Kvalheim & Dahl, 2016).
Although there were fewer studies investigated the role of work pressure on safety performance, the finding
of this study has similarities to previous studies. Brown, Willis, and Prussia, (2000) defined work pressure as
conceptualize pressure for production as an employee’s perception that the organization encourages him or her to
work around safety procedures in order to meet production quotas, keep up with the flow of incoming work, or meet
important deadlines. Work pressure has been found to have a small effect in predicting safety performance, accident
and injuries relative to other safety climate dimensions in a meta-analytic study by (Brown et al., 2000). However,
this finding against the findings of Masood and Choudhry (2011), whereas they found that work pressure is
negatively impact safety performance in construction industry of Pakistan. Other than these, previous researchers
had found that there are strong correlations between safety procedures and safety performance in industries.
Table 11 Outer Loading of Individual Items of Safety Climate Factors
Items Outer Loadings (>0.5)
SC1 0.737
SC2 0.613
SCM3 0.755
SCP1 0.761
SCP2 0.834
SCP3 0.689
SCP4 0.727
SCP5 0.828
SS1 0.746
SS2 0.922
SS3 0.807
SS4 0.854
SS5 0.885
SV2 0.635
SV3 0.647
WP1 0.859
WP2 0.661
WP3 0.835
WP4 0.688
Table 12 Outer Loading of Individual Items of Safety Behaviour
Items Outer Loadings (>0.5)
SB1 0.702
SB4 0.747
SB5 0.649
SP8 0.723
2964
Page 10
Proceedings of the International Conference on Industrial Engineering and Operations Management
Bandung, Indonesia, March 6-8, 2018
© IEOM Society International
Kvalheim and Dahl (2016) indicated that negligence of perceived procedure in offshore service vessel
industry to be negatively related to safety compliance. Furthermore, Antonsen (2009) also have suggested that
simplicity of procedures are significant success criteria for high compliance. Furthermore, the finding of safety
communication also were found to be similar with some of the previous studies by Sampson, Dearmond, and Chen
(2008) where they highlighted that improved communication between line workers and supervisors will results in
decreasing minor accidents and increasing in personal protective equipment (PPE) use.
3.10 Impact on Industry It is strongly believed that reliable safety climate scale could provide proactive information about safety
problems before they develop into accidents and injuries (Seo, Torabi, Blair, & Ellis, 2004). Although the finding
that safety climate perceptions will not necessarily match actual levels of safety performance, M D Cooper and
Phillips (2004) recommends that industry should focus its primary safety improvement effort on changing unsafe
situations and conditions as well as people’s safety behaviour at all organizational levels, rather than concentrating
on improving people’s attitudes, beliefs, and perceptions about safety. Even though previous studies in various
industries found that worker’s perceptions play major role in highlighting effectiveness of safety system in a firm,
but there are always a need of physical changes within an organization (M D Cooper & Phillips, 2004).
4. Conclusion and Future Work
4.1 Conclusion The main purpose of this study was to identify safety climate factors and safety performance in chemical industries
in Johor and has been established. The finding of this study which derived the safety climate factors of safety
communication, safety procedures, safety competence, safety management and work pressure are found to be similar
to previous studies in various industries. Safety management was renamed to explain the safety commitment and
safety supervision factors. A newly reliable developed relationship was able to explain 47.2% of relationship
between safety climate factors and safety performance which full fill the second objective of this study. Although,
only 47.2% of safety climate factors were found to impact safety performance of chemical industries in Johor, which
common findings in a social investigation, then reflections of safety climate factors on safety performance could not
be similar with each industry as compared with other researchers finding. In addition, the findings would fluctuate
due to geographical context and individual context. Furthermore, even though the only 47.2 % of derived safety
climate factors explain the relationship with safety performance, it is found that all 26 individual constructs are
found to be valid and consistent thorough model evaluation. Although, the findings of the study were able to achieve
the objectives, there are plenty of gaps and limitations which need be considered for future work.
4.2 Study Limitations
The findings of this study must be interpreted based on the following limitations. The results of this study
were dependent upon sincere and honest responses from participants and there are no complimentary actions.
Moreover, demographic factors also play an important role in manipulating the relationship between safety climate
factors and safety performance (Vinodkumar & Bhasi, 2009). Thus, in future, effects of demographic factors on
safety performance also should analyse co-currently, and the respondent’s perceptions shall be analysed by
demographic factors such as age, working experience, education and position in the particular firm.
Despite these limitations, this study actually contributes to the literature revealing factor structures of safety
climate, where appropriate level of reliability and validity measures of safety climate scale was developed.
However, it is strongly recommended to do more exploration on the safety climate factors by increasing the number
of independent variables and number of samples and also compare the findings with previous studies by revalidating
the previous established safety survey instrument.
4.3 Future Work There are few items and issues to be considered in order to improve and increase the final results. Since in
this study, the area of study was just focused on chemical industries in Pasir Gudang. In future, it should be
expanded to more chemical industries around Johor and also around Malaysia. Furthermore, a longitudinal study
should be carried out for the collected survey data since in this study was only in cross sectional. Furthermore, safety
performance based on the perceptions will need to be supported by collecting more objectives and quantitative data
measuring actual safety performance such as accident rates, injury cases, fatal cases and near missed cases. Other
2965
Page 11
Proceedings of the International Conference on Industrial Engineering and Operations Management
Bandung, Indonesia, March 6-8, 2018
© IEOM Society International
than these, this study also can be expanded by developing a model to explain the relationship between safety climate
factors and safety performance by using Structural Equation Modelling (SEM) respectively.
References Antonsen, S. (2009). Safety culture and the issue of power. Safety Science, 47(2), 183–191.
Barbaranelli, C., Petitta, L., & Probst, T. M. (2015). Does safety climate predict safety performance in Italy and the
USA ? Cross-cultural validation of a theoretical model of safety climate. Accident Analysis and Prevention,
77, 35–44. https://doi.org/10.1016/j.aap.2015.01.012
Bhatnagar, R., Kim, J., & Many, J. E. (2014). Candidate Surveys on Program Evaluation: Examining Instrument
Reliability, Validity and Program Effectiveness. American Journal of Educational Research, 2(8), 683–690.
https://doi.org/10.12691/education-2-8-18
Brown, K. A., Willis, P. G., & Prussia, G. E. (2000). Predicting safe employee behavior in the steel industry:
Development and test of a sociotechnical model. Journal of Operations Management, 18(4), 445–465.
https://doi.org/https://doi.org/10.1016/S0272-6963(00)00033-4
Burke, M. J., Sarpy, S. A., E.Tesluk, P., & Smith-Crowe, K. (2002). GENERAL SAFETY PERFORMANCE: A
TEST OF A GROUNDED THEORETICAL MODEL. Personnel Psychology, 55(2), 429–457.
https://doi.org/10.1111/j.1744-6570.2002.tb00116.x
Carder, B., & Ragan, P. W. (2003). A survey-based system for safety measurement and improvement. Journal of
Safety Research, 34(2), 157—165. https://doi.org/10.1016/s0022-4375(03)00007-0
Chen, Y., McCabe, B., & Hyatt, D. (2017). Impact of individual resilience and safety climate on safety performance
and psychological stress of construction workers: A case study of the Ontario construction industry. Journal of
Safety Research, 61(Supplement C), 167–176. https://doi.org/https://doi.org/10.1016/j.jsr.2017.02.014
Choudhry, R. M., Fang, D., & Mohamed, S. (2007). The nature of safety culture: A survey of the state-of-the-art.
Safety Science, 45(10), 993–1012. https://doi.org/10.1016/j.ssci.2006.09.003
Cooper, M. D., & Phillips, R. A. (2004). Exploratory analysis of the safety climate and safety behavior relationship.
Journal of Safety Research, 35(5), 497–512. https://doi.org/10.1016/j.jsr.2004.08.004
Cooper, M. D., & Phillips, R. A. (2004). Exploratory analysis of the safety climate and safety behavior relationship,
35, 497–512. https://doi.org/10.1016/j.jsr.2004.08.004
Costello, A. B., & Osborne, J. W. (2005). Best Practices in Exploratory Factor Analysis : Four Recommendations
for Getting the Most From Your Analysis. Practical Assessment, Research & Education, 10, 1–9.
https://doi.org/10.1.1.110.9154
Field, A. (2013). Discovering statistics using IBM SPSS statistics. Sage.
Flin, R. (2007). Measuring safety culture in healthcare: A case for accurate diagnosis. Safety Science, 45(6), 653–
667. https://doi.org/10.1016/j.ssci.2007.04.003
Flin, R., Mearns, K., O’Connor, P., & Bryden, R. (2000). Measuring safety climate: identifying the common
features. Safety Science, 34(1), 177–192. https://doi.org/https://doi.org/10.1016/S0925-7535(00)00012-6
Fornell, C., & Larcker, V. F. (1981). Evaluating structural equation models with unobservable variables and
measurement error. Journal of Marketing Research, 18(3), 39–50.
George, D., & Mallery, P. (2006). SPSS for Windows Step by Step: A Simple Guide and Reference, 13.0 Update.
Pearson A and B. Retrieved from https://books.google.com.my/books?id=eLYbAQAAMAAJ
Hoaglin, D. C. (2013). Making Sense of Coefficients in Multiple Regression, (January), 1–19.
Hon, C. K. H., Chan, A. P. C., & Yam, M. C. H. (2014). Relationships between safety climate and safety
performance of building repair, maintenance, minor alteration, and addition (RMAA) works. Safety Science,
65, 10–19. https://doi.org/10.1016/j.ssci.2013.12.012
Jazayeri, E., & Dadi, G. B. (2017). Construction Safety Management Systems and Methods of Safety Performance
Measurement : A Review, 6(2), 15–28. https://doi.org/10.5923/j.safety.20170602.01
Joseph F. Hair, J., Black, W. C., Babin, B. J., & Anderson, R. E. (2010). Multivariate Data Analysis (7th ed.).
Englewood Cliffs: Prentice Hall.
Kvalheim, S. A., & Dahl, Ø. (2016). Safety compliance and safety climate : A repeated cross-sectional study in the
oil and gas industry. Journal of Safety Research, 59, 33–41. https://doi.org/10.1016/j.jsr.2016.10.006
Litwin, M. (1995). How to Measure Survey Reliability and Validity. Thousand Oaks, California.
https://doi.org/10.4135/9781483348957
Liu, X., Huang, G., Huang, H., Wang, S., Xiao, Y., & Chen, W. (2015). Safety climate , safety behavior , and
worker injuries in the Chinese manufacturing industry. Safety Science, 78, 173–178.
https://doi.org/10.1016/j.ssci.2015.04.023
Masood, R., & Choudhry, R. M. (2011). Measuring Safety Climate to Enhance Safety Culture in the Construction
2966
Page 12
Proceedings of the International Conference on Industrial Engineering and Operations Management
Bandung, Indonesia, March 6-8, 2018
© IEOM Society International
Industry of Pakistan. CIB W99 International Conference on Prevention: Means to the End of Injuries,
Illnesses, and Fatalities, August 24-26, 54(2002), 1243–1249. Retrieved from
http://www.irbnet.de/daten/iconda/CIB_DC24434.pdf
MIDA. (2009). Profit from Malaysia’s Petrochemical Industry.
Neal, A., & Griffin, M. A. (2006). A study of the lagged relationships among safety climate, safety motivation,
safety behavior, and accidents at the individual and group levels. Journal of Applied Psychology. Neal,
Andrew: ARC Key Centre for Human Factors and Applied Cognitive Psychology, School of Psychology,
University of Queensland, Brisbane, QLD, Australia, 4072, [email protected] : American Psychological
Association. https://doi.org/10.1037/0021-9010.91.4.946
Pallant, J. (2011). SPSS survival manual: A step by step guide to data analysis using the SPSS program (4th Editio).
Berkshire: Allen & Unwin.
Ringle, C. M., Sinkovics, R. R., & Henseler, J. (2009). The use of partial least squares path modeling in
international marketing. In New Challenges to International Marketing (Vol. 20, pp. 277–319). Emerald
Group Publishing Limited. https://doi.org/doi:10.1108/S1474-7979(2009)0000020014
Sampson, J. M., Dearmond, S., & Chen, P. Y. (2008). Interactive Effects of Safety Constraints, Safety Uncertainty,
and verbal Exchange. In 23rd Annual Conference of the Society for Industrial and Organizational Psychology.
San Francisco, CA.
Seo, D.-C., Torabi, M. R., Blair, E. H., & Ellis, N. T. (2004). A cross-validation of safety climate scale using
confirmatory factor analytic approach. Journal of Safety Research. Seo, Dong-Chul: Department of Applied
Health Science, Indiana University, HPER 116, 1025 E. 7th Street, Bloomington, IN, US, 47405-7109,
[email protected] : Elsevier Science. https://doi.org/10.1016/j.jsr.2004.04.006
Shang, K., & Lu, C. (2009). Effects of Safety Climate on Perceptions of Safety Performance in Container Terminal
Operations. Transport Reviews, 29(1), 1–19. https://doi.org/10.1080/01441640802264943
Shavelson, R. J., & Webb, N. M. (1991). Generalizability theory: A primer. Sage.
Vinodkumar, M. N., & Bhasi, M. (2009). Safety climate factors and its relationship with accidents and personal
attributes in the chemical industry. Safety Science, 47(5), 659–667. https://doi.org/10.1016/j.ssci.2008.09.004
WIEF. (2012). The WIEF Johor Bahru Malaysia. Development. Johor Bahru. Retrieved from https://wief.org/wp-
content/downloads/2016/05/8th-wief-brochure.pdf
Wu, T.-C., Chang, S.-H., Shu, C.-M., Chen, C.-T., & Wang, C.-P. (2011). Safety leadership and safety performance
in petrochemical industries: The mediating role of safety climate. Journal of Loss Prevention in the Process
Industries, 24(6), 716–721. https://doi.org/https://doi.org/10.1016/j.jlp.2011.04.007
Zhou, Q., Fang, D., & Wang, X. (2008). A method to identify strategies for the improvement of human safety
behavior by considering safety climate and personal experience. Safety Science, 46(10), 1406–1419.
https://doi.org/https://doi.org/10.1016/j.ssci.2007.10.005
Zohar, D. (2010). Thirty years of safety climate research: Reflections and future directions. Accident Analysis &
Prevention, 42(5), 1517–1522. https://doi.org/https://doi.org/10.1016/j.aap.2009.12.019
Zohar, D. (2011). Safety climate: Conceptual and measurement issues. Handbook of Occupational Health
Psychology, 2nd Ed. Washington, DC, US: American Psychological Association.
Biographies
Shalini Tayapara is a Master’s degree student in Master of Science (Industrial Engineering) at Universiti Teknologi
Malaysia. She has completed research projects that involve safety management in chemical industry.
Dr Jafri Mohd Rohani is currently a fulltime senior lecturer at Univerisiti Teknologi Malaysia specialized in
Quality and Statistical Engineering area of study; and also, Coordinator of Industrial Engineering, in Department of
Materials, Manufacturing and Industrial Engineering, Faculty of Mechanical Engineering, Univerisiti Teknologi
Malaysia.
2967