REMEDIATION OF GROUNDWATER CONTAMINATION AT THE ROCKY MOUNTAIN ARSENAL: NUMERICAL AND GEOSTATISTICAL ANALYSIS J. Warner, A. Abdel-Rahman, C. Tamayo-Lara Colorado State University, Department of Civil Engineering, Groundwater Program, Fort Collins, Colorado 80523 J. May U.S. Army Corps of Engineers, Waterways Experiment Station, Geotechnical Laboratory Vicksburg, Mississippi, 39182 ABSTRACT Past activities at the Rocky Mountain Arsenal have resulted in contamination of the near surface shallow alluvial aquifer. Under orders to cease and desist off-site discharge of contaminated groundwater, the U.S. Army has constructed the north boundary barrier system (NBBS) to block critical migration pathways. This system involves arrays of pumping wells, recharge wells and trenches, and a bentonite slurry cut-off wall. Because of complex hydrogeologic conditions at the arsenal, this system has proven very difficult to manage. In response Colorado State University (CSU) and U.S. Army Corps of Engineers, have entered into cooperative research with the aims of evaluating the performance of the system and to investigate reconfiguration of the NBBS to improve operational flexibility and performance. In this study a very detailed model was developed to simulate the operation of the system using the CSU Finite Element Groundwater Modeling Package. To account for aquifer heterogeneities which can significantly affect the operational effectiveness of the system, geostatistical analysis were also performed. Kriging and Co-kriging were used to describe the spatial variability of several aquifer properties and the results incorporated in the numerical model. Several operational scenarios were simulated to asses system improvements and define optimal operational schemes that achieve a reverse gradient across the slurry wall. Scientific visualization techniques were implemented to illustrate modeling results. The experiences (difficulties and successes) learned in operating the north boundary barrier system at the Rocky mountain Arsenal should be valuable to others desiring to use similar barrier systems elsewhere. 9203170166 920303 C PDR WASTE 34 WM-11 PDR
Transcript
REMEDIATION OF GROUNDWATER CONTAMINATIONAT THE ROCKY MOUNTAIN ARSENAL:
NUMERICAL AND GEOSTATISTICAL ANALYSIS
J. Warner, A. Abdel-Rahman, C. Tamayo-LaraColorado State University,
Department of Civil Engineering, Groundwater Program,Fort Collins, Colorado 80523
Past activities at the Rocky Mountain Arsenal have resulted in contamination ofthe near surface shallow alluvial aquifer. Under orders to cease and desist off-sitedischarge of contaminated groundwater, the U.S. Army has constructed the northboundary barrier system (NBBS) to block critical migration pathways. This systeminvolves arrays of pumping wells, recharge wells and trenches, and a bentonite slurrycut-off wall. Because of complex hydrogeologic conditions at the arsenal, this system hasproven very difficult to manage. In response Colorado State University (CSU) and U.S.Army Corps of Engineers, have entered into cooperative research with the aims ofevaluating the performance of the system and to investigate reconfiguration of the NBBSto improve operational flexibility and performance. In this study a very detailed modelwas developed to simulate the operation of the system using the CSU Finite ElementGroundwater Modeling Package. To account for aquifer heterogeneities which cansignificantly affect the operational effectiveness of the system, geostatistical analysis werealso performed. Kriging and Co-kriging were used to describe the spatial variability ofseveral aquifer properties and the results incorporated in the numerical model. Severaloperational scenarios were simulated to asses system improvements and define optimaloperational schemes that achieve a reverse gradient across the slurry wall. Scientificvisualization techniques were implemented to illustrate modeling results. The experiences(difficulties and successes) learned in operating the north boundary barrier system at theRocky mountain Arsenal should be valuable to others desiring to use similar barriersystems elsewhere.
9203170166 920303 CPDR WASTE 34WM-11 PDR
INTRODUCTION
The Rocky Mountain Arsenal is located in Adams County, Colorado just ninemiles northeast of Denver metropolitan area . It was established in 1942 for theproduction and storage of chemical and incendiary munitions. Since the mid-1940's to1982 part of the arsenal was leased to private concerns, one of which was Shell ChemicalCompany, for the manufacture of various chemical compounds including pesticides.From 1943 to 1957 the wastes generated by government and private sources weredischarged into unlined basins. These disposal practices resulted in groundwatercontamination that extended from the arsenal to the South Platte River. In the early1950's, farmers in the offpost vicinity of the arsenal complained of severe crop damagedue to irrigation with waters pumped from the shallow alluvial aquifer.
In response to complaints, the Army constructed Basin F in 1956, an asphalt-linedimpoundment of approximately 93 acres in size. At the time of its construction, BasinF represented the state-of-the-art in basin impoundment structures. In 1961 a 12,000 footdeep injection well was constructed for deep well disposal of the wastes. Deep welldisposal ceased in the late 1960's after a series of small earthquakes in the Denver areawere associated with disposal activities. In early 1975, Colorado Department of Healthissued three administrative orders against the Army and Shell Chemical Company. Theorders required that the Army and Shell cease unpermitted discharges of contaminatedgroundwater from the arsenal, develop source controls to intercept contaminatedgroundwater leaving the site, and implement a monitoring program.
Currently, there are no weapons produced or stored at this site and the productionof pesticides ceased in 1982. The only official function of the arsenal is to plan andimplement remedial activities for aquifer cleanup to comply with Federal and Stateenvironmental laws and regulations. An extensive system of groundwater monitoring hasbeen implemented over the entire arsenal and in the offpost areas. This system will helpto identify contamination sources and pathways of off-site migration of contaminatedgroundwater, as well as to better understand the complex hydrogeology of the site. Someremedial actions have been implemented to solve the immediate environmental problems.These include among others, the installation of groundwater barrier systems, closure ofthe deep injection well by pressure grouting in 1985 and closure of Basin F in 1988.
Three groundwater barrier systems have been installed at the boundaries of thearsenal which treat altogether approximately billion gallons of water every year. Thefirst of these systems was the North Boundary Barrier System (NBBS) which wasconstructed in the period of 1978-81. Subsequently Shell completed the rondale BarrierSystem in 1981 and the U.S. Army constructed the Northwest Boundary Barrier Systemin 1984. These barrier systems were pioneering efforts in the use of groundwater barriersystems for the control of contaminant migration. Previous design and operationalexperience for such systems was unavailable. Because of the complex hydrogeologicconditions at the arsenal, these barrier systems have proved very difficult to manage andoperate. Colorado State University and the U.S. Army Corps of Engineers havecooperated in developing several operational management models of these systems. This
346
M�
__N_ - -
paper describes the groundwater model for the North Boundary Barrier System alongwith a geostatistical site characterization in the vicinity of the system.
THE STUDY AREA
The particular study area where the NBBS is located constitutes an alluvial watertable aquifer that ranges from zero to about 30 feet in thickness, overlying a relativeimpervious bedrock shale of the Denver Formation. Bedrock highs create unsaturatedalluvial conditions in certain zones that restrict groundwater flow in the north-northwestdirection. This aquifer is directly influenced by an ephemeral stream (First Creek), man-made canals that transverse the area (Burlington Ditch and O'Brian Canal), carvedpaleochannels of the bedrock formation, as well as water impoundments. The aquifer isdivided by the slurry soil-bentonite barrier of the system along the north boundary of thearsenal.
The alluvial aquifer is mainly composed of unconsolidated fine-grained eoliansand, silt and clay deposits which are underlaid by coarser sands and gravel. Typicalhydraulic conductivities of sands and gravel at this site range from 118 to 970 ft/day(ESE,1988). Higher hydraulic conductivities may be found along paleochannels of thebedrock formation which occur both in the onpost and offpost areas. In the onpost area,a paleochannel trending in the northeast direction, encroaches in the NBBS vicinity uponthe upgradient portion of an offpost paleochannel which trends north (ESE,1988).Another paleochannel extends along First Creek in the northwest direction. Thesepaleochannels also act as preferential pathways for contaminant plumes.
THE NORTH BOUNDARY SYSTEM
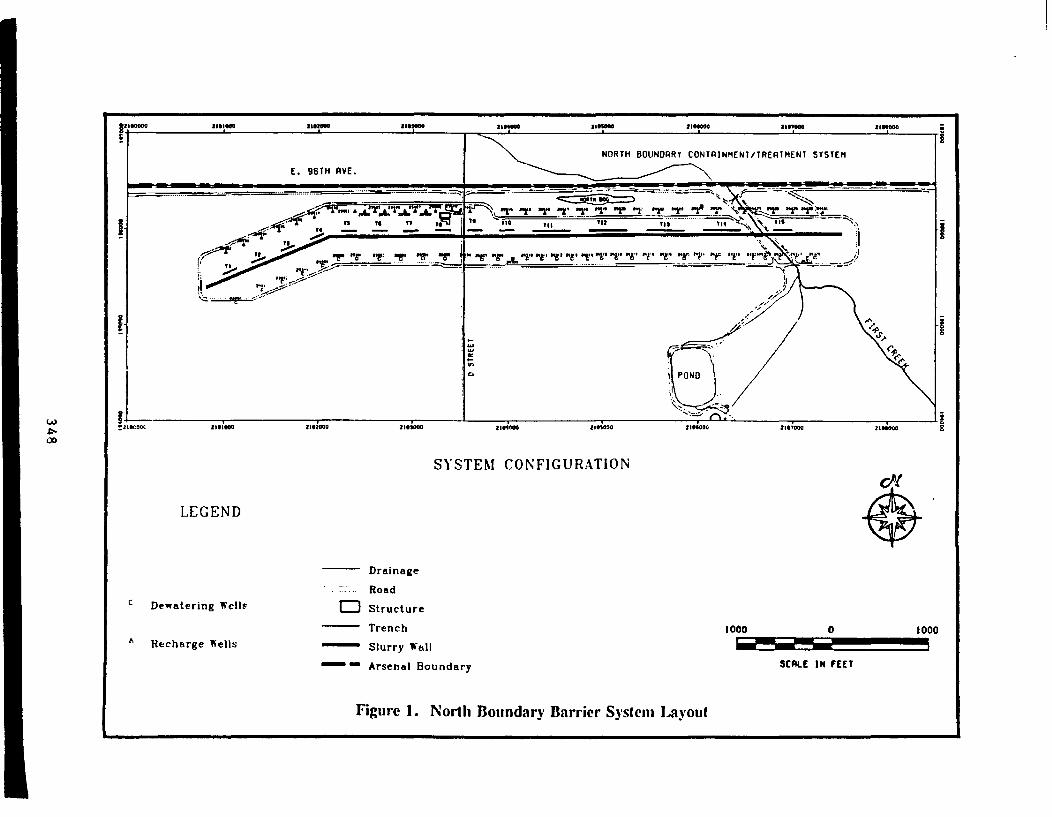
A pilot boundary system was installed at the north boundary in 1978. This pilotsystem consisted of a 1,500 foot long bentonite slurry wall, 6 dewatering wells and 12recharge wells. In 1981 the barrier system was extended to a total length of 6,470 feet(Figure ). This original barrier system consisted of 35 dewatering wells, 38 rechargewells, separated by a bentonite slurry wall. In 1989 and 1990 the barrier system wasmodified to its current configuration which included the addition of 15 recharge trenches.Contaminated groundwater is pumped from the upgradient side of the slurry wall, treatedby granular activated carbon adsorption, and the treated water is recharged downgradientof the wall. The dewatering wells are divided into three collection manifolds (A, B andC). Flow from each manifold has historically been treated by separate adsorber units.Manifold A (wells 330-335, and 301-306) intercepts a plume ofDiisopropylmethylphosphonate (DIMP) flowing from the Basin F area. Manifold B(wells 307-318) intercepts Dibromochloropropane (DBCP), chlorinated pesticides, Aldrin,Dieldrin, and Endrin, and several organosulfur compounds. Inorganic contaminantsinclude chloride and fluoride. Manifold C (wells 319-329) intercepts groundwater ofrelatively low concentration. In 1990, the treatment process was reconfigured to treatthe combined inflow from the separate manifolds as a single inflow stream.
347
SYSTEM CONFIGURATION
LEGEND
c Dewatering Wells
A Recharge Wells
- Drainage
- Road
IMI Structure
- Trench
- Slurry Wall
Arsenal Boundary
1000 0 1000
SCALE IN FEET
Figure 1. North Boundary Barrier System ayout
OPERATIONAL CONCERNS
Since the bentonite slurry wall extends across the entire shallow alluvial aquiferand it is keyed at its ends into relatively impermeable bedrock highs, the barrier system,regardless of how it is operated, should intercept all of the contaminated groundwater inthis aquifer reaching the north boundary. However, concerns have been expressed aboutthe integrity of the bentonite slurry wall and about the potential underflow past thebarrier system of contaminated groundwater in the underlying Denver Formation. Theprevailing thought is that this potential underflow is best controlled by maintaining areverse gradient (a gradient inward towards the arsenal) across the bentonite slurry wall.Management of the contaminant plumes approaching the barrier system is also desired.Questions about the operation of the barrier system concern: 1) what is the total barriersystem flow rate, 2) what is the distribution of manifold flow rates, 3) what is the bestdistribution of the treated recharge water, 4) in case of system failure, time and locationof groundwater overtopping of the bentonite slurry wall, 5) feasibility of achieving agradient reversal and 6) system modifications to improve barrier operation.
MODELING PROCEDURE
A finite element groundwater model (CSU/GWFLOW) was applied to the NorthBoundary Barrier System to study these concerns. For the 2.4 square miles study area,a very detailed mesh was used for the model grid which consisted of 13,156 nodes and25,524 elements (Figure 2). The resolution of this mesh in the immediate vicinity of theNBBS was in the order of about 25 ft between adjacent nodes. Each of the 35dewatering wells and the 38 recharge wells were represented in the mesh by separatenodal points so as to allow specification of individual well pumping rates. Each of the15 recharge trenches were represented by 3 to 6 nodes in the model grid. Similarly, 409monitoring wells at the arsenal in the vicinity of the barrier system were represented inthe mesh by separate nodal points so as to allow direct observation of model results withfield observations. In the mesh the bentonite slurry wall was simulated as an interior no-flow boundary.
Three different boundary conditions were assigned to the model. No-flowboundaries were assigned at the limits of unsaturated alluvial areas and in areas wheregroundwater flow lines are parallel to the boundaries. Specified flux and/or constant headboundaries were also used in the model, and their values adjusted for different calibrationtime periods according to the observed data.
MODEL INPUT DATA
Input data requirements for the model consisted of alluvial aquifer characteristicssuch as hydraulic conductivity, saturated thickness, transmissivity, and specific yield. Toaccount for aquifer heterogeneities in the vicinity of the NBBS, a geostatistical analysiswas performed. As part of this modeling effort, Kriging and Co-Kriging techniques wereapplied for selected aquifer properties such as hydraulic conductivity to estimate model
349
tn(D
MODEL MESH
Area: 2.4 sq. miles13156 Nodes25524 Elements
0 IWO 2000
Scale In Feel
Figure 2. The Finite Element Mesh
~~~~ -- I
input data. These geostatistical techniques also account for the uncertainty in theestimated values of aquifer parameters and the precision of the results. Details of thetheory of Kriging and Co-Kriging are thoroughly documented in the works of Marsily(1986) and Myers (1982), respectively. Operational flow rates from pumping andrecharge wells, recharge trenches, manifolds and system adsorbers were also used as amodel input data. Average rates were used for different time periods.
Different discharge and recharge sources and stresses to the system werethoroughly evaluated in the study area and incorporated in the model. Recharge fromprecipitation was taken into account in the entire model area. The offpost impoundment(Mul reservoir) located along First Creek and the north bog were represented as constanthead which resulted in a net recharge to the aquifer. Later the bog was discontinued asa source of water as the recharge trenches were installed. Upgradient of the NBBS, FirstCreek gains water from the aquifer (net discharge) in a small wetland area.
GEOSTATISTICAL SITE CHARACTERIZATION
Description of the spatial variability of aquifer properties, regarded asregionalized variables, is being approached by geostatistics (Marsily, 1986). Kriging isa geostatistical technique that estimates the best, linear, unbiased values of regionalizedvariables at unsampled locations based on the available measurements of these variables.Co-kriging is an extension of kriging to situations where two or more variables arecorrelated in such a manner that the spatial variability of one of the variables improvesthe estimation process. This is the case of the under-sampled variable such astransmissivity data from pumping test results and the better sampled saturated thickness.Before these techniques are applied a structural analysis of the data must be conducted.That includes the determination of frequency distribution functions, experimentalsemivariograms and cross-semivariograms as well as model fitting and cross validation.
At the arsenal a total of 18 hydraulic conductivity (K) values derived frompumping tests performed in the vicinity of the NBBS were available for analysis.Seventy one wells were used to estimate the spatial variability of aquifer transmissivityand 273 wells for saturated thickness.
As recommended by Delhomme (1978) a natural log (Ln) transformation wasperformed for hydraulic conductivity (K), transmissivity (T), and saturated thickness (b)values and the resulting distributions checked for normality. From the histograms andstatistical analysis the Ln(K) and Ln (T) approximated a normal distribution. Thecumulative distribution function for saturated thickness also plotted as a straight line onnormal probability paper indicated normality conditions.
To use Kriging an experimental semivariogram which describes the spatialcorrelation structure of the regionalized variables is required. The semivariogramdepends on the distance separating two known data points. The procedure to obtain anexperimental semivariogram is given in Istok et al., (1988). To use co-kriging thecalculation of a cross-semivariogram is required for two or more variables of interest.
351
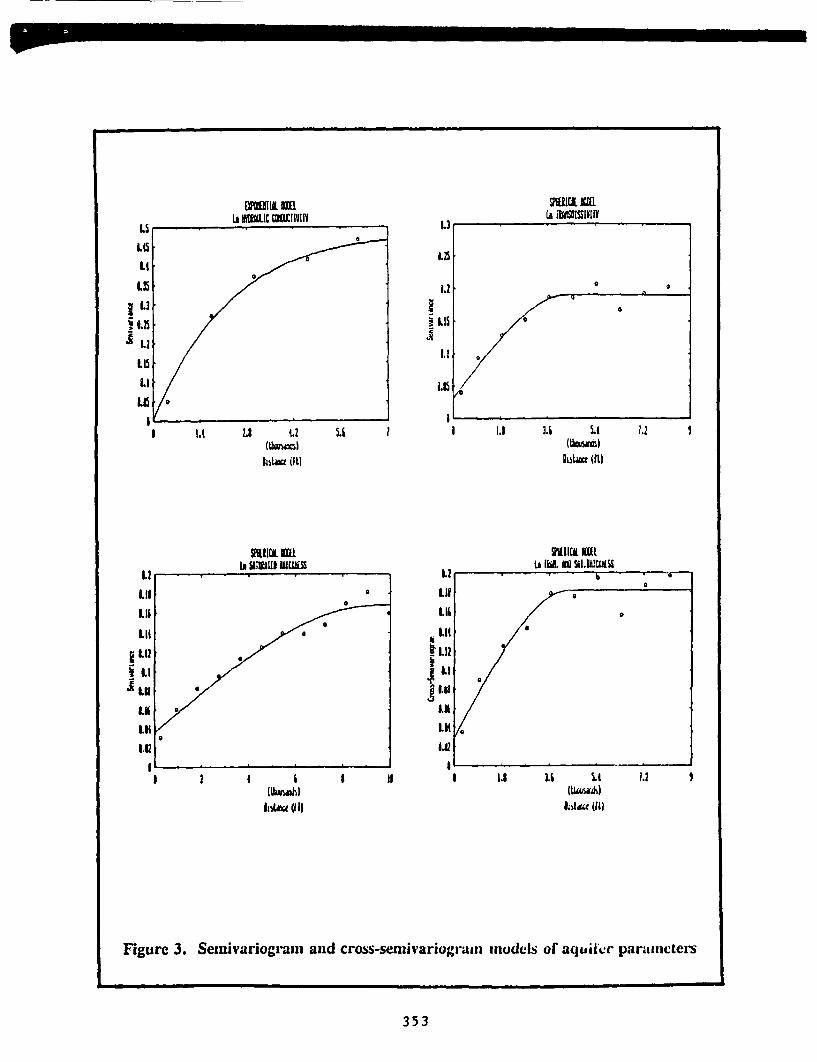
The experimental semivariograms and cross-semivariograms were fitted with differentmathematical models based on a least square minimization procedure. These fitted modelsmust be positive definite to ensure positive estimation variances (Journel and Huibregts,1978). The experimental semivariogram for Ln (K) was best fitted with an exponentialmodel with no nugget-effect, a sill of 0.55 and a range of 9,549 feet. The experimentalsemivariogram of Ln (T) was best fitted by a spherical model with a nugget of 0.023,sill of 0.152 and a range of 3,860 ft. For the Ln (b), a spherical model with nugget, sill,and range of 0.053, 0.119, and 10,700 feet, respectively was obtained. The cross-semivariogram between Ln (T) and Ln (b) was also calculated. A spherical model wasfitted to this experimental cross-semivariogram with the following parameters: nugget of0.04, sill of 0.13 and range of 8,000 feet. These models are shown in Figure 3.
All of the fitted models were cross-validated by the jackknifing procedure(Vauclin et al., 1983). This method is used to evaluate whether the fitted models areappropriate for the experimental data. It estimates the value of the variable of interestat every known sampling location, but excluding the known measured value from theestimation process. A comparison between the actual and estimated value wasperformed. The mean kriging (or co-kriging) error along with the mean squared(variance) error were calculated to measure the goodness of the model fit. To beunbiased the former must be close to zero and the latter should be close enough to one.The reduced mean for Ln (K) was 0.0381 and the reduced variance 0.9937. The meankriging error and mean squared error for Ln (T) and Ln (b) were (-0.0515,0.9949) and(-0.036,1.002), respectively. The overall reduced mean and variance for the set ofsemivariograms used in the co-kriging calculations were -0.0446 and 1.004, respectively.Based on these results, the fitted models were considered appropriate for this study.
KRIGING AND CO-KRIGING ESTIMATION
Based on the spatial structure of the aquifer regionalized variables, Kriging andCo-kriging estimates and variances of hydraulic conductivity, transmissivity, andsaturated thickness were computed for a 2 x 2 miles grid that represents the study area.The estimated data was then transposed to each node of the finite element mesh formodel data input.
To aid in the calibration process, Kriged estimates and variance maps were madefor hydraulic conductivity transmissivity and saturated thickness. An excellentreproduction of mapped unsaturated areas was achieved with the kriging interpolator.Maps of 95 percent confidence level were also made for the estimated values. Thesemaps were considered to appropriately describe the spatial variability of these parametersexcept for transmissivity. Kriged estimates of transmissivity showed somediscontinuities in areas where the flow is known to be continuous due to a lack of enoughdata points used in the estimation process. As expected high estimation errors werefound in these discontinuous areas.
To enhance the understanding of the spatial distribution of transmissivity,saturated thickness was used as an auxiliary variable in co-kriging. The accuracy of the
352
kiWL ns LA IMIC =1VIWn
MwIt ERLa IVAUO[SSIVH
1.3 . . .
.25
I.4 a a
qII
I4.9
B1
I
I. ,1
I 1.1 34
I.1
.
I 1A Li B .2lbxs)
DiLM (f)
5.A 1 Li
11Lsta (I
1.2 1
vitiM mlIS Ilubff) mn
WiICK Enta 1. IN s.i1CmUSS
I1
I I I I(lah)
IIA 011
I It s.dLPhtu&i)
Malls {I}
Figure 3. Semivariograin and cross-sernivariogramzi models of aqtuifr parameters
353
estimation of transmissivity was thought to be greatly improved and the estimation ofvariances significantly reduced due to the high correlation that exist betweentransmissivity and saturated thickness of the aquifer. These transmissivity values wereused as initial estimates for model calibration.
Based on these geostatistical results, the best unbiased estimates of aquiferparameters were used as data input in the model. This data along with the averageoperational flow rates of the system at different time periods were used for modelcalibration.
MODEL CALIBRATION
A steady-state calibration of the model was initially performed to the pre-barrierconditions (Feb-March 1978). The steady state model calibration was then furtherrefined by a series of transient calibrations. This calibration consisted of simulatingactual barrier system operation beginning with the pilot system (July 78 to Nov 81) tofull barrier system operation (Nov 1981 to January 1991). Thirteen separate transientcalibrations were performed at selected time periods. The model results were comparedwith field observations at the monitoring wells and average manifold flow rates. One ofthe difficulties with the transient calibration is that poor records were often kept aboutbarrier system operation. Metering problems for the distribution of total barrier flowrate by individual wells was frequently encountered. The model calibration wasconsidered to be excellent with an average model calibration error of less than 0.5 foot.
Model calibration also accounted for all changes in the NBBS and aquifer stressesthat occur during the period of calibration. For example, the closure of Basin F, the useof the north bog for recharge, the addition of recharge trenches, etc. The ability torecreate the history of NBBS operation and aquifer response was somewhat limited dueto poor operational records during some time periods. Despite this limitations, favorableresults were obtained during the calibration procedure. The latest model calibrationperiod was from spring, 1990 to February, 1991.
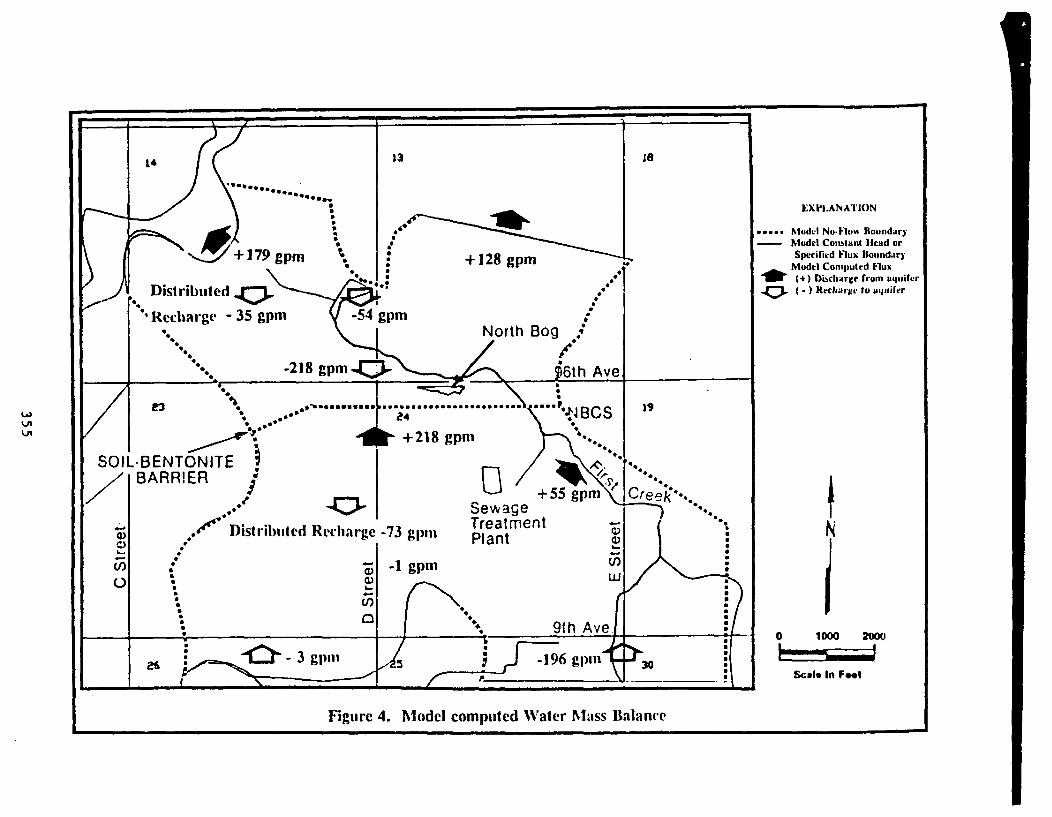
Figure 4 shows the calibrated Groundwater Mass Balance for February 1991,which agrees with the observed flow rates and the system current operation. The modelestimated 218 gpm as the total flow currently approaching the NBBS. This mass balancealso shows a decrease of inflow from Basin F area of about 45 gpm compared to theinflow occurred in spring 1987. This decrease has been mainly attributed to the closureof Basin F. In addition, a net recharge of 54 gpm from the Mul reservoir was calculatedfrom the model which indicates an approximate leakage rate of 0.56 inches/day. Theaquifer discharges 55 gpm to First Creek and receives a total of 108 gpm of distributedrecharge from precipitation. Inflows and outflows at the boundary limits are also shownin Figure 4.
Transient calibration runs were performed on the supercomputer CRAY Y-MP.An average CPU time for a transient run (20 Pumping Periods) was 20 minutes on theCRAY Y-MP. Steady state calibrations and simulations were performed on a Silicon
354
13 is
EXPLANATION
+128 gpm
..... .. d:l No-Flow Boundary- Model Comstant Head or
Specified Flux BoundaryModel Computed Flux
W (+) Discharge from aquifer( - ) Rerharge to aqliiferDistril)uted
Recharge - 35 gpin
rn
+218 gpni
Recharge -73 gpin
C/V+SewageTreatmentPlant N
-1 gpm
1 1
Scale In Foet
Figure 4. Model computed Water Mass Balance
Graphics Personal IRIS (SGI,4D35TG) computer, with 16 MB virtual memory. Anaverage CPU time for steady state simulation was 3.5 minutes on the SGI workstation.Also most transient calibrations for the period of May,1987 to Feb.,1991 (3 pumpingperiods) were run on the SGI for 3.5 hours of CPU time.
MODELING SIMULATIONS
Utilizing the calibrated model, various operational, breakdown and barrierreconfiguration simulations were performed. One of the major questions asked byarsenal personnel was whether a gradient reversal could be achieved for the barriersystem without using the recharge trenches (ie. using only the recharge wells). The lineof recharge wells are located 250 feet downgradient of the slurry wall and the line ofdewatering wells are located 250 upgradient of the slurry wall. The rate of groundwaterflow to the North Boundary Barrier System has varied with time but in recent years hasbeen about 220 to 230 gpm. Under this natural interception rate the average headdifference between the two lines of wells is 3.5 feet over Manifold A, and 4 feet overManifolds B and C. Model results indicated that the best that could be achieved by thebarrier system in the long term was the natural interception conditions. A gradientreversal over the entire length of the barrier system was not possible without increasingthe amount of recharged water relative to the total dewatering pumping rate (in the longterm it is impossible to pump more than the natural interception rate but it is possible toincrease the amount of recharge water). One possibility is to retain First Creek flowsfor recharge downgradient of the barrier. At present time this option has not beenpursued by the Army.
The recharge capacity of the injection wells has considerably decreased since thewells were first installed. This loss of recharge capacity is thought to be due todeposition of carbon fines from the adsorber units and from microbial growth in thewells. These problems are currently being studied in a separate project betweenColorado State University and the U.S. Army Corp of Engineers. Because of this lossof recharge capacity of the wells, much of the treated recharge water was for a periodof time disposed of in a bog at the east end of the barrier system (this occurred beforethe installation of the trenches). Additionally Manifold C was over pumped relative toManifolds A and B because of concerns about overtopping of the slurry wall in thatsection if the barrier system were to breakdown for an extended period of time. As aresult the actual head differential across the slurry wall for 1987 operating conditions wasconsiderably different than that for natural interception rates. For this operatingcondition the head differential across the slurry wall in the Manifold A section was about7 feet, in the Manifold B section was about 2.5 feet and in the Manifold C section wasabout zero.
Since Manifolds A and B intercept contaminated groundwater of highconcentrations and Manifold C intercepts low concentration groundwater, it is desirableto maintain a reverse gradient over at least Manifolds A and B. In order to accomplishthis, the model was used to simulate and evaluate various system reconfigurations suchas installation of additional dewatering and recharge wells, trenches, recharge ponds, etc.
356
at different locations and operating conditions. Results of these simulations predicted thata series of recharge trenches located 45 feet downgradient from the slurry wall wasneeded to achieve reverse gradients. Treated water previously discharged to the bog nearthe east end of the barrier system would be then discharged through trenches located inthe western half of the barrier system to cause a gradient reversal in this region. Modelsimulations indicated that under this operating condition a gradient reversal was to beachieved over the entire section for Manifold A and about half of the section forManifold B. In the section of the barrier system with a calculated gradient reversal theaverage head differential was about -2 feet and over the remainder of the barrier systemit was about 5 feet.
The simulated recharge trenches were implemented by the Army in 1989 and1990. They have performed excellently, achieving the desired gradient reversal over thecritical sections of the North Boundary Barrier System. In actuality the Army has thusfar been able to maintain a gradient reversal over a somewhat longer length of the barriersystem than that indicated by model results. This has been achieved by slightlyoverpumping the dewatering wells. Current withdrawal rates for the barrier system areabout 250 gpm. The natural interception rate of groundwater flow to the barrier systemhas dropped slightly over the past several years and is now estimated to be less than 220gpm. Consequently, parts of the alluvial aquifer on the upgradient side of the barriersystem have been desaturated due to overpumping.
Several other NBBS operational simulations were also performed. First, thesystem was overpumped by up to 100 gpm above the equilibrium barrier flow of 220gpm. Second, different simulations were performed to determine the aquifer response andeffects of permeability reduction by potential clogging of the pores within rechargetrenches by carbon fines. This was accomplished by decreasing transmissivity values byup to 75 percent across the line of nodes representing the trenches. Third, simulationswere performed to obtain an estimate of the maximum recharge capacity of the trenchesand their predicted reverse gradients. This estimate was determined by setting constantheads values (at the nodes corresponding to the trenches) to 4 ft below trench groundsurface elevations which is the maximum head that can be physically accommodated ineach trench. A total recharge of 400 gpm was predicted in this simulation with acalculated average head differential of about -3.5 feet over the length of manifold A andhalf of manifold B. This simulation was carried out under current dewatering flow rates.
A particle tracking capability was incorporated to the finite element modelCSU/GWFLOW using the area coordinate system as a new interpolation scheme ofparticle velocities. The area coordinate system interpolation scheme has the sameproperties as those for the local shape functions of the triangular elements used in thefinite element method (Warner, 1981). The particle tracker in the model allowed thedelineation of particle pathlines and identification of particle travel times. This capabilitywas extremely useful for the evaluation of various operational alternatives of the NBBSby particle capture. Figure 5 shows a particle velocity contour map for January 1991,and the display of particle pathlines after five years of system operation under current
357
(a)
Figure 5. (a) Particle pore velocilies (/day)(b) Particle pathways after S years travel time
358
M �I
conditions. Notice the differences of the distance traveled by some particles in certainareas for the same travel time.
SCIENTIFIC VISUALIZATION
Visualization techniques is a new technology for capturing, processing andenhance information. Scientific visualization has become an integral part of any largescale modeling effort, and it is especially useful in allowing modelers to interrogate thehuge volume of input or output of their data sets produced by their models. Scientificvisualization assists the modeler, easily and effectively, to ensure that his computationalresults are correct before undertaking the expensive task of recomputing.
Scientific visualization was in modeling the NBBS at different stages: data setpreparation, model calibration and exploration of final results. Scientific visualization,as an example, coupled with numerical interpolation routines (kriging and co-kriging)were used to describe the spatial variability of several aquifer properties in the studyarea. Color raster maps of one or many slices along a plane through a 3-D field oftransmissivities, saturated thickness, etc., were displayed and generated at time spansusing the Silicon Graphics Personal IRIS Workstation. Cutting planes, hidden surfaceremoval and color shading techniques were also used to generate different images. Thispractice enhanced the understanding of aquifer hydrogeological conditions which helpedin achieving the objectives for modeling this complex problem.
CONCLUSIONS
The experiences gained at the Rocky Mountain Arsenal through the 13-yearoperation of the NBBS are that groundwater barrier systems are commonly complex anddifficult to operate and manage. The operational management model developed jointlyby Colorado State University and the Army Corps of Engineers has proven to be a veryuseful and practical tool in the management of these systems.
Different questions regarding the overall effectiveness and efficiency of the systemposed by the U.S. Army were evaluated using this finite element operational model. Asteady state calibration for pre-system conditions and 13 separate transient calibrationswere carried out from 1978 to 1991. The use of a refined model mesh allowed a bettercalibration in the NBBS area, particularly close to the system where the effects ofpumping and recharge are the highest. Also, it increased the model capability forrepresenting different system reconfiguration to achieve desired conditions such asreverse gradients along the entire length of the system.
The model predicted among other simulated scenarios that the implementation ofrecharge trenches located 45 ft downgradient of the slurry wall would achieve reversegradients across the slurry wall. This condition has already been achieved since the
359
-
implementation of the trenches in 1989-1990. In addition to this, the model simulateddifferent operational scenarios to improve system performance and define guidelines foroptimal operational rates.
Geostatistics was also successfully applied in this study as a tool to improve datainput in the model by accounting for spatial variability of aquifer parameters. Krigingand Co-kriging techniques were used to estimate values of hydraulic conductivity,transmissivity and saturated thickness at unsampled locations. In addition, theuncertainty associated with these estimates and the precision of the kriging interpolationwere also obtained through variance error calculations. Scientific visualization techniqueswere very beneficial as a tool to enhance hydrogeological understanding of the modeledarea, along with helping display large amount of input and output data in a more efficientand accurate way.
ACKNOWLEDGEMENTS
The research described in this paper was performed in cooperation with theWaterways Experiment Station, U.S. Army Corps of Engineers, GeotechnicalLaboratory, the Program Manager's Office, Rocky Mountain Arsenal and theGroundwater Program, Department of Civil Engineering, Colorado State University(Project 5-32381). We also would like to acknowledge the support of the GroundwaterProgram Experiment Station Project (1-51101).
REFERENCES
Delhomme,J.P. "Kriging in the Hydrosciences." Advances in Water Resources Vol. 1,No.5 (1978),251-266.
Environmental Science and Engineering (ESE) "Offpost Operable Unit RemedialInvestigation and Chemical Specific or Relevant and Appropriate Requirements."Final Report Task 39 Prepared for U.S. Army PMO for Rocky MountainArsenal. Denver,CO: 1988.
Istok, .D.; Cooper,R.M.; and Flint,A.L."Three Dimensional Cross-SemivariogramCalculations for Hydrogeological Data." Groundwater Vol.26, No.5(Sept. 1988),638-646.
Journel, A.G.; and Huibregts, CH.J. Mining Geostatistics. London: AcademicPress, 1978.
Marsily, Ghislain De. Ouantitative Hydrogeology. London:Academic Press, 1986.
Myers, D.E." Matrix Formulation of Co-Kriging" Math. Geology Vol. 14(1982),249-257.
360
r ~ ~ ~ ~ - Ii-
��l
Warner,J.W.(1991). Finite Element 2-D Transport Model of Groundwater Restorationfor In situ solution Mining of Uranium, PhD Dissertation, Colorado State Univ.Fort Collins, Co. 320 pp.
Vauclin,M.; Vieira,S.R.; Vachaud,G.; and Nielsen,D.R."The Use of Cokriging withLimited Field Soil Observations". Soil Sci. Soc. Amer. J. Vol.47 (1983),175-184.