Page 1
The Pennsylvania State University
The Graduate School
College of Engineering
REMEDIATION OF HIGH-STRENGTH MINE IMPACTED WATER WITH CRAB
SHELL SUBSTRATE MIXTURES: LABORATORY COLUMN AND FIELD PILOT TESTS
A Thesis in
Environmental Engineering
by
Jessica A. Grembi
2011 Jessica A. Grembi
Submitted in Partial Fulfillment of the Requirements
for the Degree of
Master of Science
May 2011
Page 2
The thesis of Jessica A. Grembi was reviewed and approved* by the following:
Rachel A. Brennan Assistant Professor of Environmental Engineering Thesis Advisor
Brian A. Dempsey Professor of Environmental Engineering
William D. Burgos Professor of Civil Engineering Department of Civil and Environmental Engineering
Peggy A. Johnson Professor of Civil Engineering Head of the Department of Civil and Environmental Engineering
*Signatures are on file in the Graduate School
Page 3
ABSTRACT
Anaerobic passive treatment systems remediating high-strength mine impacted water
(MIW) have not displayed consistent success. For example, the high iron (140 mg/L) and acidity
(380 mg/L as CaCO3) of the Klondike-1 discharge near Ashville, PA, caused premature clogging
of a vertical flow pond which was filled with a traditional spent mushroom compost (SMC) and
limestone substrate. In this study, continuous-flow columns and pilot-scale field reactors were
used to evaluate if treatment of high-strength MIW can be improved using crab shell as a
substrate amendment.
For the lab study, continuous-flow columns containing 50– 100% crab shell (with the
balance SMC) were compared to a sand control and a column containing the traditional 90%
SMC and 10% limestone. MIW for the column study was obtained from the Klondike-1 site and
pumped at a flow rate of 0.25 mL/min to maintain a 16 h hydraulic retention time within each
column. After determining the best performing substrate mixture (70% crab shell + 30% SMC)
in the column test, a pilot-scale field study was initiated, in which 1000-gallon tanks were filled
with a limestone underdrain and an upper substrate layer of: 1) 100% crab shell; 2) 70% crab
shell + 30% SMC; or 3) 90% SMC + 10% limestone. A fourth tank containing a sandstone
underdrain with a 70% crab shell + 30% SMC substrate layer was installed to determine if similar
performance could be achieved without the limestone underdrain. Aqueous samples were
collected from the columns/reactors and analyzed for pH, ORP, ammonia, acidity, alkalinity,
DOC, anions, and metals. Additional samples taken after passive aeration were also monitored.
In the column study, the 70% crab shell + 30% SMC column treated double the volume
of MIW, removed more than twice the mass of metals, and sustained pH above 5.0 for almost
twice as long as the traditional SMC and limestone substrate. To date, the field study results
mirror the laboratory findings.
Page 4
iii
TABLE OF CONTENTS
1. Introduction ...................................................................................................................... 1
1.1 Mine Impacted Water ............................................................................................... 1 1.2 Anaerobic Sulfate-Reducing Passive Treatment ...................................................... 3 1.3 Composition of Organic Substrate Layer ................................................................. 7 1.4 Crab shell as an alternative substrate for VFPs ........................................................ 8 1.5 Background of the Klondike-1 Site .......................................................................... 10 1.6 Objectives of Current Study ..................................................................................... 11
2. Materials and Methods ..................................................................................................... 13
2.1 Water Source ............................................................................................................ 13 2.2 Substrates ................................................................................................................. 14 2.3 Continuous-Flow Column Setup .............................................................................. 18 2.4 Analytical Methods .................................................................................................. 22 2.5 Conservative Tracer Tests ........................................................................................ 23
3. Continuous-flow column laboratory experiment ............................................................. 25
3.1 Source Water ............................................................................................................ 25 3.2 Conservative Tracer Tests ........................................................................................ 26 3.3 pH, Alkalinity and Acidity ....................................................................................... 27 3.4 Metals Removal........................................................................................................ 31
3.4.1 Primary Metals ............................................................................................... 31 3.4.2 Trace Metals ................................................................................................... 36
3.5 Sulfate Reduction ..................................................................................................... 39 3.6 Carbon and Nitrogen Species ................................................................................... 40 3.7 Other Cations ........................................................................................................... 42
4. Discussion ........................................................................................................................ 45
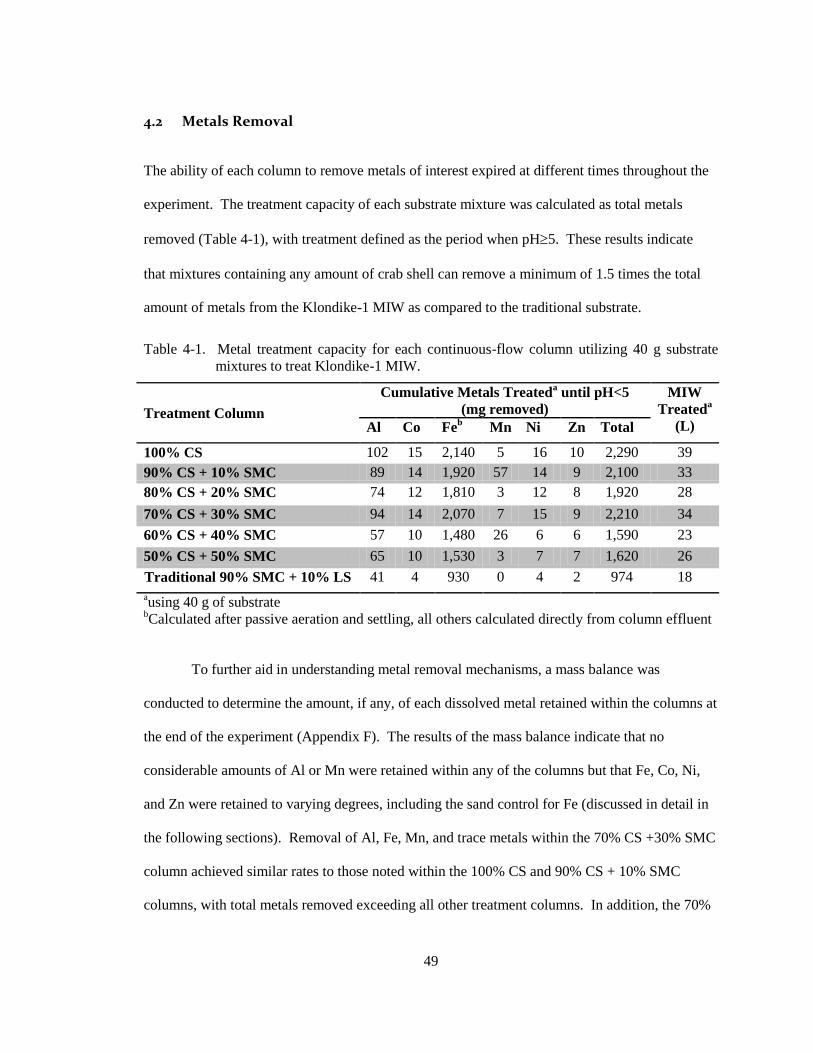
4.1 Alkalinity .................................................................................................................. 45 4.2 Metals Removal........................................................................................................ 49
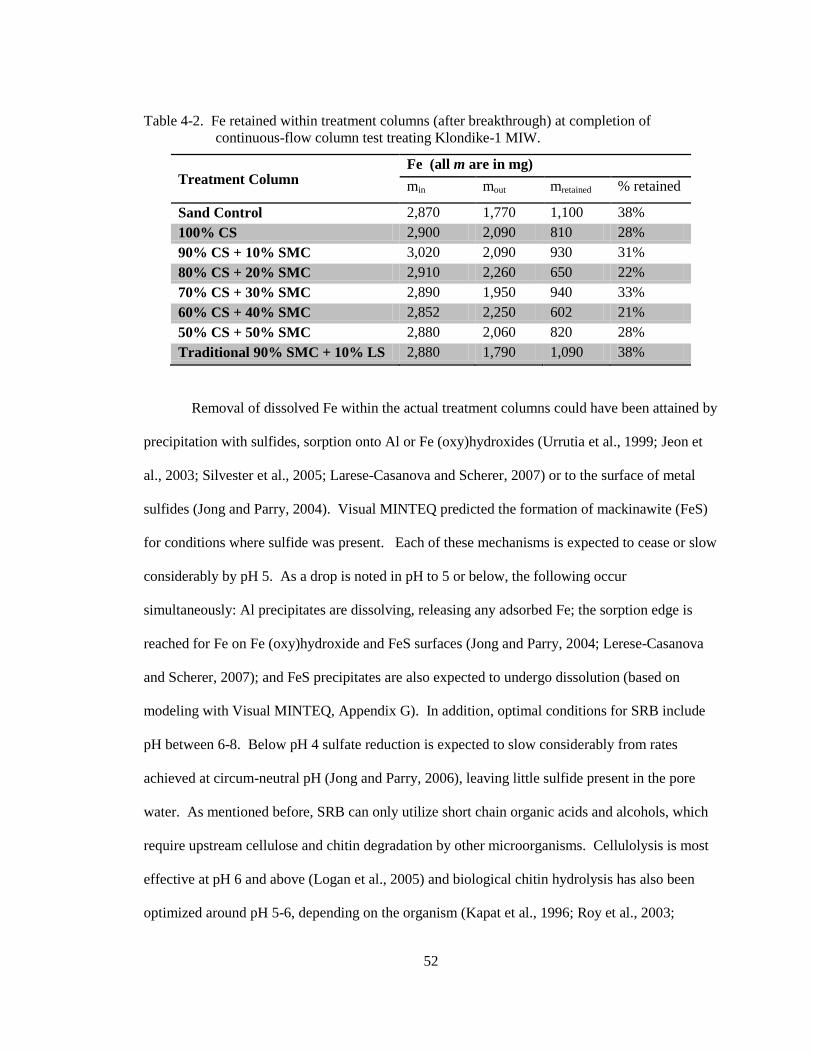
4.2.1 Al .................................................................................................................... 50 4.2.2 Fe Removal Within Treatment Column ......................................................... 51 4.2.3 Fe Removal After Passive Aeration and Settling ........................................... 53 4.2.4 Mn .................................................................................................................. 53 4.2.5 Trace Metals ................................................................................................... 54
4.3 Carbon Species ......................................................................................................... 59 4.4 Cations ...................................................................................................................... 62 4.5 Longevity of Treatment ............................................................................................ 65
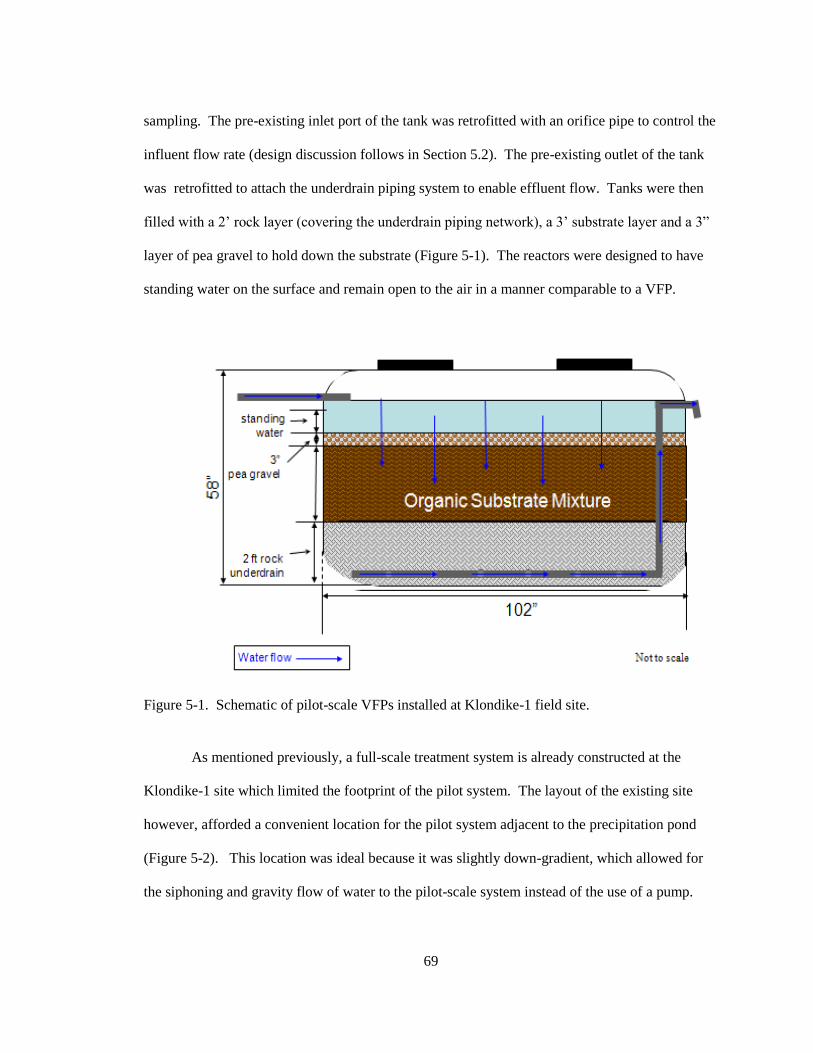
5. Field Pilot System ............................................................................................................ 68
5.1 System Concept ........................................................................................................ 68 5.2 System Design .......................................................................................................... 70
Page 5
iv
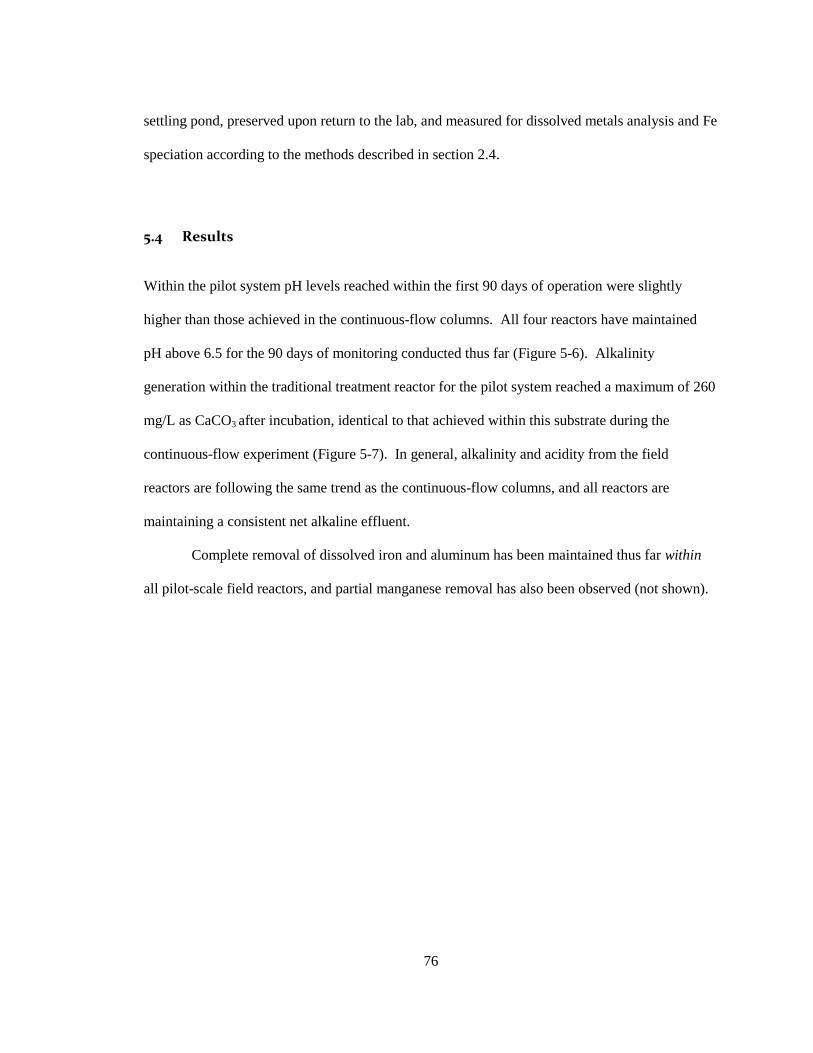
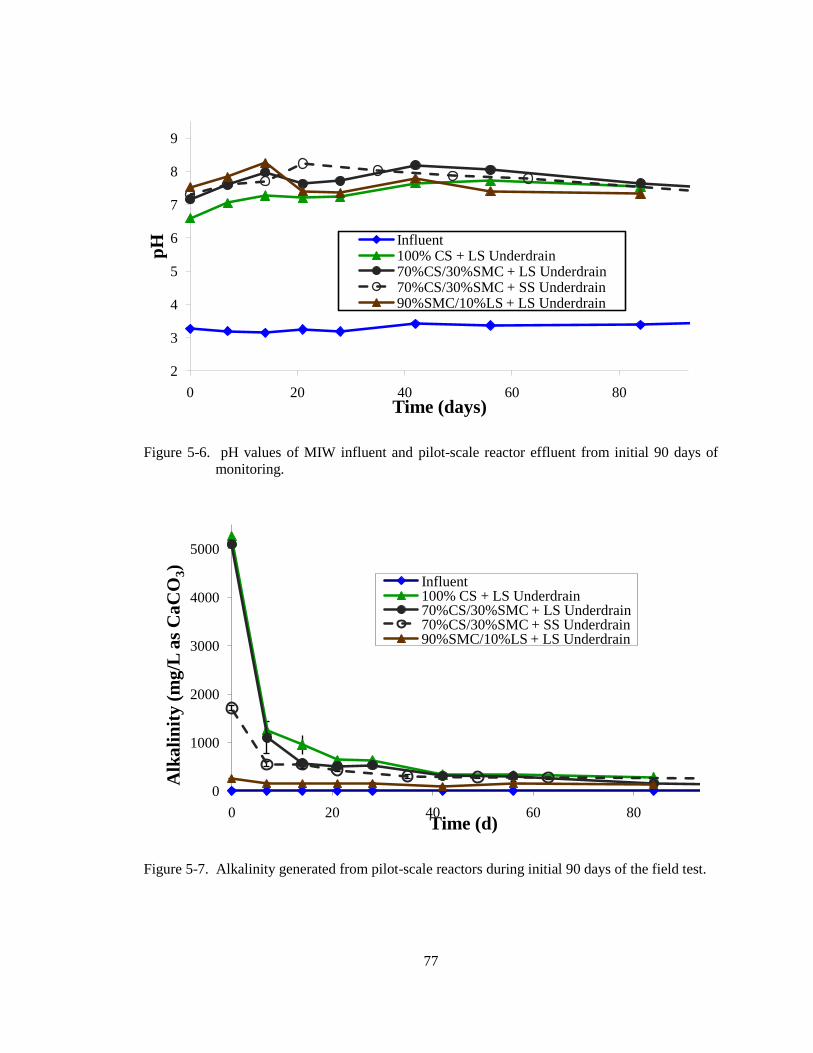
5.3 Construction, Incubation, and Field Sampling ......................................................... 73 5.4 Results ...................................................................................................................... 76
6. Conclusions ...................................................................................................................... 78
6.1 Treatment Longevity for Engineering Designs ........................................................ 78 6.2 Potential Concerns.................................................................................................... 78
7. Future Work ..................................................................................................................... 81
References ................................................................................................................................ 84
Appendix A Conservative Tracer Tests .................................................................................. 90
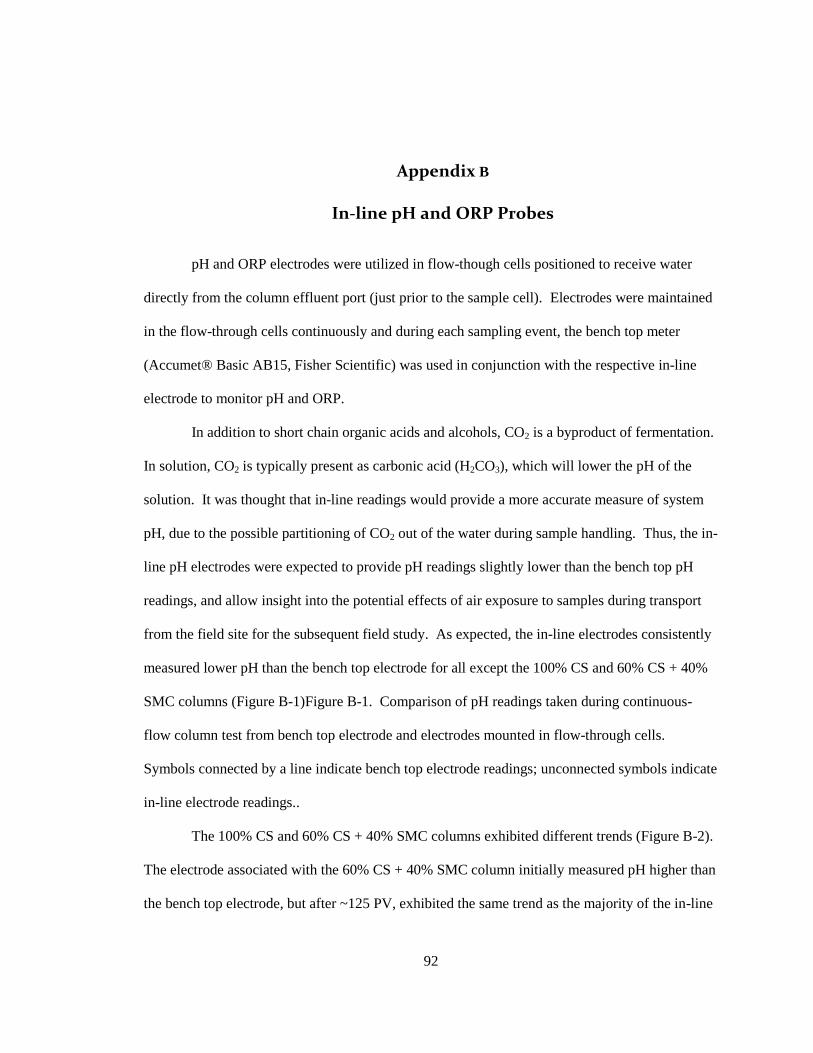
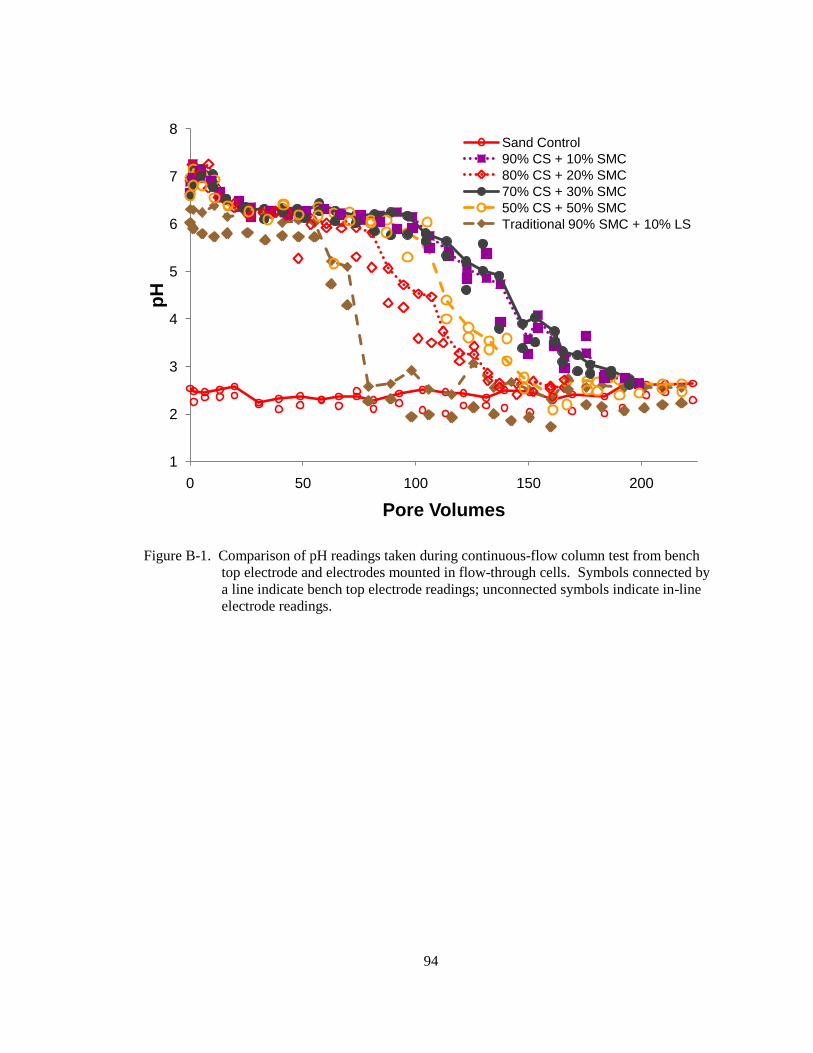
Appendix B In-line pH and ORP Probes ................................................................................ 92
Appendix C Metals Removal After Passive Aeration and Settling ........................................ 97
Appendix D Sulfate Data ........................................................................................................ 104
Appendix E Cation Data Plots ................................................................................................ 106
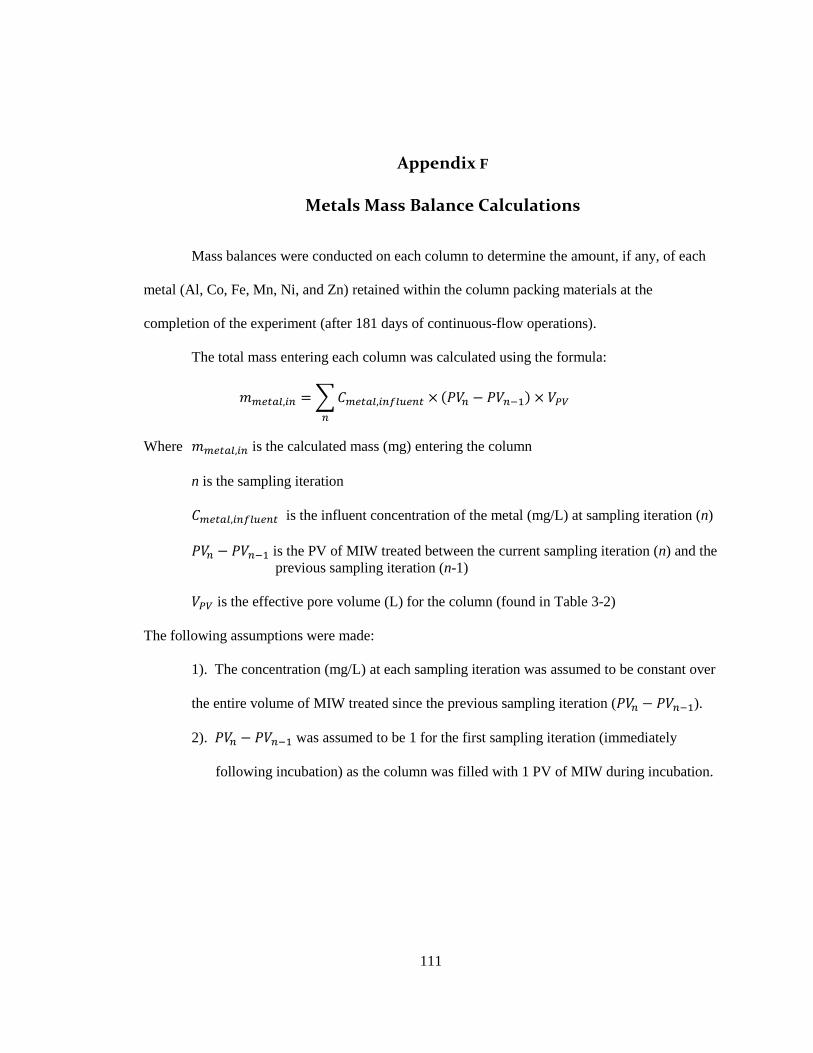
Appendix F Metals Mass Balance Calculations ..................................................................... 111
Appendix G Organic Carbon Mass Balance Calculations ...................................................... 116
Appendix H Visual MINTEQ Geochemical Modeling .......................................................... 120
Appendix I Treatment Scale-up using a 1:1 Crab Shell to Proppant Ratio ............................ 123
Appendix J Field Pilot System Installation and Sampling Photos .......................................... 128
Page 6
v
LIST OF FIGURES
Figure 1-1. Cross-sectional schematic of a vertical flow pond (VFP). .................................... 4
Figure 1-2. Risk classification categories established for passive treatment systems
remediating net acidic discharges in the 2009 PA DEP Program Implementation
Guidelines for the Bureau of Abandoned Mine Reclamation Acid Mine Drainage
Set-Aside Program which guides funding for remediation projects (taken from PA
DEP, 2009). ...................................................................................................................... 6
Figure 1-3. Relative distribution of chitin, protein, and CaCO3 for various species
(Muzzarelli, 1977). ........................................................................................................... 9
Figure 2-1. Laboratory continuous-flow columns used to treat Klondike-1 MIW. ................ 19
Figure 2-2. Schematic of continuous-flow column experimental setup.................................. 20
Figure 2-3. Passive aeration and settling were accomplished in bins subsequent to the
continuous-flow columns. Sample cells were used to collect water exiting the
settling bins to monitor increased metals removal from this additional
oxidation/precipitation step after anaerobic treatment. Photo taken on day 36 of the
experiment. ....................................................................................................................... 21
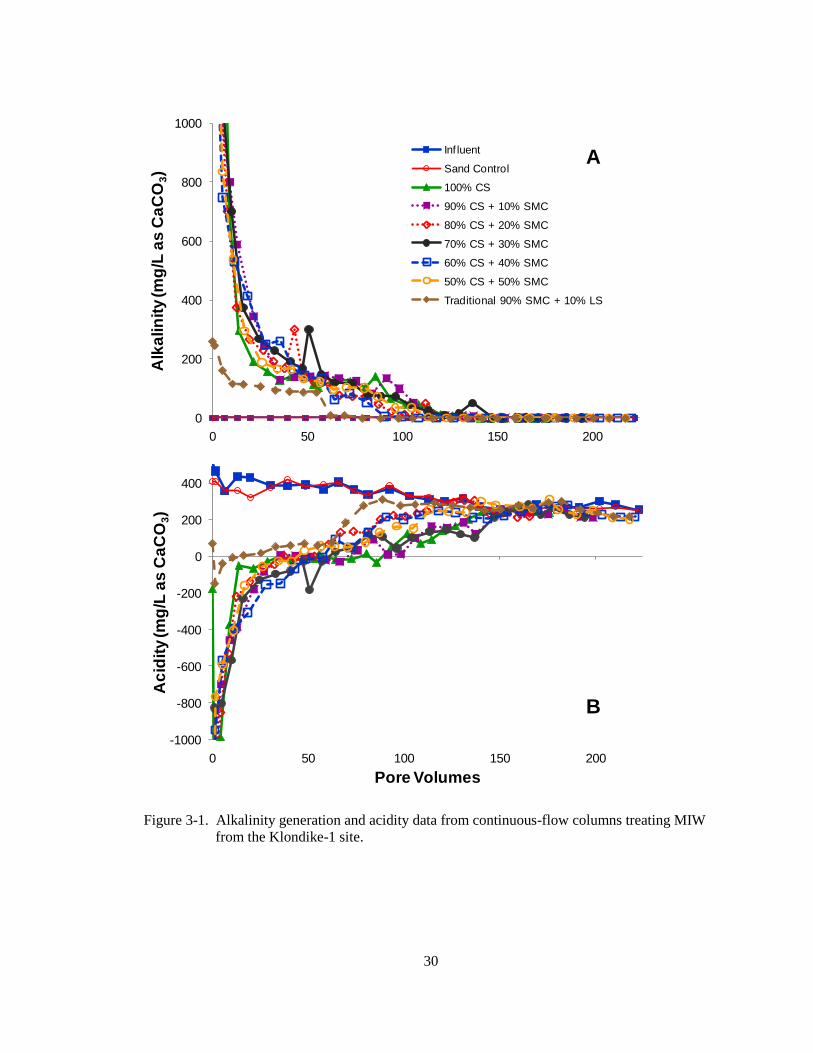
Figure 3-1. Alkalinity generation and acidity data from continuous-flow columns treating
MIW from the Klondike-1 site. ........................................................................................ 30
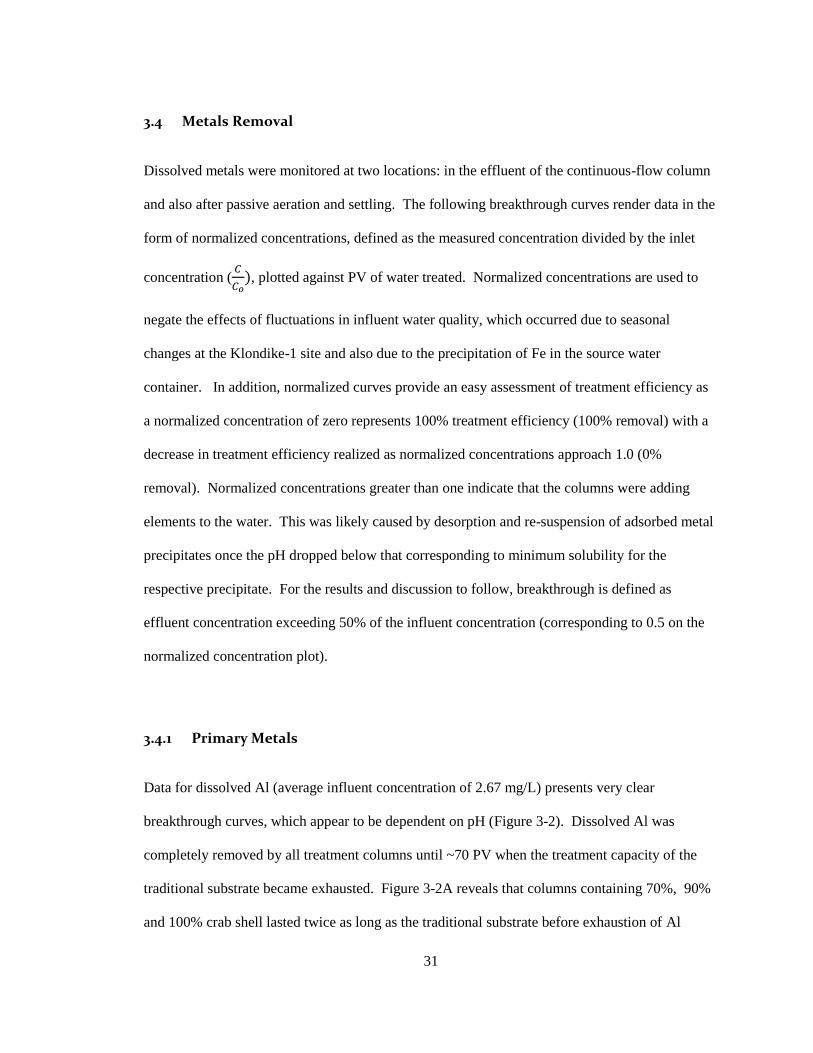
Figure 3-2. Breakthrough curves for dissolved Al (A) and pH measurements (B) taken
after continuous-flow columns treating Klondike-1 MIW. .............................................. 32
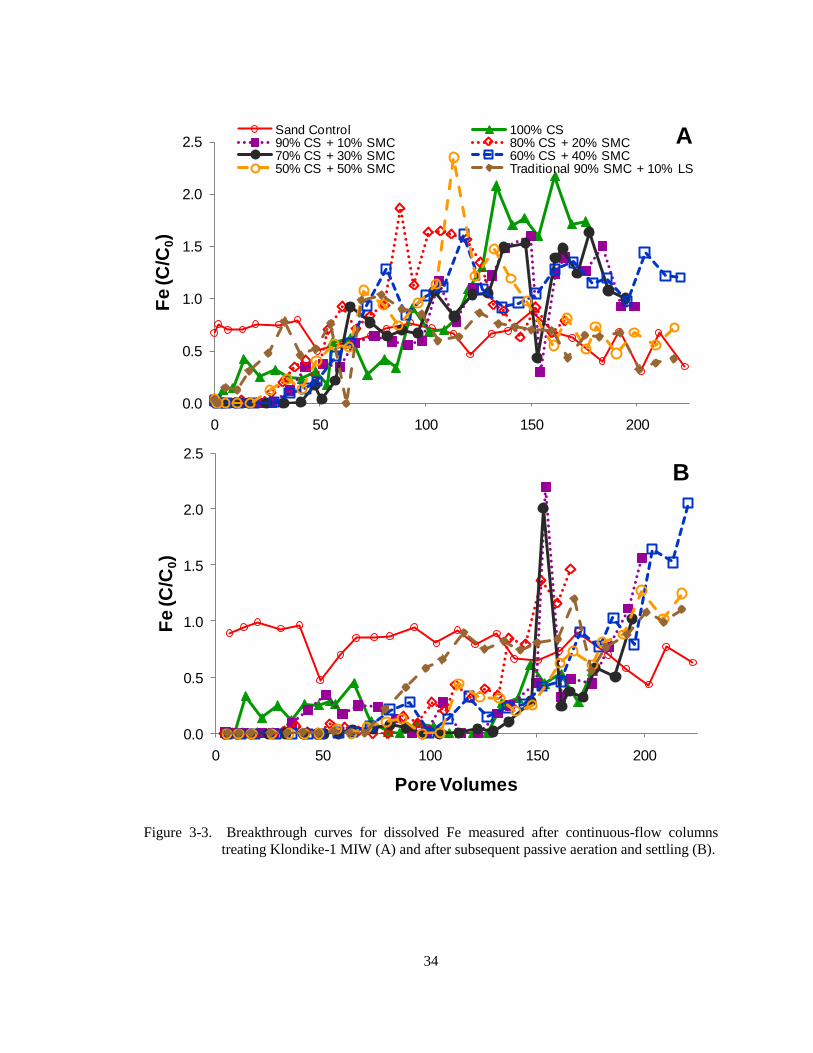
Figure 3-3. Breakthrough curves for dissolved Fe measured after continuous-flow
columns treating Klondike-1 MIW (A) and after subsequent passive aeration and
settling (B)........................................................................................................................ 34
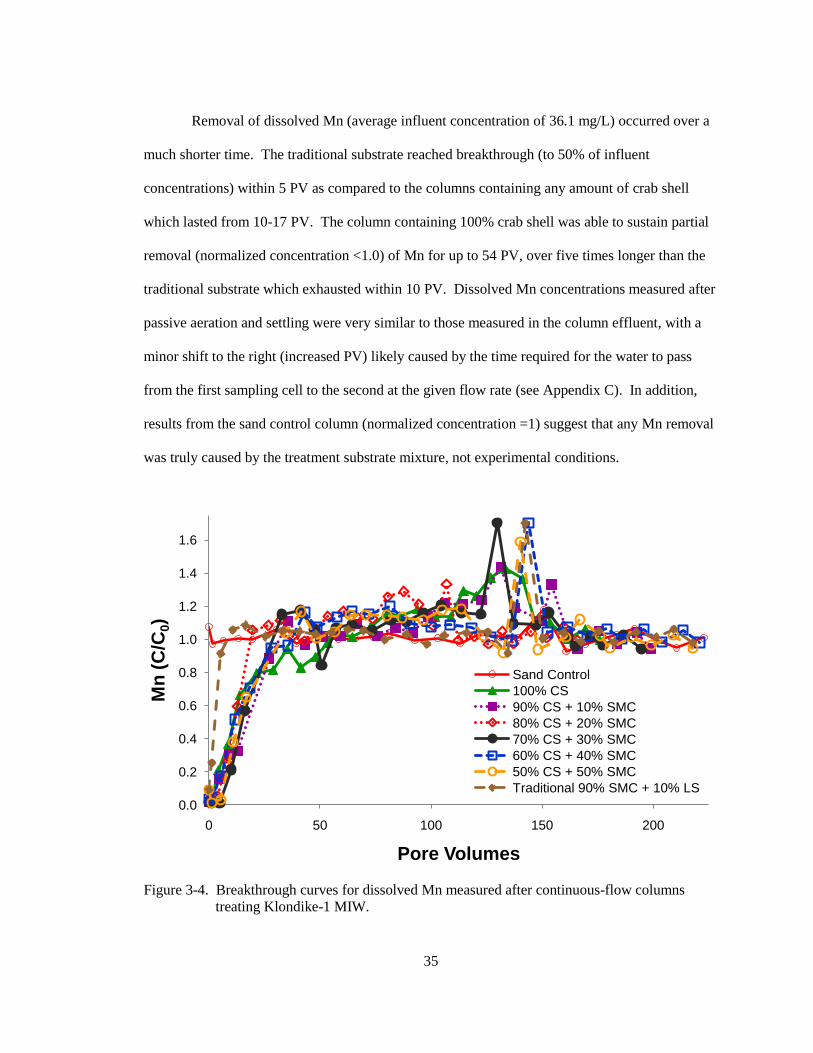
Figure 3-4. Breakthrough curves for dissolved Mn measured after continuous-flow
columns treating Klondike-1 MIW. ................................................................................. 35
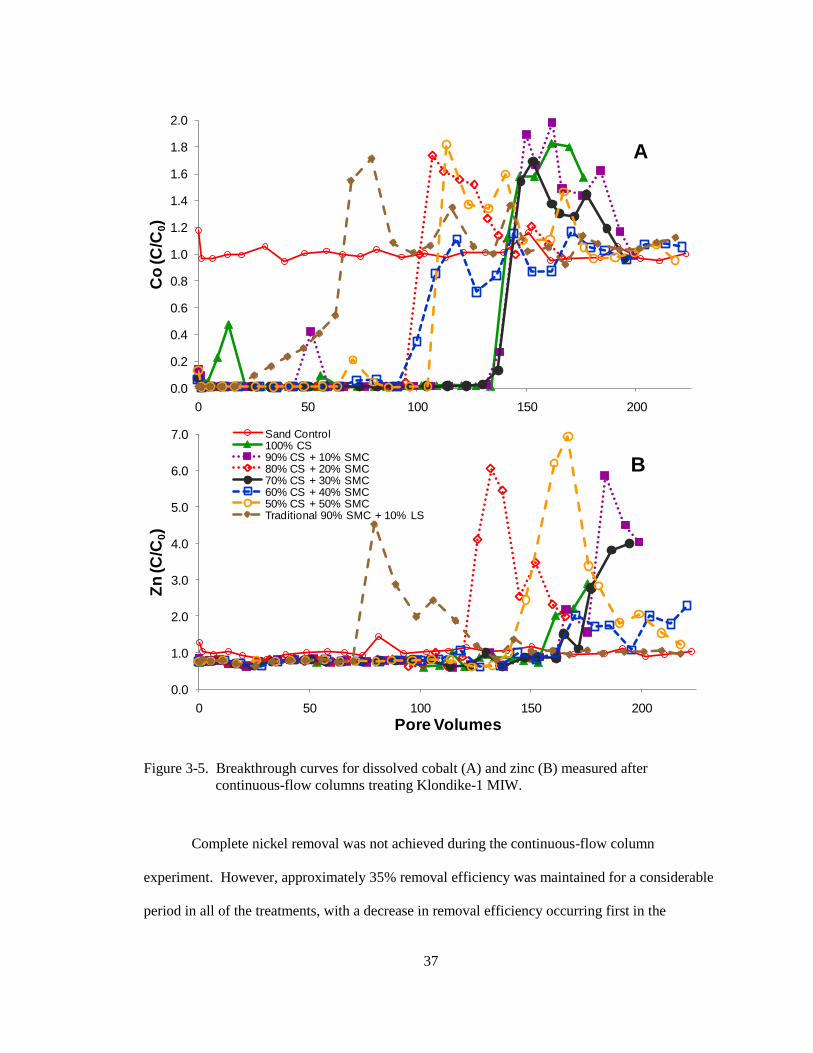
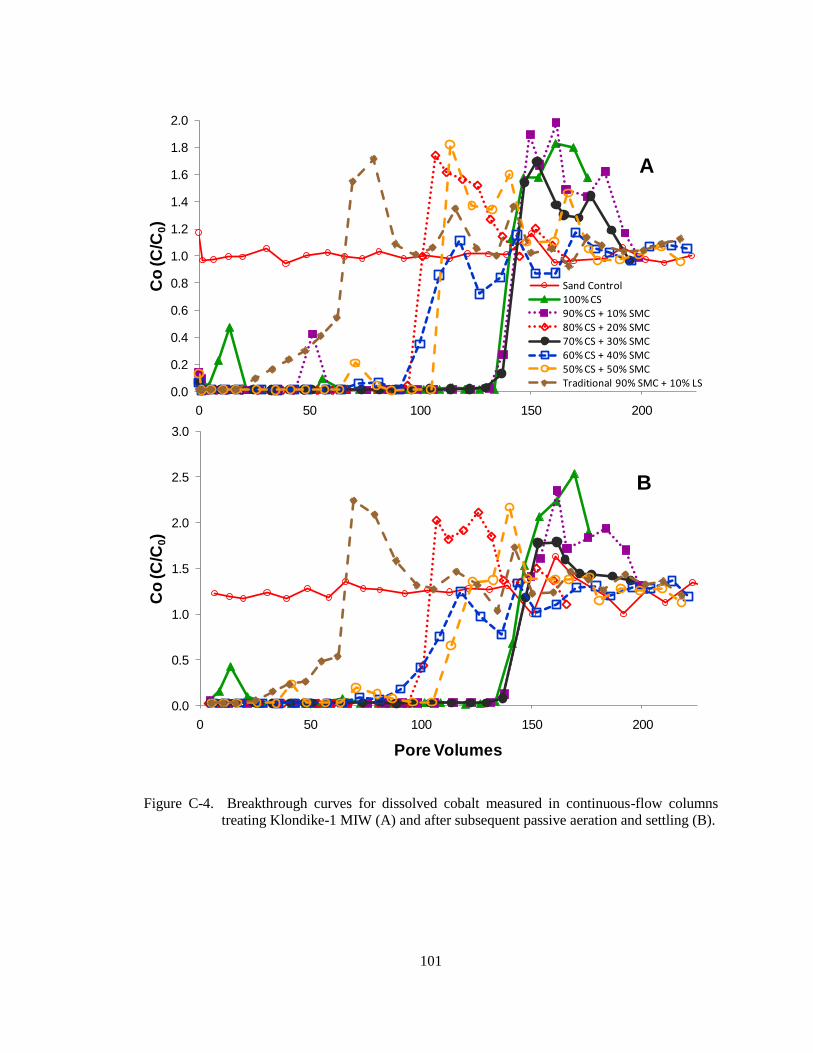
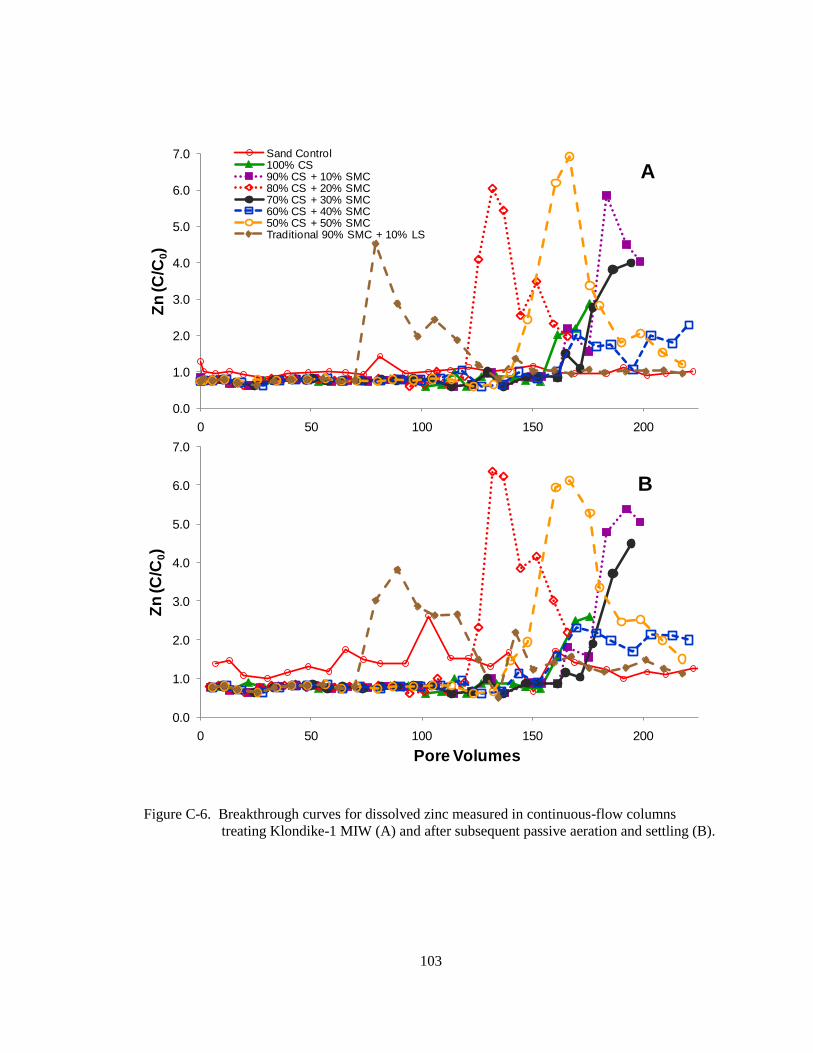
Figure 3-5. Breakthrough curves for dissolved cobalt (A) and zinc (B) measured after
continuous-flow columns treating Klondike-1 MIW. ...................................................... 37
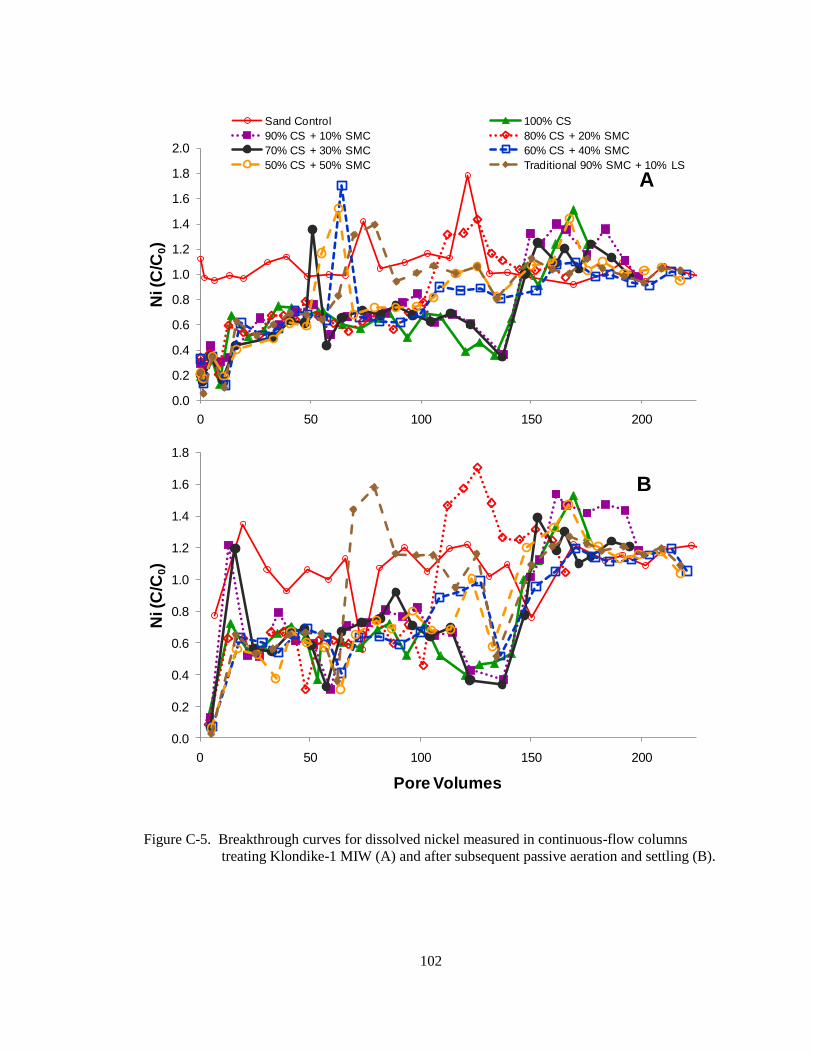
Figure 3-6. Breakthrough curves for dissolved nickel measured after continuous-flow
columns treating Klondike-1 MIW. ................................................................................. 38
Figure 3-7. Experimental columns photographed after 84 days of continuous-flow
conditions with Klondike-1 MIW. Note black precipitates which formed in all
except the sand control column. The remaining four treatment columns (not shown)
also displayed the formation of black precipitates. .......................................................... 39
Page 7
vi
Figure 3-8. Dissolved organic carbon measured in column effluent during continuous-
flow column test treating MIW from the Klondike-1 site. Inset graph shows
maximum values achieved at beginning of experiment. .................................................. 41
Figure 3-9. Ammonium measured from column effluent during continuous-flow column
test treating MIW from the Klondike-1 site. .................................................................... 42
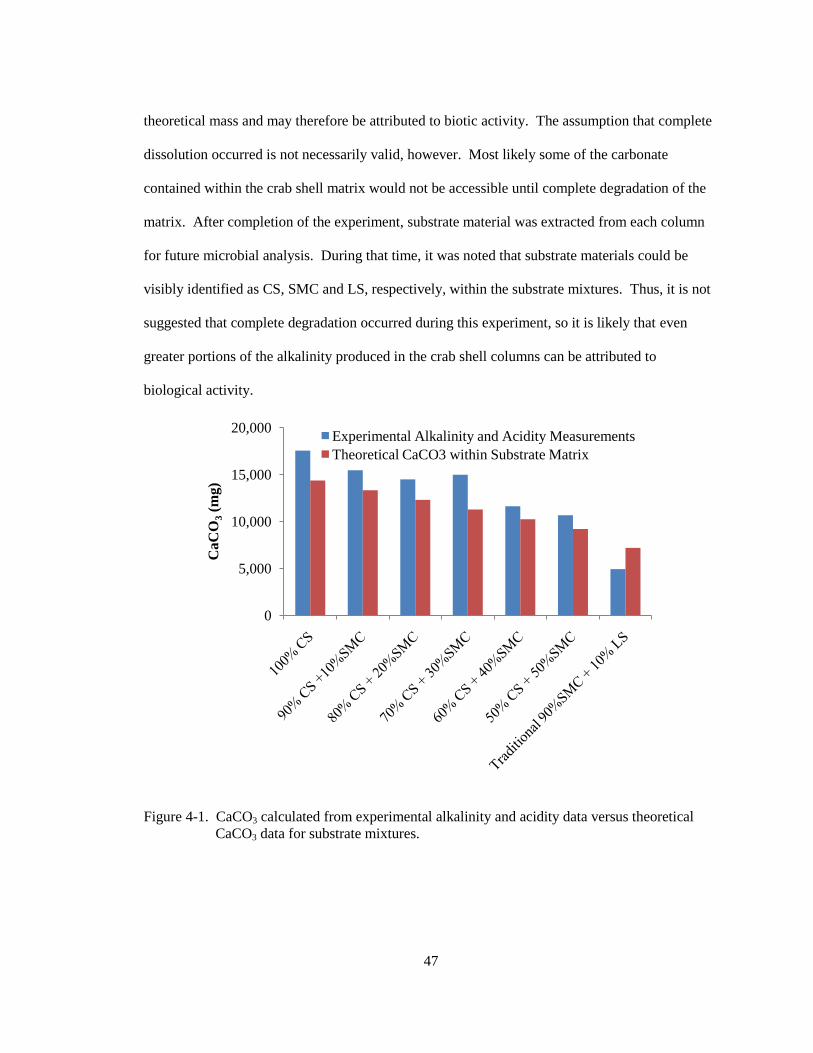
Figure 4-1. CaCO3 calculated from experimental alkalinity and acidity data versus
theoretical CaCO3 data for substrate mixtures. ................................................................ 47
Figure 4-2. Percent of total trace metal loading retained (after breakthrough) within
treatment columns at completion of continuous-flow column experiment treating
Klondike-1 MIW. ............................................................................................................. 56
Figure 4-3. Substrate exhaustion with respect to DOC and alkalinity generation. +
symbol above column indicates the value presented is the PV when the experiment
ended, thus the potential exists for additional DOC generation until complete
substrate exhaustion. ........................................................................................................ 60
Figure 4-4. Total C remaining in each treatment column at completion of continuous-
flow column experiment. ................................................................................................. 61
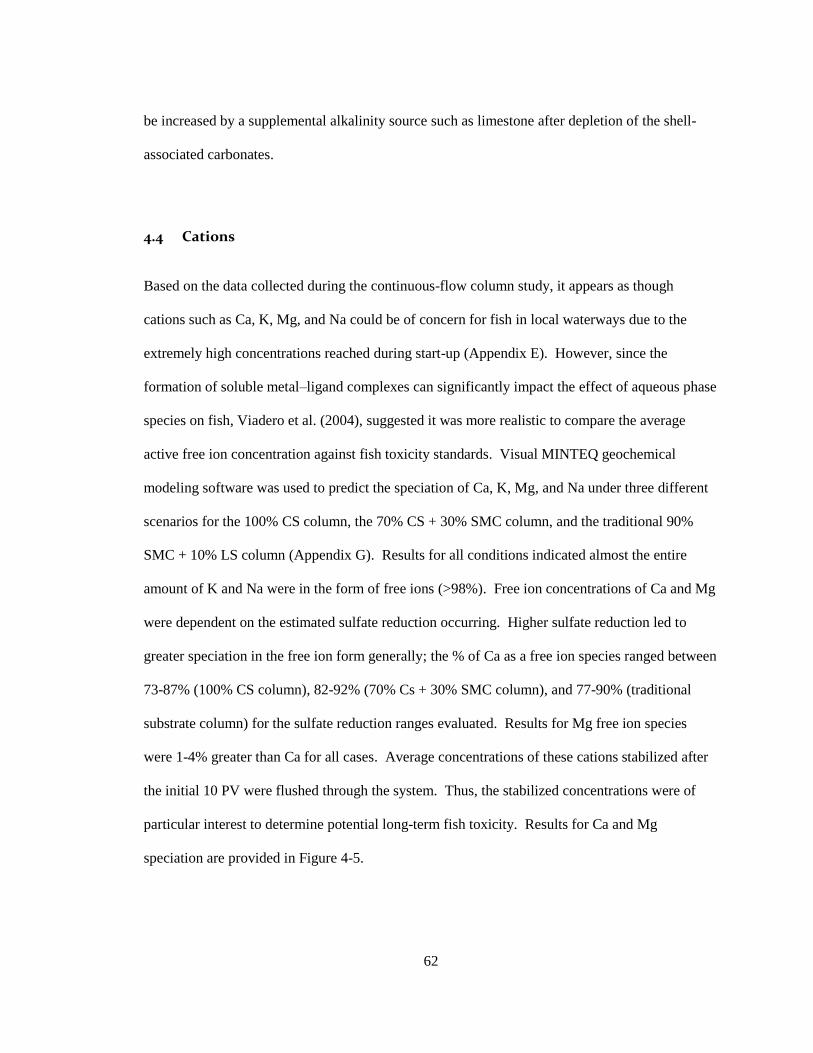
Figure 4-5. Speciation of relevant cations in the 100% crab shell column after 10 PV
based on geochemical modeling with Visual MINTEQ and an assumed 250 mg/L
sulfate reduction. Results for the 70% CS + 30% SMC column were identical for
this time point and those for the traditional 90% SMC + 10% LS column varied by
no more than 1%. ............................................................................................................. 63
Figure 5-1. Schematic of pilot-scale VFPs installed at Klondike-1 field site. ........................ 69
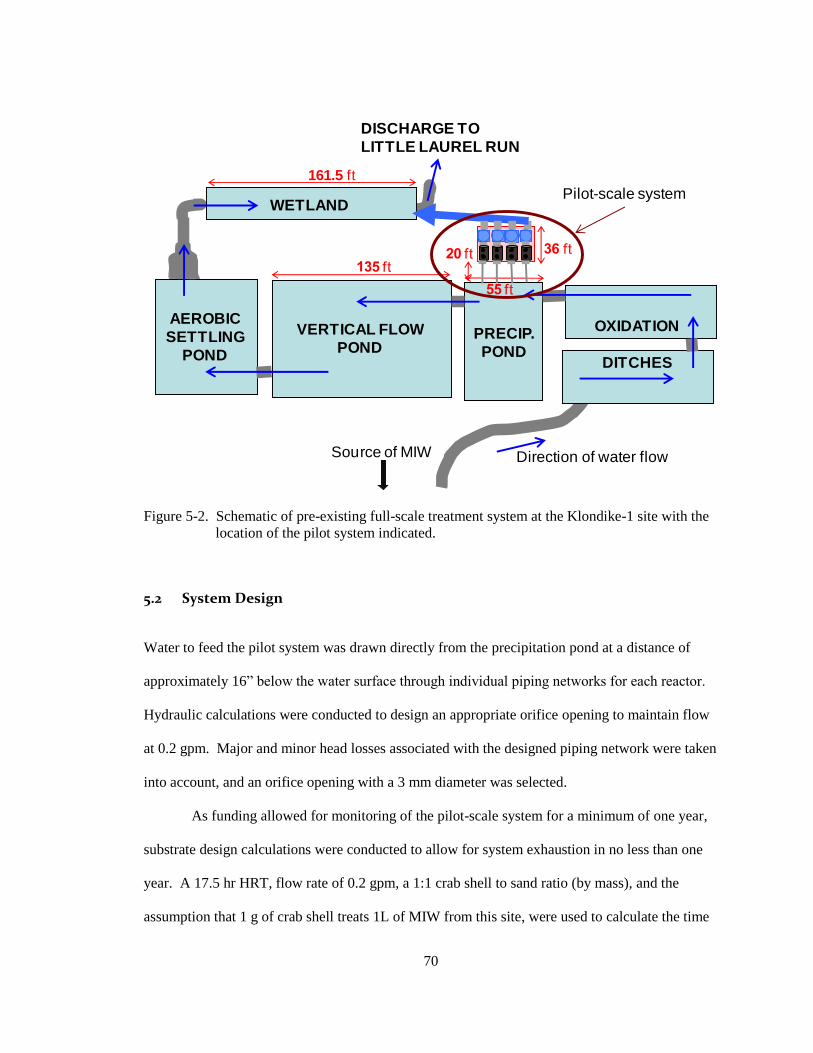
Figure 5-2. Schematic of pre-existing full-scale treatment system at the Klondike-1 site
with the location of the pilot system indicated. ................................................................ 70
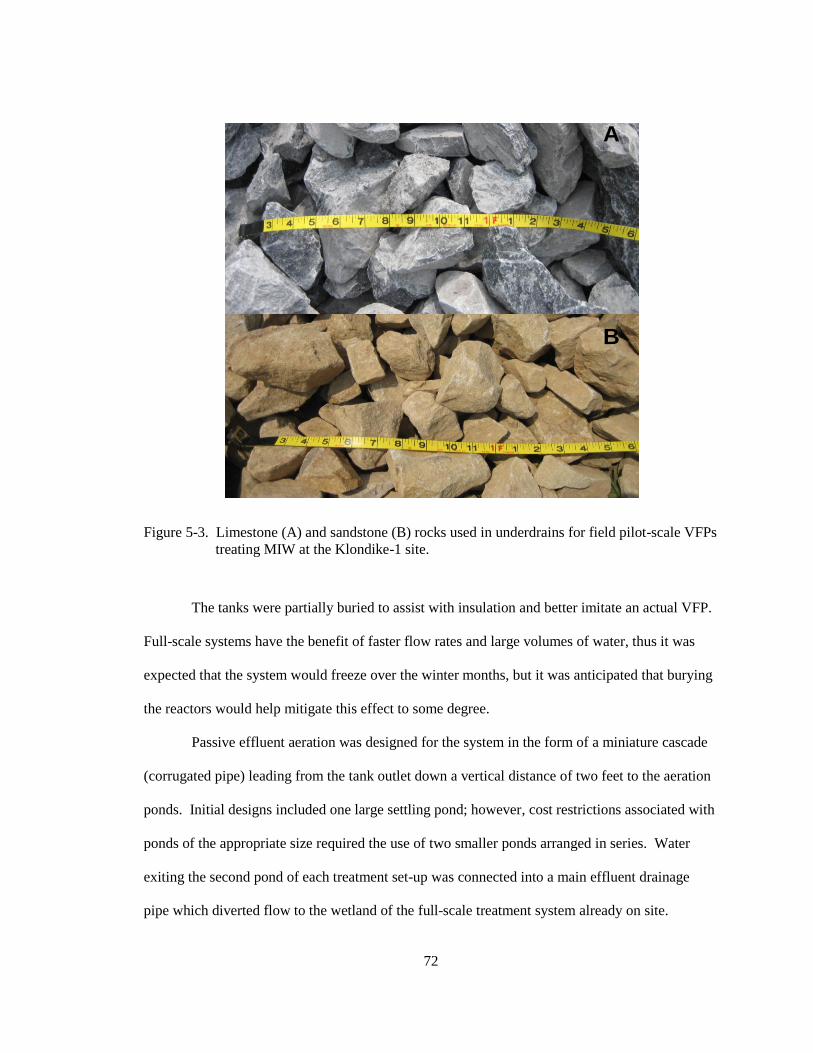
Figure 5-3. Limestone (A) and sandstone (B) rocks used in underdrains for field pilot-
scale VFPs treating MIW at the Klondike-1 site.............................................................. 72
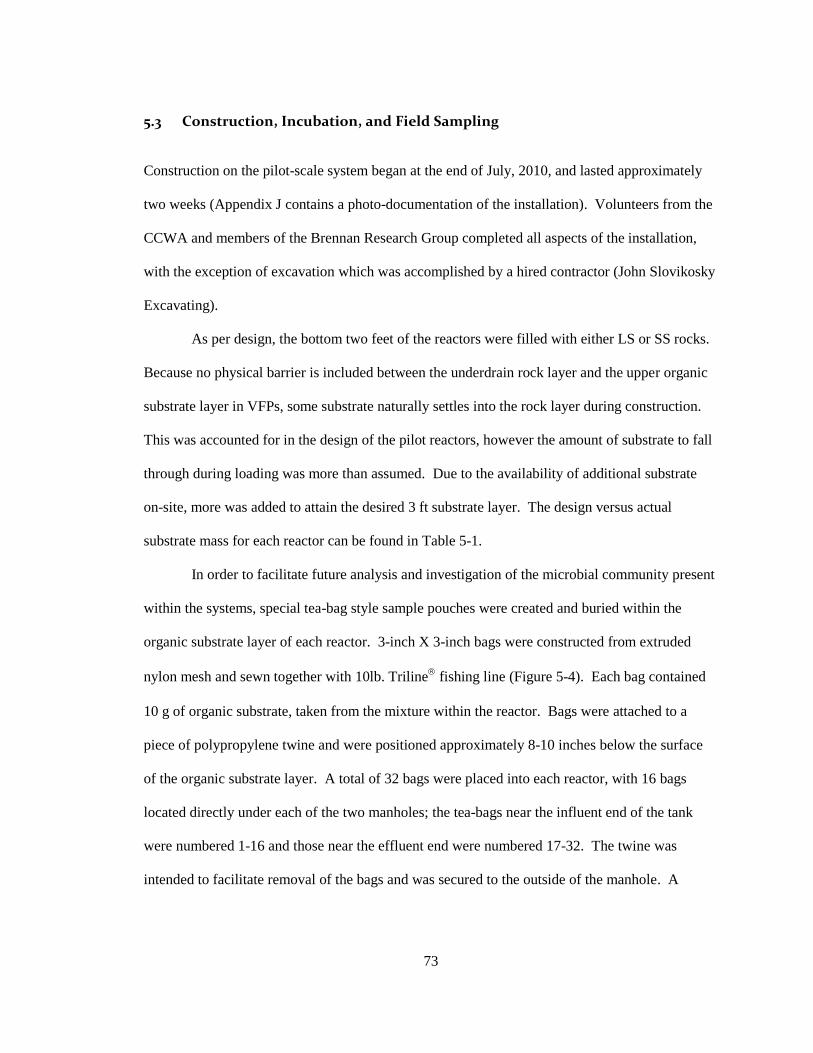
Figure 5-4. Photo of microbial tea-bag style sample pouches filled with organic substrate
and buried within each pilot-scale reactor at the Klondike-1 site. ................................... 74
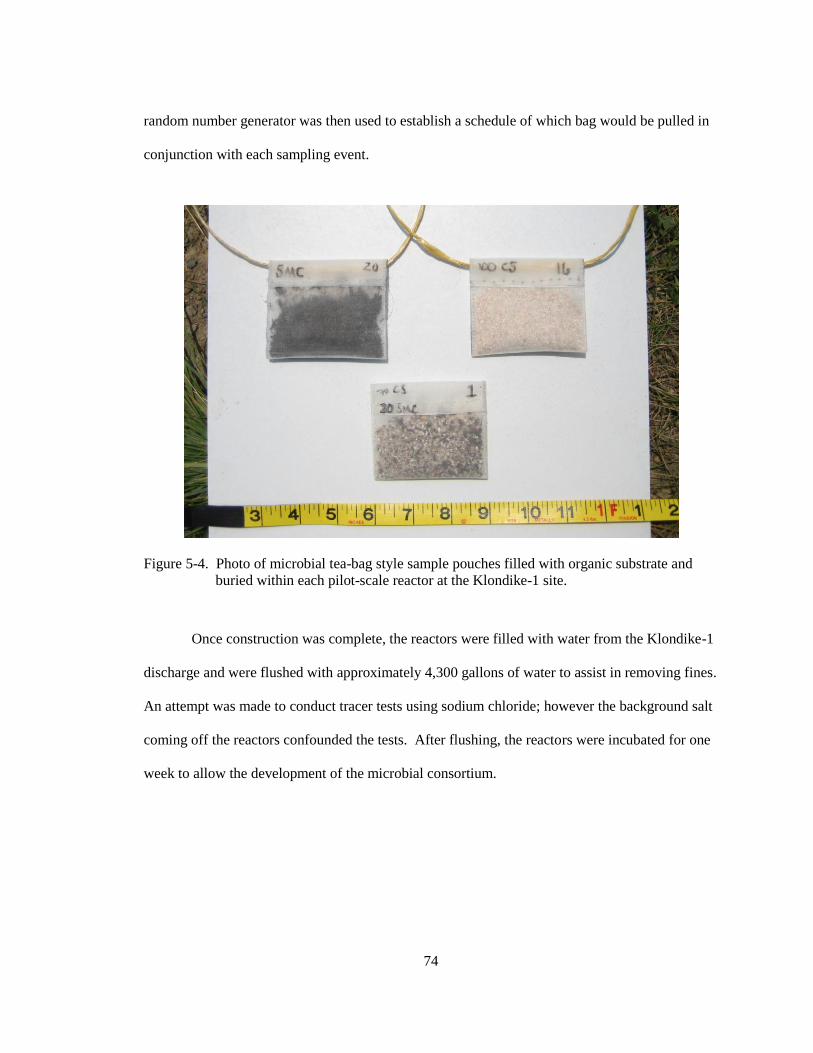
Figure 5-5. Pilot-scale VFPs and subsequent aerobic settling ponds installed to treat
MIW at the Klondike-1 field site. .................................................................................... 75
Figure 5-6. pH values of MIW influent and pilot-scale reactor effluent from initial 90
days of monitoring. .......................................................................................................... 77
Figure 5-7. Alkalinity generated from pilot-scale reactors during initial 90 days of the
field test. ........................................................................................................................... 77
Page 8
vii
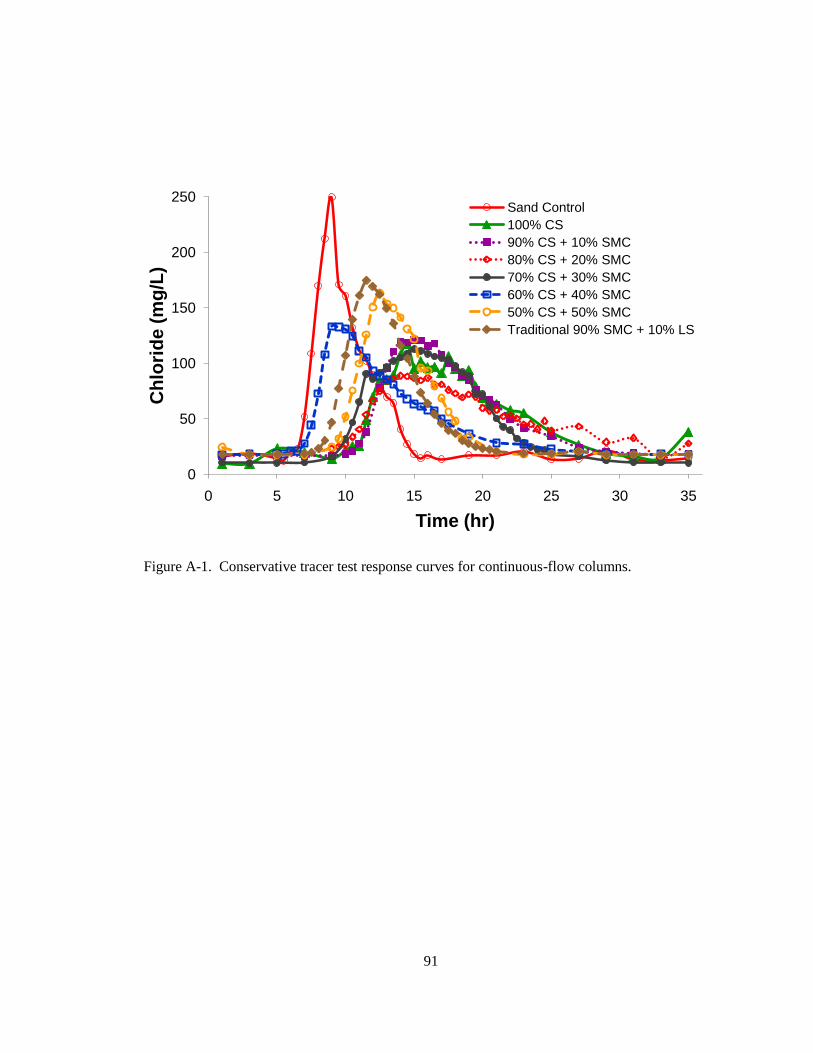
Figure A-1. Conservative tracer test response curves for continuous-flow columns.............. 91
Figure B-1. Comparison of pH readings taken during continuous-flow column test from
bench top electrode and electrodes mounted in flow-through cells. Symbols
connected by a line indicate bench top electrode readings; unconnected symbols
indicate in-line electrode readings. .................................................................................. 94
Figure B-2. Comparison of pH readings taken during continuous-flow columns test from
bench top electrode and electrodes mounted in flow-through cells. Symbols
connected by a line indicate bench top electrode readings; unconnected symbols
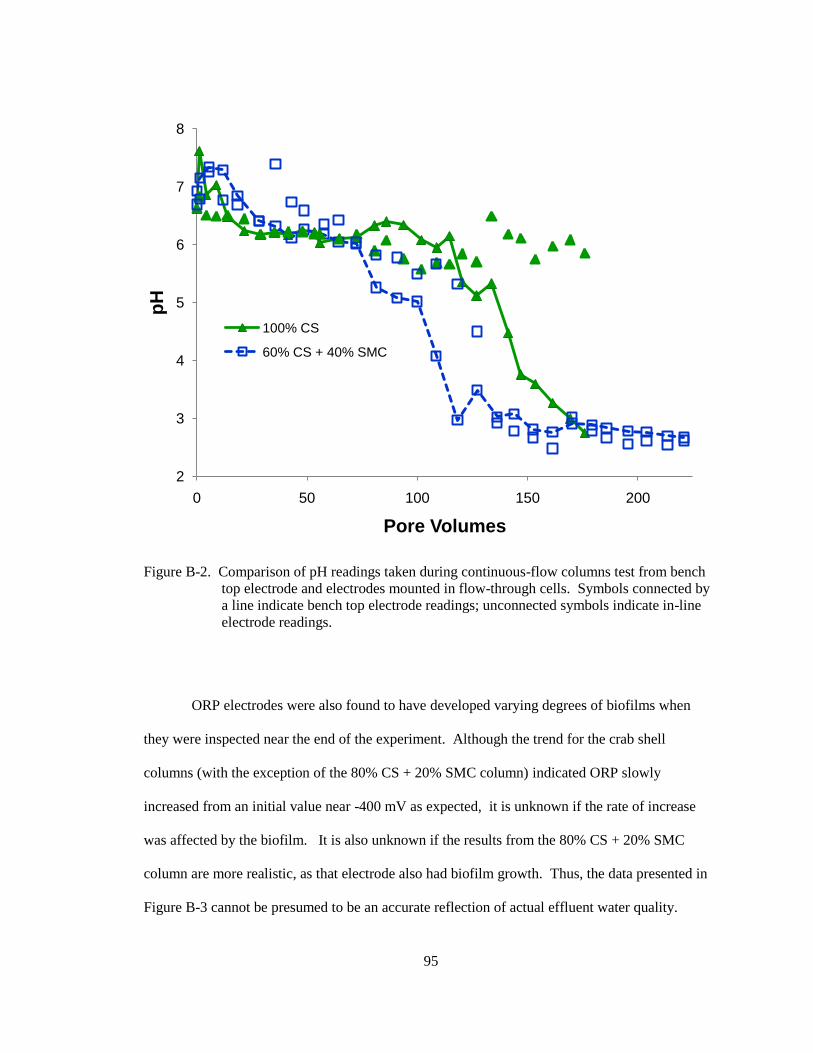
indicate in-line electrode readings. .................................................................................. 95
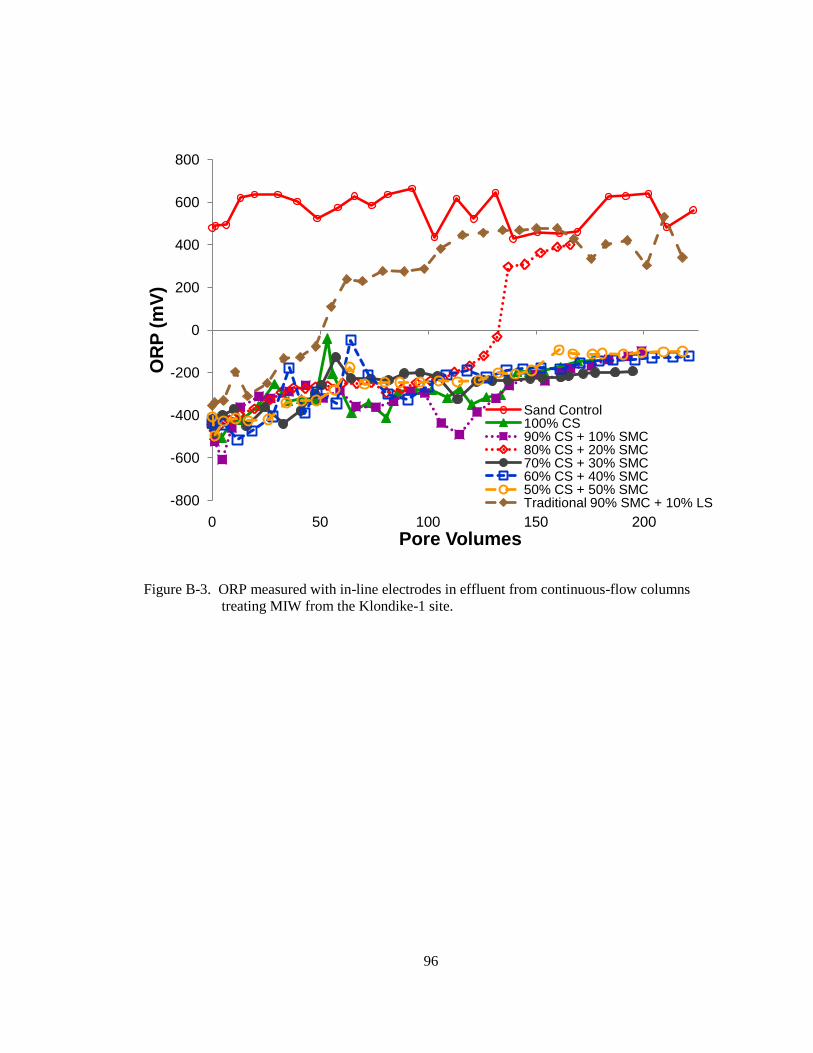
Figure B-3. ORP measured with in-line electrodes in effluent from continuous-flow
columns treating MIW from the Klondike-1 site. ............................................................ 96
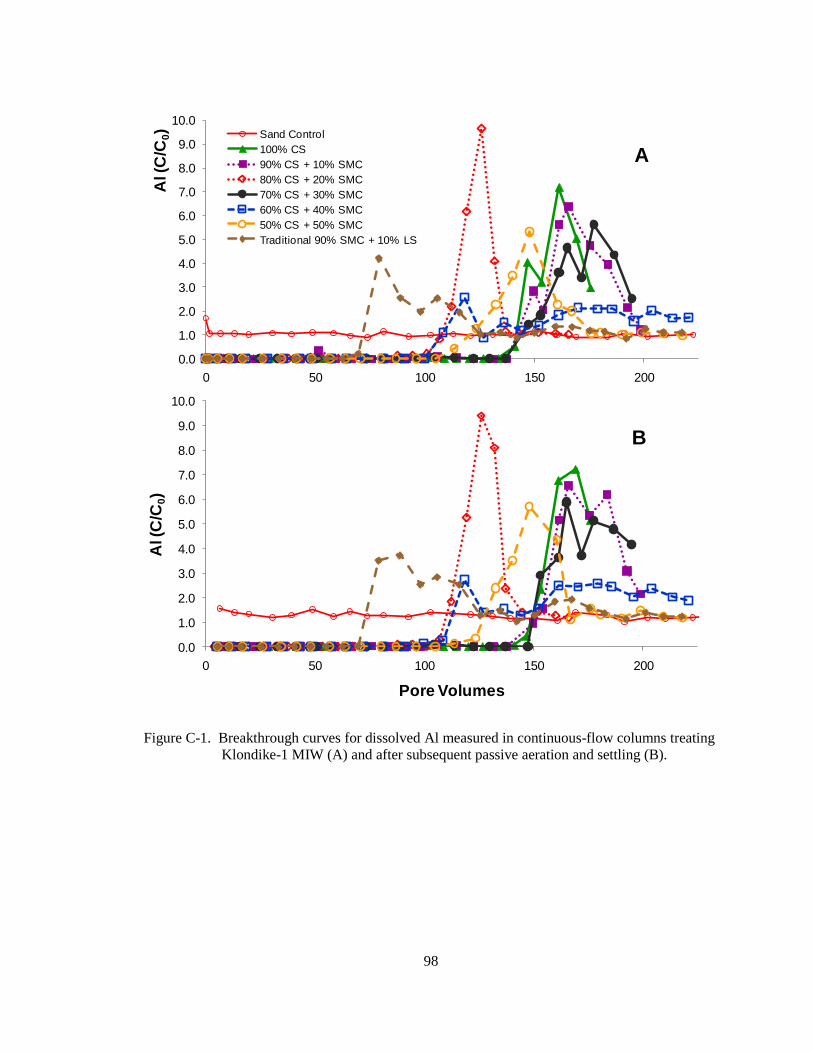
Figure C-1. Breakthrough curves for dissolved Al measured in continuous-flow columns
treating Klondike-1 MIW (A) and after subsequent passive aeration and settling (B). ... 98
Figure C-2. Breakthrough curves for dissolved Fe measured in continuous-flow columns
treating Klondike-1 MIW (A) and after subsequent passive aeration and settling (B). ... 99
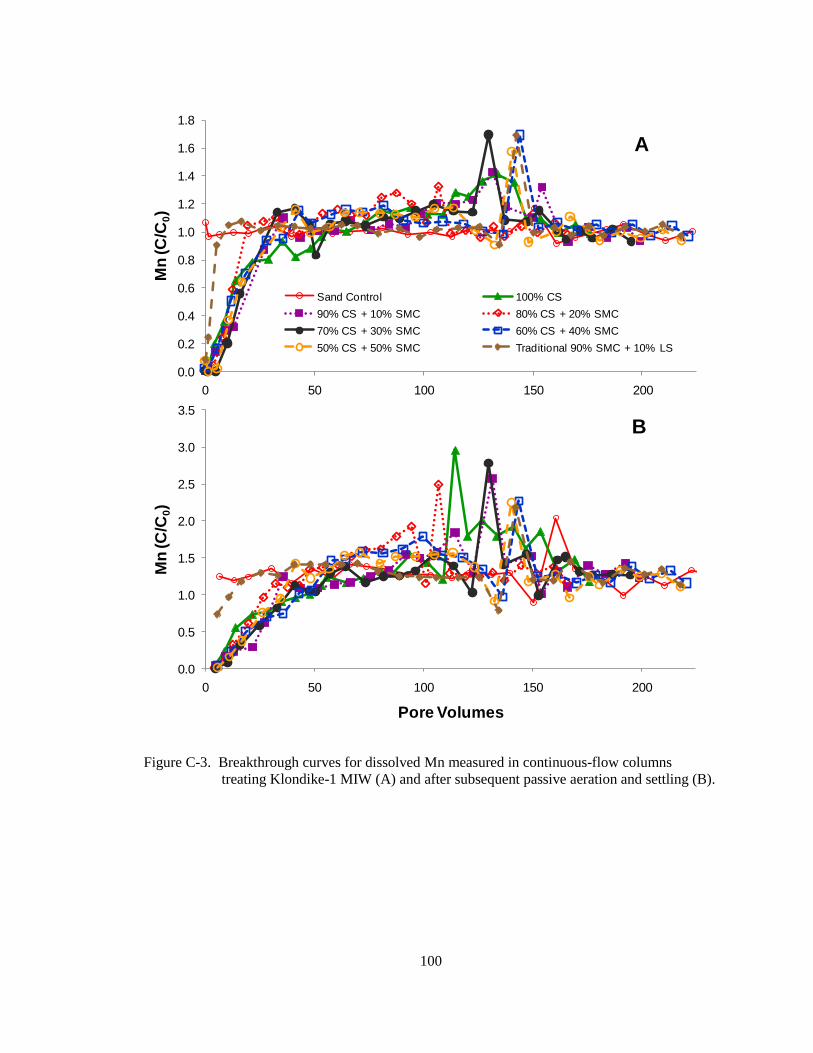
Figure C-3. Breakthrough curves for dissolved Mn measured in continuous-flow
columns treating Klondike-1 MIW (A) and after subsequent passive aeration and
settling (B)........................................................................................................................ 100
Figure C-4. Breakthrough curves for dissolved cobalt measured in continuous-flow
columns treating Klondike-1 MIW (A) and after subsequent passive aeration and
settling (B)........................................................................................................................ 101
Figure C-5. Breakthrough curves for dissolved nickel measured in continuous-flow
columns treating Klondike-1 MIW (A) and after subsequent passive aeration and
settling (B)........................................................................................................................ 102
Figure C-6. Breakthrough curves for dissolved zinc measured in continuous-flow
columns treating Klondike-1 MIW (A) and after subsequent passive aeration and
settling (B)........................................................................................................................ 103
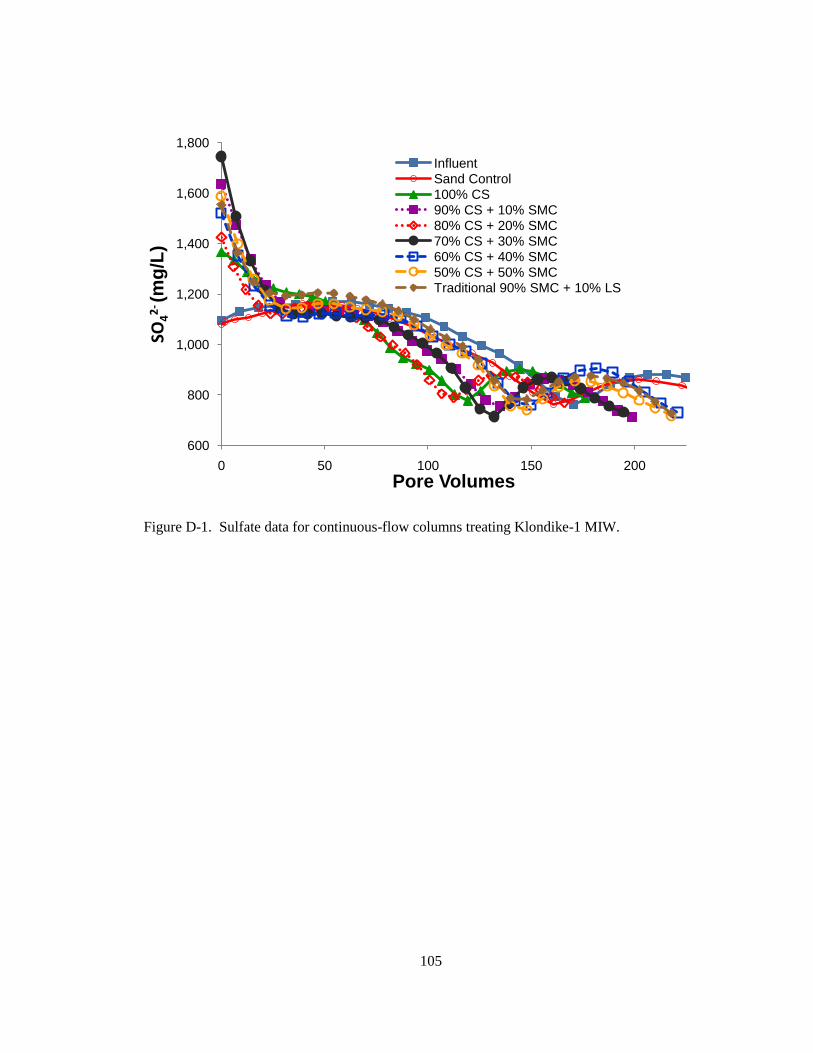
Figure D-1. Sulfate data for continuous-flow columns treating Klondike-1 MIW. ................ 105
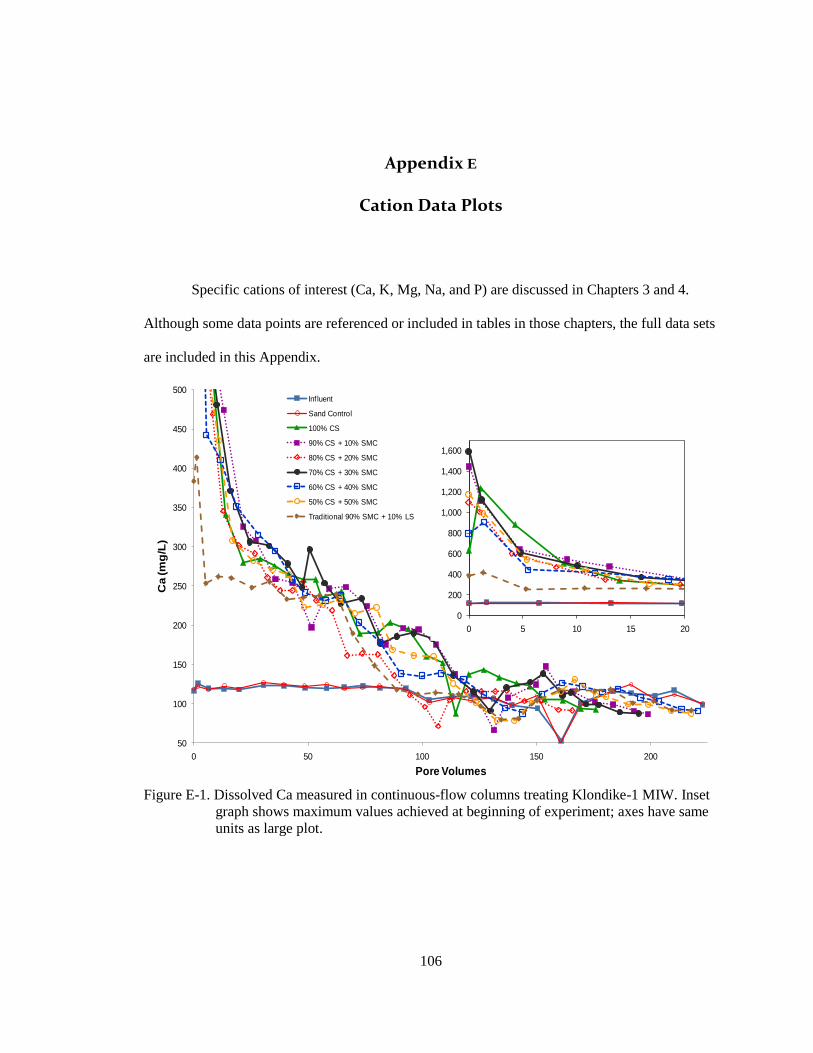
Figure E-1. Dissolved Ca measured in continuous-flow columns treating Klondike-1
MIW. Inset graph shows maximum values achieved at beginning of experiment;
axes have same units as large plot. ................................................................................... 106
Figure E-2. Dissolved K measured in continuous-flow columns treating Klondike-1
MIW. Inset graph shows maximum values achieved at beginning of experiment;
axes have same units as large plot. ................................................................................... 107
Page 9
viii
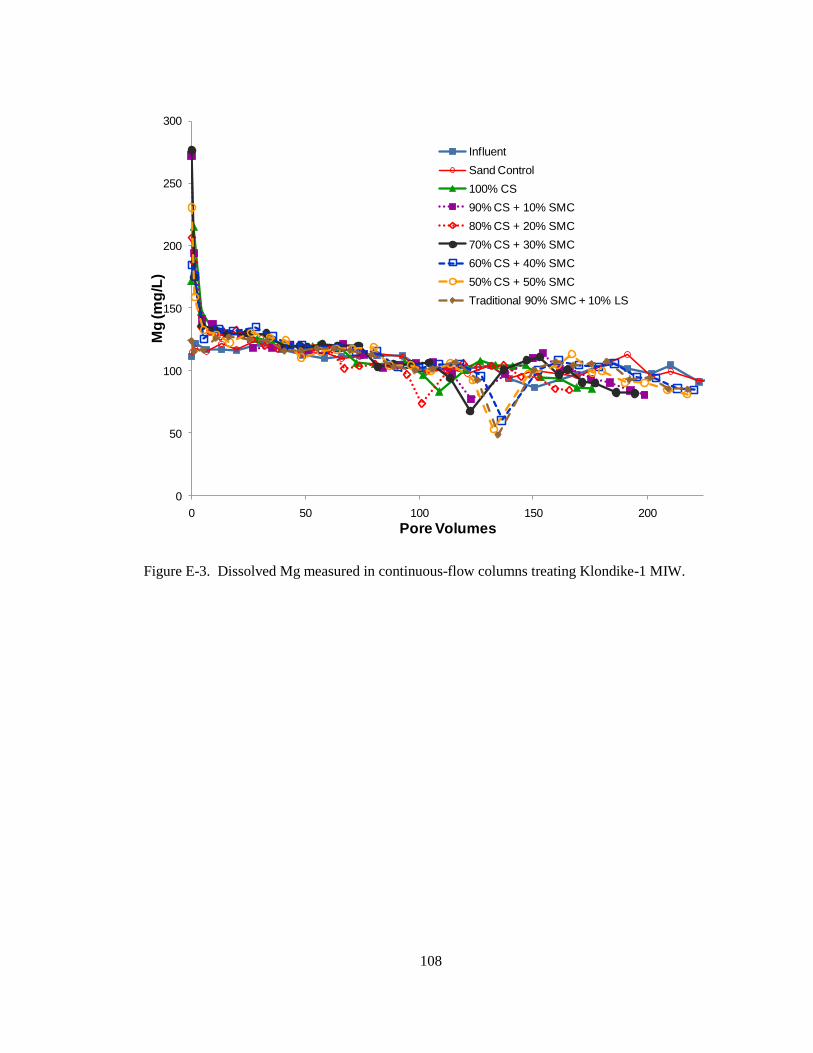
Figure E-3. Dissolved Mg measured in continuous-flow columns treating Klondike-1
MIW. ................................................................................................................................ 108
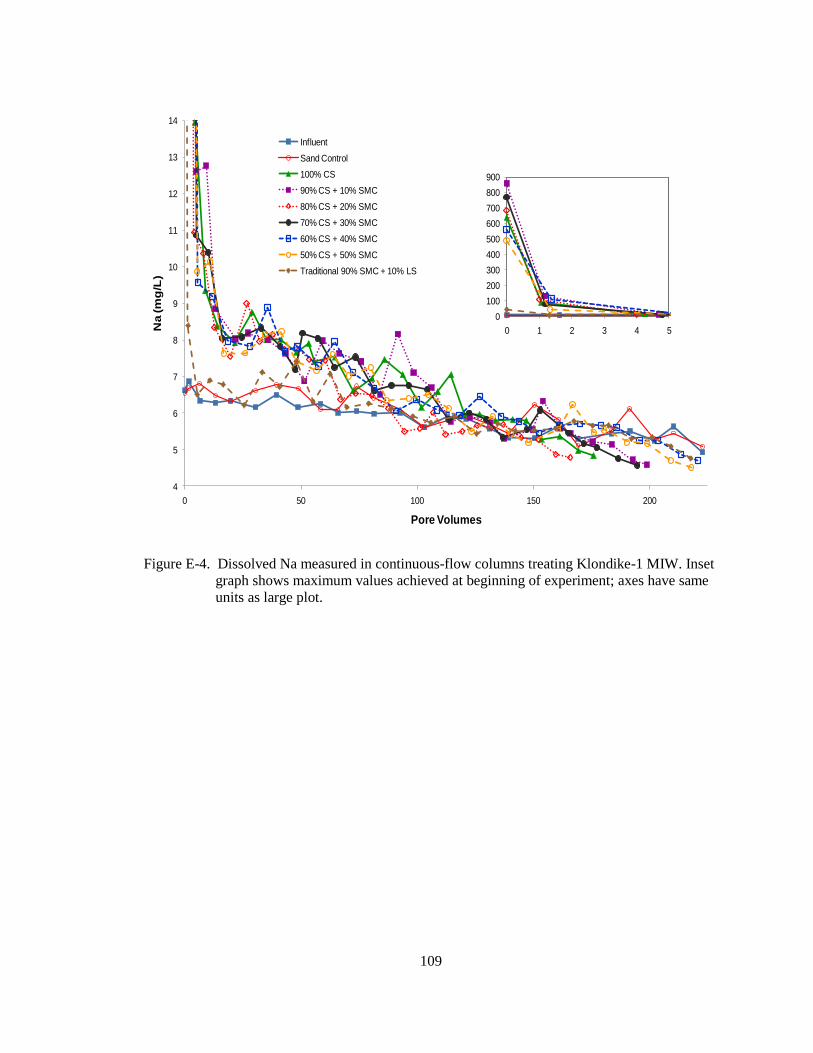
Figure E-4. Dissolved Na measured in continuous-flow columns treating Klondike-1
MIW. Inset graph shows maximum values achieved at beginning of experiment;
axes have same units as large plot. ................................................................................... 109
Figure E-5. Dissolved PO43—
P measured in continuous-flow columns treating Klondike-
1 MIW. ............................................................................................................................. 110
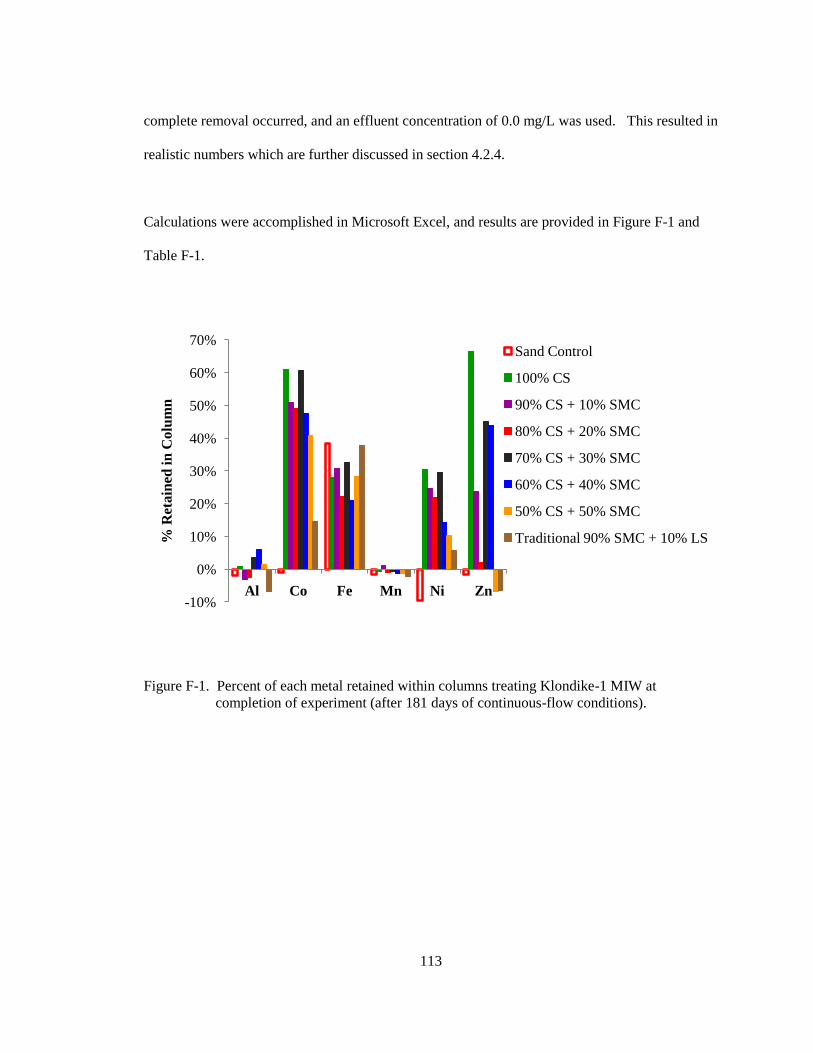
Figure F-1. Percent of each metal retained within columns treating Klondike-1 MIW at
completion of experiment (after 181 days of continuous-flow conditions). .................... 113
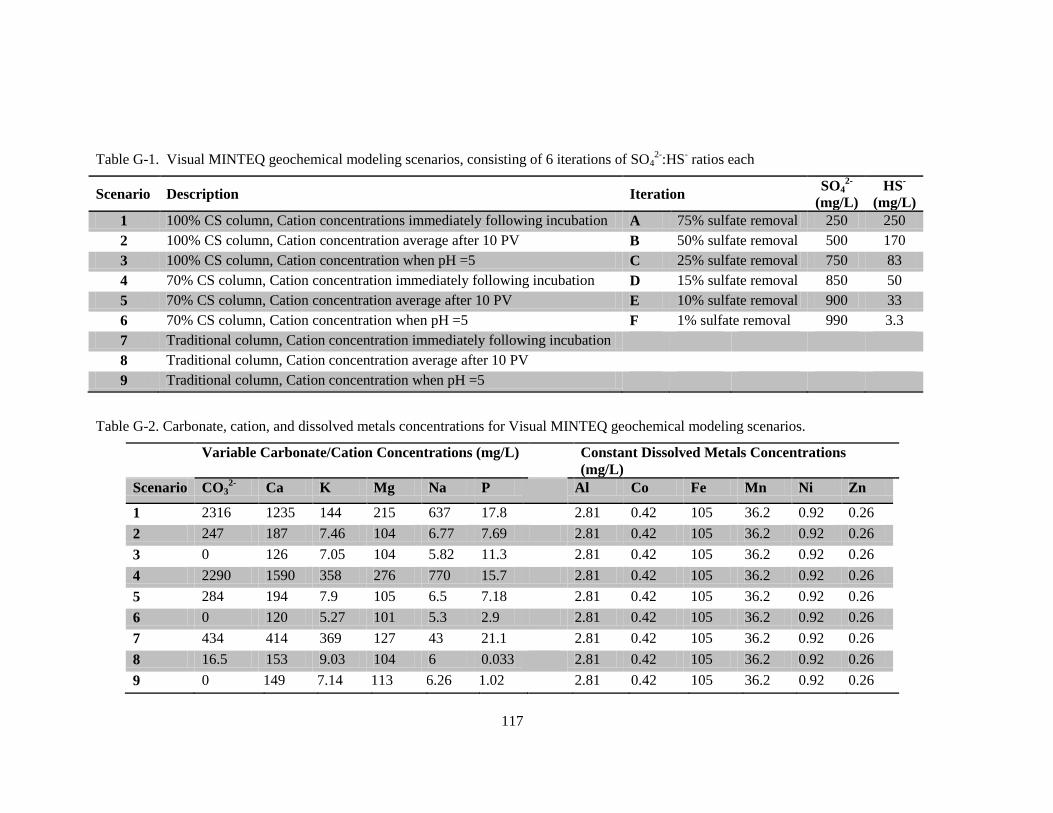
Figure G-1. Scenarios 1 (initial values after incubation), 2 (average after 10 PV), and 3
(pH=5) using the SO42-
:HS- ratio from iteration A. Results reveal no considerable
difference in solubility of metal species related to variations in cation and carbonate
loadings in the 100% CS column within the pH range encountered during the
continuous-flow columns experiment (pH 2.5-7.5). In fact, iteration A for all 9
scenarios produced similar results, indicating the SO42-
:HS- ratio dominates
solubility of metals within each of the systems under the given circumstances. ............. 118
Figure G-2. Effect on solubility/saturation of total dissolved Fe as SO42-
:HS- ratios are
increased (increased SO42-
:HS- ratio indicates limited or no sulfate reduction is
occurring). ........................................................................................................................ 119
Figure H-1. Correlation between amount of crab shell within treatment system and
amount of original organic carbon remaining within system at completion of
continuous-flow experiment treating Klondike-1 MIW. .................................................. 122
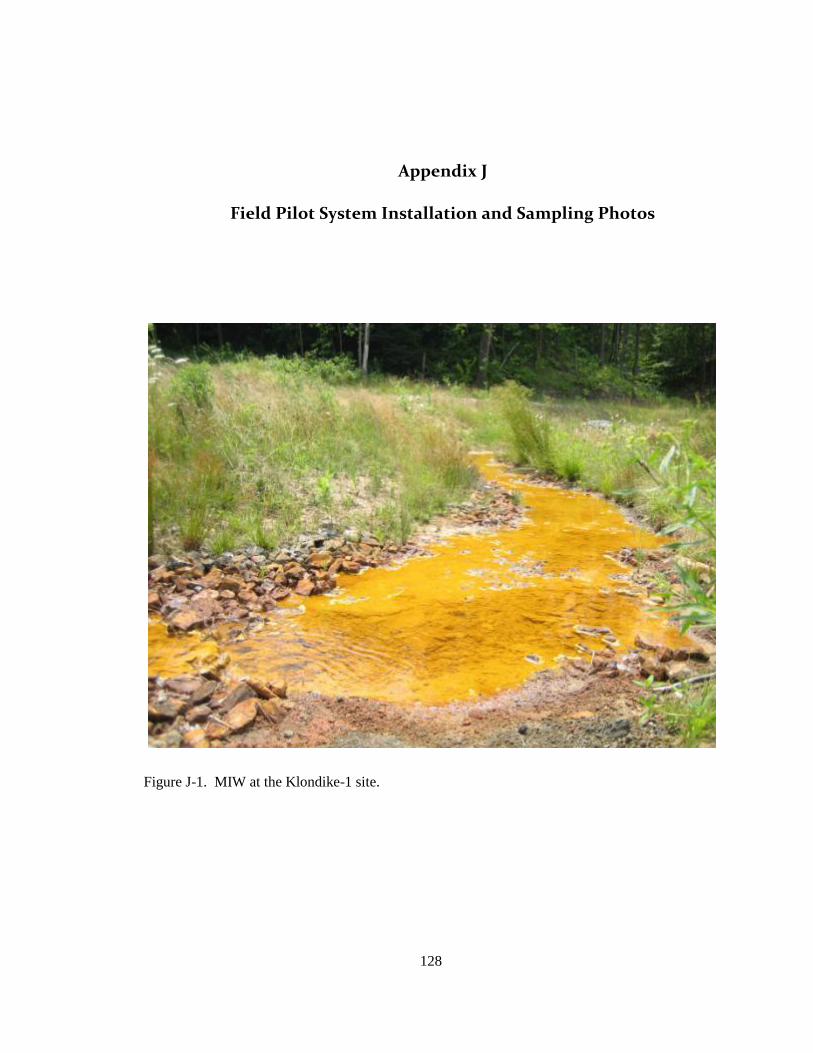
Figure J-1. MIW at the Klondike-1 site. ................................................................................. 128
Figure J-2. Tank piping modifications and installation of underdrain piping network, July
26, 2010. ........................................................................................................................... 129
Figure J-3. Placement of septic tanks used to simulate pilot-scale VFPs to treat MIW at
the Klondike-1 site. .......................................................................................................... 129
Figure J-4. Placement of rock underdrains into tanks, done manually to avoid damage to
underdrain piping system! ................................................................................................ 130
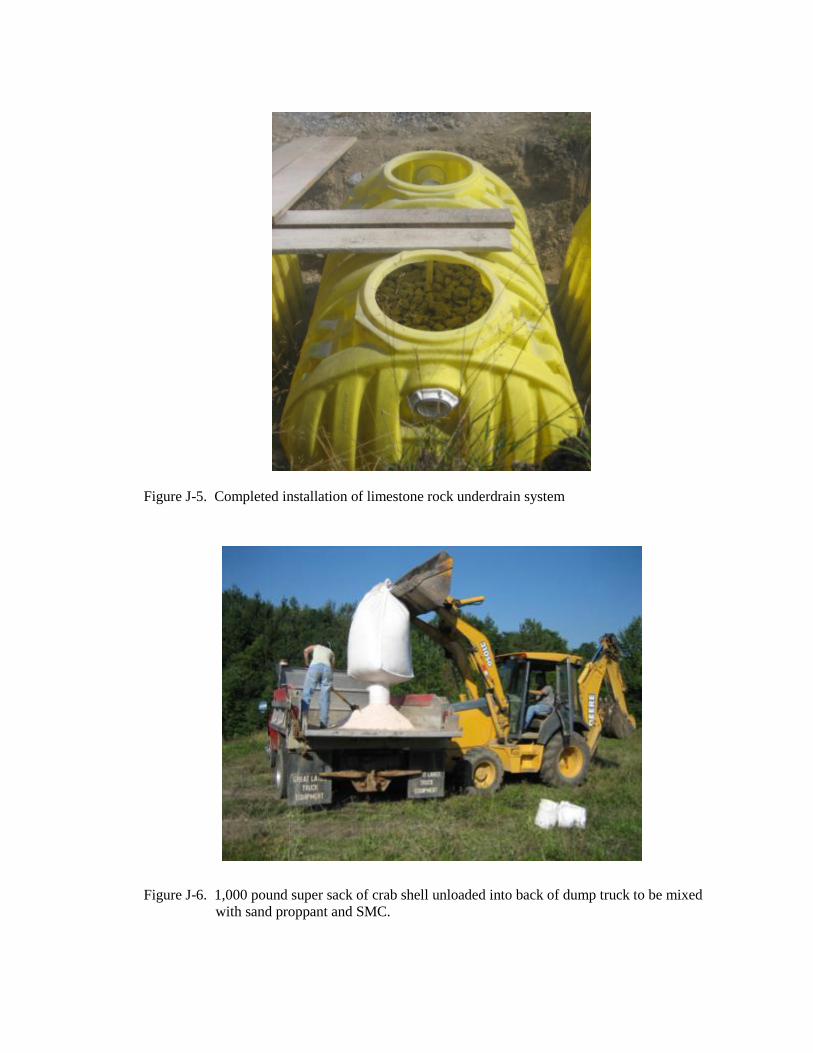
Figure J-5. Completed installation of limestone rock underdrain system ............................... 131
Figure J-6. 1,000 pound super sack of crab shell unloaded into back of dump truck to be
mixed with sand proppant and SMC. ............................................................................... 131
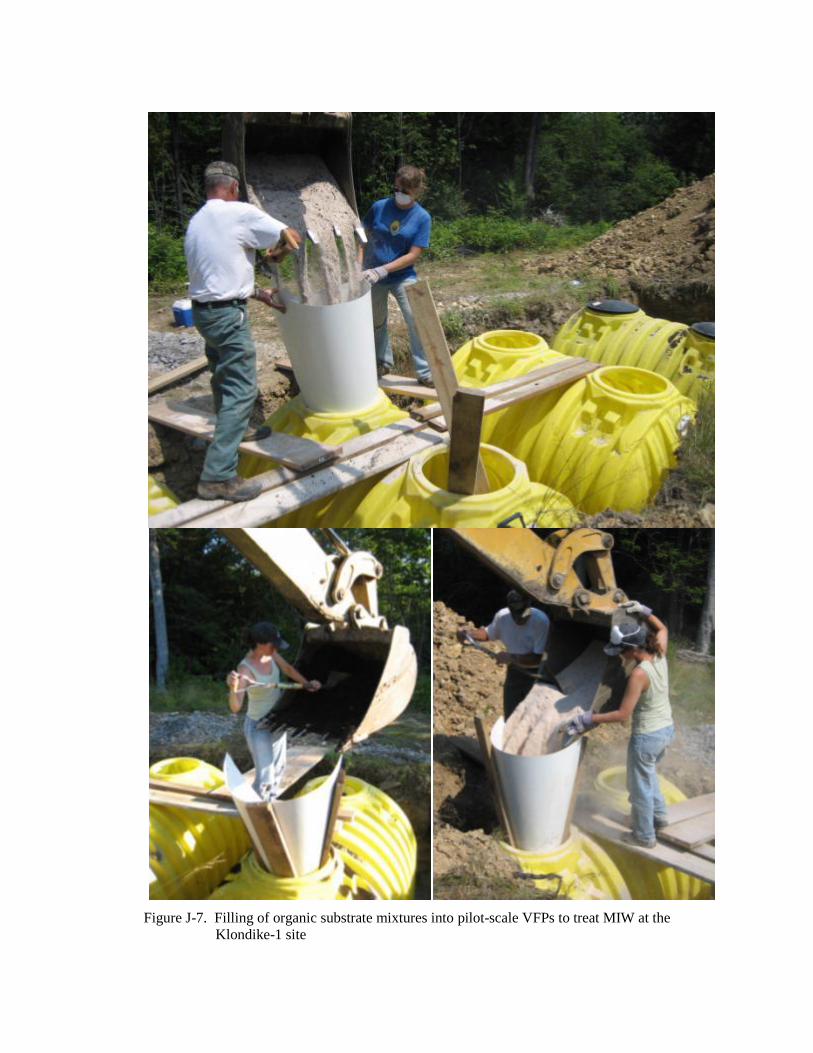
Figure J-7. Filling of organic substrate mixtures into pilot-scale VFPs to treat MIW at the
Klondike-1 site ................................................................................................................. 132
Page 10
ix
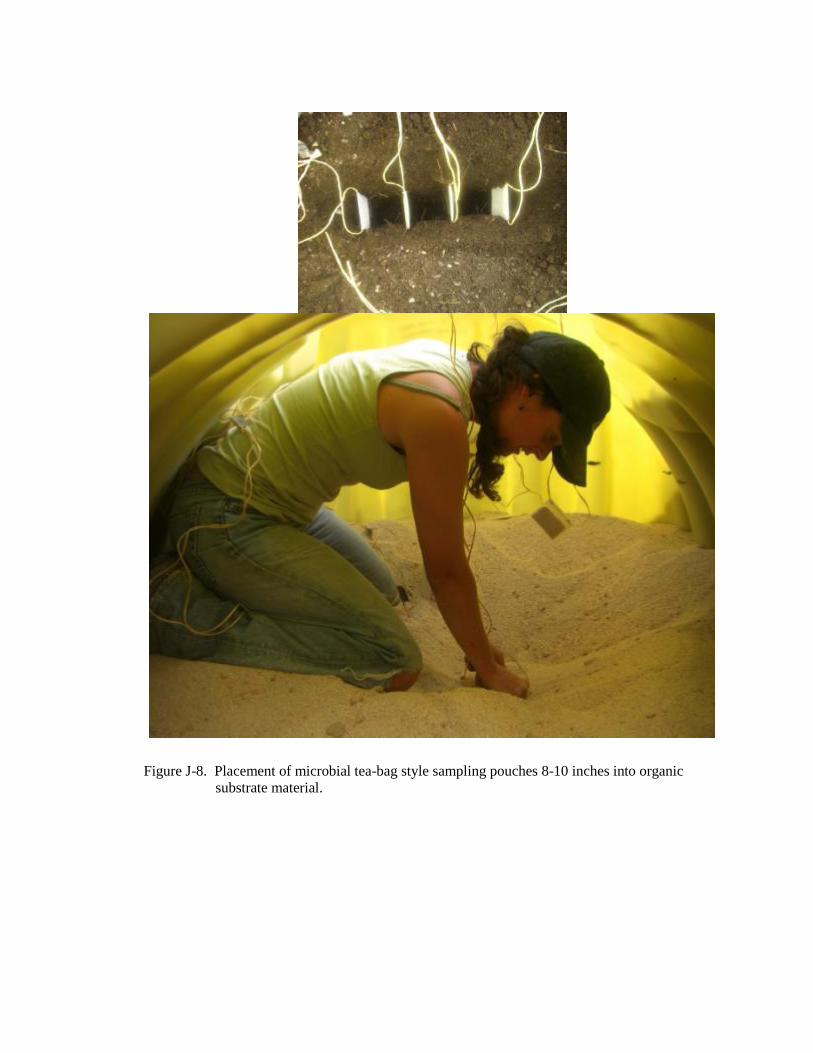
Figure J-8. Placement of microbial tea-bag style sampling pouches 8-10 inches into
organic substrate material. ............................................................................................... 133
Figure J-9. A layer of pea gravel was added to the top of each reactor to prevent
loss/disturbance of organic substrate. .............................................................................. 134
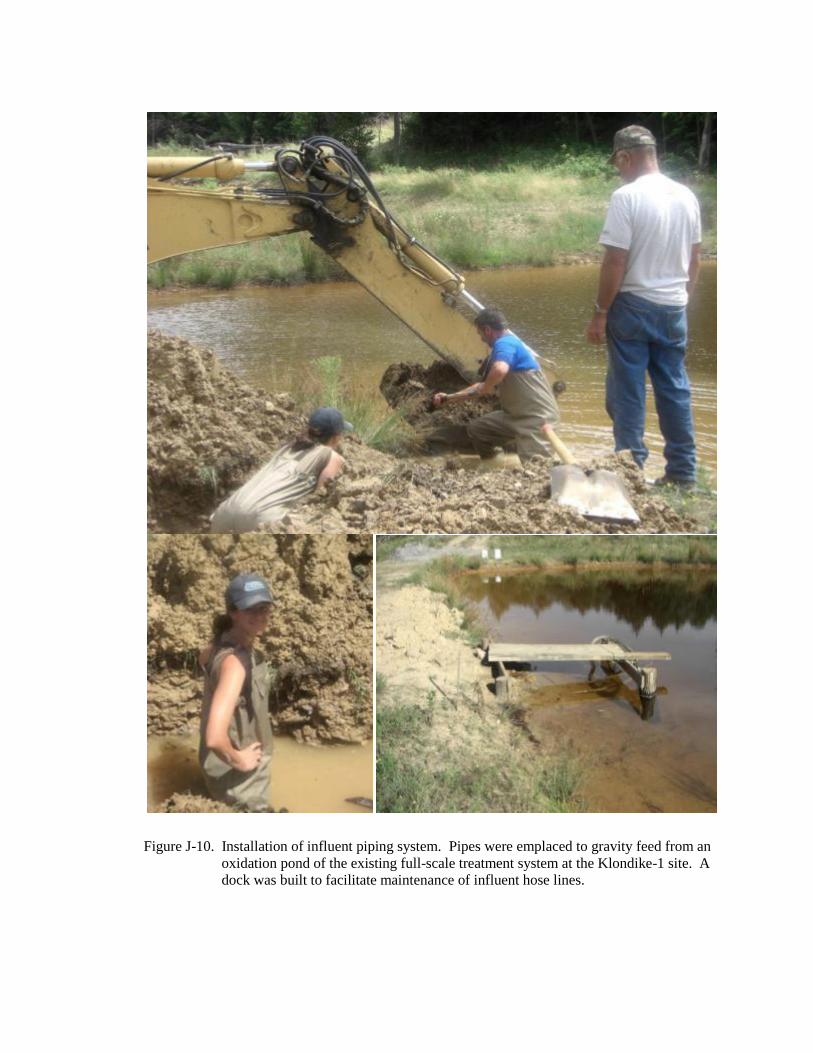
Figure J-10. Installation of influent piping system. Pipes were emplaced to gravity feed
from an oxidation pond of the existing full-scale treatment system at the Klondike-1
site. A dock was built to facilitate maintenance of influent hose lines. .......................... 135
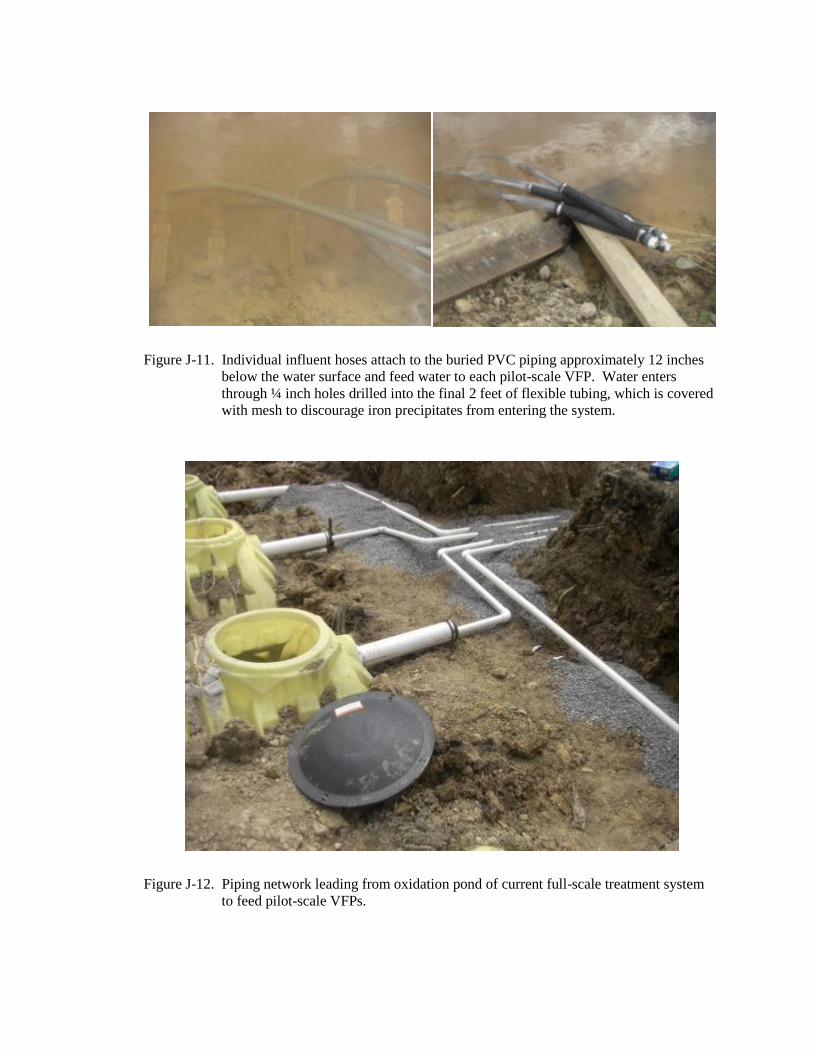
Figure J-11. Individual influent hoses attach to the buried PVC piping approximately 12
inches below the water surface and feed water to each pilot-scale VFP. Water enters
through ¼ inch holes drilled into the final 2 feet of flexible tubing, which is covered
with mesh to discourage iron precipitates from entering the system. .............................. 136
Figure J-12. Piping network leading from oxidation pond of current full-scale treatment
system to feed pilot-scale VFPs. ...................................................................................... 136
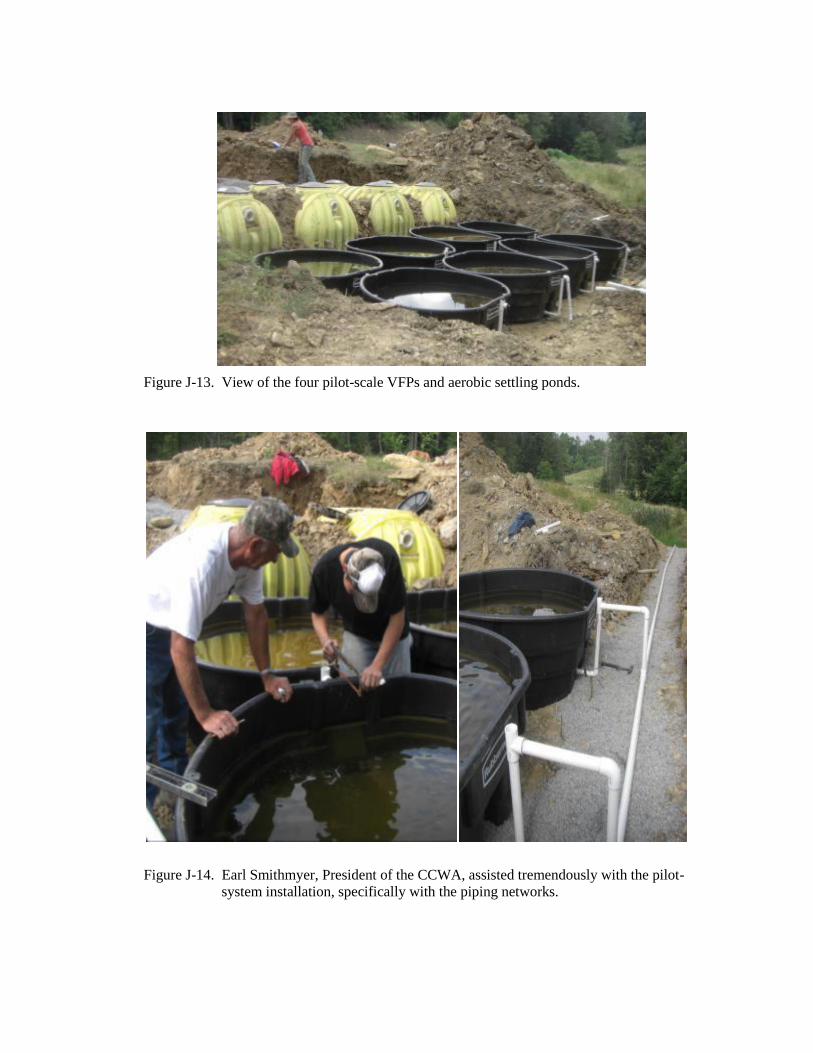
Figure J-13. View of the four pilot-scale VFPs and aerobic settling ponds. .......................... 137
Figure J-14. Earl Smithmyer, President of the CCWA, assisted tremendously with the
pilot-system installation, specifically with the piping networks. ..................................... 137
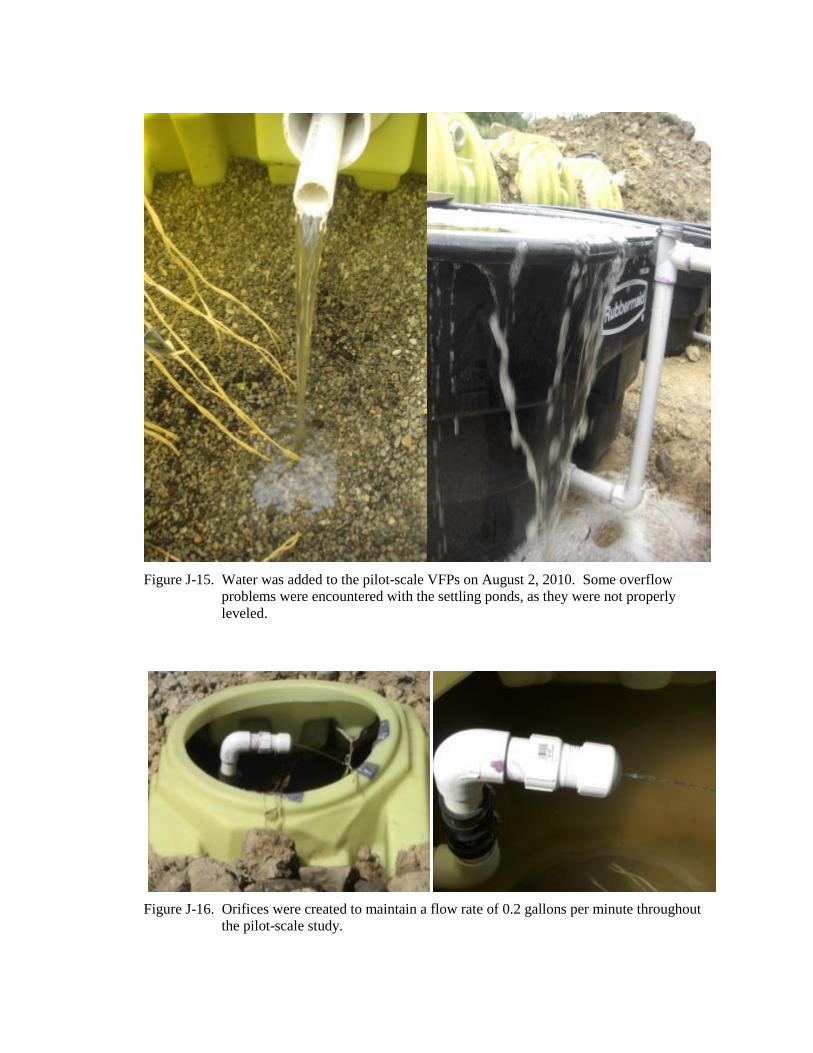
Figure J-15. Water was added to the pilot-scale VFPs on August 2, 2010. Some
overflow problems were encountered with the settling ponds, as they were not
properly leveled. ............................................................................................................... 138
Figure J-16. Orifices were created to maintain a flow rate of 0.2 gallons per minute
throughout the pilot-scale study. ...................................................................................... 138
Figure J-17. Aeration of the tank effluent was encouraged via a miniature cascade
constructed with corrugated piping. ................................................................................. 139
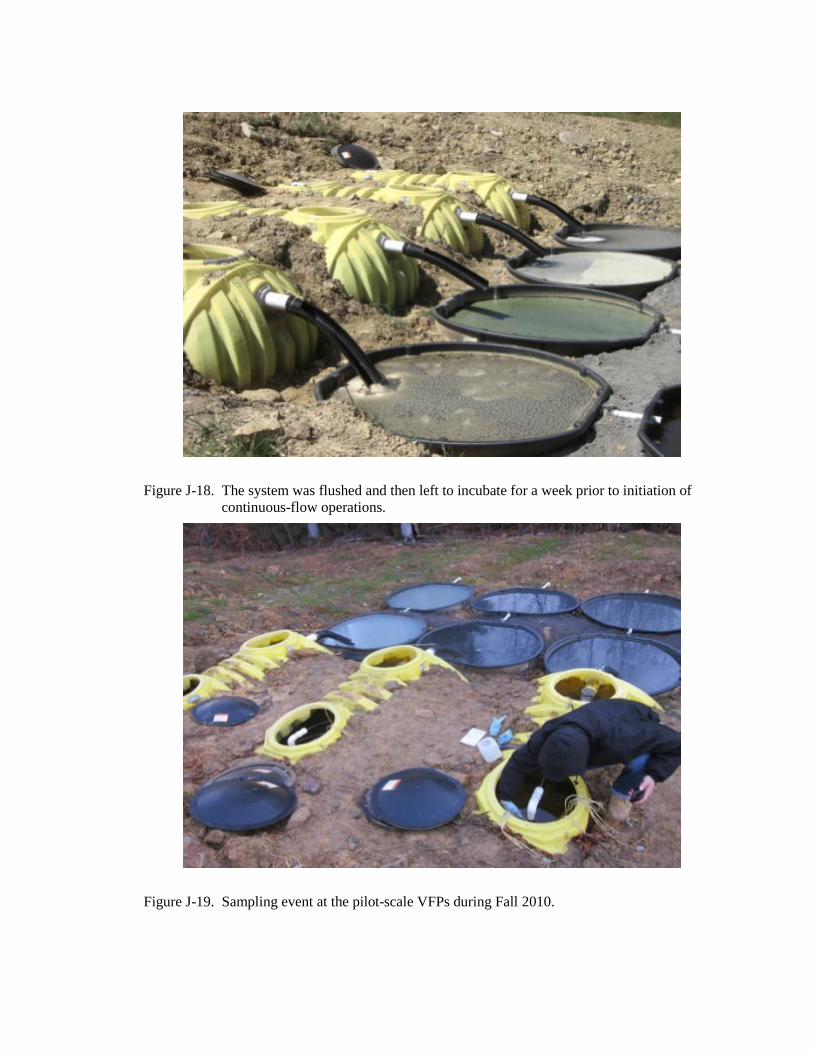
Figure J-18. The system was flushed and then left to incubate for a week prior to
initiation of continuous-flow operations. ......................................................................... 140
Figure J-19. Sampling event at the pilot-scale VFPs during Fall 2010. ................................. 140
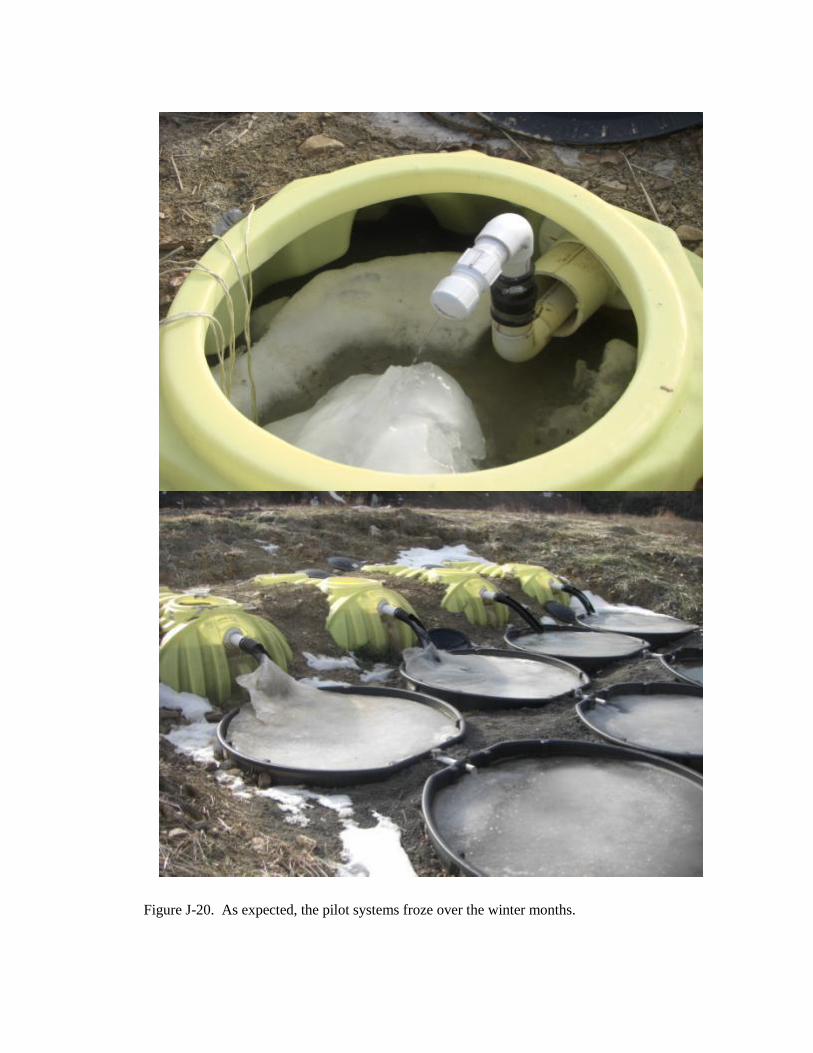
Figure J-20. As expected, the pilot systems froze over the winter months. ............................ 141
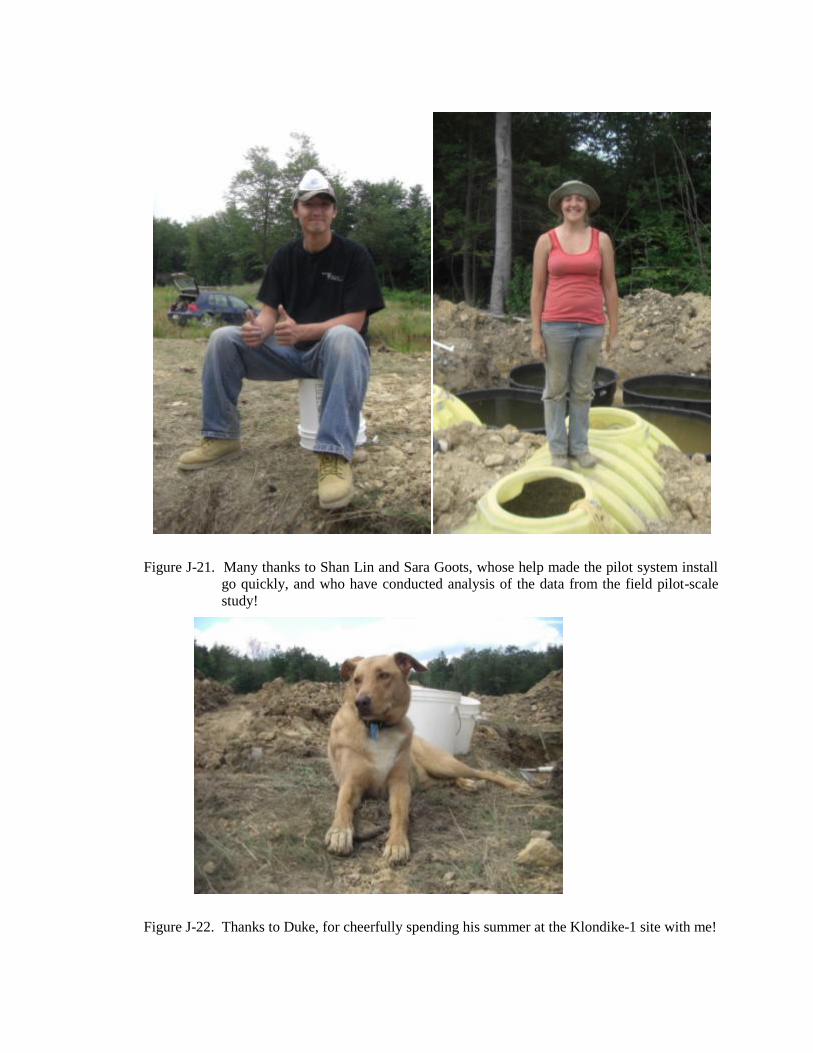
Figure J-21. Many thanks to Shan Lin and Sara Goots, whose help made the pilot system
install go quickly, and who have conducted analysis of the data from the field pilot-
scale study! ....................................................................................................................... 142
Figure J-22. Thanks to Duke, for cheerfully spending his summer at the Klondike-1 site
with me! ........................................................................................................................... 142
Page 11
x
LIST OF TABLES
Table 2-1. Field measurements and dissolved metals analysis of water collected from the
Klondike-1 site at various times to supply the continuous-flow column test. ................. 14
Table 2-2. Particle size distribution of crab shell (CS) and SMC used as packing materials
in the continuous-flow column study. .............................................................................. 15
Table 2-3. Mass of solid packing materials used in each continuous-flow column. ............... 16
Table 2-4. Extractible metals and compost analysis of the continuous-flow column
packing materials. ............................................................................................................ 17
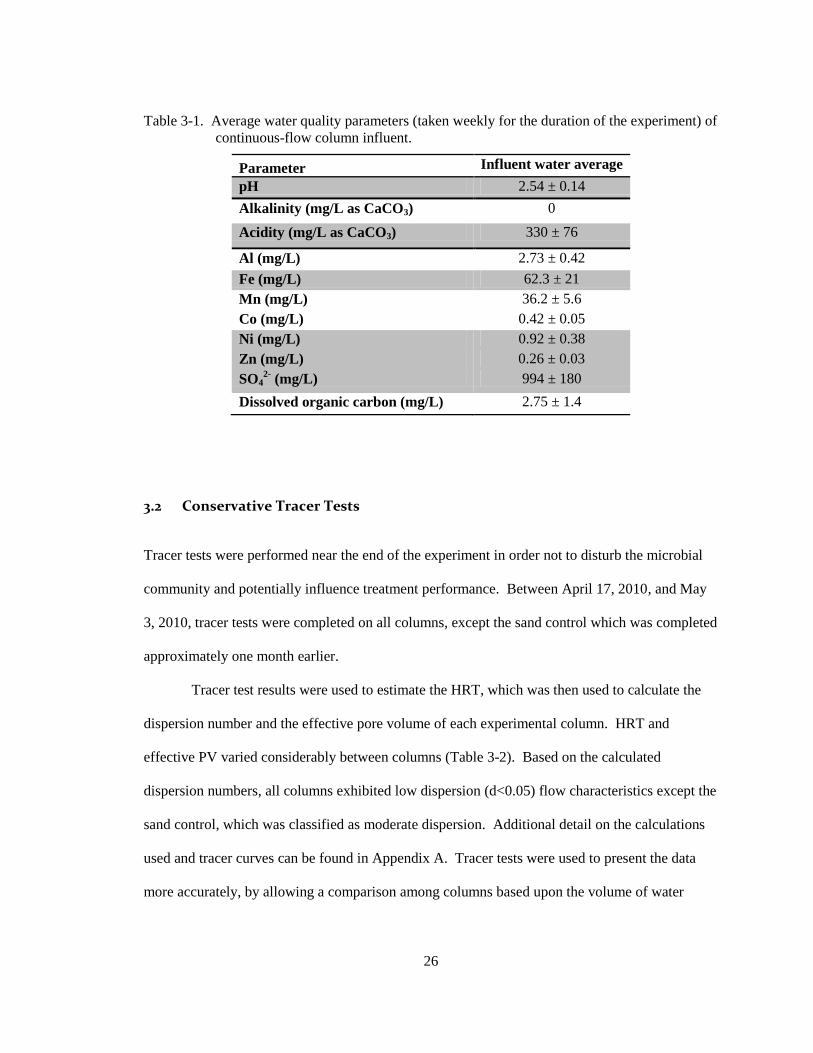
Table 3-1. Average water quality parameters (taken weekly for the duration of the
experiment) of continuous-flow column influent............................................................. 26
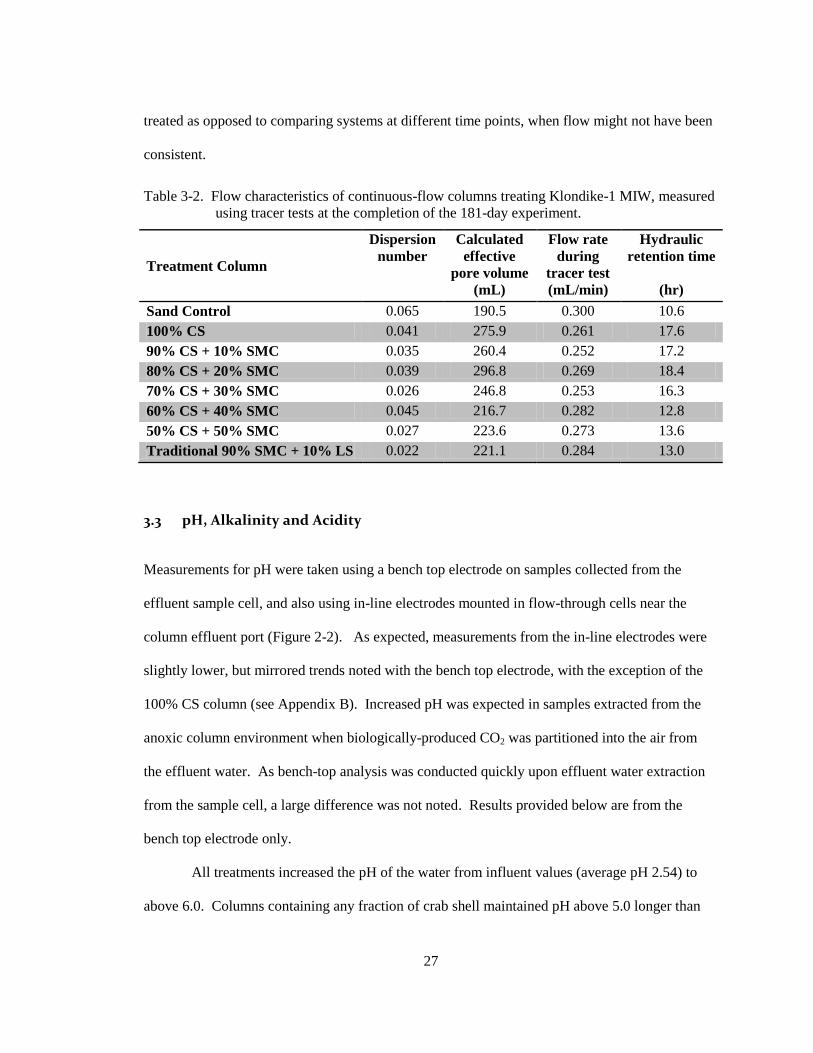
Table 3-2. Flow characteristics of continuous-flow columns treating Klondike-1 MIW,
measured using tracer tests at the completion of the 181-day experiment. ...................... 27
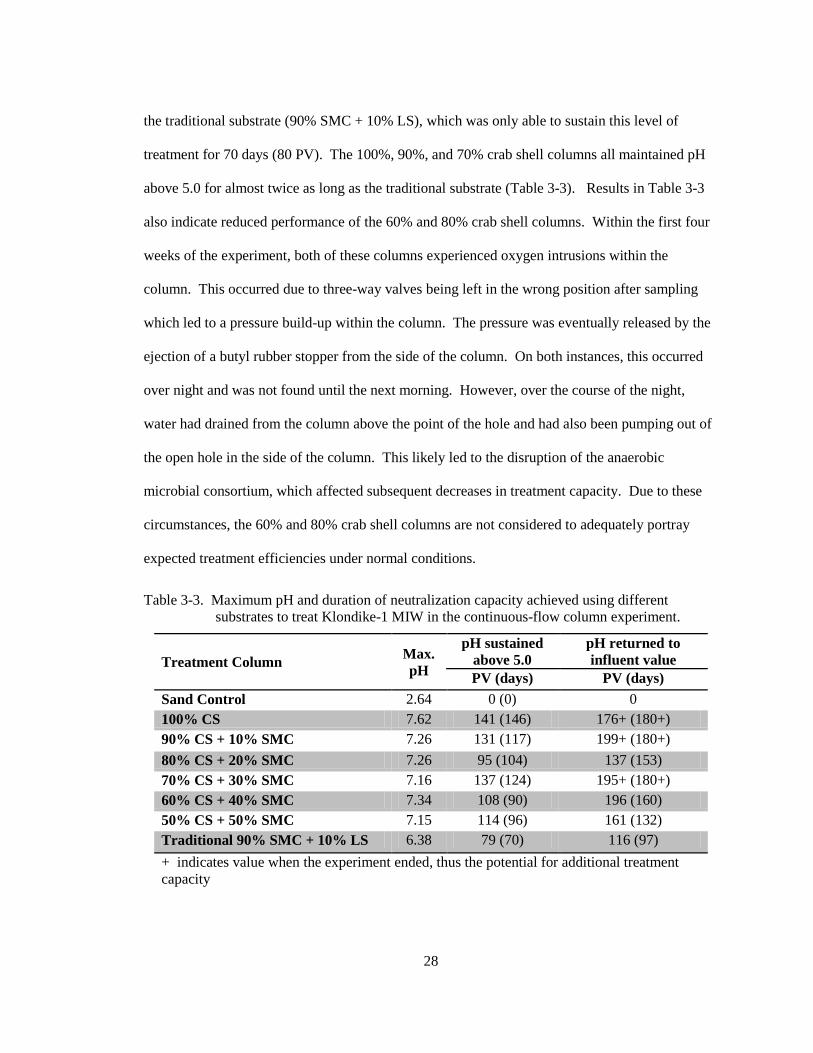
Table 3-3. Maximum pH and duration of neutralization capacity achieved using different
substrates to treat Klondike-1 MIW in the continuous-flow column experiment. ........... 28
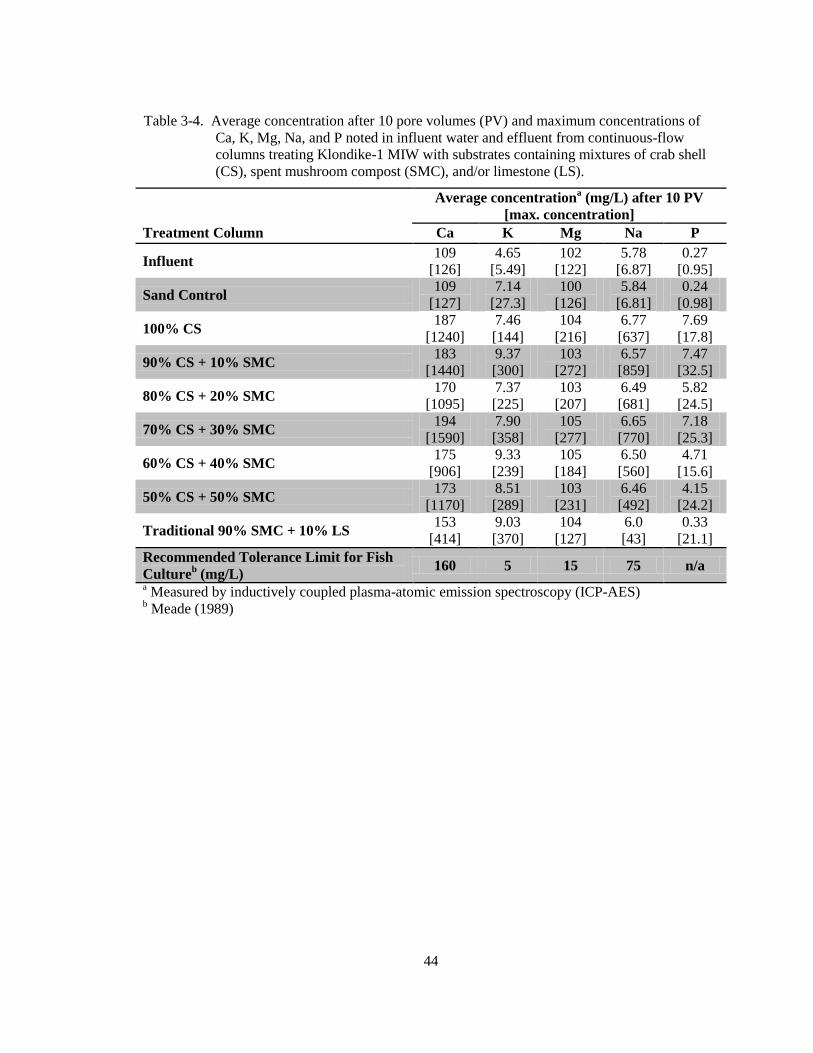
Table 3-4. Average concentration after 10 pore volumes (PV) and maximum
concentrations of Ca, K, Mg, Na, and P noted in influent water and effluent from
continuous-flow columns treating Klondike-1 MIW with substrates containing
mixtures of crab shell (CS), spent mushroom compost (SMC), and/or limestone
(LS). ................................................................................................................................. 44
Table 4-1. Metal treatment capacity for each continuous-flow column utilizing 40 g
substrate mixtures to treat Klondike-1 MIW. .................................................................. 49
Table 4-2. Fe retained within treatment columns (after breakthrough) at completion of
continuous-flow column test treating Klondike-1 MIW. ................................................. 52
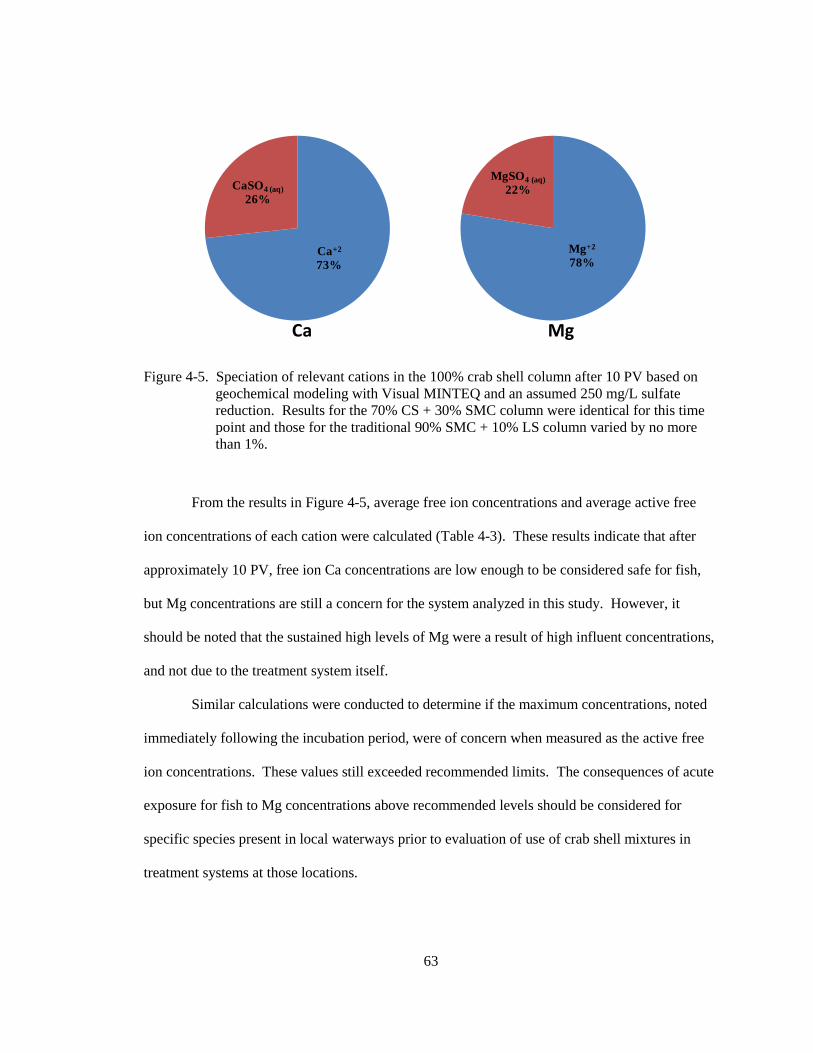
Table 4-3. Tolerance limits and analytic, free ion, and active free ion average
concentrations (after 10 PV) for cations of interest from continuous-flow columns
treating Klondike-1 MIW. ................................................................................................ 64
Table 4-4. Iterative calculations used to determine the theoretical masses and volumes of
crab shell and sand needed if a 1:1 packing ratio (by mass) were used in the
continuous-flow column study. Bolded row indicates the mass required to fill a
~700 mL column, as used in this study. ........................................................................... 66
Table 4-5. Experimental and theoretical treatment longevity of crab shell substrate
mixtures for treating high-strength MIW. Experimental longevity was determined in
the column study using a 1:12 (by mass) substrate to proppant ratio (40 g total
substrate). Theoretical longevity was estimated by extrapolating the results to a 1:1
(by mass) crab shell to sand proppant ratio that would be used in the field. ................... 66
Page 12
xi
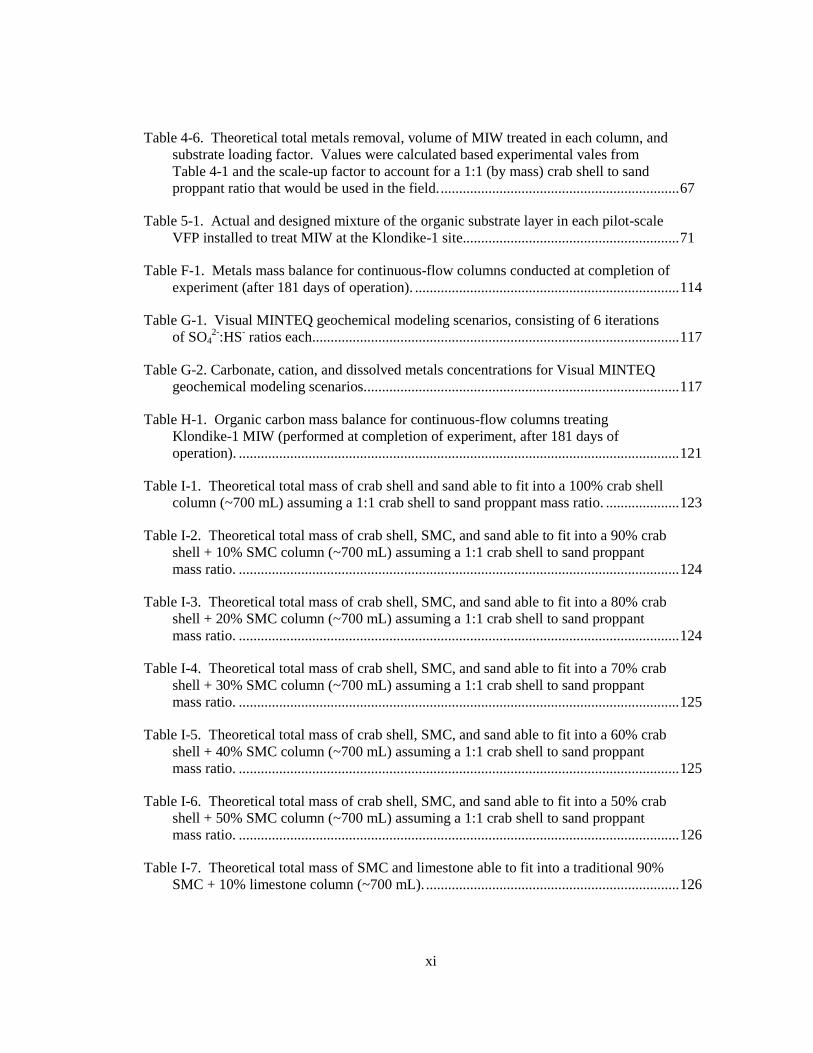
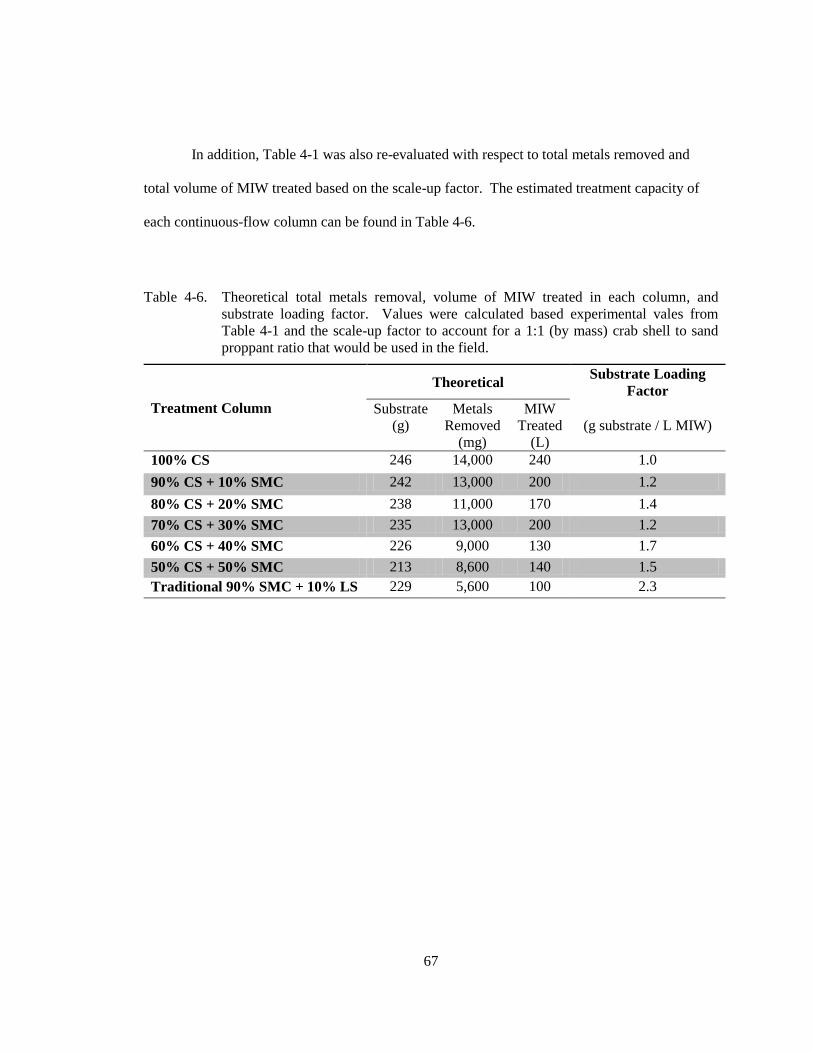
Table 4-6. Theoretical total metals removal, volume of MIW treated in each column, and
substrate loading factor. Values were calculated based experimental vales from
Table 4-1 and the scale-up factor to account for a 1:1 (by mass) crab shell to sand
proppant ratio that would be used in the field. ................................................................. 67
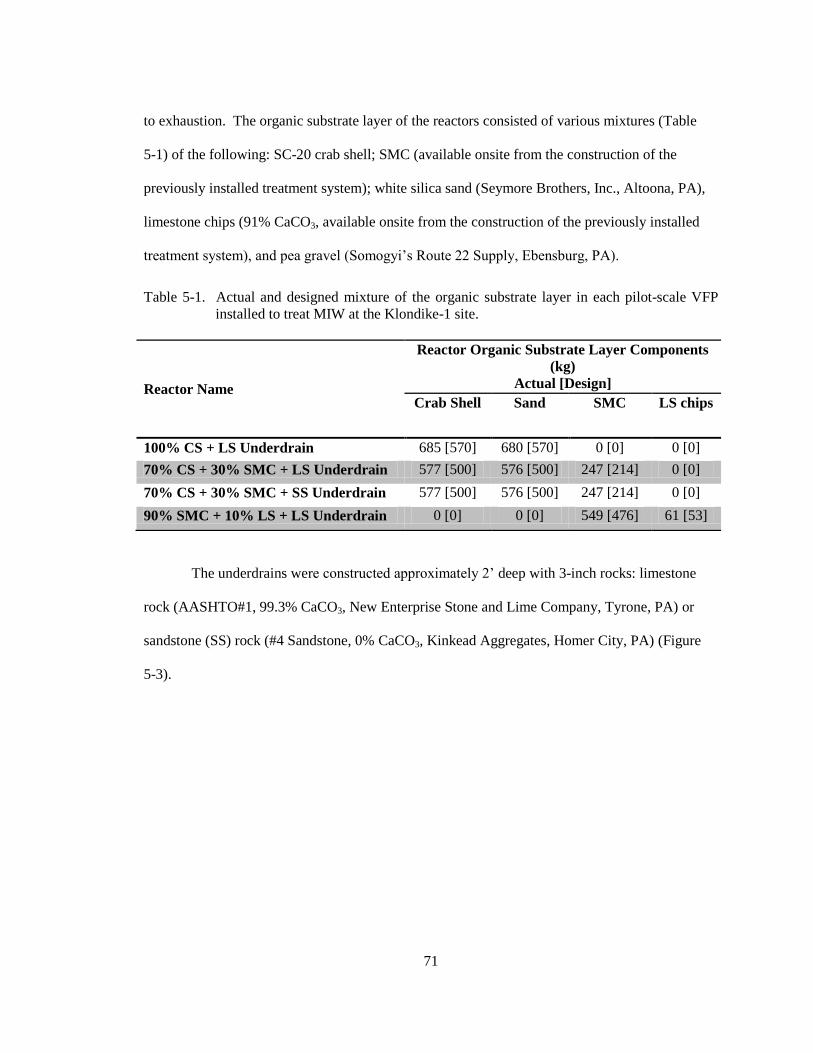
Table 5-1. Actual and designed mixture of the organic substrate layer in each pilot-scale
VFP installed to treat MIW at the Klondike-1 site........................................................... 71
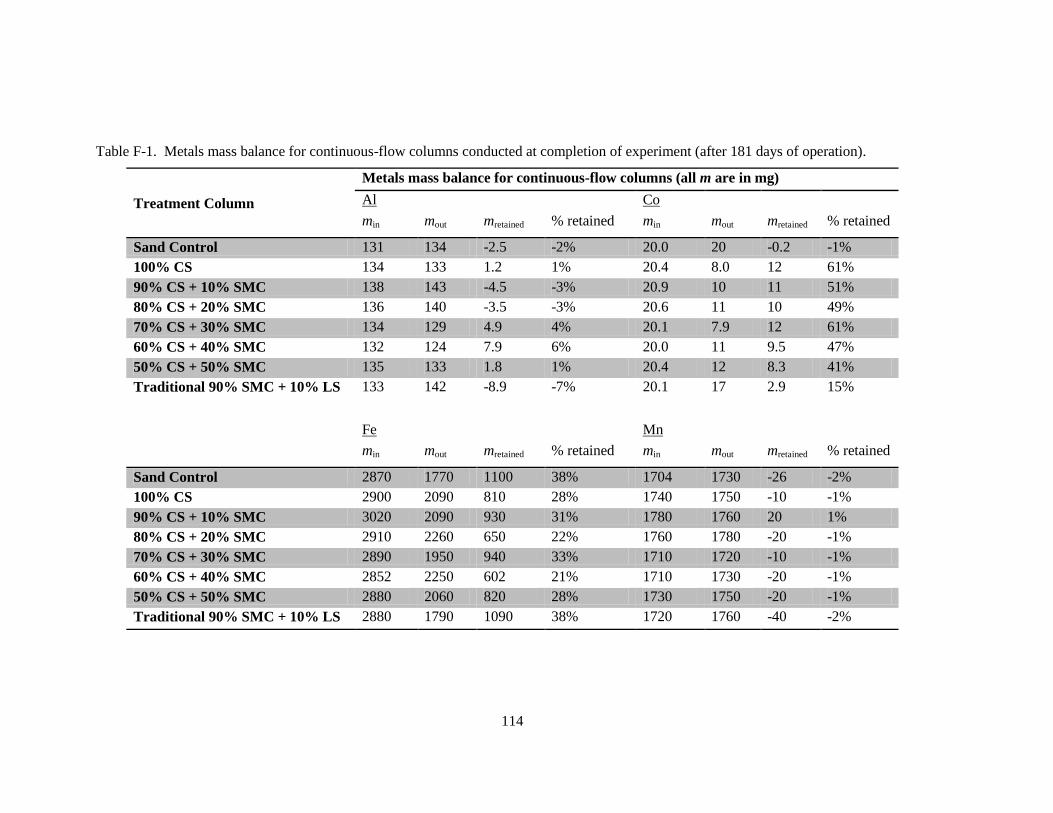
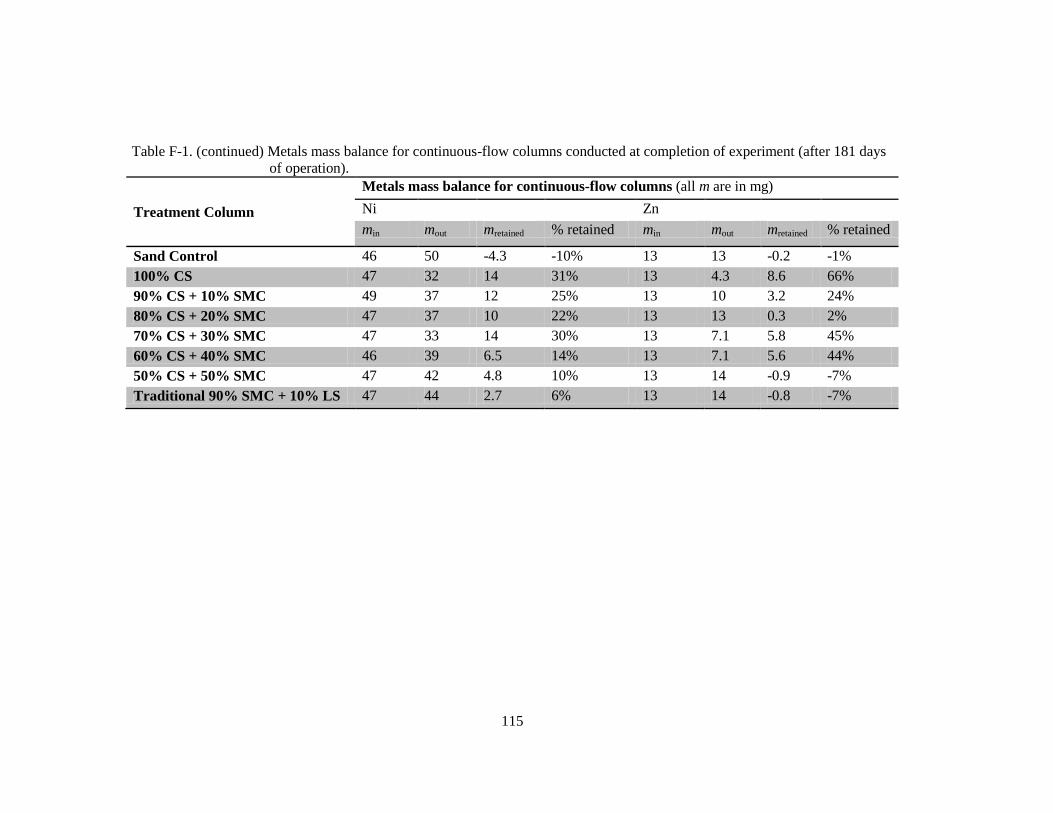
Table F-1. Metals mass balance for continuous-flow columns conducted at completion of
experiment (after 181 days of operation). ........................................................................ 114
Table G-1. Visual MINTEQ geochemical modeling scenarios, consisting of 6 iterations
of SO42-
:HS- ratios each .................................................................................................... 117
Table G-2. Carbonate, cation, and dissolved metals concentrations for Visual MINTEQ
geochemical modeling scenarios. ..................................................................................... 117
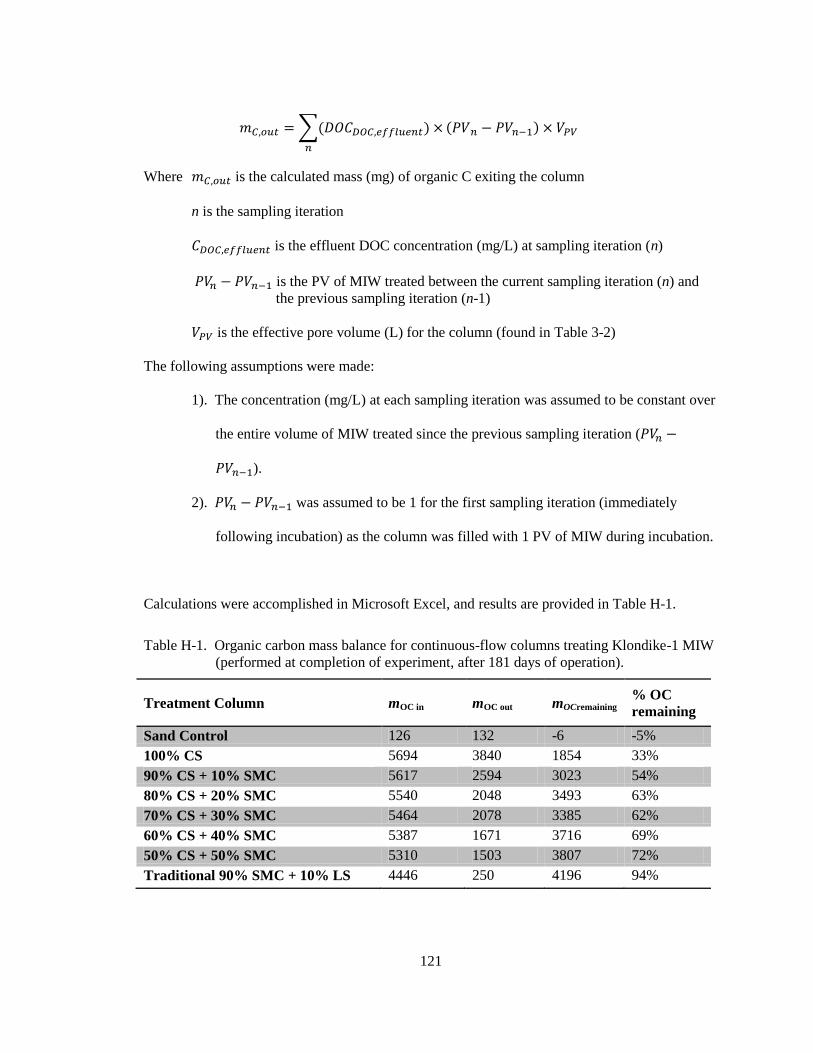
Table H-1. Organic carbon mass balance for continuous-flow columns treating
Klondike-1 MIW (performed at completion of experiment, after 181 days of
operation). ........................................................................................................................ 121
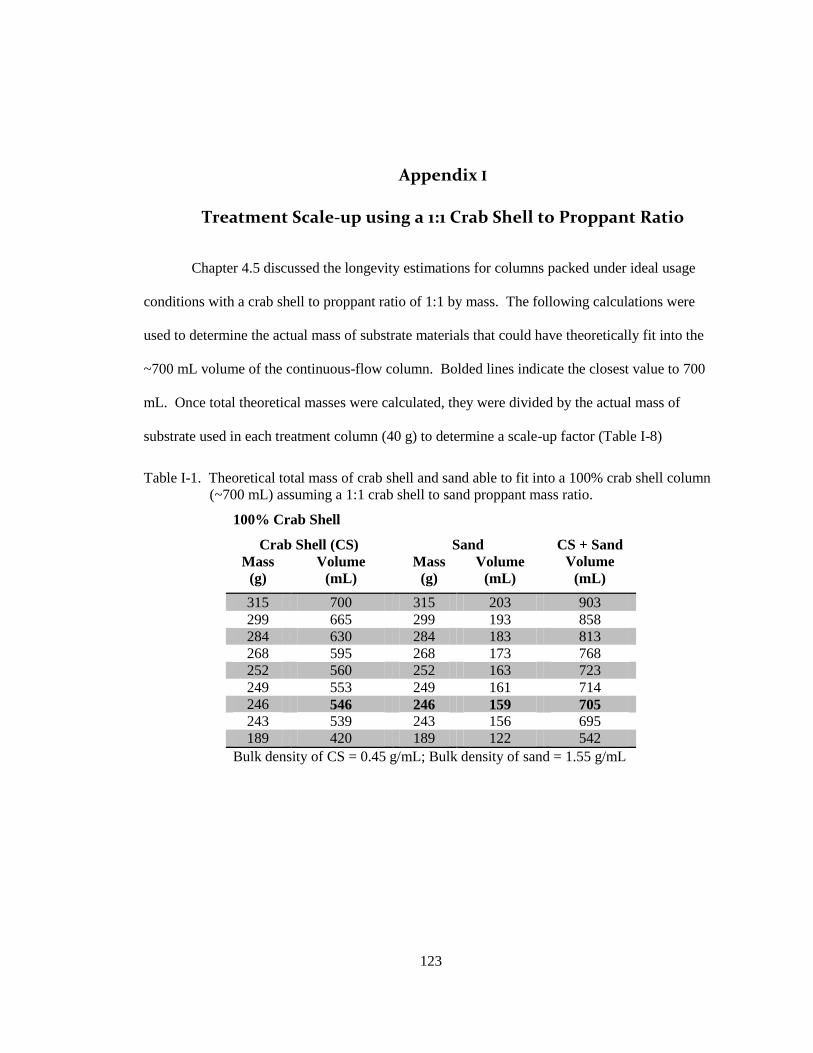
Table I-1. Theoretical total mass of crab shell and sand able to fit into a 100% crab shell
column (~700 mL) assuming a 1:1 crab shell to sand proppant mass ratio. .................... 123
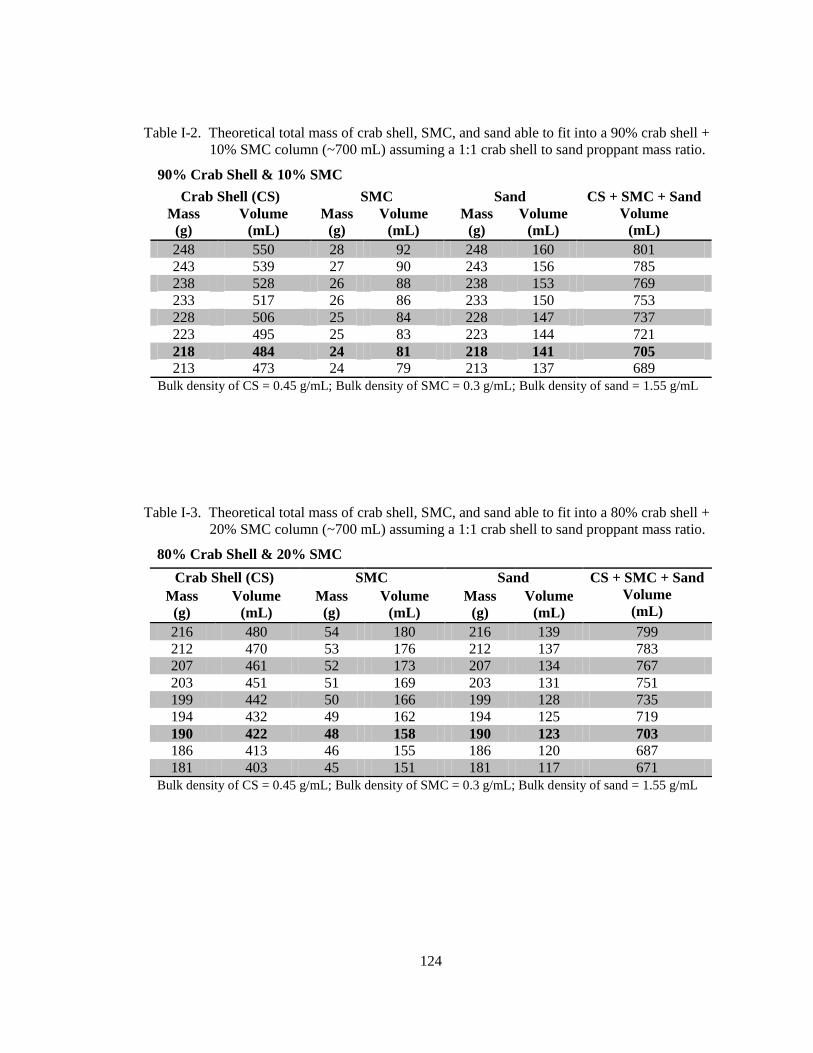
Table I-2. Theoretical total mass of crab shell, SMC, and sand able to fit into a 90% crab
shell + 10% SMC column (~700 mL) assuming a 1:1 crab shell to sand proppant
mass ratio. ........................................................................................................................ 124
Table I-3. Theoretical total mass of crab shell, SMC, and sand able to fit into a 80% crab
shell + 20% SMC column (~700 mL) assuming a 1:1 crab shell to sand proppant
mass ratio. ........................................................................................................................ 124
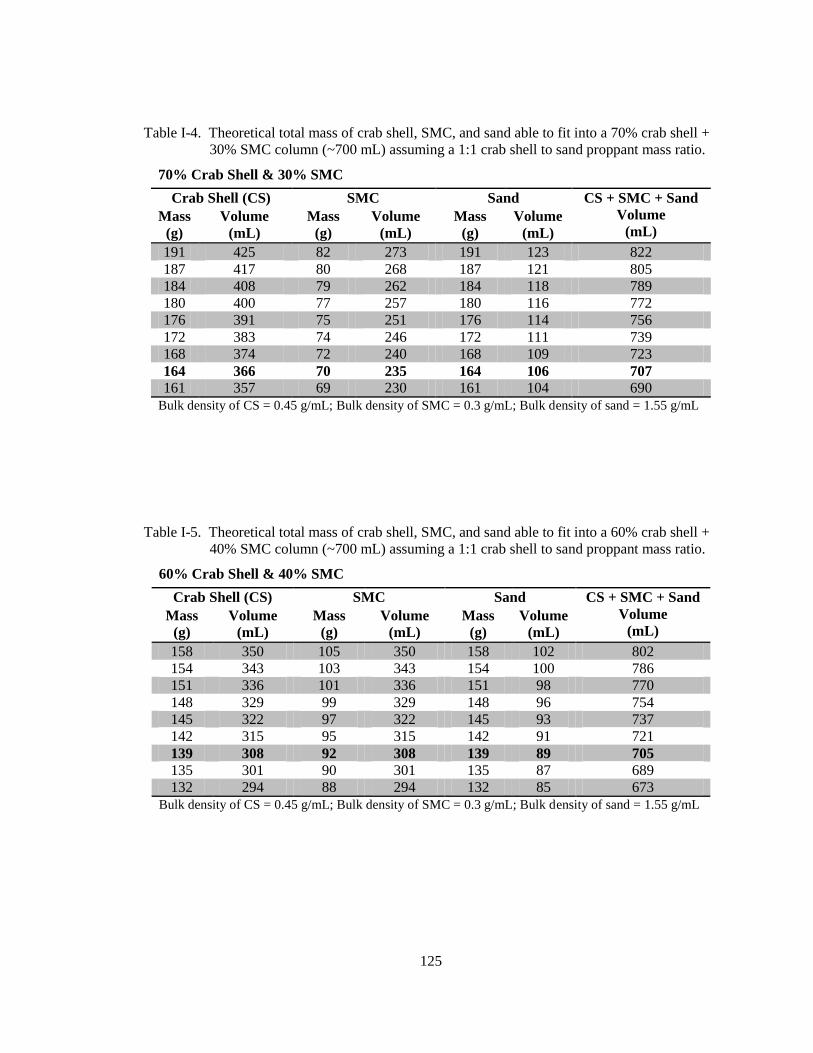
Table I-4. Theoretical total mass of crab shell, SMC, and sand able to fit into a 70% crab
shell + 30% SMC column (~700 mL) assuming a 1:1 crab shell to sand proppant
mass ratio. ........................................................................................................................ 125
Table I-5. Theoretical total mass of crab shell, SMC, and sand able to fit into a 60% crab
shell + 40% SMC column (~700 mL) assuming a 1:1 crab shell to sand proppant
mass ratio. ........................................................................................................................ 125
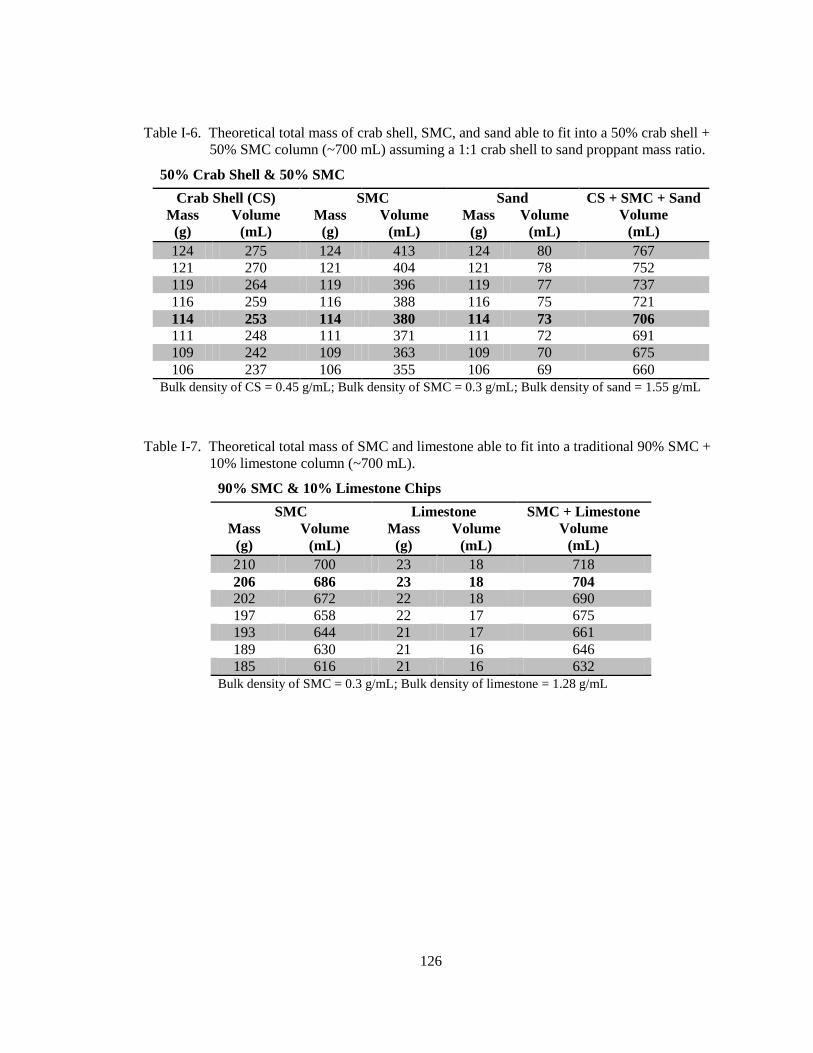
Table I-6. Theoretical total mass of crab shell, SMC, and sand able to fit into a 50% crab
shell + 50% SMC column (~700 mL) assuming a 1:1 crab shell to sand proppant
mass ratio. ........................................................................................................................ 126
Table I-7. Theoretical total mass of SMC and limestone able to fit into a traditional 90%
SMC + 10% limestone column (~700 mL). ..................................................................... 126
Page 13
xii
Table I-8. Calculated scale-up factors based on theoretical total mass of substrate
required to fill ~700 mL volume and actual mass used in the experiment. ...................... 127
Page 14
xiii
ACKNOWLEDGEMENTS
First, I would like to thank the three undergraduate students, Brad Sick, Sara Goots and
Shan Lin, who have joined in this research in differing capacities ranging from collaboration
during the laboratory continuous-flow column test to installation and monitoring of the pilot-scale
field system. Their company and shared learning has greatly enhanced my graduate experience.
I would like to thank the faculty and staff within the Department of Civil and Environmental
Engineering, most especially Dr. Rachel Brennan for her mentorship and encouragement, and Dr.
Brian Dempsey and Dr. Bill Burgos for serving on my committee. The graduate students within
the department, specifically those in the Brennan Research Group, have helped me significantly
along the way and are acknowledged for their guidance and friendship. Also, the support of my
family and the three little bears (Duke, Henry, and Mya) is gratefully recognized for reminding
me that life awaits outside the confines of the Sackett building. The assistance of Earl
Smithmeyer, the Clearfield Creek Watershed Association, and the Foundation for Pennsylvania
Watersheds is also gratefully acknowledged for their role in the facilitating the success of the
pilot-scale system installation.
Pergamon Press is acknowledged for their permission to reproduce copyrighted
material in Figure 1.3. This research is supported in part by the National Science Foundation
CAREER Award No. CBET-0644983. Any opinions, findings, and conclusions or
recommendations expressed in this material are those of the authors and do not necessarily reflect
the views of the National Science Foundation.
Page 15
1
1. Introduction
The EPA estimates that there are over 200,000 abandoned mine sites which impact over
10,000 miles of streams in the United States (U.S) (EPA, 1997). In Pennsylvania alone, a study
completed in 2010 found that mine impacted water (MIW) affected more than 5,500 miles of
streams (PA DEP, 2010). However, this is not a problem unique to the U.S. and can be found on
every continent except Antarctica, where mining has been banned by an international treaty
(Romero et al., 2010; Baruah and Khare, 2010; Dinelli et al., 1999; Schippers et al., 2007; Tutu et
al., 2008; Edraki et al., 2005). MIW varies greatly based on the geologic makeup of the bedrock
being mined, but typically contains high concentrations of metals, sulfur species, and acidity
which can harm aquatic life and threaten the quality of potable water supplies.
1.1 Mine Impacted Water
The term MIW has replaced acid mine drainage, acid rock discharge, and other phrases
because it better describes the polluted effluent which drains from sites where the mining of coal
or metal ores has exposed the reactive surface of rocks and minerals. Although the discussion
below will show that acidity is typically produced in MIW, that is not always the case. In
geologic strata containing limestone, natural buffering of the MIW can occur, resulting in alkaline
discharges. A common mineral found in geologic formations associated with coal mining
operations is pyrite (FeS2). The exposure of FeS2 to oxygen and water during and after mining
results in the formation of ferrous iron, sulfate (SO42-
), and increased acidity according to the
following equation:
Page 16
2
2FeS2(s) + 7O2 + 2H2O 2Fe2+
+ 4SO42-
+ 4H+
Eq. 1-1
Initially, solutions of MIW have circum-neutral pH values, at which time abiotic
oxidation of ferrous iron (Fe2+
) occurs slowly. As additional FeS2 is oxidized and pH begins to
drop, biotic Fe2+
oxidation becomes the prominent mechanism. As the energy gained from the
oxidation of Fe2+
is relatively low, a single organism must carry out the reaction multiple times to
achieve the energy required for cell functions and growth (Maier et al., 2009). Thus, the biotic
oxidation of Fe2+
occurs much more rapidly than abiotic oxidation. Both processes are achieved
via the following reaction pathway:
4Fe2+
+ O2 + 4H+ 4Fe
3+ + 2H2O Eq. 1-2
Ferric iron (Fe3+
) produced by the above pathway also reacts spontaneously with
additional pyrite and propagates the oxidation process via the following reaction:
FeS2(s) + 14Fe3+
+ 8H2O 15Fe2+
+ 2SO42-
+ 16H+
Eq. 1-3
Thus, once pyrite is exposed to air and water, the combination of microbial and
chemically mediated reactions creates a rapid cycle that promotes further oxidation of the
remaining pyrite.
The highly acidic environment also results in the dissolution of accompanying minerals,
causing the release of numerous other metals in addition to Fe. Primary metals of concern in
MIW of the mid-Atlantic, bituminous coal region are aluminum (Al), iron (Fe), and manganese
(Mn) (Cravotta, 2008). Trace metals found in this region, and also found in considerably higher
concentrations elsewhere, include cobalt (Co), nickel (Ni), and zinc (Zn), among others (Cravotta,
2008; Schippers et al., 2007; Baruah et al., 2010; Dinelli et al., 2001 ).
Page 17
3
The final resulting step, which produces the characteristic Fe precipitation known as
―yellow-boy‖ is expressed by Eq. 1-4:
Fe3+
+ 3H2O Fe(OH)3 + 3H+
Eq. 1-4
MIW can affect local waterways in numerous facets. First, the low pH often associated
with MIW is an extreme environment which most organisms are not suited to survive in.
Secondly, the high metal concentrations can be toxic to fish and other biota. Finally, the
precipitated minerals that naturally form when conditions change (i.e., increased pH and oxygen
concentrations when MIW enters a stream and undergoes mixing) can coat the bottom of the
channel, sealing off food and oxygen sources. The least tolerant species are driven off or die
initially, followed by impacts throughout the food chain until the entire ecosystem is altered.
Water quality of surface water supplies is also a matter of human health, as it often supplies local
drinking water facilities. Increased metals concentrations can require expensive treatment beyond
that typically provided, driving up costs for potable water.
1.2 Anaerobic Sulfate-Reducing Passive Treatment
Although active treatment systems are often used to treat effluent water from ongoing mining
operations, they are expensive and require daily maintenance. The most cost-effective method to
remediate MIW at abandoned sites, where restoration funding is extremely limited, is passive
treatment systems which do not require frequent attention. The only passive systems capable of
removing all components of MIW (metals, sulfur species, and acidity) are anaerobic biologically-
based systems, which utilize sulfate reducing bacteria (SRB) to facilitate the precipitation of
metal sulfides while simultaneously generating alkalinity.
Page 18
4
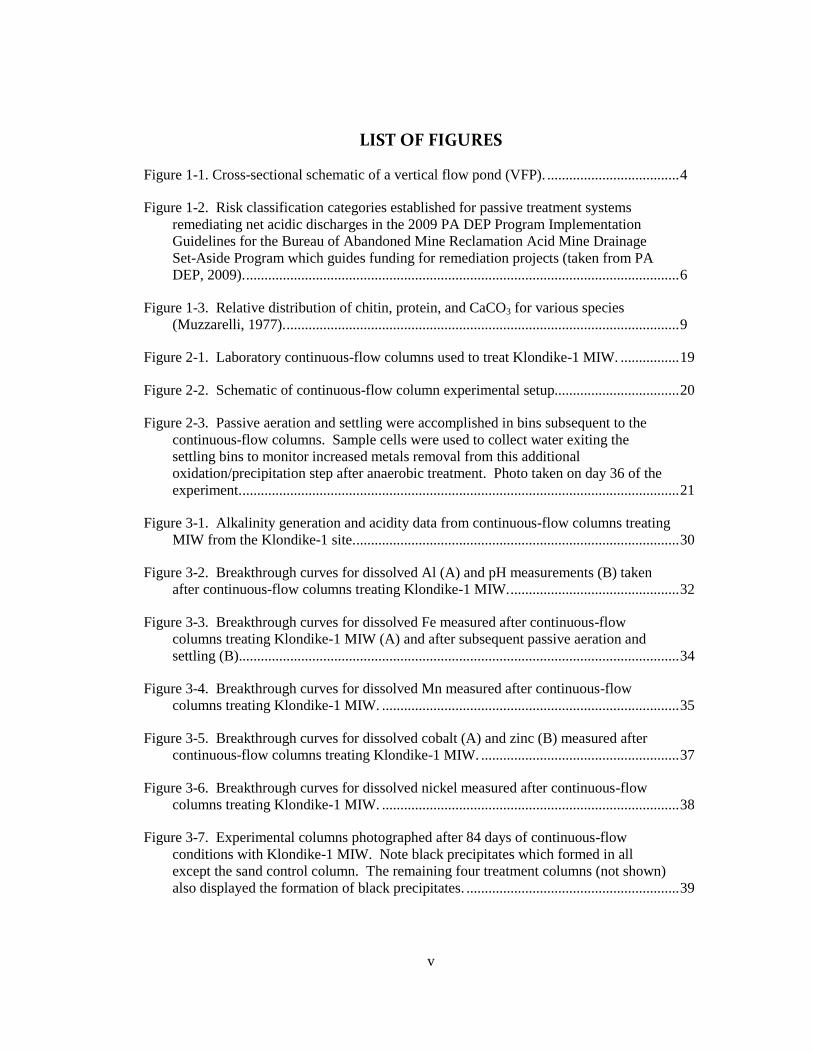
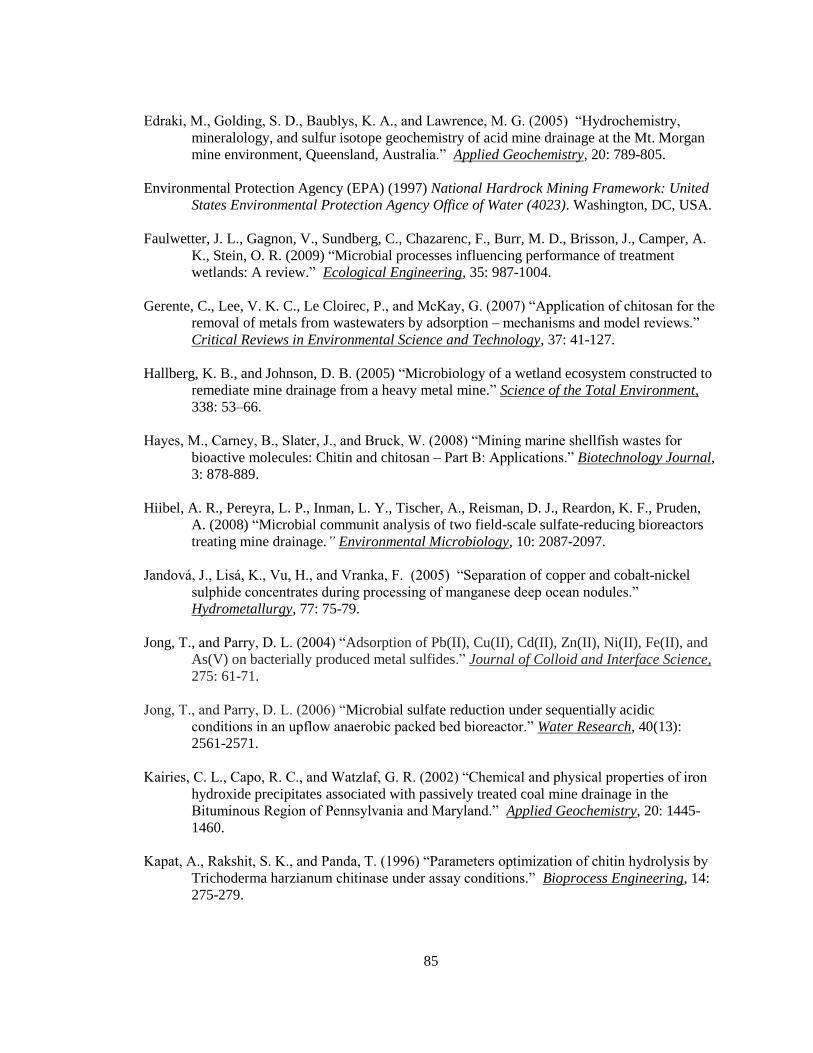
Vertical flow ponds (VFPs) are a typical approach to anaerobic passive treatment which
allows water to flow vertically downward through an anoxic layer of organic substrate, and then
through a layer of limestone rock to produce additional alkalinity before exiting through a
network of under drains (Figure 1-1). These system designs typically include an additional
treatment cell subsequent to the VFP in the form of a settling pond were aeration is encouraged
and additional metal (hydr)oxides precipitate from the neutralized water (Doshi, 2006).
Figure 1-1. Cross-sectional schematic of a vertical flow pond (VFP).
MIW rich in SO42-
provides an optimal source of electron acceptors for SRB, which are
among the most ubiquitous organisms on the planet (Faulwetter et al., 2009). When provided
with an acceptable electron donor, these microorganisms will reduce sulfate to sulfide and
generate alkalinity in the form of bicarbonate (HCO3-) according to the following reaction:
SO42-
+ 2CH2O H2S + 2HCO3- Eq. 1-5
The H2S formed promotes the precipitation of metal ions in the water as metal sulfides:
Me2+
+ H2S MeS(s) + 2H+
Eq. 1-6
The utilization of this process allows for the controlled precipitation of pure metal sulfides, which
are desirable for several reasons. First, metal sulfides have low solubility over a wide pH range
and are highly stable (Jandová et al., 2005). This reduces the likelihood that metal sulfides will
Page 19
5
be released when conditions within the treatment system fluctuate over varied seasonal
conditions. Secondly, metal sulfides have been shown to produce extremely small particle sizes,
resulting in a considerably lower volume than hydroxide precipitates (Lewis, 2010). This allows
for the precipitation of more metals within a given volume, and can reduce the overall footprint of
a treatment system. Finally, if metals can be precipitated under optimized conditions, high purity
is achievable which allows for collection and beneficial reuse as pigmenting agents for paint and
other products (Lewis, 2010).
Although conventional use of such passive systems has proven both economical and
effective for numerous low-strength MIW (low acidity and low metals concentrations)
applications, these systems have failed to consistently treat sources with high metals loads and
flow rates. It has been shown that anaerobic passive treatment systems can experience reduced
reactivity and permeability well before the expected exhaustion of the treatment substrate. Loss
of reactivity is caused by coating of the substrate materials with precipitates (armoring) and
permeability is limited by clogging when precipitates fill the pore space of the system (e.g., Rees
et al., 2001; Watzlaf et al., 2002, 2004; Ziemkiewicz et al., 2003; Rose et al., 2004; Simon et al.,
2005). In addition, passive treatment systems are often installed in remote forested locations
where the surface area for large treatment ponds is frequently limited due to site constraints. In
addition to remoteness, many mines are located on steep hillsides or in narrow valleys, such that
construction of passive systems may again be restricted by the availability of flat areas. Thus,
system construction is not always done according to optimal design, but instead with respect to
the footprint available onsite (Matthies et al., 2010).
A comprehensive study conducted by the U.S. Office of Surface Mining and the
Pennsylvania Department of Environmental Protection (PA DEP, 2008) surveyed over 250
passive treatment systems constructed in PA between 1990 and 2008 to evaluate the performance
Page 20
6
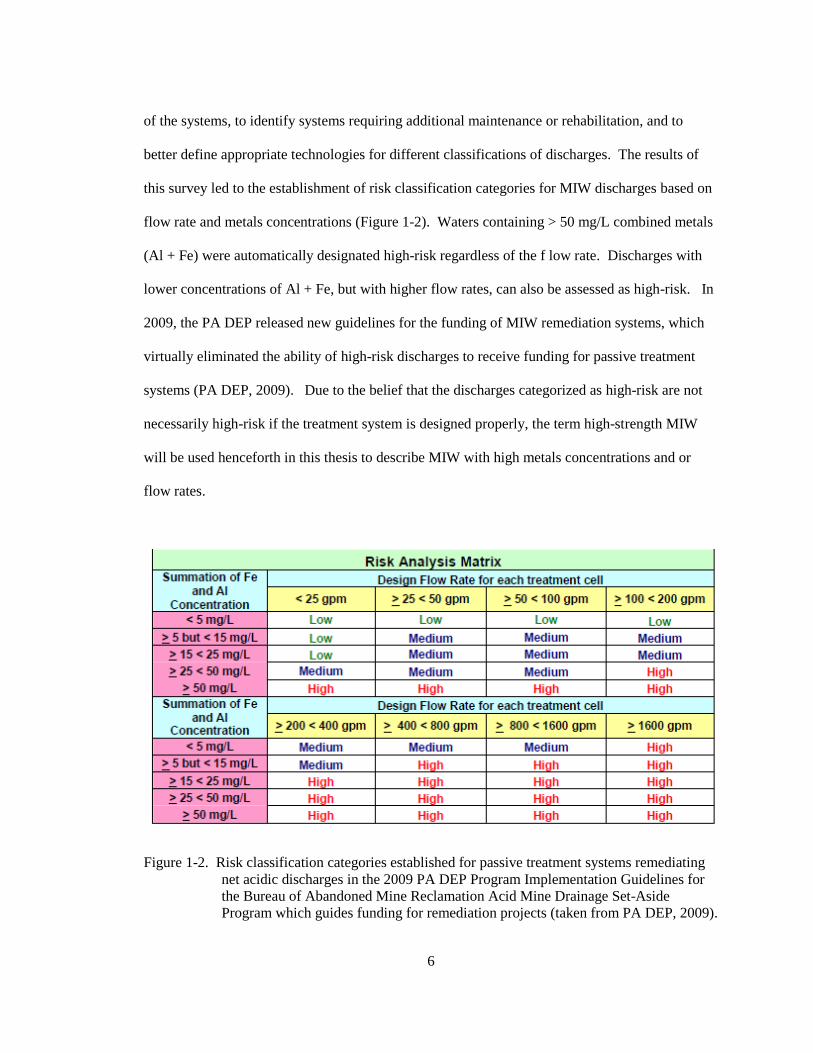
of the systems, to identify systems requiring additional maintenance or rehabilitation, and to
better define appropriate technologies for different classifications of discharges. The results of
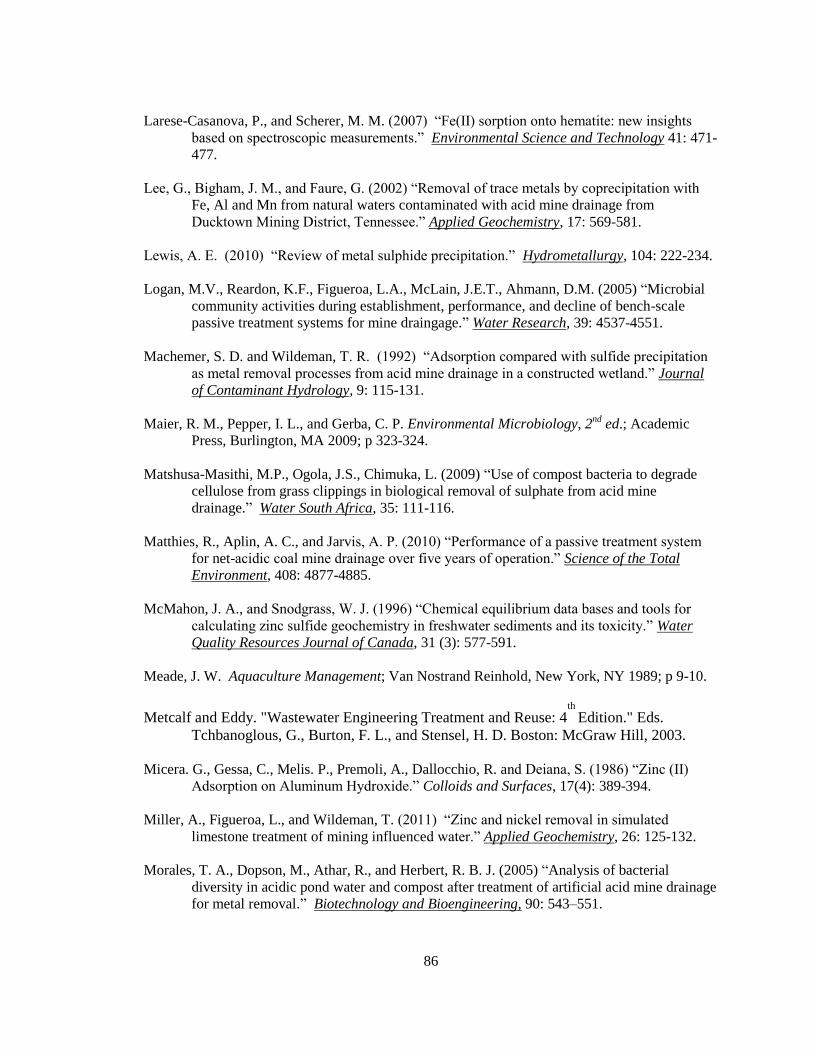
this survey led to the establishment of risk classification categories for MIW discharges based on
flow rate and metals concentrations (Figure 1-2). Waters containing > 50 mg/L combined metals
(Al + Fe) were automatically designated high-risk regardless of the f low rate. Discharges with
lower concentrations of Al + Fe, but with higher flow rates, can also be assessed as high-risk. In
2009, the PA DEP released new guidelines for the funding of MIW remediation systems, which
virtually eliminated the ability of high-risk discharges to receive funding for passive treatment
systems (PA DEP, 2009). Due to the belief that the discharges categorized as high-risk are not
necessarily high-risk if the treatment system is designed properly, the term high-strength MIW
will be used henceforth in this thesis to describe MIW with high metals concentrations and or
flow rates.
Figure 1-2. Risk classification categories established for passive treatment systems remediating
net acidic discharges in the 2009 PA DEP Program Implementation Guidelines for
the Bureau of Abandoned Mine Reclamation Acid Mine Drainage Set-Aside
Program which guides funding for remediation projects (taken from PA DEP, 2009).
Page 21
7
1.3 Composition of Organic Substrate Layer
It has also been hypothesized that short lifetime and low performance associated with
some passive biological systems could be related to the efficiency of the organic substrate to
sustain SRB activity, in addition to the permeability and reactivity problems discussed above
(Pruden et al., 2007). The composition of the organic substrate layer is critical to the success of
anaerobic passive treatment systems as it maintains conditions for a complex microbial
community which supports the growth and metabolism of SRB. The most common organic
substrates are composed of cellulosic materials. However SRB can only utilize short chain
organic acids and alcohols as their carbon (C) and electron donor sources, thus they require a
healthy population of fermentative and cellulose degrading organisms. These upstream
symbiants hydrolyze cellulose and other polymeric compounds and transform the degradation
products into simpler organic compounds that can be utilized by the SRB (Logan et al., 2005).
In addition to providing a C and electron donor source, the organic substrate must also be
able to provide other components essential for SRB and their supporting microbial community.
Namely, the provision of nutrients such as nitrogen (N) and phosphorus (P) is required. It has
been reported that insufficient N could possibly be limiting SRB activity in passive anaerobic
treatment systems (Waybrant et al., 2002). SRB also require an optimal pH between 5 and 8
(Willow and Cohen, 2003; Jong and Parry, 2006), which is typically achieved with the
supplementation of limestone chips within the substrate or is achieved completely via the
limestone underdrain. Finally, the substrate layer should possess the ability to degrade slowly,
allowing the system to last for longer periods without the requirement for substrate replacement.
The porosity of the substrate should also be considered to maintain flow through the
system. Due to decomposition of the substrate over time, it has been suggested that non-reactive
materials, such as pea gravel, be mixed with the organic substrate layer (Doshi, 2006; Rötting et
Page 22
8
al., 2008). In addition to maintaining permeability in the long term, inert proppants can induce
large pore spaces which will not be clogged by precipitates as easily.
Typical substrate layer composition in the central Pennsylvania region has been a mixture
of spent mushroom compost (SMC) and limestone chips due to local availability and low cost.
However, to overcome the difficulties mentioned, various mixtures of organic materials have
been evaluated with respect to their ability to provide an adequate environment for sustained
sulfate reduction including: manure and SMC (Nicromat et al., 2006); municipal leaf compost
mixed with cattle/horse manure and sewage sludge (Morales et al., 2005); a mixture of beech
wood chips, pulverized alfalfa, and pine shavings (Pereyra et al., 2008); sawdust and manure
(Hallberg and Johnson, 2005); a mixture of pine wood chips and sawdust, alfalfa hay, kiln dust,
and dairy cow manure (Hiibel et al., 2008); leaves and compost (Viggi et al., 2009); grass cuttings
(Matshusa-Masithi et al., 2009); and mushroom compost and straw (Dann et al., 2009).
Although these substrate mixtures have shown to provide treatment and sustain SRB in the
laboratory environment to varying degrees, the underlying factors controlling success have not
been definitively determined. Thus, their suitability for application at full-scale field sites is not
guaranteed.
1.4 Crab shell as an alternative substrate for VFPs
The world’s market for seafood crustaceans, particularly shrimp, crab, and lobster, is
several million tons per year, of which 50% is discarded as shell waste (Gerente et al., 2007).
Crab shells contain carbon, nitrogen, and alkalinity in a complex matrix of chitin, protein, and
calcium carbonate, which could be utilized as an organic substrate for use within anaerobic
passive MIW treatment systems. Chitin, the world’s second most abundant naturally occurring
polysaccharide, and its deacetylated derivative, chitosan, have been explored for use in a variety
Page 23
9
of areas, including: pulp and paper mill waste treatment, medical bandages which accelerate
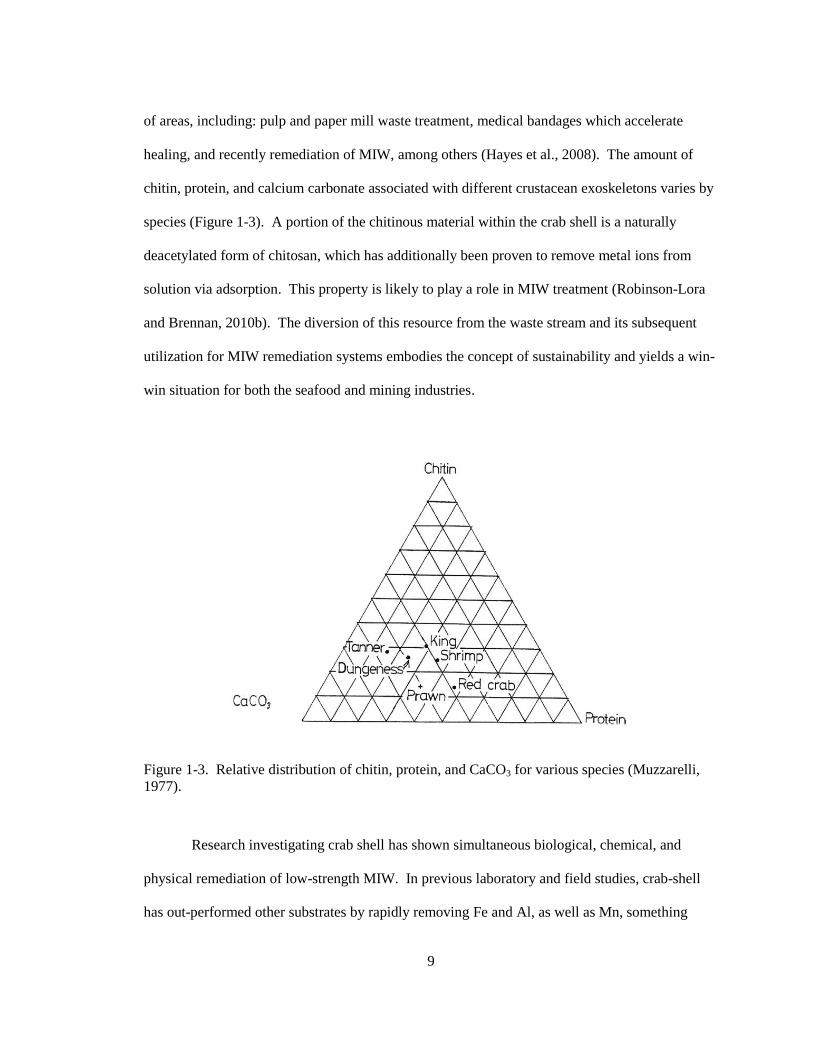
healing, and recently remediation of MIW, among others (Hayes et al., 2008). The amount of
chitin, protein, and calcium carbonate associated with different crustacean exoskeletons varies by
species (Figure 1-3). A portion of the chitinous material within the crab shell is a naturally
deacetylated form of chitosan, which has additionally been proven to remove metal ions from
solution via adsorption. This property is likely to play a role in MIW treatment (Robinson-Lora
and Brennan, 2010b). The diversion of this resource from the waste stream and its subsequent
utilization for MIW remediation systems embodies the concept of sustainability and yields a win-
win situation for both the seafood and mining industries.
Figure 1-3. Relative distribution of chitin, protein, and CaCO3 for various species (Muzzarelli,
1977).
Research investigating crab shell has shown simultaneous biological, chemical, and
physical remediation of low-strength MIW. In previous laboratory and field studies, crab-shell
has out-performed other substrates by rapidly removing Fe and Al, as well as Mn, something
Page 24
10
which other substrates have been unable to accomplish at circumneutral pH (Daubert and
Brennan, 2007; Venot et al., 2008; Robinson-Lora and Brennan, 2009; Robinson-Lora and
Brennan, 2010; Newcombe and Brennan, 2010). In addition, the integrated source of CaCO3 has
been proposed to negate the need for supplemental alkalinity sources, which could potentially
lower overall system costs. Most recently, it has been shown that crab shell mixed with SMC can
further decrease costs, as crab shell ($0.75/lb) is more expensive than other typical substrates
($0.025/lb) (Newcombe and Brennan, 2010). These results led to the suggestion that crab shell
could be utilized as a substrate amendment within the VFP of sites suffering from clogging due to
excessive metals concentrations and limited footprints.
1.5 Background of the Klondike-1 Site
Acidic discharges from the abandoned Klondike mine, located near Ashville, Pennsylvania, have
contributed to the impairment of the Little Laurel Run. This waterway is a tributary of Clearfield
Creek, whose waters eventually flow into the Chesapeake Bay. Two discrete discharges,
Klondike-1 and Klondike-2, were identified at the site, and through the efforts of the Clearfield
Creek Watershed Association (CCWA) funds were obtained to design and build a treatment
system for each discharge. The Klondike-1 discharge (located at 40° 33.117 N, 78° 29.798 W) is
located at the site of the original mine shaft entrance. This area was later strip-mined, and it is
believed that a section of the strip intersects a portion of the underground mine near this location.
Thus the water is likely a combination of water seeping from the original mine shaft as well as
seep from mine tailings left during the strip mining operations. Monitoring of the Klondike-1
discharge by the CCWA indicated an average Fe concentration of 141 mg/L, acidity of 417 mg/L
as CaCO3, Mn of 30 mg/L, pH 3.3, and flow rate of 15 gallons per minute (gpm) (Rose, 2008).
Sulfate concentrations for this discharge range from 700-1400 mg/L.
Page 25
11
The treatment system designed for the Klondike-1 discharge consisted of a primary
oxidation pond, VFP, an aerobic settling pond, and then a constructed wetland as a final polishing
step. Unfortunately, the depth of the limestone and compost layers were reduced from original
design parameters due to budget constraints. Construction was completed in November 2007, but
within 9 months the VFP had clogged due to a layer of Fe precipitates (orange layer in Figure
1-1) which formed on top of the organic substrate layer. The Fe precipitates were removed from
the VFP and two additional oxidation ponds were constructed at the beginning of the treatment
system to facilitate additional low-pH biological Fe oxidation. With the new oxidation pond
treatment cells, the system still does not meet effluent requirements for iron and acidity. Even
during optimal operating conditions the system was never able to sufficiently remove Mn from
the water, and thus was not capable of completely neutralizing acidity. In addition, the system has
the potential to clog again if these cells do not operate as designed.
1.6 Objectives of Current Study
The overarching goal of this research was to determine if high-strength MIW could successfully
be treated via anaerobic, biologically-mediated, passive treatment systems utilizing crab shell
substrate mixtures. Previous work investigating crab shell for the remediation of low-strength
MIW had only evaluated 100% crab shell and fractions of ≤ 50% (by mass) crab shell mixed with
SMC. Thus, the first objective of this research was to evaluate substrate mixtures containing 50-
100% crab shell to determine the optimal ratio of crab shell to SMC. As subsequent aeration had
not been investigated in coordination with crab shell substrates mixtures, the second objective of
this study was to determine the additional treatment efficiency afforded by passive aeration and
settling after the simulated VFP.
Page 26
12
Due to a very active watershed group with ties to the university, the Klondike-1 site was
identified as a local, high-strength MIW discharge. A secondary goal of this project became to
assist in solving a local problem by helping to provide data which could be used in guiding
decisions for a possible retro-fit of the existing failed system at the Klondike-1 site with an
organic substrate amendment in the near future. The main objective of this portion of the project
was to design and build a pilot-scale reactor to determine the effects, if any, of scale-up on the
treatment system while at the same time optimizing treatment conditions for the water quality
characteristics present at the Klondike-1 site.
Page 27
13
2. Materials and Methods
2.1 Water Source
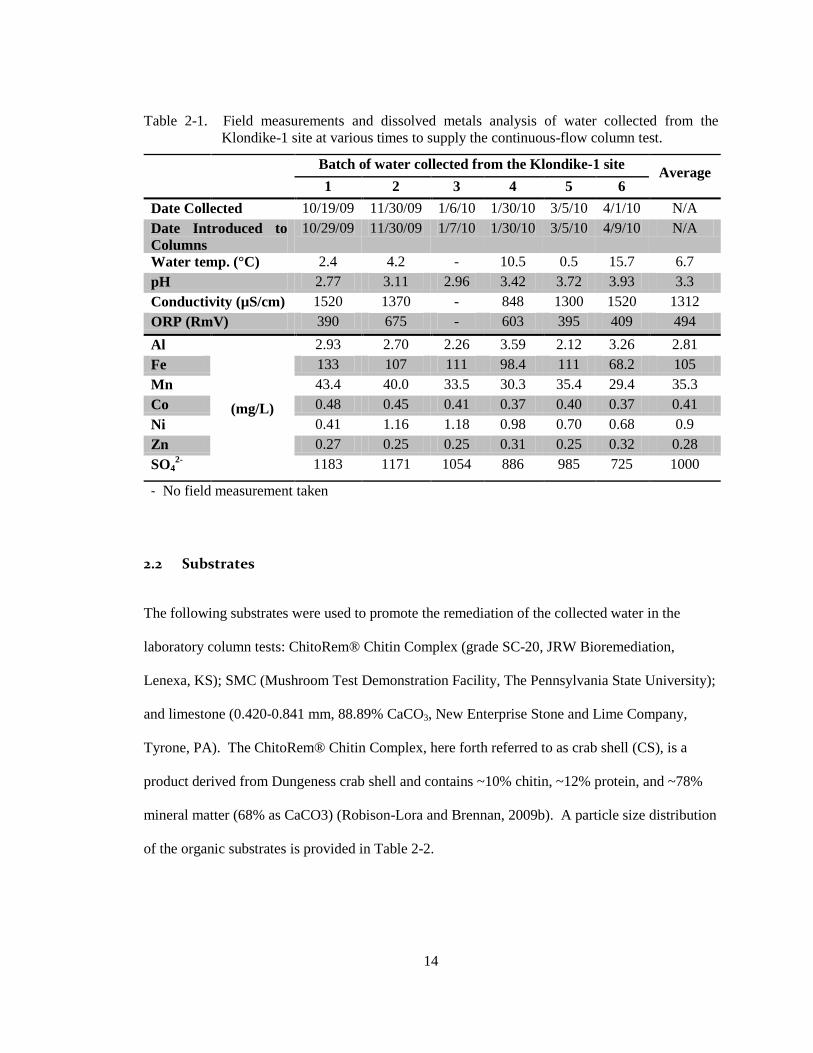
All water used for the continuous-flow column test was collected from the Klondike-1
site. Water was collected approximately 250 yards downstream from the point of emergence in a
non-stagnant, deep channel section of the discharge stream (40° 33.102 N, 78° 29.838 W). Water
was collected from this location six times throughout the duration of the continuous-flow test to
allow for a realistic fluctuation of water quality over varying environmental conditions
(temperature, rainfall, etc.) experienced at the site. When required, ice on the surface of the
channel was broken to obtain access to water beneath. Field measurements for temperature, pH,
conductivity, and oxidation reduction potential (ORP) were taken onsite (Table 2-1). ORP was
measured using an Oakton® Waterproof ORPTestr 10, and temperature, pH, and conductivity
were measured using an Oakton® Multi-Parameter Tester 35. Samples were also collected for
dissolved metals analysis (results provided in Table 2-1), which upon return to the laboratory
were subsequently filtered, preserved, and analyzed via the method described in section 2.4.
Flexible plastic tubing (1-inch diameter) and a hand pump were used to transfer the water
into high-density polyethylene containers (20 L jerry cans or 50 L carboys), which were capped
with minimal headspace. Immediately upon return to the lab, all water storage containers were
continuously purged with argon gas to maintain an anoxic environment and minimize Fe
oxidation. The influent water reservoirs were covered with opaque black plastic to prevent the
growth of phototrophic organisms (e.g., algae) that could potentially produce oxygen within the
system.
Page 28
14
Table 2-1. Field measurements and dissolved metals analysis of water collected from the
Klondike-1 site at various times to supply the continuous-flow column test.
Batch of water collected from the Klondike-1 site Average
1 2 3 4 5 6
Date Collected 10/19/09 11/30/09 1/6/10 1/30/10 3/5/10 4/1/10 N/A
Date Introduced to
Columns
10/29/09 11/30/09 1/7/10 1/30/10 3/5/10 4/9/10 N/A
Water temp. (°C) 2.4 4.2 - 10.5 0.5 15.7 6.7
pH 2.77 3.11 2.96 3.42 3.72 3.93 3.3
Conductivity (µS/cm) 1520 1370 - 848 1300 1520 1312
ORP (RmV) 390 675 - 603 395 409 494
Al
(mg/L)
2.93 2.70 2.26 3.59 2.12 3.26 2.81
Fe 133 107 111 98.4 111 68.2 105
Mn 43.4 40.0 33.5 30.3 35.4 29.4 35.3
Co 0.48 0.45 0.41 0.37 0.40 0.37 0.41
Ni 0.41 1.16 1.18 0.98 0.70 0.68 0.9
Zn 0.27 0.25 0.25 0.31 0.25 0.32 0.28
SO42-
1183 1171 1054 886 985 725 1000
- No field measurement taken
2.2 Substrates
The following substrates were used to promote the remediation of the collected water in the
laboratory column tests: ChitoRem® Chitin Complex (grade SC-20, JRW Bioremediation,
Lenexa, KS); SMC (Mushroom Test Demonstration Facility, The Pennsylvania State University);
and limestone (0.420-0.841 mm, 88.89% CaCO3, New Enterprise Stone and Lime Company,
Tyrone, PA). The ChitoRem® Chitin Complex, here forth referred to as crab shell (CS), is a
product derived from Dungeness crab shell and contains ~10% chitin, ~12% protein, and ~78%
mineral matter (68% as CaCO3) (Robison-Lora and Brennan, 2009b). A particle size distribution
of the organic substrates is provided in Table 2-2.
Page 29
15
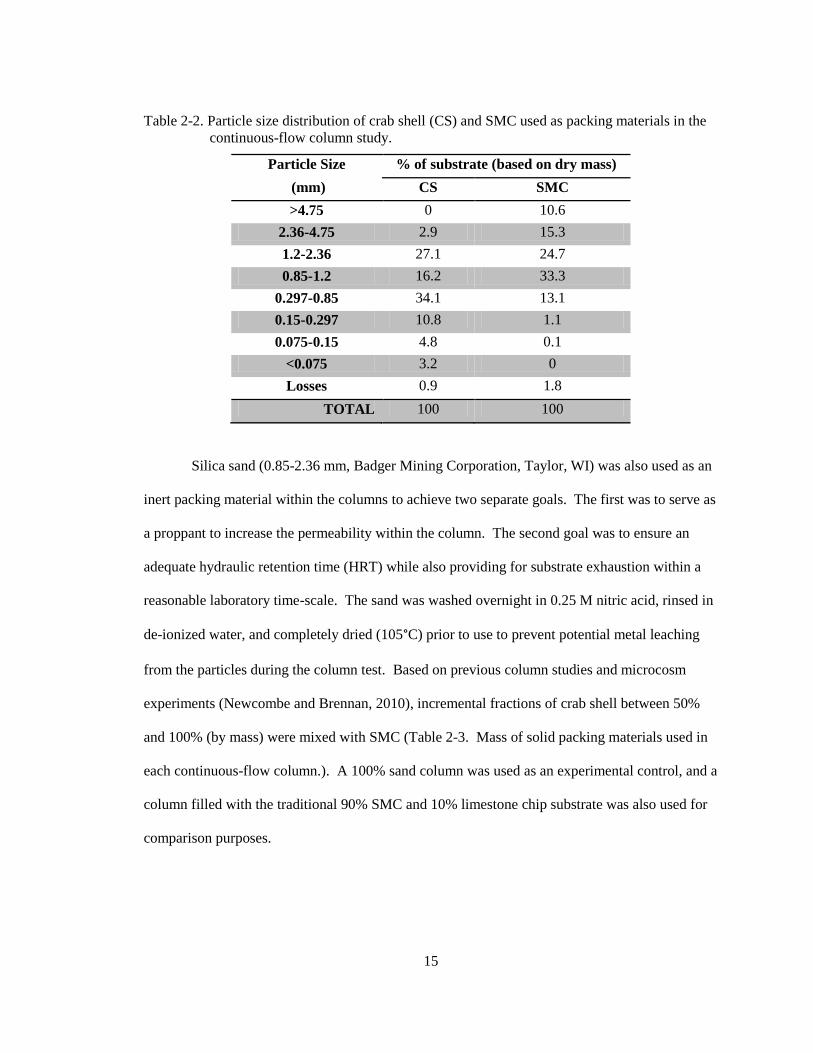
Table 2-2. Particle size distribution of crab shell (CS) and SMC used as packing materials in the
continuous-flow column study.
Particle Size % of substrate (based on dry mass)
(mm) CS SMC
>4.75 0 10.6
2.36-4.75 2.9 15.3
1.2-2.36 27.1 24.7
0.85-1.2 16.2 33.3
0.297-0.85 34.1 13.1
0.15-0.297 10.8 1.1
0.075-0.15 4.8 0.1
<0.075 3.2 0
Losses 0.9 1.8
TOTAL 100 100
Silica sand (0.85-2.36 mm, Badger Mining Corporation, Taylor, WI) was also used as an
inert packing material within the columns to achieve two separate goals. The first was to serve as
a proppant to increase the permeability within the column. The second goal was to ensure an
adequate hydraulic retention time (HRT) while also providing for substrate exhaustion within a
reasonable laboratory time-scale. The sand was washed overnight in 0.25 M nitric acid, rinsed in
de-ionized water, and completely dried (105°C) prior to use to prevent potential metal leaching
from the particles during the column test. Based on previous column studies and microcosm
experiments (Newcombe and Brennan, 2010), incremental fractions of crab shell between 50%
and 100% (by mass) were mixed with SMC (Table 2-3. Mass of solid packing materials used in
each continuous-flow column.). A 100% sand column was used as an experimental control, and a
column filled with the traditional 90% SMC and 10% limestone chip substrate was also used for
comparison purposes.
Page 30
16
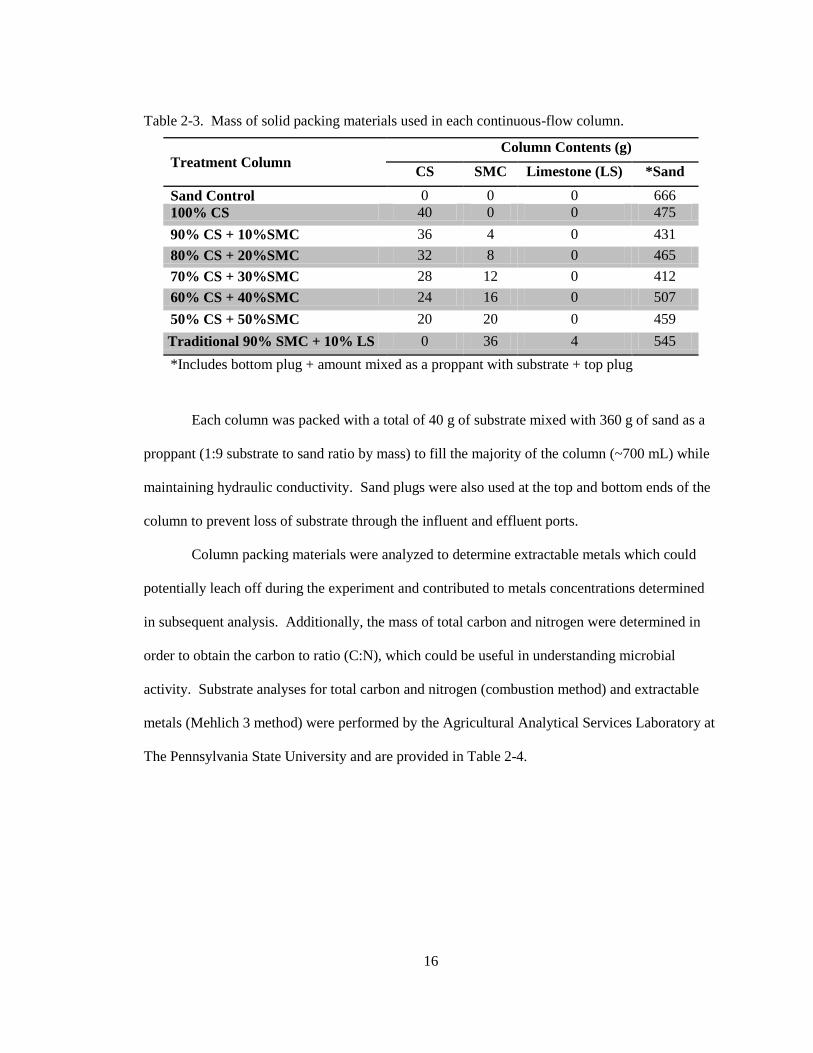
Table 2-3. Mass of solid packing materials used in each continuous-flow column.
Treatment Column Column Contents (g)
CS SMC Limestone (LS) *Sand
Sand Control 0 0 0 666
100% CS 40 0 0 475
90% CS + 10%SMC 36 4 0 431
80% CS + 20%SMC 32 8 0 465
70% CS + 30%SMC 28 12 0 412
60% CS + 40%SMC 24 16 0 507
50% CS + 50%SMC 20 20 0 459
Traditional 90% SMC + 10% LS 0 36 4 545
*Includes bottom plug + amount mixed as a proppant with substrate + top plug
Each column was packed with a total of 40 g of substrate mixed with 360 g of sand as a
proppant (1:9 substrate to sand ratio by mass) to fill the majority of the column (~700 mL) while
maintaining hydraulic conductivity. Sand plugs were also used at the top and bottom ends of the
column to prevent loss of substrate through the influent and effluent ports.
Column packing materials were analyzed to determine extractable metals which could
potentially leach off during the experiment and contributed to metals concentrations determined
in subsequent analysis. Additionally, the mass of total carbon and nitrogen were determined in
order to obtain the carbon to ratio (C:N), which could be useful in understanding microbial
activity. Substrate analyses for total carbon and nitrogen (combustion method) and extractable
metals (Mehlich 3 method) were performed by the Agricultural Analytical Services Laboratory at
The Pennsylvania State University and are provided in Table 2-4.
Page 31
17
Table 2-4. Extractible metals and compost analysis of the continuous-flow column packing
materials.
Analyte Crab
Shell
SMC Limestone Sand
Extractable Metals – Mehlich 3 method (reported as mg/kg)
Al BDL 4.48 BDL 9.42
Ca 28,300 24,600 36,600 176
Co BDL BDL BDL BDL
Fe 8.13 70.1 24.5 3.39
K 3020 10,900 26.2 11.0
Mg 2,120 1,700 325 14.6
Mn 44.1 49.1 5.31 1.89
Na 10,800 732 38.0 46.5
P 2,530 907 3.18 4.92
S 1,220 4,500 12.5 5.13
Zn 38.8 28.9 0.533 0.309
Compost Analysis – combustion method (reported on "as is" basis)
pH 8.5 7.7 - -
Organic Matter (%) 42.1 19.8 - -
Nitrogen (%) 4.7 0.6 - -
Carbon (%) 23.9 11.7 - -
Carbon: Nitrogen Ratio 5 21 - -
Calcium Carbonate Equivalence (%) 35.9 10.1 88.9 -
BDL – Below detection limit
Sediment inoculants were deemed unnecessary based off previous work indicating that the
substrate alone provides sufficient bacteria to initiate growth of a microbial consortium diverse
enough to support sulfate reduction (Christensen et al., 1996; Newcombe and Brennan, 2010).
Instead, columns were packed in a non-sterile environment and provided an 8-day incubation
period prior to the initiation of continuous-flow conditions to promote establishment of the
indigenous microbial community.
Page 32
18
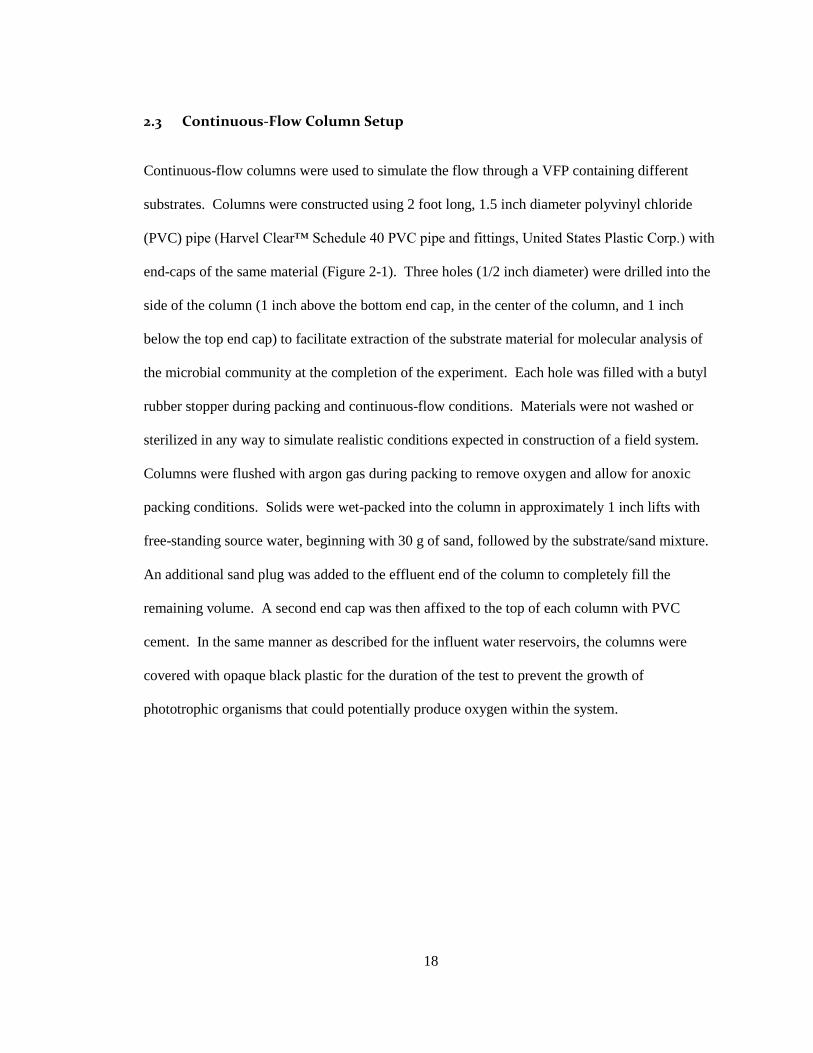
2.3 Continuous-Flow Column Setup
Continuous-flow columns were used to simulate the flow through a VFP containing different
substrates. Columns were constructed using 2 foot long, 1.5 inch diameter polyvinyl chloride
(PVC) pipe (Harvel Clear™ Schedule 40 PVC pipe and fittings, United States Plastic Corp.) with
end-caps of the same material (Figure 2-1). Three holes (1/2 inch diameter) were drilled into the
side of the column (1 inch above the bottom end cap, in the center of the column, and 1 inch
below the top end cap) to facilitate extraction of the substrate material for molecular analysis of
the microbial community at the completion of the experiment. Each hole was filled with a butyl
rubber stopper during packing and continuous-flow conditions. Materials were not washed or
sterilized in any way to simulate realistic conditions expected in construction of a field system.
Columns were flushed with argon gas during packing to remove oxygen and allow for anoxic
packing conditions. Solids were wet-packed into the column in approximately 1 inch lifts with
free-standing source water, beginning with 30 g of sand, followed by the substrate/sand mixture.
An additional sand plug was added to the effluent end of the column to completely fill the
remaining volume. A second end cap was then affixed to the top of each column with PVC
cement. In the same manner as described for the influent water reservoirs, the columns were
covered with opaque black plastic for the duration of the test to prevent the growth of
phototrophic organisms that could potentially produce oxygen within the system.
Page 33
19
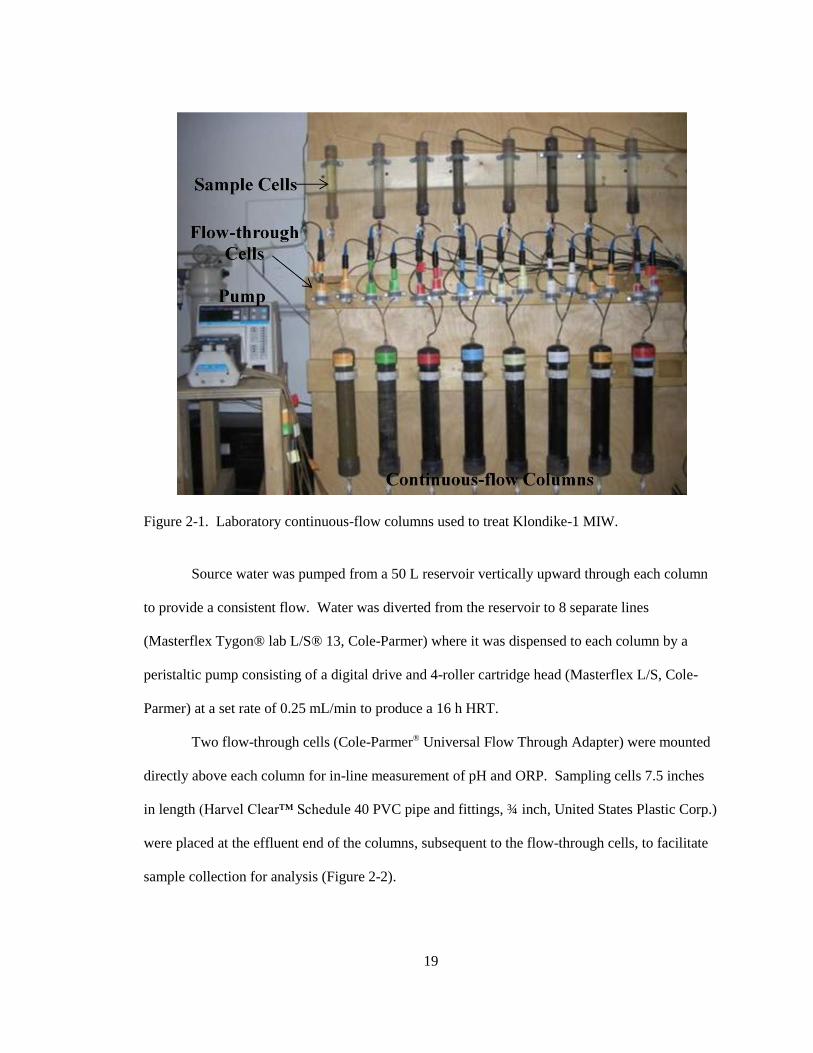
Figure 2-1. Laboratory continuous-flow columns used to treat Klondike-1 MIW.
Source water was pumped from a 50 L reservoir vertically upward through each column
to provide a consistent flow. Water was diverted from the reservoir to 8 separate lines
(Masterflex Tygon® lab L/S® 13, Cole-Parmer) where it was dispensed to each column by a
peristaltic pump consisting of a digital drive and 4-roller cartridge head (Masterflex L/S, Cole-
Parmer) at a set rate of 0.25 mL/min to produce a 16 h HRT.
Two flow-through cells (Cole-Parmer® Universal Flow Through Adapter) were mounted
directly above each column for in-line measurement of pH and ORP. Sampling cells 7.5 inches
in length (Harvel Clear™ Schedule 40 PVC pipe and fittings, ¾ inch, United States Plastic Corp.)
were placed at the effluent end of the columns, subsequent to the flow-through cells, to facilitate
sample collection for analysis (Figure 2-2).
Page 34
20
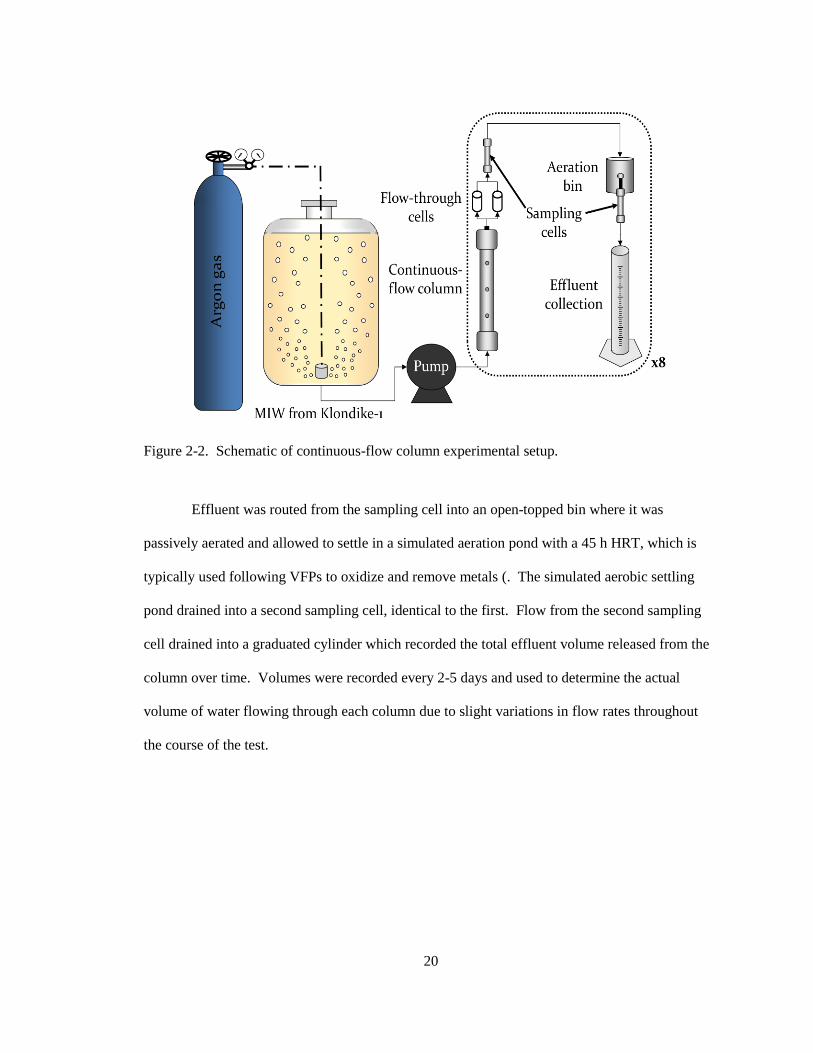
Figure 2-2. Schematic of continuous-flow column experimental setup.
Effluent was routed from the sampling cell into an open-topped bin where it was
passively aerated and allowed to settle in a simulated aeration pond with a 45 h HRT, which is
typically used following VFPs to oxidize and remove metals (. The simulated aerobic settling
pond drained into a second sampling cell, identical to the first. Flow from the second sampling
cell drained into a graduated cylinder which recorded the total effluent volume released from the
column over time. Volumes were recorded every 2-5 days and used to determine the actual
volume of water flowing through each column due to slight variations in flow rates throughout
the course of the test.
Page 35
21
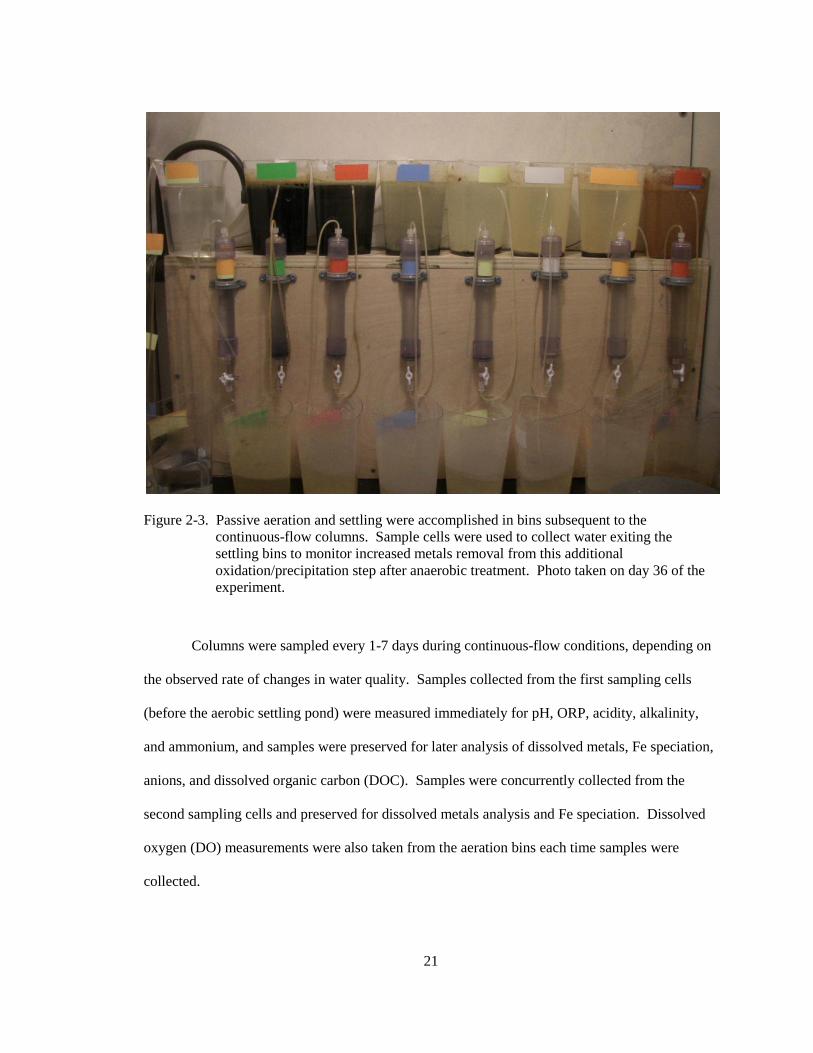
Figure 2-3. Passive aeration and settling were accomplished in bins subsequent to the
continuous-flow columns. Sample cells were used to collect water exiting the
settling bins to monitor increased metals removal from this additional
oxidation/precipitation step after anaerobic treatment. Photo taken on day 36 of the
experiment.
Columns were sampled every 1-7 days during continuous-flow conditions, depending on
the observed rate of changes in water quality. Samples collected from the first sampling cells
(before the aerobic settling pond) were measured immediately for pH, ORP, acidity, alkalinity,
and ammonium, and samples were preserved for later analysis of dissolved metals, Fe speciation,
anions, and dissolved organic carbon (DOC). Samples were concurrently collected from the
second sampling cells and preserved for dissolved metals analysis and Fe speciation. Dissolved
oxygen (DO) measurements were also taken from the aeration bins each time samples were
collected.
Page 36
22
The columns were designed based on previous research which indicated that 1g of crab
shell had the capacity to treat 1 L of MIW (Robinson-Lora, 2009). Based off this assumption, the
columns were designed to last 116 days before alkalinity exhaustion. However, the substrate
lasted longer than anticipated and the experiment was run for 181 days to ensure complete
exhaustion.
The 6-month column study was conducted in collaboration with another student (Bradley
Sick, Undergraduate Honors Student) and weekly sample analysis was conducted jointly.
Bradley Sick collected and analyzed samples from the sand control, 90% CS + 10% SMC, 70%
CS + 30% SMC, and 50% CS + 50% SMC columns. I collected and analyzed samples from the
100% CS, 80% CS + 20% SMC, 60% CS + 40% SMC, and 90% SMC + 10% limestone columns.
Analysis of anions, DOC, and Fe speciation was also completed by the author.
2.4 Analytical Methods
pH was measured on samples extracted from the sampling cell using a bench-top electrode
(Thermo-ORION) connected to a pH/mV meter (Accumet® Basic AB15, Fisher Scientific). The
pH electrode was calibrated using standard 4.0, 7.0, and 10.0 buffers. Ammonium was also
measured using an electrode (ISE ORION 9512) and the same pH/mV meter, and compared to 1
mg/L and 10 mg/L ammonium standards. DO was measured with an Accumet® Research AR40
meter and a self-stirring BOD probe (Fisher Scientific). Acidity and alkalinity were measured
using titrations as described in Standard Methods for the Examination of Water of Wastewater
(Methods 2310 and 2320; APHA 1998). Endpoints used for these titrations were pH 4.5 for
alkalinity and pH 8.3 for acidity. pH, ammonium, acidity, and alkalinity were all measured
within 4 hours of sample collection.
Page 37
23
Samples were prepared for dissolved metals analysis by filtering with a 0.45µm filter,
acidifying to pH < 2 with 60-70% HNO3, and sparging with lab air through a 25 gauge needle for
5 minutes (to drive off hydrogen sulfide). These samples were sent to the Pennsylvania State
University Materials Characterization Laboratory to be measured using inductively coupled
plasma-atomic emission spectroscopy (ICP-AES; Leeman Labs PS300UV).
DOC was analyzed using a total organic carbon analyzer (TOC-V CSN, Shimadzu).
Samples for DOC analysis were pretreated with a 0.45µm filter and diluted when necessary to
achieve a minimum sample volume or when salts were determined to exceed the instrument
threshold. Due to the expected high concentrations of volatile fatty acids, the most accurate
method (non-purgeable organic carbon method) for the instrument could not be used. Instead,
total carbon and inorganic carbon were measured separately and the organic carbon was
calculated as the difference between these two measurements. Inorganic carbon analysis was
conducted using a setting of 1.5% acid (2N hydrochloric acid) with a sparge time of 1.0 minutes.
2.5 Conservative Tracer Tests
Conservative (non-partitioning) tracer tests were performed on each column using sodium
chloride to determine the pore volume and also the HRT. A minimum mass for the chloride slug
(mtracer, mg) was calculated using Equation 2-1, where tr is the estimated HRT (min) of the
column, QL is the column flow rate (L/min), and MDL is the method detection limit (mg/L) of
chloride on the IC.
Eq. 2-1
Using an anticipated retention time of 16 hr, a nominal flow rate of 0.0002 L/min, and a
MDL for chloride of 1 mg/L, the calculated minimum tracer mass was 19.2 mg chloride. The
tracer solution was prepared by dissolving 412 mg sodium chloride in 20 mL deionized water. A
Page 38
24
volume of 2 mL of this tracer solution (25 mg chloride) was injected through the influent port of
each column.
Page 39
25
3. Continuous-flow column laboratory experiment
The continuous-flow column experiment was conducted in a controlled laboratory
setting from October 2009 until May 2010 (181 days).
3.1 Source Water
In addition to field measurements, water quality parameters were measured regularly
from the Klondike-1 water as it was supplied to the continuous-flow columns. At each sampling
point throughout the test, analysis for pH, alkalinity, acidity, DOC, sulfate, and dissolved metals
were measured. Averages over the course of the experiment were calculated and can be found in
Table 3-1. The average pH and dissolved Fe concentrations are noticeably lower than that
observed in the field when source water was collected (Table 2-1). This is likely caused by the
precipitation of Fe3+
species present in the water. Recalling Eq. 1-4, the precipitation of ―yellow-
boy‖ reduces dissolved Fe and also lowers the pH. Orange-yellow precipitates were noted in the
bottom of the source water storage containers in the laboratory, providing further evidence for
this hypothesis. In addition, it was noted that dissolved Fe concentrations of the influent water
decreased over time as it was maintained within water storage containers in the laboratory. This
indicates the possible continued oxidation of Fe2+
, which could be a result abiotic heterogeneous
Fe2+
oxidation.
Page 40
26
Table 3-1. Average water quality parameters (taken weekly for the duration of the experiment) of
continuous-flow column influent.
Parameter Influent water average
pH 2.54 ± 0.14
Alkalinity (mg/L as CaCO3) 0
Acidity (mg/L as CaCO3) 330 ± 76
Al (mg/L) 2.73 ± 0.42
Fe (mg/L) 62.3 ± 21
Mn (mg/L) 36.2 ± 5.6
Co (mg/L) 0.42 ± 0.05
Ni (mg/L) 0.92 ± 0.38
Zn (mg/L) 0.26 ± 0.03
SO42-
(mg/L) 994 ± 180
Dissolved organic carbon (mg/L) 2.75 ± 1.4
3.2 Conservative Tracer Tests
Tracer tests were performed near the end of the experiment in order not to disturb the microbial
community and potentially influence treatment performance. Between April 17, 2010, and May
3, 2010, tracer tests were completed on all columns, except the sand control which was completed
approximately one month earlier.
Tracer test results were used to estimate the HRT, which was then used to calculate the
dispersion number and the effective pore volume of each experimental column. HRT and
effective PV varied considerably between columns (Table 3-2). Based on the calculated
dispersion numbers, all columns exhibited low dispersion (d<0.05) flow characteristics except the
sand control, which was classified as moderate dispersion. Additional detail on the calculations
used and tracer curves can be found in Appendix A. Tracer tests were used to present the data
more accurately, by allowing a comparison among columns based upon the volume of water
Page 41
27
treated as opposed to comparing systems at different time points, when flow might not have been
consistent.
Table 3-2. Flow characteristics of continuous-flow columns treating Klondike-1 MIW, measured
using tracer tests at the completion of the 181-day experiment.
Treatment Column
Dispersion
number
Calculated
effective
pore volume
Flow rate
during
tracer test
Hydraulic
retention time
(mL) (mL/min) (hr)
Sand Control 0.065 190.5 0.300 10.6
100% CS 0.041 275.9 0.261 17.6
90% CS + 10% SMC 0.035 260.4 0.252 17.2
80% CS + 20% SMC 0.039 296.8 0.269 18.4
70% CS + 30% SMC 0.026 246.8 0.253 16.3
60% CS + 40% SMC 0.045 216.7 0.282 12.8
50% CS + 50% SMC 0.027 223.6 0.273 13.6
Traditional 90% SMC + 10% LS 0.022 221.1 0.284 13.0
3.3 pH, Alkalinity and Acidity
Measurements for pH were taken using a bench top electrode on samples collected from the
effluent sample cell, and also using in-line electrodes mounted in flow-through cells near the
column effluent port (Figure 2-2). As expected, measurements from the in-line electrodes were
slightly lower, but mirrored trends noted with the bench top electrode, with the exception of the
100% CS column (see Appendix B). Increased pH was expected in samples extracted from the
anoxic column environment when biologically-produced CO2 was partitioned into the air from
the effluent water. As bench-top analysis was conducted quickly upon effluent water extraction
from the sample cell, a large difference was not noted. Results provided below are from the
bench top electrode only.
All treatments increased the pH of the water from influent values (average pH 2.54) to
above 6.0. Columns containing any fraction of crab shell maintained pH above 5.0 longer than
Page 42
28
the traditional substrate (90% SMC + 10% LS), which was only able to sustain this level of
treatment for 70 days (80 PV). The 100%, 90%, and 70% crab shell columns all maintained pH
above 5.0 for almost twice as long as the traditional substrate (Table 3-3). Results in Table 3-3
also indicate reduced performance of the 60% and 80% crab shell columns. Within the first four
weeks of the experiment, both of these columns experienced oxygen intrusions within the
column. This occurred due to three-way valves being left in the wrong position after sampling
which led to a pressure build-up within the column. The pressure was eventually released by the
ejection of a butyl rubber stopper from the side of the column. On both instances, this occurred
over night and was not found until the next morning. However, over the course of the night,
water had drained from the column above the point of the hole and had also been pumping out of
the open hole in the side of the column. This likely led to the disruption of the anaerobic
microbial consortium, which affected subsequent decreases in treatment capacity. Due to these
circumstances, the 60% and 80% crab shell columns are not considered to adequately portray
expected treatment efficiencies under normal conditions.
Table 3-3. Maximum pH and duration of neutralization capacity achieved using different
substrates to treat Klondike-1 MIW in the continuous-flow column experiment.
Treatment Column Max.
pH
pH sustained
above 5.0
pH returned to
influent value
PV (days) PV (days)
Sand Control 2.64 0 (0) 0
100% CS 7.62 141 (146) 176+ (180+)
90% CS + 10% SMC 7.26 131 (117) 199+ (180+)
80% CS + 20% SMC 7.26 95 (104) 137 (153)
70% CS + 30% SMC 7.16 137 (124) 195+ (180+)
60% CS + 40% SMC 7.34 108 (90) 196 (160)
50% CS + 50% SMC 7.15 114 (96) 161 (132)
Traditional 90% SMC + 10% LS 6.38 79 (70) 116 (97)
+ indicates value when the experiment ended, thus the potential for additional treatment
capacity
Page 43
29
Sufficient alkalinity was generated in all treatments to completely neutralize the acidity
present in the influent water (average 329 mg/L as CaCO3) from the onset of continuous-flow
conditions (Figure 3-1). The column containing the traditional substrate mixture achieved a
maximum alkalinity generation of 260 mg/L as CaCO3 at the first sampling point following an
eight day incubation period whereas columns containing any fraction of crab shell substrate
produced significantly higher alkalinity initially, with maximum concentrations near 5,800 mg/L
(not shown). Columns containing crab shell were able to maintain net alkaline conditions for
longer than the traditional treatment substrate, nearly twice as long for the 100%, 90%, and 70%
crab shell columns.
Page 44
30
Figure 3-1. Alkalinity generation and acidity data from continuous-flow columns treating MIW
from the Klondike-1 site.
-1000
-800
-600
-400
-200
0
200
400
0 50 100 150 200
Ac
idit
y (m
g/L
as
Ca
CO
3)
Pore Volumes
0
200
400
600
800
1000
0 50 100 150 200
Alk
alin
ity (m
g/L
as
Ca
CO
3)
Inf luent
Sand Control
100% CS
90% CS + 10% SMC
80% CS + 20% SMC
70% CS + 30% SMC
60% CS + 40% SMC
50% CS + 50% SMC
Traditional 90% SMC + 10% LS
B
A
Page 45
31
3.4 Metals Removal
Dissolved metals were monitored at two locations: in the effluent of the continuous-flow column
and also after passive aeration and settling. The following breakthrough curves render data in the
form of normalized concentrations, defined as the measured concentration divided by the inlet
concentration (
, plotted against PV of water treated. Normalized concentrations are used to
negate the effects of fluctuations in influent water quality, which occurred due to seasonal
changes at the Klondike-1 site and also due to the precipitation of Fe in the source water
container. In addition, normalized curves provide an easy assessment of treatment efficiency as
a normalized concentration of zero represents 100% treatment efficiency (100% removal) with a
decrease in treatment efficiency realized as normalized concentrations approach 1.0 (0%
removal). Normalized concentrations greater than one indicate that the columns were adding
elements to the water. This was likely caused by desorption and re-suspension of adsorbed metal
precipitates once the pH dropped below that corresponding to minimum solubility for the
respective precipitate. For the results and discussion to follow, breakthrough is defined as
effluent concentration exceeding 50% of the influent concentration (corresponding to 0.5 on the
normalized concentration plot).
3.4.1 Primary Metals
Data for dissolved Al (average influent concentration of 2.67 mg/L) presents very clear
breakthrough curves, which appear to be dependent on pH (Figure 3-2). Dissolved Al was
completely removed by all treatment columns until ~70 PV when the treatment capacity of the
traditional substrate became exhausted. Figure 3-2A reveals that columns containing 70%, 90%
and 100% crab shell lasted twice as long as the traditional substrate before exhaustion of Al
Page 46
32
treatment capacity. Dissolved Al concentrations measured after passive aeration and settling
were very similar to those measured in the column effluent, indicating that contact with oxygen in
the settling pond does not affect the removal of Al (see Appendix C). In addition, results from
the sand control column (normalized concentration =1) suggest that any Al removal was caused
by the treatment substrate mixture and not other experimental conditions.
Figure 3-2. Breakthrough curves for dissolved Al (A) and pH measurements (B) taken after
continuous-flow columns treating Klondike-1 MIW.
2
3
4
5
6
7
8
0 50 100 150 200
pH
Pore Volumes
0
1
2
3
4
5
6
7
8
9
10
0 50 100 150 200
Al (C
/C0)
Sand Control
100% CS
90% CS + 10% SMC
80% CS + 20% SMC
70% CS + 30% SMC
60% CS + 40% SMC
50% CS + 50% SMC
Traditional 90% SMC + 10% LS
B
A
Page 47
33
Results from the column effluent show that Fe (average influent concentration of 62.6
mg/L) was partially removed within the column substrate for all treatment columns (Figure
3-3A). Some substrate mixtures achieved complete removal (all except Sand Control, 100% CS,
and Traditional 90% SMC + 10% LS), however this trend is not consistent past 25 PV in any of
the columns (Figure 3-3A). In comparison, Fe removal subsequent to passive aeration and
settling was sustained significantly longer. Breakthrough (to 50% of influent concentration) of
dissolved Fe after the settling ponds occurred at approximately 95 PV for the traditional substrate,
and did not occur until ~150 PV for the majority of the columns containing any amount of crab
shell (Figure 3-3B). Figure 3-3A also reveals that the sand column was affording some removal
of dissolved Fe (normalized concentration <1), indicative of experimental conditions playing a
role in Fe removal.
Page 48
34
Figure 3-3. Breakthrough curves for dissolved Fe measured after continuous-flow columns
treating Klondike-1 MIW (A) and after subsequent passive aeration and settling (B).
0.0
0.5
1.0
1.5
2.0
2.5
0 50 100 150 200
Fe
(C
/C0)
Pore Volumes
B
0.0
0.5
1.0
1.5
2.0
2.5
0 50 100 150 200
Fe
(C
/C0)
Sand Control 100% CS90% CS + 10% SMC 80% CS + 20% SMC70% CS + 30% SMC 60% CS + 40% SMC50% CS + 50% SMC Traditional 90% SMC + 10% LS
A
Page 49
35
Removal of dissolved Mn (average influent concentration of 36.1 mg/L) occurred over a
much shorter time. The traditional substrate reached breakthrough (to 50% of influent
concentrations) within 5 PV as compared to the columns containing any amount of crab shell
which lasted from 10-17 PV. The column containing 100% crab shell was able to sustain partial
removal (normalized concentration <1.0) of Mn for up to 54 PV, over five times longer than the
traditional substrate which exhausted within 10 PV. Dissolved Mn concentrations measured after
passive aeration and settling were very similar to those measured in the column effluent, with a
minor shift to the right (increased PV) likely caused by the time required for the water to pass
from the first sampling cell to the second at the given flow rate (see Appendix C). In addition,
results from the sand control column (normalized concentration =1) suggest that any Mn removal
was truly caused by the treatment substrate mixture, not experimental conditions.
Figure 3-4. Breakthrough curves for dissolved Mn measured after continuous-flow columns
treating Klondike-1 MIW.
0.0
0.2
0.4
0.6
0.8
1.0
1.2
1.4
1.6
0 50 100 150 200
Mn
(C
/C0)
Pore Volumes
Sand Control
100% CS
90% CS + 10% SMC
80% CS + 20% SMC
70% CS + 30% SMC
60% CS + 40% SMC
50% CS + 50% SMC
Traditional 90% SMC + 10% LS
Page 50
36
3.4.2 Trace Metals
The breakthrough curves for cobalt (average influent concentration of 0.42 mg/L) and zinc are
similar to those presented for Al (Figure 3-5 and Figure 3-2) with respect to the time (PV) at
which breakthrough occurred. Each column appears to reach complete breakthrough at similar
PVs in the three plots. From the breakthrough curves presented, it appears that dissolved zinc is
not well removed within the treatment columns. However, the appearance of low removal
efficiency (normalized concentration >0.5) is caused by low concentrations of zinc in the source
water (average concentration of 0.26 mg/L) coupled with low detection limits for the analytical
method (0.20 mg/L). All raw data indicating concentrations below the detection limit were
reported as 0.20 mg/L, thus the lowest achievable normalized concentration would be 0.77
(calculated as
.
Page 51
37
Figure 3-5. Breakthrough curves for dissolved cobalt (A) and zinc (B) measured after
continuous-flow columns treating Klondike-1 MIW.
Complete nickel removal was not achieved during the continuous-flow column
experiment. However, approximately 35% removal efficiency was maintained for a considerable
period in all of the treatments, with a decrease in removal efficiency occurring first in the
0.0
1.0
2.0
3.0
4.0
5.0
6.0
7.0
0 50 100 150 200
Zn
(C
/C0)
Pore Volumes
Sand Control100% CS90% CS + 10% SMC80% CS + 20% SMC70% CS + 30% SMC60% CS + 40% SMC50% CS + 50% SMCTraditional 90% SMC + 10% LS
0.0
0.2
0.4
0.6
0.8
1.0
1.2
1.4
1.6
1.8
2.0
0 50 100 150 200
Co
(C
/C0)
B
A
Page 52
38
traditional substrate at around 50 PV (Figure 3-6). Treatment substrates containing any fraction
of crab shell maintained 35% removal efficiency for 100 PV (80% CS + 20% SMC, 60% CS +
40% SMC, and 50% CS + 50% SMC columns) up to 150 PV (100% CS, 90% CS + 10% SMC,
and 70% CS + 30% SMC columns).
Figure 3-6. Breakthrough curves for dissolved nickel measured after continuous-flow columns
treating Klondike-1 MIW.
0.0
0.2
0.4
0.6
0.8
1.0
1.2
1.4
1.6
1.8
2.0
0 50 100 150 200
Ni (C
/C0)
Pore Volumes
Sand Control 100% CS
90% CS + 10% SMC 80% CS + 20% SMC
70% CS + 30% SMC 60% CS + 40% SMC
50% CS + 50% SMC Traditional 90% SMC + 10% LS
Page 53
39
3.5 Sulfate Reduction
Sulfate was monitored via two separate analytical methods, IC and ICP, which yielded similar
results, indicating almost no sulfate reduction was occurring within the treatment columns.
However, within days of initiation of continuous-flow conditions, visual inspection of the
columns showed black precipitates in all except the sand control column. These black
precipitates remained within the columns for the duration of the experiment (Figure 3-7).
Figure 3-7. Experimental columns photographed after 84 days of continuous-flow conditions
with Klondike-1 MIW. Note black precipitates which formed in all except the sand
control column. The remaining four treatment columns (not shown) also displayed
the formation of black precipitates.
100% CS 90% CS 80% CSSand
Page 54
40
Black precipitates can be indicative of metal sulfide precipitation, and thus imply a
reduced sulfur species could have been present within the columns and also in the effluent water.
Sulfate data, and a discussion on possible complications leading to inaccurate results, is included
in Appendix D.
3.6 Carbon and Nitrogen Species
Carbon and nitrogen are among a few key nutrients required by microorganisms to sustain sulfate
reduction. If excess polymeric substrate (chitin or cellulose) is hydrolyzed and fermented, carbon
and nitrogen can be released from the system into the effluent water and potentially negatively
affect downstream water quality. DOC was measured at each sampling point (Figure 3-8).
Maximum DOC concentrations for each column were observed immediately following a week-
long incubation period (Figure 3-8 inset). While the average DOC in the influent water was 2.75
mg/L, the traditional SMC-limestone substrate reached a maximum of 330mg/L, and the 100%
CS column reached a maximum of 5300 mg/L.
Page 55
41
Figure 3-8. Dissolved organic carbon measured in column effluent during continuous-flow
column test treating MIW from the Klondike-1 site. Inset graph shows maximum
values achieved at beginning of experiment.
Similar to the trend noted with DOC, maximum ammonium concentrations were also
measured immediately following incubation for each column (Figure 3-9). The crab shell
columns achieved ammonium concentrations (28.4-32.9 mg/L NH4+-N) nearly three times as high
as that achieved in the traditional SMC and limestone substrate column (11.9 mg/L NH4+-N).
0
5
10
15
20
25
30
35
40
45
50
0 50 100 150 200
DO
C (
mg
/L)
Pore Volumes
Influent
Sand Control
100% CS
90% CS + 10% SMC
80% CS + 20% SMC
70% CS + 30% SMC
60% CS + 40% SMC
50% CS + 50% SMC
Traditional 90% SMC + 10% LS
0
1,000
2,000
3,000
4,000
5,000
0 5 10
DO
C (
mg
/L)
Pore Volumes
Page 56
42
Figure 3-9. Ammonium measured from column effluent during continuous-flow column test
treating MIW from the Klondike-1 site.
3.7 Other Cations
Crab shell substrate sold commercially for remediation purposes contains a considerable amount
of fines as shown in the particle distribution analysis (Table 2-2). These fines are beneficial as
they provide a high surface area for increased dissolution of calcium carbonate and other nutrients
which initiate several processes in newly installed systems, including the stimulation of the
microbial community. However, during initial start-up of treatment systems containing crab
shell, high concentrations of cations have been noted (Robinson-Lora and Brennan, 2010a). After
the fines are dissolved and/or flushed out of the system, a steady-state condition is achieved
within the treatment system and concentrations stabilize (data plots provided in Appendix E).
High concentrations of some minerals or mineral salts could be of concern to aquatic ecosystems
when being released into natural waterways. In order to determine the risk associated with these
0
5
10
15
20
25
30
35
0 50 100 150 200
Am
mo
niu
m (
mg
/L N
H4+-
N )
Pore Volumes
Influent
Sand Control
100% CS
90% CS + 10%SMC
80% CS + 20%SMC
70% CS + 30%SMC
60% CS + 40%SMC
50% CS + 50%SMC
Traditional 90%SMC + 10% LS
Page 57
43
mineral salts, calcium (Ca), potassium (K), magnesium (Mg), sodium (Na), and phosphorous (P)
were monitored during the course of the continuous-flow column experiment. All maximum
concentrations were noted on day 0 of the experiment, after the one week incubation period.
After ~10 PV, concentrations reached a stable concentration (Table 3-4). While maximum
concentrations from the crab shell-containing columns were nearly 3 times larger for Ca and Mg,
and 10 times larger for Na than the traditional substrate mixture, average values stabilized in
close approximation to each other for all of the columns. Initially K values were higher in the
traditional 90% SMC + 10% LS substrate than any other treatment column, but these values also
stabilized to similar concentrations for all treatment columns. P released from the traditional
substrate was comparable with the crab shell-containing mixtures initially, but quickly dropped to
considerably lower levels.
Page 58
44
Table 3-4. Average concentration after 10 pore volumes (PV) and maximum concentrations of
Ca, K, Mg, Na, and P noted in influent water and effluent from continuous-flow
columns treating Klondike-1 MIW with substrates containing mixtures of crab shell
(CS), spent mushroom compost (SMC), and/or limestone (LS).
Average concentrationa (mg/L) after 10 PV
[max. concentration]
Treatment Column Ca K Mg Na P
Influent 109
[126]
4.65
[5.49]
102
[122]
5.78
[6.87]
0.27
[0.95]
Sand Control 109
[127]
7.14
[27.3]
100
[126]
5.84
[6.81]
0.24
[0.98]
100% CS 187
[1240]
7.46
[144]
104
[216]
6.77
[637]
7.69
[17.8]
90% CS + 10% SMC 183
[1440]
9.37
[300]
103
[272]
6.57
[859]
7.47
[32.5]
80% CS + 20% SMC 170
[1095]
7.37
[225]
103
[207]
6.49
[681]
5.82
[24.5]
70% CS + 30% SMC 194
[1590]
7.90
[358]
105
[277]
6.65
[770]
7.18
[25.3]
60% CS + 40% SMC 175
[906]
9.33
[239]
105
[184]
6.50
[560]
4.71
[15.6]
50% CS + 50% SMC 173
[1170]
8.51
[289]
103
[231]
6.46
[492]
4.15
[24.2]
Traditional 90% SMC + 10% LS 153
[414]
9.03
[370]
104
[127]
6.0
[43]
0.33
[21.1]
Recommended Tolerance Limit for Fish
Cultureb (mg/L)
160 5 15 75 n/a
a Measured by inductively coupled plasma-atomic emission spectroscopy (ICP-AES)
b Meade (1989)
Page 59
45
4. Discussion
4.1 Alkalinity
Alkalinity generation in systems containing crab shell has been attributed to three mechanisms:
dissolution of calcium carbonate contained within the shell matrix, generation of VFAs during
fermentation, and bicarbonate produced during sulfate reduction (Robinson-Lora and Brennan,
2009b; Robinson-Lora and Brennan, 2010a). Research conducted previously in our lab has
shown that the surface area of crab shell is over 14 times greater than limestone chips (0.106-0.85
mm diameter) (Robinson-Lora and Brennan, 2009b; Robinson-Lora and Brennan, 2011). In
addition, it has been proposed that the biogenic character of the crab shell-associated carbonates
might be more reactive than other forms of calcium carbonate. These differences likely account
for the increased dissolution of crab shell as compared to the limestone contained in the
traditional treatment column in the current experiment. A strong correlation (R2=0.99) was noted
previously (Newcombe and Brennan, 2010) between alkalinity generation and the amount of crab
shell within the treatment system. The same relationship was noted during this experiment,
however with a lower correlation (R2=0.97) due to the high total alkalinity noted within the 70%
CS +30% SMC column.
The data presented here further supports previous results indicating that a portion of the
alkalinity was produced biotically in columns containing crab shell. Theoretical mass of
carbonate supplied by the substrate material in each column was calculated (Eq. 4-1) using the
mass of each substrate and calcium carbonate equivalence (CCE) data.
Page 60
46
Eq. 4-1
Where is the theoretical mass of carbonate (in mg) supplied to the system
m is mass (in mg) of substrate (from Table 2-3)
CCE (%) is the calcium carbonate equivalence of the substrate (from Table 2-4)
In addition, estimates for the total CaCO3 released from each treatment column were computed by
integrating the area under the curves for experimental alkalinity and acidity data (Eq. 4-2).
Eq. 4-2
Where m is mass (in mg)
n is the sampling iteration
is alkalinity production (in mg/L as CaCO3)
is acidity neutralized (in mg/L as CaCO3)
is the PV of MIW treated between the current sampling iteration
(n) and the previous sampling iteration (n-1)
is the effective pore volume (L) for the column (found in Table 3-2)
Assumption: The alkalinity and acidity (mg/L as CaCO3) were assumed to be
constant between sampling iterations
Figure 4-1 shows that additional alkalinity was produced (above theoretical mass based
on CCE data) for all of the columns containing crab shell. Assuming that the entire mineral
portion of the crab shell matrix disassociated within the treatment columns, it appears as though
12-25% (depending on the specific column) of the alkalinity generated was above the calculated
Page 61
47
theoretical mass and may therefore be attributed to biotic activity. The assumption that complete
dissolution occurred is not necessarily valid, however. Most likely some of the carbonate
contained within the crab shell matrix would not be accessible until complete degradation of the
matrix. After completion of the experiment, substrate material was extracted from each column
for future microbial analysis. During that time, it was noted that substrate materials could be
visibly identified as CS, SMC and LS, respectively, within the substrate mixtures. Thus, it is not
suggested that complete degradation occurred during this experiment, so it is likely that even
greater portions of the alkalinity produced in the crab shell columns can be attributed to
biological activity.
Figure 4-1. CaCO3 calculated from experimental alkalinity and acidity data versus theoretical
CaCO3 data for substrate mixtures.
0
5,000
10,000
15,000
20,000
CaC
O3
(mg)
Experimental Alkalinity and Acidity Measurements
Theoretical CaCO3 within Substrate Matrix
Page 62
48
Previous research (Robinson-Lora and Brennan, 2009b) determined that fermentation and
sulfate reduction by-products each accounted for 25% of the alkalinity within crab shell MIW
treatment systems, with the remaining 50% being a result of dissolution of crab shell-associated
carbonate. These results were from a static microcosm test, and it was noted that alkalinity
production was likely limited by exposure of the surface area of particles. Thus, higher alkalinity
generation from the dissolution of carbonate materials is expected under continuous-flow
conditions. The data reported here is likely more representative of the fraction of alkalinity
generated by biotic and aboitic mechanisms.
Figure 4-1also illustrates that the theoretical alkalinity generating capacity of the
traditional SMC + LS substrate mixture was not exhausted during the experiment, although the
experimental data (Figure 3-1) suggest that it was. DOC data from this treatment column imply
fermentation was occurring, thus it can be assumed that some of the calculated alkalinity
generation was caused by that mechanism in addition to dissolution of calcite. It is possible that
the limestone within this column became armored with metal precipitates and was thus
inaccessible for further dissolution, leading to a portion of the alkalinity generating potential
remaining within the column even after apparent exhaustion. This has been documented in the
literature as a main problem for MIW treatment systems containing limestone (Ziemkiewicz et al.
1997). It is also important to note that the limestone used in this experiment was smaller than the
limestone chips typically mixed with SMC in field treatment systems (0.420-0.841 mm vs.
roughly 9 mm). The lower surface area of the limestone used for field systems could lead to even
slower dissolution for full-scale treatment systems, making crab shell substrates even more
advantageous.
Page 63
49
4.2 Metals Removal
The ability of each column to remove metals of interest expired at different times throughout the
experiment. The treatment capacity of each substrate mixture was calculated as total metals
removed (Table 4-1), with treatment defined as the period when pH5. These results indicate
that mixtures containing any amount of crab shell can remove a minimum of 1.5 times the total
amount of metals from the Klondike-1 MIW as compared to the traditional substrate.
Table 4-1. Metal treatment capacity for each continuous-flow column utilizing 40 g substrate
mixtures to treat Klondike-1 MIW.
Treatment Column
Cumulative Metals Treateda until pH<5
(mg removed)
MIW
Treateda
(L) Al Co Feb Mn Ni Zn Total
100% CS 102 15 2,140 5 16 10 2,290 39
90% CS + 10% SMC 89 14 1,920 57 14 9 2,100 33
80% CS + 20% SMC 74 12 1,810 3 12 8 1,920 28
70% CS + 30% SMC 94 14 2,070 7 15 9 2,210 34
60% CS + 40% SMC 57 10 1,480 26 6 6 1,590 23
50% CS + 50% SMC 65 10 1,530 3 7 7 1,620 26
Traditional 90% SMC + 10% LS 41 4 930 0 4 2 974 18
ausing 40 g of substrate
bCalculated after passive aeration and settling, all others calculated directly from column effluent
To further aid in understanding metal removal mechanisms, a mass balance was
conducted to determine the amount, if any, of each dissolved metal retained within the columns at
the end of the experiment (Appendix F). The results of the mass balance indicate that no
considerable amounts of Al or Mn were retained within any of the columns but that Fe, Co, Ni,
and Zn were retained to varying degrees, including the sand control for Fe (discussed in detail in
the following sections). Removal of Al, Fe, Mn, and trace metals within the 70% CS +30% SMC
column achieved similar rates to those noted within the 100% CS and 90% CS + 10% SMC
columns, with total metals removed exceeding all other treatment columns. In addition, the 70%
Page 64
50
CS + 30% SMC column did not experience negative effects noted in the columns containing
higher concentrations of crab shell during the attempted oxidation of Fe (discussed below). Thus,
the 70% CS + 30% SMC substrate mixture was selected as the best combination of those tested
for the Klondike-1 water quality conditions. A discussion on potential removal mechanisms for
specific metals is provided below.
4.2.1 Al
Although this research was aimed to determine the effectiveness of crab shell mixtures for
treating high-strength MIW, previous crab shell experiments with low-strength MIW were
actually conducted with higher initial concentrations of dissolved Al (10-14 mg/L) (Daubert and
Brennan, 2007; Robinson-Lora, 2009b, 2010a; Newcombe, 2010). The removal of Al in this
experiment was expected to display similar results. Indeed, as previously noted, a direct
correlation between pH and Al removal was observed, with breakthrough occurring in the
columns when pH was no longer maintained above 4.0-4.25, which corresponds with the
minimum solubility for Al(OH)3 for the given conditions (Kso=10-33
, Snoeyink and Jenkins,
1980). Although the data, and previous publications regarding similar systems, indicate likely
removal of Al as a hydroxide, a geochemical model (Visual MINTEQ ver. 2.53) was used to
predict saturation indices for the Al species present given the conditions encountered during the
present experiment and diaspore (AlOOH) was the only reported precipitate. Regardless of the
actual Al oxy(hydroxide) species, it is evident that Al was removed from the treatment columns
based on the solubility of the precipitate, and that pH will dictate the longevity of treatment.
Additional research should be conducted to determine removal efficiency at concentrations >
10mg/L dissolved Al.
Page 65
51
4.2.2 Fe Removal Within Treatment Column
It is presumed that oxidation of Fe within the storage container resulted in ferric iron species,
including oxides/hydroxides, entering the columns. It is also feasible that nanoparticles of Fe
(oxy)hydroxides (Silvester et al., 2005; Cravotta, 2008) were measured as a portion of the
dissolved Fe ( if they were smaller than the 0.45µm filter opening size). Figure 3-7 shows a
noted orange discoloration near the influent port of the sand column implying that Fe
oxides/hydroxide precipitates were either physically retained (filtered) by the solid packing
materials or some sort of sorption mechanism occurred between the precipitates and the surface
of the packing materials. Despite the fact that the orange Fe (oxy)hydroxide precipitation was
only evident within the sand column, it likely occurred within the other columns as well, with the
orange precipitates not visible due to blackening of the columns.
A mass balance of the dissolved Fe entering and exiting the system indicated that Fe was
retained within all columns (Table 4-2). In fact, the data indicates better overall retention (after
breakthrough) of Fe within the sand and traditional columns than the crab shell-containing
columns. It is most likely that the portion of Fe retained within the sand column is in the form of
the ferric iron (oxy)hydroxides, as no other mechanisms for metal removal were noted. However,
it is postulated that within the other columns a portion of the oxidized Fe was subsequently
reduced to ferrous iron. ORP data indicates reducing conditions were present in all of the
treatment columns. Work by Roden and Urrutia (1999) indicate that biological reduction of ferric
iron on the surface of the precipitates is likely under anaerobic conditions, resulting in the release
of ferrous species back into solution. This could account for the lower amount of Fe retained in
columns containing crab shell as reducing conditions were noted to have lasted longer within
those systems (Appendix B, ORP data), although no direct correlation can be made.
Page 66
52
Table 4-2. Fe retained within treatment columns (after breakthrough) at completion of
continuous-flow column test treating Klondike-1 MIW.
Treatment Column Fe (all m are in mg)
min mout mretained % retained
Sand Control 2,870 1,770 1,100 38%
100% CS 2,900 2,090 810 28%
90% CS + 10% SMC 3,020 2,090 930 31%
80% CS + 20% SMC 2,910 2,260 650 22%
70% CS + 30% SMC 2,890 1,950 940 33%
60% CS + 40% SMC 2,852 2,250 602 21%
50% CS + 50% SMC 2,880 2,060 820 28%
Traditional 90% SMC + 10% LS 2,880 1,790 1,090 38%
Removal of dissolved Fe within the actual treatment columns could have been attained by
precipitation with sulfides, sorption onto Al or Fe (oxy)hydroxides (Urrutia et al., 1999; Jeon et
al., 2003; Silvester et al., 2005; Larese-Casanova and Scherer, 2007) or to the surface of metal
sulfides (Jong and Parry, 2004). Visual MINTEQ predicted the formation of mackinawite (FeS)
for conditions where sulfide was present. Each of these mechanisms is expected to cease or slow
considerably by pH 5. As a drop is noted in pH to 5 or below, the following occur
simultaneously: Al precipitates are dissolving, releasing any adsorbed Fe; the sorption edge is
reached for Fe on Fe (oxy)hydroxide and FeS surfaces (Jong and Parry, 2004; Lerese-Casanova
and Scherer, 2007); and FeS precipitates are also expected to undergo dissolution (based on
modeling with Visual MINTEQ, Appendix G). In addition, optimal conditions for SRB include
pH between 6-8. Below pH 4 sulfate reduction is expected to slow considerably from rates
achieved at circum-neutral pH (Jong and Parry, 2006), leaving little sulfide present in the pore
water. As mentioned before, SRB can only utilize short chain organic acids and alcohols, which
require upstream cellulose and chitin degradation by other microorganisms. Cellulolysis is most
effective at pH 6 and above (Logan et al., 2005) and biological chitin hydrolysis has also been
optimized around pH 5-6, depending on the organism (Kapat et al., 1996; Roy et al., 2003;
Page 67
53
Ramírez-Coutiño et al, 2006). Thus, around pH 5, cellulose and chitin degradation has slowed
and could potentially be limiting the carbon source for SRB.
4.2.3 Fe Removal After Passive Aeration and Settling
The full-scale treatment system at the Klondike-1 site, utilizing the traditional 90% SMC and
10% LS substrate mixture, experienced complications when a layer of Fe oxides formed on the
top of the organic substrate layer and clogged the VFP. One benefit noted previously for the crab
shell-containing systems is that the reducing conditions achieved within the anaerobic zone are so
strong as to prevent precipitation of Fe oxides. Although the reducing conditions are desirable
when water is within the VFP, our research shows it can cause problems upon attempted
oxidation. The dissolved Fe results after settling (Figure 3-3B) Figure 3-3. Breakthrough curves
for dissolved Fe measured after continuous-flow columns treating Klondike-1 MIW (A) and after
subsequent passive aeration and settling (B). indicate inefficient treatment within the 100% and
90% CS columns for the first 75-85 PV. This is hypothesized to be a result of the extremely
reducing conditions achieved within columns containing large fractions of crab shell. This
phenomenon was not noticed with fractions of crab shell 80%. This is an important implication
as there appears to be a point above which crab shell addition can inhibit the oxidation of Fe in
subsequent aeration steps.
4.2.4 Mn
Complete removal of dissolved Mn occurred for only a short period near the beginning of the
experiment, when the pH remained above 7. At near-neutral pH, saturation of rhodocrosite
(MnCO3) can be expected (Cravotta, 2008) as well as the adsorption onto Al or Fe
Page 68
54
(oxy)hydroxide precipitates (reviewed in Cravotta and Trahan, 1999). Geochemical modeling
with Visual MINTEQ indicated saturation with rhodocrosite and MnHPO4 at pH from 5.5-7.0,
which is in agreement with previous work (Robinson-Lora and Brennan, 2011). Recent studies
have indicated sorption and/or (co)precipitation as the primary removal mechanisms for dissolved
Mn in anaerobic treatment systems containing crab shell (Robinson-Lora and Brennan, 2010b,
2011). In that investigation, however, interferences in analytical methods due to high calcite
content prevented a conclusive identification of the exact mechanism for Mn removal. The
results of this experiment indicate any of the mechanisms mentioned could be responsible, and no
evidence presented here provides additional insight into the likelihood of one process over
another.
4.2.5 Trace Metals
Several mechanisms could explain the removal of Co, Ni, and Zn within the treatment columns.
Research has shown that surface interactions with precipitated Al, Fe, and Mn (oxy)hydroxides
can lead to the sorption or co-precipitation of trace metals in AMD treatment systems (Lee et al.,
2002; Kairies et al., 2005; Arai, 2008; Peltier et al., 2010; Miller et al., 2011). Adsorption is
regulated by the surface charge of the individual (oxy)hydroxide precipitate and can be affected
by crystallinity, the pH of the associated water, and the presence of other ionic species such as
SO42-
and Cl- (Micera et al., 1986). Due to the short duration of sustained Mn removal recorded
within the treatment columns, surface interactions with this metal were not expected to play a
large role in the removal of trace metals. Precipitation of trace metals as sulfides or even in other
mineral forms are potential removal mechanisms, given appropriate conditions. In fact, it has
been shown that sulfides have a higher affinity for precipitation with trace metals over Fe
(Machemer and Wildeman, 1992; Jong and Parry, 2004), and that adsorption and/or co-
Page 69
55
precipitation of trace metals with metal sulfide precipitates is likely (Jong and Parry, 2004;
Charriau, 2011).
As noted previously, a mass balance was conducted to determine the amount, if any, of
each dissolved metal retained within the columns at the end of the experiment (Appendix F).
Figure 4-2 shows that all treatment columns retained some Co and Ni after breakthrough,
indicating another removal mechanism in addition to surface interactions. In order to help
determine possible precipitates formed, Visual MINTEQ was used to model the environmental
conditions and predict saturation indices. Results for Co and Ni species at various sulfate/sulfide
ratios (to postulate different sulfate reduction rates) indicated CoS and NiS as the only
precipitates for any of the sulfide concentrations investigated (Appendix G). These metal sulfides
are not expected to become soluble until pH falls below 2 (Jandová, 2005; and Visual MINTEQ
models), which never occurred in the treatment columns as the influent water was maintained
around pH 2.5, thus they would be expected to be retained within the treatment columns. An
assumption can be made with respect to the amount of metal removed via precipitation as a metal
sulfide based on the % retained within the column (Figure 4-2). Columns containing crab shell
retained 41-61% of the total Co, 10-31% of the total Ni, and from 0-66% of the total Zn;
compared to 15%, 6%, and 0% for Co, Ni, and Zn, respectively, retained within the traditional
SMC and limestone treatment column.
Page 70
56
Figure 4-2. Percent of total trace metal loading retained (after breakthrough) within treatment
columns at completion of continuous-flow column experiment treating Klondike-1
MIW.
Co and Ni findings also imply that a minimum of one other removal mechanism was
occurring within the treatment columns: sorption to metal (oxy)hydroxides. The breakthrough of
Co occurred as the pH approached and fell below pH 5, and Ni breakthrough curves follow
shortly after, as the pH continued to drop (Figure 3-2,Figure 3-5, and Figure 3-6) This
corresponds directly to the time when dissolved Al was first detected in the effluent of each
column (just prior to Al breakthrough). However, pH 5 also corresponds generally to the
adsorption edges for these trace metals associated with Fe (oxy)hydroxides (Spark et al., 1995;
Kairies et al., 2005, Arai et al., 2008). Thus, the desportion from Al and/or Fe (oxy)hydroxides
could also be involved in the release of Co and Ni from the treatment systems at breakthrough. A
small increase in the normalized concentration of Ni after ~15 PV was noted to coincide with Mn
breakthrough for each of the treatment columns. Ni removal after 15 PV was noticeably lower
(larger normalized concentrations) than that achieved within the first 15 PV for all columns. This
-10%
0%
10%
20%
30%
40%
50%
60%
70%
80%
Co Ni Zn
% R
eta
ined
in
Co
lum
n
Sand Control
100% CS
90% CS + 10% SMC
80% CS + 20% SMC
70% CS + 30% SMC
60% CS + 40% SMC
50% CS + 50% SMC
Traditional 90% SMC + 10% LS
Page 71
57
implies that surface interactions or co-precipitation could also be a factor responsible for Ni
removal as long as Mn removal is sustained.
If additional sulfide were available in solution when Co and Ni were desorbed from Al,
Fe, and Mn (oxy)hydroxides, metal sulfides could likely have formed. The evidence of
breakthrough (dissolved Co and Ni exiting the column) around pH 5 implies that adequate sulfide
was not present to consume the desorbed metals released. As discussed previously, SRB activity
becomes limited below pH 5-6 as cellulose and chitin degradation ceases and SRB begin to slow
their metabolism. These very distinct removal mechanisms for trace metals, which all cease as
the pH of the system drops below 5, make it difficult to determine which mechanism was
dominant in these systems.
The percent of Co retained displays a linear correlation (R2 = 0.960) to the amount of crab
shell contained in the column, except for the 70% column which retained the same percentage as
the 100% column (~62%) (Figure 4-2). The same general trend of increasing mass of crab shell
leading to higher trace metal retention was also observed with respect to Ni. If these metals are
indeed retained as metal sulfides, one could indirectly infer a trend relating mass of crab shell to
sulfide production/sulfate reduction. It is important also to note that the 100% and 70% columns
achieved similar retention of Co and Ni, and thus potentially similar sulfate reduction, despite the
difference in mass of crab shell. As crab shell is more expensive than SMC, the implications of
using a lower CS:SMC ratio for cost savings are important.
Although influent concentrations of dissolved Ni were very low (0.85 ±0.31 mg/L),
complete Ni removal was not achieved at any time throughout the experiment in any of the
treatment columns (Figure 3-6). Regardless of the mechanism, incomplete removal indicates a
limiting condition within the treatment system. Constraints to Ni removal could be related to
limited adsorption sites due to a higher affinity for other metals at those sites. Indeed, Jeon et al.
Page 72
58
(2003) found the sorption affinity of divalent metal ions onto hematite to be in the order of Fe
Zn > Co Ni. However, limited sulfide production could also constrain Ni removal if other
metals outcompete Ni for formation of metal sulfides. Most likely, a combination of these two
limitations reduced the efficiency of Ni removal in these tests.
Zinc was removed completely in each treatment column until breakthrough, which
occurred over a range of pH (3-5), depending on the column. Modeling with Visual MINTEQ
predicted only one Zn precipitate for the given conditions, sphalerite (ZnS), which would only
form in the presence of sulfide. Literature indicates, however, that some portion of the dissolved
Zn would also adsorb onto Fe and Al (oxy)hydroxides to varying extents within the continuous-
flow columns. Similar to the other trace metals, it was expected that any portion of adsorbed Zn
would be released around pH 5 when Al (oxy)hydroxide species dissolved and as the sorption
edge for Zn-Fe (oxy)hydroxides was approached. However this relationship was not noticed for
any of the crab shell-containing columns.
Solubility of ZnS can be dependent on several factors, including the concentration of
dissolved sulfide within solution. Modeling in Visual MINTEQ allowed for the investigation of
the solubility of ZnS over a range of HS- concentrations (Appendix G). The results indicate that
at high sulfide concentrations, sphalerite would form as low as pH 2. However at sulfide
concentrations < 2 mg/L, the pH at which sphalerite became soluble rose to over 3.
Although dissolved Zn breakthrough occurred near pH 3.5 for all of the crab shell-
containing columns, no Zn was retained within the 50% CS + 50% SMC column, and the 80%
CS + 20% SMC column showed only minimal retention of Zn after breakthrough (~2%). Both of
these columns experienced breakthrough sooner than the other crab shell columns and the
breakthrough curves eventually returned to a normalized concentration of zero (indicating a
return to influent Zn concentrations, Figure 3-5). The experiment was concluded before the other
Page 73
59
crab shell columns saw effluent concentrations return to influent concentrations. Thus, it is
postulated that if the experiment were continued, the remaining Zn within the other crab shell
treatment columns would have been released.
Breakthrough of Zn in the traditional 90% SMC + 10% LS column did not follow the
same trend as the crab-shell containing columns, with breakthrough noted around pH 5. This
occurred simultaneously with Al breakthrough and also the adsorption edge for Fe
(oxy)hydroxides, so adsorption is postulated as the primary mechanism involved in Zn removal
within this column.
4.3 Carbon Species
The question has been raised as to whether the provision of organic carbon or alkalinity
generation exhausts first in MIW remediation systems utilizing crab shell substrates. The data
from this experiment show that alkalinity generation is depleted well before organic carbon
becomes limiting (Figure 4-3).
Page 74
60
Figure 4-3. Substrate exhaustion with respect to DOC and alkalinity generation. + symbol above
column indicates the value presented is the PV when the experiment ended, thus the
potential exists for additional DOC generation until complete substrate exhaustion.
DOC is primarily composed of volatile fatty acids produced during the biological
breakdown of the organic substrate within the treatment columns (Newcombe and Brennan, 2010,
Robinson-Lora and Brennan, 2009b). In columns containing crab shell, easily fermentable
proteins within the crab shell matrix are utilized first and then biodegradation of the chitin
polymer occurs. Based on Figure 4-3 alone, one might assume that the substrate is depleted of
organic C for the 50% CS + 50% SMC and traditional 90% SMC + 10% LS treatment columns
which reached DOC exhaustion; however, an organic C mass balance indicates that a large
portion of the original C remains (Figure 4-4, Appendix H).
0
50
100
150
200
250
PV
to
Su
bst
rate
Exh
aust
ion
DOC
Alkalinity
++
+
+
+
Page 75
61
Figure 4-4. Total C remaining in each treatment column at completion of continuous-flow
column experiment.
Exhaustion of DOC before depletion of the C source indicates a constraint on
fermentation, cellulose degradation, and other biotic processes responsible for the breakdown of
the substrate, likely caused by the reduced pH as discussed above. Columns containing more
crab shell lost more C over the course of the continuous-flow experiment, most likely because pH
was sustained above 5 for a longer period. However, none were depleted below 50% of the
starting mass, further indicating additional treatment capacity with respect to provision of C
source for microbial activity. This indicates that the longevity of systems utilizing crab shell can
0%
20%
40%
60%
80%
100%
% o
f to
tal C
rem
ain
ing i
n s
yst
em
Page 76
62
be increased by a supplemental alkalinity source such as limestone after depletion of the shell-
associated carbonates.
4.4 Cations
Based on the data collected during the continuous-flow column study, it appears as though
cations such as Ca, K, Mg, and Na could be of concern for fish in local waterways due to the
extremely high concentrations reached during start-up (Appendix E). However, since the
formation of soluble metal–ligand complexes can significantly impact the effect of aqueous phase
species on fish, Viadero et al. (2004), suggested it was more realistic to compare the average
active free ion concentration against fish toxicity standards. Visual MINTEQ geochemical
modeling software was used to predict the speciation of Ca, K, Mg, and Na under three different
scenarios for the 100% CS column, the 70% CS + 30% SMC column, and the traditional 90%
SMC + 10% LS column (Appendix G). Results for all conditions indicated almost the entire
amount of K and Na were in the form of free ions (>98%). Free ion concentrations of Ca and Mg
were dependent on the estimated sulfate reduction occurring. Higher sulfate reduction led to
greater speciation in the free ion form generally; the % of Ca as a free ion species ranged between
73-87% (100% CS column), 82-92% (70% Cs + 30% SMC column), and 77-90% (traditional
substrate column) for the sulfate reduction ranges evaluated. Results for Mg free ion species
were 1-4% greater than Ca for all cases. Average concentrations of these cations stabilized after
the initial 10 PV were flushed through the system. Thus, the stabilized concentrations were of
particular interest to determine potential long-term fish toxicity. Results for Ca and Mg
speciation are provided in Figure 4-5.
Page 77
63
Figure 4-5. Speciation of relevant cations in the 100% crab shell column after 10 PV based on
geochemical modeling with Visual MINTEQ and an assumed 250 mg/L sulfate
reduction. Results for the 70% CS + 30% SMC column were identical for this time
point and those for the traditional 90% SMC + 10% LS column varied by no more
than 1%.
From the results in Figure 4-5, average free ion concentrations and average active free
ion concentrations of each cation were calculated (Table 4-3). These results indicate that after
approximately 10 PV, free ion Ca concentrations are low enough to be considered safe for fish,
but Mg concentrations are still a concern for the system analyzed in this study. However, it
should be noted that the sustained high levels of Mg were a result of high influent concentrations,
and not due to the treatment system itself.
Similar calculations were conducted to determine if the maximum concentrations, noted
immediately following the incubation period, were of concern when measured as the active free
ion concentrations. These values still exceeded recommended limits. The consequences of acute
exposure for fish to Mg concentrations above recommended levels should be considered for
specific species present in local waterways prior to evaluation of use of crab shell mixtures in
treatment systems at those locations.
Ca+2
73%
CaSO4 (aq)
26%
Ca
Mg+2
78%
MgSO4 (aq)
22%
Mg
Page 78
64
Table 4-3. Tolerance limits and analytic, free ion, and active free ion average concentrations (after 10 PV) for cations of interest from
continuous-flow columns treating Klondike-1 MIW.
mg/L after 10 PV
Average analytic concentration Average free ion
concentrationa
Average active free ion
concentrationb
Treatment Column Ca K Mg Na P Ca K Mg Na P Ca K Mg Na P
Influent 109 4.65 102 5.78 0.27 80 4.4 80 5.7 0.26 26 3.4 26 4.4 0.02
Sand Control 109 7.14 100 5.84 0.24 80 6.8 78 5.7 0.24 26 5.2 26 4.4 0.02
100% CS 187 7.46 104 6.77 7.69 137 7.1 81 6.6 7.5 45 5.5 27 5.1 0.60
90% CS + 10% SMC 183 9.37 103 6.57 7.47 134 8.9 80 6.4 7.3 44 6.9 27 5.0 0.59
80% CS + 20% SMC 170 7.37 103 6.49 5.82 124 7.0 80 6.4 5.7 41 5.4 27 4.9 0.46
70% CS + 30% SMC 194 7.90 105 6.65 7.18 142 7.5 82 6.5 7.0 47 5.8 27 5.0 0.56
60% CS + 40% SMC 175 9.33 105 6.50 4.71 128 8.9 82 6.4 4.6 42 6.8 27 4.9 0.37
50% CS + 50% SMC 173 8.51 103 6.46 4.15 126 8.1 80 6.3 4.1 42 6.2 27 4.9 0.33
Traditional
90% SMC + 10% LS 153 9.03 104 6.00 0.33
112 8.6 81 5.9 0.32
37 6.6 27 4.5 0.03
Recommended tolerance
limit for fishc (mg/L)
160 5 15 75 n/a
160 5 15 75 n/a 160 5 15 75 n/a
a Determined from Figure 4-5.
b Activity coefficient for mono-, di-, & trivalent ions were assumed to be 0.77, 0.33, & 0.08 respectively, based on an ionic strength of 0.1
c Meade (1989)
Page 79
65
4.5 Longevity of Treatment
As noted in Section 2.2, the majority of each column was filled with an inert packing material
(Table 2-3) to allow for the required HRT while still exhausting within a reasonable laboratory
time-scale. It has been proposed that in field applications, crab shell should be mixed in a ratio of
1:1 (by mass) with an inert proppant to maximize longevity while ensuring adequate permeability
(Starr and Lebow, 2005). In order to estimate the longevity of crab shell treatment systems with
respect to the adjusted ratio (approximately 1:12) of crab shell to proppant used in the laboratory
column study, a multiplying factor was calculated.
The total volume of the experimental continuous-flow columns were 694 mL. However
the endcaps were slightly convex in design, allowing an additional volume to be held within the
column. Thus, the total column volume was assumed to be 700 mL. In order to determine the
mass of crab shell and sand required to fill the column completely using a 1:1 mass ratio,
iterations were completed in an Excel spreadsheet using the bulk density of crab shell (0.45
g/mL) and sand (1.55 g/mL) determined previously in the laboratory. Results in Table 4-4
indicate an estimated crab shell mass of 246 g to fill the column on a 1:1 mass ratio with sand.
Compared to the mass of substrate used in the 100% crab shell column (40 g), this indicates just
over a 6 fold increase in the mass of crab shell within the system. The same calculation was
performed for all of the treatment columns to determine the scale-up factor if the columns were
designed using the 1:1 crab shell to proppant ratio (Appendix I). The traditional substrate ratio
was calculated in the same way, only excluding the proppant material altogether, as a proppant is
not typically used with this substrate.
Page 80
66
Table 4-4. Iterative calculations used to determine the theoretical masses and volumes of crab
shell and sand needed if a 1:1 packing ratio (by mass) were used in the continuous-
flow column study. Bolded row indicates the mass required to fill a ~700 mL
column, as used in this study.
Crab Shell (CS) Sand CS + Sand
Volume (mL) Mass (g) Volume (mL) Mass (g) Volume (mL)
284 630 284 183 813
268 595 268 173 768
252 560 252 163 723
249 553 249 161 714
246 546 246 159 705
243 539 243 156 695
189 420 189 122 542
173 385 173 112 497
Bulk density of CS = 0.45 g/mL; Bulk density of sand = 1.55 g/mL
The prior discussion (Section 4.1-4.2) has shown that efficient treatment is sustained
within the system as long as pH is maintained above 5.0. Using the information in Table 4-4, the
values from Table 3-3 were recalculated to estimate the theoretical system longevity based on the
use of a 1:1 (by mass) crab shell to proppant ratio ( Table 4-5).
Table 4-5. Experimental and theoretical treatment longevity of crab shell substrate mixtures for
treating high-strength MIW. Experimental longevity was determined in the column
study using a 1:12 (by mass) substrate to proppant ratio (40 g total substrate).
Theoretical longevity was estimated by extrapolating the results to a 1:1 (by mass)
crab shell to sand proppant ratio that would be used in the field.
Treatment Column
Experimental Scale-
up
Factorb
Theoretical
Substrate
(g)
Longevitya
PV (days)
Substrate
(g)
Longevitya
PV (days)
100% CS 40 141 (146) 6.2 246 874 (905)
90% CS + 10% SMC 40 131 (117) 6.1 242 799 (714)
80% CS + 20% SMC 40 95 (104) 6.0 238 570 (624)
70% CS + 30% SMC 40 137 (124) 5.9 235 808 (732)
60% CS + 40% SMC 40 108 (90) 5.7 226 616 (513)
50% CS + 50% SMC 40 114 (96) 5.3 213 604 (509)
Traditional 90% SMC + 10% LS 40 79 (70) 5.7 229 450 (399) a Longevity of treatment system defined as sustainment of pH above 5.0
b Factor to account for scale-up of the experimental 1:12 substrate to proppant ratio to the
proposed 1:1 crab shell to proppant ratio suggested (no proppant suggested for traditional
substrate). All ratios are by mass.
Page 81
67
In addition, Table 4-1 was also re-evaluated with respect to total metals removed and
total volume of MIW treated based on the scale-up factor. The estimated treatment capacity of
each continuous-flow column can be found in Table 4-6.
Table 4-6. Theoretical total metals removal, volume of MIW treated in each column, and
substrate loading factor. Values were calculated based experimental vales from
Table 4-1 and the scale-up factor to account for a 1:1 (by mass) crab shell to sand
proppant ratio that would be used in the field.
Treatment Column
Theoretical Substrate Loading
Factor
Substrate
(g)
Metals
Removed
(mg)
MIW
Treated
(L)
(g substrate / L MIW)
100% CS 246 14,000 240 1.0
90% CS + 10% SMC 242 13,000 200 1.2
80% CS + 20% SMC 238 11,000 170 1.4
70% CS + 30% SMC 235 13,000 200 1.2
60% CS + 40% SMC 226 9,000 130 1.7
50% CS + 50% SMC 213 8,600 140 1.5
Traditional 90% SMC + 10% LS 229 5,600 100 2.3
Page 82
68
5. Field Pilot System
In the spring of 2010, the Foundation for Pennsylvania Watersheds (FPW) awarded a $15,000
grant to the Clearfield Creek Watershed Association (CCWA) to conduct a pilot-scale test of a
proposed crab shell treatment system at the Klondike-1 site. The objective of the pilot study was
to confirm Penn State laboratory data indicating that crab shell and SMC mixtures would be
effective at treating this discharge, and to determine the effects of scale-up and environmental
field conditions on efficiency of the treatment system. The grant application was written by Dr.
Rachel Brennan in collaboration with Dr. Art Rose with the intent that researchers within Dr.
Brennan’s group would design, install, and monitor the pilot system. After the funds were
secured, the design of the system began in June 2010.
5.1 System Concept
Based on data collected in the continuous-flow column study reported here, an optimal ratio of
crab shell to SMC was determined to be 2.33:1 (70% CS to 30% SMC by mass). Funding from
FPW allowed for four replicate treatment reactors so that comparisons could be made between
different organic substrate mixtures and also different underdrain materials at the pilot-scale. The
reactors consisted of one of the following organic substrate layers: 1) 100% CS, 2) 70% CS +
30% SMC, 3) traditional 90% SMC + 10% LS, and either a limestone or sandstone (SS)
underdrain. Each treatment consisted of a 1000-gallon tank reactor fitted with an underdrain
piping network (to simulate a VFP) and two subsequent 350 gallon aerobic settling ponds
arranged in series. The pilot-VFPs were constructed using polyethylene septic tanks with two
manholes (20.125 inch diameter) at the top to allow access during packing and later substrate
Page 83
69
sampling. The pre-existing inlet port of the tank was retrofitted with an orifice pipe to control the
influent flow rate (design discussion follows in Section 5.2). The pre-existing outlet of the tank
was retrofitted to attach the underdrain piping system to enable effluent flow. Tanks were then
filled with a 2’ rock layer (covering the underdrain piping network), a 3’ substrate layer and a 3‖
layer of pea gravel to hold down the substrate (Figure 5-1). The reactors were designed to have
standing water on the surface and remain open to the air in a manner comparable to a VFP.
Figure 5-1. Schematic of pilot-scale VFPs installed at Klondike-1 field site.
As mentioned previously, a full-scale treatment system is already constructed at the
Klondike-1 site which limited the footprint of the pilot system. The layout of the existing site
however, afforded a convenient location for the pilot system adjacent to the precipitation pond
(Figure 5-2). This location was ideal because it was slightly down-gradient, which allowed for
the siphoning and gravity flow of water to the pilot-scale system instead of the use of a pump.
Page 84
70
Figure 5-2. Schematic of pre-existing full-scale treatment system at the Klondike-1 site with the
location of the pilot system indicated.
5.2 System Design
Water to feed the pilot system was drawn directly from the precipitation pond at a distance of
approximately 16‖ below the water surface through individual piping networks for each reactor.
Hydraulic calculations were conducted to design an appropriate orifice opening to maintain flow
at 0.2 gpm. Major and minor head losses associated with the designed piping network were taken
into account, and an orifice opening with a 3 mm diameter was selected.
As funding allowed for monitoring of the pilot-scale system for a minimum of one year,
substrate design calculations were conducted to allow for system exhaustion in no less than one
year. A 17.5 hr HRT, flow rate of 0.2 gpm, a 1:1 crab shell to sand ratio (by mass), and the
assumption that 1 g of crab shell treats 1L of MIW from this site, were used to calculate the time
161.5 ft
VERTICAL FLOW
POND
OXIDATION
DITCHES
PRECIP.
POND
AEROBIC
SETTLING
POND
WETLAND
DISCHARGE TO
LITTLE LAUREL RUN
Direction of water flow
Pilot-scale system
Source of MIW
Page 85
71
to exhaustion. The organic substrate layer of the reactors consisted of various mixtures (Table
5-1) of the following: SC-20 crab shell; SMC (available onsite from the construction of the
previously installed treatment system); white silica sand (Seymore Brothers, Inc., Altoona, PA),
limestone chips (91% CaCO3, available onsite from the construction of the previously installed
treatment system), and pea gravel (Somogyi’s Route 22 Supply, Ebensburg, PA).
Table 5-1. Actual and designed mixture of the organic substrate layer in each pilot-scale VFP
installed to treat MIW at the Klondike-1 site.
The underdrains were constructed approximately 2’ deep with 3-inch rocks: limestone
rock (AASHTO#1, 99.3% CaCO3, New Enterprise Stone and Lime Company, Tyrone, PA) or
sandstone (SS) rock (#4 Sandstone, 0% CaCO3, Kinkead Aggregates, Homer City, PA) (Figure
5-3).
Reactor Name
Reactor Organic Substrate Layer Components
(kg)
Actual [Design]
Crab Shell Sand SMC LS chips
100% CS + LS Underdrain 685 [570] 680 [570] 0 [0] 0 [0]
70% CS + 30% SMC + LS Underdrain 577 [500] 576 [500] 247 [214] 0 [0]
70% CS + 30% SMC + SS Underdrain 577 [500] 576 [500] 247 [214] 0 [0]
90% SMC + 10% LS + LS Underdrain 0 [0] 0 [0] 549 [476] 61 [53]
Page 86
72
Figure 5-3. Limestone (A) and sandstone (B) rocks used in underdrains for field pilot-scale VFPs
treating MIW at the Klondike-1 site.
The tanks were partially buried to assist with insulation and better imitate an actual VFP.
Full-scale systems have the benefit of faster flow rates and large volumes of water, thus it was
expected that the system would freeze over the winter months, but it was anticipated that burying
the reactors would help mitigate this effect to some degree.
Passive effluent aeration was designed for the system in the form of a miniature cascade
(corrugated pipe) leading from the tank outlet down a vertical distance of two feet to the aeration
ponds. Initial designs included one large settling pond; however, cost restrictions associated with
ponds of the appropriate size required the use of two smaller ponds arranged in series. Water
exiting the second pond of each treatment set-up was connected into a main effluent drainage
pipe which diverted flow to the wetland of the full-scale treatment system already on site.
A
B
Page 87
73
5.3 Construction, Incubation, and Field Sampling
Construction on the pilot-scale system began at the end of July, 2010, and lasted approximately
two weeks (Appendix J contains a photo-documentation of the installation). Volunteers from the
CCWA and members of the Brennan Research Group completed all aspects of the installation,
with the exception of excavation which was accomplished by a hired contractor (John Slovikosky
Excavating).
As per design, the bottom two feet of the reactors were filled with either LS or SS rocks.
Because no physical barrier is included between the underdrain rock layer and the upper organic
substrate layer in VFPs, some substrate naturally settles into the rock layer during construction.
This was accounted for in the design of the pilot reactors, however the amount of substrate to fall
through during loading was more than assumed. Due to the availability of additional substrate
on-site, more was added to attain the desired 3 ft substrate layer. The design versus actual
substrate mass for each reactor can be found in Table 5-1.
In order to facilitate future analysis and investigation of the microbial community present
within the systems, special tea-bag style sample pouches were created and buried within the
organic substrate layer of each reactor. 3-inch X 3-inch bags were constructed from extruded
nylon mesh and sewn together with 10lb. Triline fishing line (Figure 5-4). Each bag contained
10 g of organic substrate, taken from the mixture within the reactor. Bags were attached to a
piece of polypropylene twine and were positioned approximately 8-10 inches below the surface
of the organic substrate layer. A total of 32 bags were placed into each reactor, with 16 bags
located directly under each of the two manholes; the tea-bags near the influent end of the tank
were numbered 1-16 and those near the effluent end were numbered 17-32. The twine was
intended to facilitate removal of the bags and was secured to the outside of the manhole. A
Page 88
74
random number generator was then used to establish a schedule of which bag would be pulled in
conjunction with each sampling event.
Figure 5-4. Photo of microbial tea-bag style sample pouches filled with organic substrate and
buried within each pilot-scale reactor at the Klondike-1 site.
Once construction was complete, the reactors were filled with water from the Klondike-1
discharge and were flushed with approximately 4,300 gallons of water to assist in removing fines.
An attempt was made to conduct tracer tests using sodium chloride; however the background salt
coming off the reactors confounded the tests. After flushing, the reactors were incubated for one
week to allow the development of the microbial consortium.
Page 89
75
Figure 5-5. Pilot-scale VFPs and subsequent aerobic settling ponds installed to treat MIW at the
Klondike-1 field site.
On August 27, 2010, regular operation of the reactors was initiated for all except the
reactor with the sandstone underdrain. This reactor displayed reduced flow rates during the
flushing phase and became completely clogged during the incubation period for unknown
reasons. The reactor was eventually unclogged one week later by pumping water into the outlet,
and no further problems were encountered. Thus, this reactor is on a 7-day lag behind the other
reactors.
Reactors were sampled every week for the first month, biweekly for another month, and
then monthly thereafter. Monitoring will continue for a minimum of one year. Field probes ae
used onsite to measure pH, ORP, conductivity, total dissolved solids (TDS), and temperature of
the reactor effluent and of the final aerobic settling pond. Samples are collected from the reactor
effluent, transported on ice to the laboratory and measured within 4 hours for pH, acidity,
alkalinity, and ammonium and a sample is preserved for later analysis of dissolved metals,
anions, DOC, and Fe speciation. Samples are concurrently collected from the second aerobic
Page 90
76
settling pond, preserved upon return to the lab, and measured for dissolved metals analysis and Fe
speciation according to the methods described in section 2.4.
5.4 Results
Within the pilot system pH levels reached within the first 90 days of operation were slightly
higher than those achieved in the continuous-flow columns. All four reactors have maintained
pH above 6.5 for the 90 days of monitoring conducted thus far (Figure 5-6). Alkalinity
generation within the traditional treatment reactor for the pilot system reached a maximum of 260
mg/L as CaCO3 after incubation, identical to that achieved within this substrate during the
continuous-flow experiment (Figure 5-7). In general, alkalinity and acidity from the field
reactors are following the same trend as the continuous-flow columns, and all reactors are
maintaining a consistent net alkaline effluent.
Complete removal of dissolved iron and aluminum has been maintained thus far within
all pilot-scale field reactors, and partial manganese removal has also been observed (not shown).
Page 91
77
Figure 5-6. pH values of MIW influent and pilot-scale reactor effluent from initial 90 days of
monitoring.
Figure 5-7. Alkalinity generated from pilot-scale reactors during initial 90 days of the field test.
2
3
4
5
6
7
8
9
0 20 40 60 80
pH
Time (days)
Influent100% CS + LS Underdrain70%CS/30%SMC + LS Underdrain70%CS/30%SMC + SS Underdrain90%SMC/10%LS + LS Underdrain
0
1000
2000
3000
4000
5000
0 20 40 60 80
Alk
ali
nit
y (
mg
/L a
s C
aC
O3)
Time (d)
Influent100% CS + LS Underdrain70%CS/30%SMC + LS Underdrain70%CS/30%SMC + SS Underdrain90%SMC/10%LS + LS Underdrain
Page 92
78
6. Conclusions
Based on results obtained in the continuous-flow column experiment, several conclusions can be
made regarding the use of mixed crab shell and SMC substrates for the treatment of MIW,
specifically with respect to longevity and design parameters as well as potential areas of concern.
6.1 Treatment Longevity for Engineering Designs
Mixed crab shell and SMC substrates are effective at treating high-strength MIW from
the Klondike-1 site, maintaining the pH > 5.0 for nearly twice as long as the traditional
substrate. Average influent values of Al (2.81 mg/L), Fe (62 mg/L), and Mn (38.2
mg/L), as well as trace metals, were removed for up to 160 PV in some cases.
The data obtained from the continuous-flow column experiment indicates that a substrate
mixture of 70% crab shell and 30% SMC is the most effective at treating high-strength
MIW, with only 40 g of substrate removing approximately 2,200 mg of metals from 34 L
of MIW.
Treatment columns contained almost a 1:12 ratio of substrate to inert packing material,
therefore estimations of treatment capacity/longevity were made which indicated an
average 6-fold increase in the treatment capacity. The 70% crab shell and 30% SMC
column was estimated to be capable of maintaining pH > 5.0 for over 800 PV, and
treating over 200 L of MIW from the Klondike-1 site.
Substrate loading factors (g substrate / L MIW) were calculated for each substrate ratio
and ranged from 1.0 for 100% crab shell to 2.3 for the traditional 90% SMC and 10%
Page 93
79
limestone substrate. The 70% crab shell and 30% SMC loading factor was determined to
be of 1.2 g substrate / L MIW.
Alkalinity generation is the limiting factor in longevity of mixed crab shell treatment
systems. The ability of the substrate to maintain pH above 5 within the system drives a
majority of the proposed metals removal mechanisms. Despite the fact that the organic
substrates are not exhausted with respect to organic C source, several key physiochemical
and biological processes cease to function below pH 5, as discussed previously. Thus,
the ability of the system to treat is a direct function of pH. Although crab shell has
received favorable attention due to the integral source of CaCO3, these carbonates are not
adequate to sustain alkalinity generation long enough to achieve complete biodegradation
of the organic substrate. Addition of an external alkalinity source should be considered
as either a periodic supplement to crab shell substrates or a portion of the overall system
design (such as a limestone underdrain).
Passive aeration after anoxic treatment increases the removal of Fe by up to 50% in crab
shell-containing columns. High percentages of crab shell in the substrate mixture
displayed an inferior capacity to oxidize Fe upon passive aeration. It is proposed that
conditions are still extremely reducing as water exits the simulated anaerobic wetland.
This did not occur with fractions 80% crab shell. Thus, substrate mixtures containing
80% CS will experience both reduced costs, and improved subsequent aerobic metals
removal.
The pilot system at the Klondike-1 site will need to be monitored until exhaustion of
alkalinity generation (until pH falls below 5.0) in order to provide valuable scale-up and
design information to enable the successful implementation of crab shell systems for
future remediation of MIW.
Page 94
80
6.2 Potential Concerns
Substrates containing more than 50% crab shell (by mass) produce higher levels of
NH4+, Ca, K, Mg, Na, and P than the traditional 90% SMC + 10% LS substrate,
especially at early times. The effects of these high concentrations should be considered
for the first several pore volumes of water through a treatment system, specifically with
respect to fish toxicity and the potential for eutrophication.
As pH falls below 5.0, metals breakthrough begins to occur (except for Mn which
experiences breakthrough much sooner). Systems should be monitored for downward
trends in pH as an indication that action needs to be taken. If no additional buffering
capacity is added (via fresh substrate, a limestone amendment, or some other addition)
metals can be lost from the system. Many of the precipitates are in the form of
(oxy)hydroxides and can be resolubilized when pH falls below 5.0. As a significant
mass of metals could be held within the treatment system, a release of them all at once
could result in extremely high concentrations (considerably higher than the influent MIW
water). This would be true in any treatment system utilizing a neutralizing material such
as CaCO3, however.
Due to the compromised performance of the 80% and 60% crab shell columns, it is not
absolutely certain that 70% crab shell + 30% SMC is the optimal ratio. There is still the
possibility that the 60% crab shell + 40% SMC column could have performed similarly to
the 70% crab shell column if the oxygen intrusion had not occurred.
Page 95
81
7. Future Work
Further research could be undertaken to further elucidate topics related to the use of treatment
systems utilizing mixed crab shell and SMC substrates and ensure appropriate design. The
following list provides subject matter suggested for additional investigation.
Although one of the goals of this test was to monitor the treatment efficiency of crab shell
substrates in remediating ―high-strength‖ MIW, the concentration of Al and several trace
metals were low. Future research should focus on the ability of crab shell substrate
mixtures to treat concentrations of Al higher than 16 mg/L, as well as higher
concentrations of Ag, As, Co, Cu, Ni, Pb, and U.
Although some work has been done with respect to Mn removal in crab shell treatment
systems, additional determination of the contribution to the removal of other metals by
surface interactions on the crab shell material (adsorption, co-precipitation, and surface
precipitation) could help to illuminate the removal mechanisms of specific metals and
lead to a greater understanding of potential benefits and limitations related to the use of
this substrate.
Samples for Fe speciation were collected from the continuous-flow columns at two
locations during each sampling event: from the column effluent and from the simulated
aerobic settling pond. Processing of those samples would lead to a better understanding
of the actual Fe species present and allow for further analysis into the likely removal
pathways associated with Fe.
Tracer tests were not run until the end of the current experiment. However, it is
recommended that a series of tracer tests be run to determine the changes in porosity as
Page 96
82
substrate is degraded, precipitates are formed, and settling of the packing materials
occurs. Loss of permeability has been noted to be a cause of failure in anaerobic passive
treatment systems, so the ability of crab shell substrate mixtures to maintain permeability
over time would be a distinct advantage. Also, the study should determine the need for
inclusion of inert packing materials as a proppant within crab shell substrate mixtures. If
mixtures containing SMC can retain permeability without the use of an additional
proppant material, considerable cost savings could be realized for full-scale systems.
Additional sources of alkalinity should be evaluated in conjunction with crab shell
substrate mixtures to increase the longevity of the system. The current field pilot-scale
system has incorporated limestone underdrains to increase alkalinity generation within
the systems. This should sustain biodegradation of the organic substrate materials for an
extended period beyond what would be accomplished with crab shell alone.
At the completion of the continuous-flow column study, samples of the packing materials
from within each column were preserved for microbial analysis. Cloning work has been
started to evaluate the community established within each substrate mixture in order to
determine the differences in species, if any. Evaluation of the microbial community will
also be conducted on samples from the field-scale reactors over the course of the pilot
test to monitor changes within the community over time (start up, steady state conditions,
decline) and over varying environmental conditions (seasonal temperature and flow
fluctuations).
Continued assessment of the pilot-scale study will allow a more realistic evaluation of
actual treatment capacity achievable in systems utilizing mixtures of crab shell substrates,
as well as providing valuable information on the challenges, if any, related to the scale-up
of mixed crab shell and SMC treatment systems.
Page 97
83
In light of the oxygen intrusion into the 60% crab shell + 40% SMC column and given
the fact that this substrate ratio would be more economically advantageous, further
evaluation should be conducted to determine if the performance is significantly different
from the 70% crab shell + 30% SMC substrate.
Future collaboration with the PA Cooperative Fish and Wildlife Research Unit in Penn
State’s School of Forest Resources could help to estimate the risk to aquatic creatures of
increased cations released during start-up of full-scale treatment systems containing crab
shell mixtures.
Page 98
84
References
APHA, AWWA, and WEF. ―Standard Methods for the Examination of Water and Wastewater:
20th Edition.‖ Eds. Clesceri, L.S., Greenberg, A.E., and Eaton, A.D. Baltimore: APHA,
1998.
Arai, Y. (2008) ―Spectroscopic evidence for Ni(II) surface speciation at the iron oxyhydroxides-
water interface.‖ Environmental Science and Technology, 1151-1156.
Baruah, B. P., and Khare, P. (2010) ―Mobility of trace and potentially harmful elements in the
environment from high sulfur Indian cola mines.‖ Applied Geochemistry, 25: 1621-1631.
Charriau, A., Lesven, L., Gao, Y., Leermakers, M., Baeyens, W., Ouddane, B., and Billon, G.
(2011) ―Trace metal behavior in riverine sediments: role of organic matter and sulfides.‖
Applied Geochemisty, 26: 80-90.
Christensen, B., Morten, L. and Lien, T. (1996) ―Treatment of acid mine water by sulfate-
reducing bacteria; results from a bench scale experiment.‖ Water Research, 30(7): 1617-
1624.
Cravotta, C. A. (2008) ―Dissolved metals and associated constituients in abandoned coal-mine
discharges, Pennsylvania, USA. Part 2: Geochemical controls on constiituient
concentrations.‖ Applied Geochemistry, 23: 203-226.
Cravotta, C. A., and Trahan, M. K. (1999) ―Limestone drains to increase pH and remove
dissolved metals from acidic mine drainage.‖ Applied Geochemistry, 14: 581-606.
Dann, A.L., Cooper, R.S., Bowman, J.P. (2009) ―Investigation and optimization of a passively
operated compost-based system for remediation of acidic, highly iron- and sulfate-rich
industrial waste water.‖ Water Research, 43: 2302-2316.
Daubert, L. N. and Brennan, R. A (2007) ―Passive remediation of acid mine drainage using crab
shell chitin.‖ Environmental Engineering Science, 24(10): 1475-1479.
Dinelli, E., Lucchini, F., Fabbri, M., and Cortecci, G. (1999) ―Metal distribution and
environmental problems related to sulfide oxidation in the Libiola copper mine area
(Ligurian Apennines, Italy).‖ Journal of Geochemical Exploration, 74: 141-152.
Doshi, S. M. (2006) ―Bioremediation of acid mine drainage using sulfate-reducing bacteria.‖
Prepared for U.S. Environmental Protection Agency, Office of Solid Waste and
Emergency Response, Office of Superfund Remediation and Technology Innovation,
Washington, DC.
Page 99
85
Edraki, M., Golding, S. D., Baublys, K. A., and Lawrence, M. G. (2005) ―Hydrochemistry,
mineralology, and sulfur isotope geochemistry of acid mine drainage at the Mt. Morgan
mine environment, Queensland, Australia.‖ Applied Geochemistry, 20: 789-805.
Environmental Protection Agency (EPA) (1997) National Hardrock Mining Framework: United
States Environmental Protection Agency Office of Water (4023). Washington, DC, USA.
Faulwetter, J. L., Gagnon, V., Sundberg, C., Chazarenc, F., Burr, M. D., Brisson, J., Camper, A.
K., Stein, O. R. (2009) ―Microbial processes influencing performance of treatment
wetlands: A review.‖ Ecological Engineering, 35: 987-1004.
Gerente, C., Lee, V. K. C., Le Cloirec, P., and McKay, G. (2007) ―Application of chitosan for the
removal of metals from wastewaters by adsorption – mechanisms and model reviews.‖
Critical Reviews in Environmental Science and Technology, 37: 41-127.
Hallberg, K. B., and Johnson, D. B. (2005) ―Microbiology of a wetland ecosystem constructed to
remediate mine drainage from a heavy metal mine.‖ Science of the Total Environment,
338: 53–66.
Hayes, M., Carney, B., Slater, J., and Bruck, W. (2008) ―Mining marine shellfish wastes for
bioactive molecules: Chitin and chitosan – Part B: Applications.‖ Biotechnology Journal,
3: 878-889.
Hiibel, A. R., Pereyra, L. P., Inman, L. Y., Tischer, A., Reisman, D. J., Reardon, K. F., Pruden,
A. (2008) ―Microbial communit analysis of two field-scale sulfate-reducing bioreactors
treating mine drainage.” Environmental Microbiology, 10: 2087-2097.
Jandová, J., Lisá, K., Vu, H., and Vranka, F. (2005) ―Separation of copper and cobalt-nickel
sulphide concentrates during processing of manganese deep ocean nodules.‖
Hydrometallurgy, 77: 75-79.
Jong, T., and Parry, D. L. (2004) ―Adsorption of Pb(II), Cu(II), Cd(II), Zn(II), Ni(II), Fe(II), and
As(V) on bacterially produced metal sulfides.‖ Journal of Colloid and Interface Science,
275: 61-71.
Jong, T., and Parry, D. L. (2006) ―Microbial sulfate reduction under sequentially acidic
conditions in an upflow anaerobic packed bed bioreactor.‖ Water Research, 40(13):
2561-2571.
Kairies, C. L., Capo, R. C., and Watzlaf, G. R. (2002) ―Chemical and physical properties of iron
hydroxide precipitates associated with passively treated coal mine drainage in the
Bituminous Region of Pennsylvania and Maryland.‖ Applied Geochemistry, 20: 1445-
1460.
Kapat, A., Rakshit, S. K., and Panda, T. (1996) ―Parameters optimization of chitin hydrolysis by
Trichoderma harzianum chitinase under assay conditions.‖ Bioprocess Engineering, 14:
275-279.
Page 100
86
Larese-Casanova, P., and Scherer, M. M. (2007) ―Fe(II) sorption onto hematite: new insights
based on spectroscopic measurements.‖ Environmental Science and Technology 41: 471-
477.
Lee, G., Bigham, J. M., and Faure, G. (2002) ―Removal of trace metals by coprecipitation with
Fe, Al and Mn from natural waters contaminated with acid mine drainage from
Ducktown Mining District, Tennessee.‖ Applied Geochemistry, 17: 569-581.
Lewis, A. E. (2010) ―Review of metal sulphide precipitation.‖ Hydrometallurgy, 104: 222-234.
Logan, M.V., Reardon, K.F., Figueroa, L.A., McLain, J.E.T., Ahmann, D.M. (2005) ―Microbial
community activities during establishment, performance, and decline of bench-scale
passive treatment systems for mine draingage.‖ Water Research, 39: 4537-4551.
Machemer, S. D. and Wildeman, T. R. (1992) ―Adsorption compared with sulfide precipitation
as metal removal processes from acid mine drainage in a constructed wetland.‖ Journal
of Contaminant Hydrology, 9: 115-131.
Maier, R. M., Pepper, I. L., and Gerba, C. P. Environmental Microbiology, 2nd
ed.; Academic
Press, Burlington, MA 2009; p 323-324.
Matshusa-Masithi, M.P., Ogola, J.S., Chimuka, L. (2009) ―Use of compost bacteria to degrade
cellulose from grass clippings in biological removal of sulphate from acid mine
drainage.‖ Water South Africa, 35: 111-116.
Matthies, R., Aplin, A. C., and Jarvis, A. P. (2010) ―Performance of a passive treatment system
for net-acidic coal mine drainage over five years of operation.‖ Science of the Total
Environment, 408: 4877-4885.
McMahon, J. A., and Snodgrass, W. J. (1996) ―Chemical equilibrium data bases and tools for
calculating zinc sulfide geochemistry in freshwater sediments and its toxicity.‖ Water
Quality Resources Journal of Canada, 31 (3): 577-591.
Meade, J. W. Aquaculture Management; Van Nostrand Reinhold, New York, NY 1989; p 9-10.
Metcalf and Eddy. "Wastewater Engineering Treatment and Reuse: 4th
Edition." Eds.
Tchbanoglous, G., Burton, F. L., and Stensel, H. D. Boston: McGraw Hill, 2003.
Micera. G., Gessa, C., Melis. P., Premoli, A., Dallocchio, R. and Deiana, S. (1986) ―Zinc (II)
Adsorption on Aluminum Hydroxide.‖ Colloids and Surfaces, 17(4): 389-394.
Miller, A., Figueroa, L., and Wildeman, T. (2011) ―Zinc and nickel removal in simulated
limestone treatment of mining influenced water.‖ Applied Geochemistry, 26: 125-132.
Morales, T. A., Dopson, M., Athar, R., and Herbert, R. B. J. (2005) ―Analysis of bacterial
diversity in acidic pond water and compost after treatment of artificial acid mine drainage
for metal removal.‖ Biotechnology and Bioengineering, 90: 543–551.
Page 101
87
Muzzarelli, R.A.A. Chitin; Pergamon Press, New York, 1977.
Newcombe, C. E., and Brennan, R. A. (2010) "Improved passive treatment of acid mine drainage
in mushroom compost amended with crab-shell chitin." Journal of Environmental
Engineering, 136 (6): 616 - 626.
Nicomrat, D., Dick,W.A., Tuovinen, O.H. (2006) ―Assessment of the microbial community in a
constructed wetland that receives acid coal mine drainage.‖ Microbial Ecology, 51: 83-
89.
Peltier, E., Van Der Lelie, D., and Sparks, D. L. (2010) ―Formation and stability of Ni-Al
hydroxide phases in soils.‖ Environmental Science and Technology, 44: 302-308.
Pennsylvania Department of Environmental Protection (PA DEP) and U.S. Office of Surface
Mining Reclamation and Enforcement. (2008) ―Mine Drainage Treatability and Project
Selection Guidelines- June 10, 2008.‖ p. 3.
PA DEP (2009) ―Program Implementation Guidelines, Revised Draft – July 19, 2009.‖ Bureau
of Abandoned Mine Reclamation Acid Mine Drainage Set-Aside Program. p. 19.
PA DEP (2010) ―2010 Pennsylvania Integrated Water Quality Monitoring and Assessment
Report: Clean Water Act Section 305(b) Report and 303(d) List‖ p. 38.
Pereyra, L. P., Hiibel, S. R., Pruden, A., Reardon, K. F. (2008) ―Comparison of microbial
community composition and activity in sulfate-reducing batch systems remediating mine
drainage.‖ Biotechnology and Bioengineering, 101: 702-713.
Ramírez-Coutiño, L., Marin-Cervantes, M. C., Huerta, S., Revah, S., and Shirai, K. (2006)
―Enzymatic hydrolysis of chitin in the production of ogliosaccharides using Lecanicillium
fungicola chitinases.‖ Process Biochemistry, 41: 1106-1110.
Robinson-Lora, M. A. (2009) ―Evaluation of chitinous material as a multifunctional substrate for
the remediation of mine impacted water [dissertation].‖ University Park, PA:
Pennsylvania State University.
Robinson-Lora, M. A., and Brennan, R. A. (2009a) "The use of crab-shell chitin for biological
denitrification: batch and column tests." Bioresource Technology, 100 (2): 534 - 541.
Robinson-Lora, M. A., and Brennan, R.A. (2009b) "Efficient metal removal and neutralization of
acid mine drainage by crab-shell chitin under batch and continuous-flow conditions."
Bioresource Technology, 100 (21): 5063 - 5071.
Robinson-Lora, M. A., and Brennan, R.A. (2010a) "Chitin complex for the remediation of mine
impacted water: geochemistry of metal removal and comparison with other common
substrates." Applied Geochemistry, 25 (3): 336 - 344.
Page 102
88
Robinson-Lora, M. A., and Brennan, R. A. (2010b) "Biosorption of manganese onto chitin and
associated proteins during the treatment of mine impacted water." Chemical Engineering
Journal, 162: 565 - 572.
Robinson-Lora, M. A., and Brennan, R. A. (2011) "Anaerobic precipitation of manganese and co-
existing metals in mine impacted water treated by crab shell-associated minerals."
Applied Geochemistry, 26: 853-862.
Roden, E. E. and Urrutia, M. M. (1999) ―Ferrous iron removal promotes microbial reduction of
crystalline iron(III) oxides.‖ Environmental Science and Technology, 33:1847-1853.
Romero, F. M., Prol-Ledesma, R. M., Canet, C., Alvarez, L. N., and Pérez-Vásquez, R. (2010)
―Acid drainage at the inactive Santa Lucia mine, Western Cuba: Natural attenuation of
arsenic, barium, and lead, and geochemical behavior of rare earth elements.‖ Applied
Geochemistry, 25: 716-727.
Rose, A. W. (2008) ―Klondike AMD Treatment Project Final Report.‖ Prepared for the Clearfield
Creek Watershed Association, Ashville, PA.
Rötting, T. S., Thomas, R. C., Ayora, C., and Carrera, J. (2008) ―Passive treatment of acid mine
drainage with high metal concentrations using dispersed alkaline substrate‖ Journal of
Environmental Quality, 37: 1741-1751.
Roy, I., Sardar, M., and Gupta, M. N. (2003) ―Hydrolysis of chitin by Pectinex™.‖ Enzyme and
Microbial Technology, 32: 582-588.
Schippers, A., Kock, D., Schwartz, M.,, Böttcher, M. E., Vogel, H., and Hagger, M. (2007)
―Geomicrobiological and geochemical investigation of a pyrrhotite-containing mine
waste tailings dam near Selebi-Phikwe in Botswana.‖ Journal of Geochemical
Exploration, 92: 151-158.
Silvester, E., Charlet, L., Tournassat, C., Gehin, A., Greneche, J. M., and Liger, E. (2005)
―Redox potential measurements and Mossbauer spectrometry of Fe(II) adsorbed onto
Fe(III) (oxyhydr)oxides.‖ Geochimica Et Cosmochimica Acta, 69: 4801-4815.
Spark, K. M., Johnson, B. B., and. Wells, J. D. (1995) ―Characterizing heavy-metal adsorption on
oxides and oxyhydroxides.‖ European Journal of Soil Science, 46:621-631.
Starr, B. and Lebow, P. (2005) ―Phase II SBIR final report: bioremediation of chlorinated
solvents in saturated, low permeability soils." NSF SBIR program, 2005.
Tutu, H., McCarthy, T. S., and Cukrowska, E. (2008) ―The chemical characteristics of acid mine
drainage with particular reference to sources, distribution, and remediation: The
Witwatersrand Basin, South Africa as a case study.‖ Applied Geochemistry, 23: 3666-
3684.
Page 103
89
Venot, C., Figueroa, L., Brennan, R. A., Wildeman, T. R., Risemen, D., Sieczkowski, M. (2008)
―Comparing chitin and organic substrates on the national tunnel waters in Blackhawk,
Colorado for manganese removal.‖ In: Barnhisel, R. I. (Ed.) Proceedings of the American
Society of Mining and Reclamation Richmand, VA, June 14-19, 2008. ASMR,
Lexington, KY, pp. 1232-1351.
Viadero, R. C., Tierney, A. E., Semmesn, K. J. (2004) ―Use of treated mine water for rainbow
trout (Oncorhynchus mykiss) culture: a production scale assessment.‖ Aquaculture
Engineering, 31, 319-336.
Viggi, C. C., Pagnanelli, F. Toro, L. (2009) ―Sulphate bioreduction for the treatment of polluted
wates: solid versus liquid organic substrates.‖ Journal of Chemical Technology and
Biotechnology, 84: 859-863.
Waybrant, K. R., Ptacek, C. J., and Blowes, D. W. (2002) ―Treatment of mine drainage using
permeable reactive barriers: column experiments.‖ Environmental Science and
Technology, 36: 1349-1356.
Willow, M. A., and Cohen, R. R. H. (2003) ―pH, dissolved oxygen, and adsorption effects on
metal removal in anaerobic bioreactors.‖ Journal of Environmental Quality, 32: 1212-
1221.
Ziemkiewicz, P. F., Skousen, J. G., Brant, D. L., Sterner, P. L. and Lovett, R. J. (1997) ―Acid
mine drainage treatment with armored limestone in open limestone channels.‖ Journal of
Environmental Quality, 26: 1017-1024.
Ziemkiewicz, P. F., Skousen, J. G., and Simmons, J. (2003) ―Long-term performance of passive
acid mine drainage treatment systems. ― Mine Water and the Environment, 22: 118-129.
Page 104
90
Appendix A
Conservative Tracer Tests
The HRT, variance, and dispersion number were calculated from the tracer test data
using Equations A.1-A.4 (Metcalf and Eddy, 2003). The dispersion number is the ratio of
mass transport due to dispersion and advection. The calculated HRT (t) was used as the
estimated retention time (τ) to calculate the dispersion number. The HRT and measured flow
rate were then used to calculate pore volume.
Equation A-1
Equation A-2
Equation A-3
Equation A-4
Where:
Page 105
91
Figure A-1. Conservative tracer test response curves for continuous-flow columns.
0
50
100
150
200
250
0 5 10 15 20 25 30 35
Ch
lori
de
(m
g/L
)
Time (hr)
Sand Control
100% CS
90% CS + 10% SMC
80% CS + 20% SMC
70% CS + 30% SMC
60% CS + 40% SMC
50% CS + 50% SMC
Traditional 90% SMC + 10% LS
Page 106
92
Appendix B
In-line pH and ORP Probes
pH and ORP electrodes were utilized in flow-though cells positioned to receive water
directly from the column effluent port (just prior to the sample cell). Electrodes were maintained
in the flow-through cells continuously and during each sampling event, the bench top meter
(Accumet® Basic AB15, Fisher Scientific) was used in conjunction with the respective in-line
electrode to monitor pH and ORP.
In addition to short chain organic acids and alcohols, CO2 is a byproduct of fermentation.
In solution, CO2 is typically present as carbonic acid (H2CO3), which will lower the pH of the
solution. It was thought that in-line readings would provide a more accurate measure of system
pH, due to the possible partitioning of CO2 out of the water during sample handling. Thus, the in-
line pH electrodes were expected to provide pH readings slightly lower than the bench top pH
readings, and allow insight into the potential effects of air exposure to samples during transport
from the field site for the subsequent field study. As expected, the in-line electrodes consistently
measured lower pH than the bench top electrode for all except the 100% CS and 60% CS + 40%
SMC columns (Figure B-1)Figure B-1. Comparison of pH readings taken during continuous-
flow column test from bench top electrode and electrodes mounted in flow-through cells.
Symbols connected by a line indicate bench top electrode readings; unconnected symbols indicate
in-line electrode readings..
The 100% CS and 60% CS + 40% SMC columns exhibited different trends (Figure B-2).
The electrode associated with the 60% CS + 40% SMC column initially measured pH higher than
the bench top electrode, but after ~125 PV, exhibited the same trend as the majority of the in-line
Page 107
93
electrodes (slightly lower than the bench top electrode). It is suspected that anaerobic biological
processes (i.e. fermentation) were not occurring to the same degree within this column at the
beginning of the experiment due to the introduction of O2 during a blow-out of a sampling port.
The electrode associated with the 100% CS column provided results which were
consistent with the bench top electrode for the first ~75 PV. From that point forward, results
fluctuated between pH 5.5 and 6.5, but did not deviate from this range. Upon inspection at the
conclusion of the experiment, it appeared that a biofilm had developed on the electrode surface
within the flow-through cell. Consequently, the microenvironment within the biofilm was being
maintained with a pH between 5.5 and 6.5, skewing results for the pH of the actual column
effluent water.
Page 108
94
Figure B-1. Comparison of pH readings taken during continuous-flow column test from bench
top electrode and electrodes mounted in flow-through cells. Symbols connected by
a line indicate bench top electrode readings; unconnected symbols indicate in-line
electrode readings.
1
2
3
4
5
6
7
8
0 50 100 150 200
pH
Pore Volumes
Sand Control
90% CS + 10% SMC
80% CS + 20% SMC
70% CS + 30% SMC
50% CS + 50% SMC
Traditional 90% SMC + 10% LS
Page 109
95
Figure B-2. Comparison of pH readings taken during continuous-flow columns test from bench
top electrode and electrodes mounted in flow-through cells. Symbols connected by
a line indicate bench top electrode readings; unconnected symbols indicate in-line
electrode readings.
ORP electrodes were also found to have developed varying degrees of biofilms when
they were inspected near the end of the experiment. Although the trend for the crab shell
columns (with the exception of the 80% CS + 20% SMC column) indicated ORP slowly
increased from an initial value near -400 mV as expected, it is unknown if the rate of increase
was affected by the biofilm. It is also unknown if the results from the 80% CS + 20% SMC
column are more realistic, as that electrode also had biofilm growth. Thus, the data presented in
Figure B-3 cannot be presumed to be an accurate reflection of actual effluent water quality.
2
3
4
5
6
7
8
0 50 100 150 200
pH
Pore Volumes
100% CS
60% CS + 40% SMC
Page 110
96
Figure B-3. ORP measured with in-line electrodes in effluent from continuous-flow columns
treating MIW from the Klondike-1 site.
-800
-600
-400
-200
0
200
400
600
800
0 50 100 150 200
OR
P (
mV
)
Pore Volumes
Sand Control100% CS90% CS + 10% SMC80% CS + 20% SMC70% CS + 30% SMC60% CS + 40% SMC50% CS + 50% SMCTraditional 90% SMC + 10% LS
Page 111
97
Appendix C
Metals Removal After Passive Aeration and Settling
Chapter 3.5 provides data for dissolved Al, Fe, Mn, cobalt, nickel, and zinc. For each
continuous-flow column, metals were measured at two points in the treatment scheme: in the
column effluent and also after passive aeration and settling of the column effluent. Some metals,
such as dissolved Fe, experienced enhanced removal after passive aeration and are discussed in
the aforementioned chapter. All metals data, both from the column effluent and after passive
aeration and settling is provided here for completeness and also for comparison purposes.
Page 112
98
Figure C-1. Breakthrough curves for dissolved Al measured in continuous-flow columns treating
Klondike-1 MIW (A) and after subsequent passive aeration and settling (B).
0.0
1.0
2.0
3.0
4.0
5.0
6.0
7.0
8.0
9.0
10.0
0 50 100 150 200
Al (C
/C0)
Pore Volumes
0.0
1.0
2.0
3.0
4.0
5.0
6.0
7.0
8.0
9.0
10.0
0 50 100 150 200
Al (C
/C0) Sand Control
100% CS
90% CS + 10% SMC
80% CS + 20% SMC
70% CS + 30% SMC
60% CS + 40% SMC
50% CS + 50% SMC
Traditional 90% SMC + 10% LS
B
A
Page 113
99
Figure C-2. Breakthrough curves for dissolved Fe measured in continuous-flow columns treating
Klondike-1 MIW (A) and after subsequent passive aeration and settling (B).
0.0
0.5
1.0
1.5
2.0
2.5
0 50 100 150 200
Fe
(C
/C0)
Pore Volumes
B
0.0
0.5
1.0
1.5
2.0
2.5
0 50 100 150 200
Fe
(C
/C0)
Sand Control 100% CS90% CS + 10% SMC 80% CS + 20% SMC70% CS + 30% SMC 60% CS + 40% SMC50% CS + 50% SMC Traditional 90% SMC + 10% LS
A
Page 114
100
Figure C-3. Breakthrough curves for dissolved Mn measured in continuous-flow columns
treating Klondike-1 MIW (A) and after subsequent passive aeration and settling (B).
0.0
0.2
0.4
0.6
0.8
1.0
1.2
1.4
1.6
1.8
0 50 100 150 200
Mn
(C/C
0)
Sand Control 100% CS
90% CS + 10% SMC 80% CS + 20% SMC
70% CS + 30% SMC 60% CS + 40% SMC
50% CS + 50% SMC Traditional 90% SMC + 10% LS
0.0
0.5
1.0
1.5
2.0
2.5
3.0
3.5
0 50 100 150 200
Mn
(C/C
0)
Pore Volumes
B
A
Page 115
101
Figure C-4. Breakthrough curves for dissolved cobalt measured in continuous-flow columns
treating Klondike-1 MIW (A) and after subsequent passive aeration and settling (B).
0.0
0.5
1.0
1.5
2.0
2.5
3.0
0 50 100 150 200
Co
(C
/C0)
Pore Volumes
0.0
0.2
0.4
0.6
0.8
1.0
1.2
1.4
1.6
1.8
2.0
0 50 100 150 200
Co
(C
/C0)
Sand Control100% CS90% CS + 10% SMC80% CS + 20% SMC70% CS + 30% SMC60% CS + 40% SMC50% CS + 50% SMCTraditional 90% SMC + 10% LS
B
A
Page 116
102
Figure C-5. Breakthrough curves for dissolved nickel measured in continuous-flow columns
treating Klondike-1 MIW (A) and after subsequent passive aeration and settling (B).
0.0
0.2
0.4
0.6
0.8
1.0
1.2
1.4
1.6
1.8
0 50 100 150 200
Ni (C
/C0)
Pore Volumes
0.0
0.2
0.4
0.6
0.8
1.0
1.2
1.4
1.6
1.8
2.0
0 50 100 150 200
Ni (C
/C0)
Sand Control 100% CS
90% CS + 10% SMC 80% CS + 20% SMC
70% CS + 30% SMC 60% CS + 40% SMC
50% CS + 50% SMC Traditional 90% SMC + 10% LS
B
A
Page 117
103
Figure C-6. Breakthrough curves for dissolved zinc measured in continuous-flow columns
treating Klondike-1 MIW (A) and after subsequent passive aeration and settling (B).
0.0
1.0
2.0
3.0
4.0
5.0
6.0
7.0
0 50 100 150 200
Zn
(C
/C0)
Pore Volumes
0.0
1.0
2.0
3.0
4.0
5.0
6.0
7.0
0 50 100 150 200
Zn
(C
/C0)
Sand Control100% CS90% CS + 10% SMC80% CS + 20% SMC70% CS + 30% SMC60% CS + 40% SMC50% CS + 50% SMCTraditional 90% SMC + 10% LS
B
A
Page 118
104
Appendix D
Sulfate Data
Chapter 3.5 includes a brief presentation of findings indicating likely sulfate (SO42-
)
reduction. SO42-
data was obtained via two analytical methods, IC and ICP, which yielded similar
results, indicating almost no SO42-
reduction was occurring within the treatment columns. ICP
data (Figure D-1) was originally reported as the element sulfur (S). Sample pretreatment and
preservation methods (Robinson-Lora and Brennan, 2010a) required acidification to pH < 2 and
sparging with lab air to drive off hydrogen sulfide from the sample prior to analysis so that all S
reported could be assumed to exist as SO42-
species. As such, SO42-
concentrations were
calculated from the reported S value according to the molecular weight ratio of SO42-
:S (2.996:1).
The data presented in Figure D-1 is after conversion to SO42-
, and lines are a running average of
interpolated data. Data obtained from the IC is not reported.
SO42-
data would be expected to display a negative correlation with metals removal and
DOC production (as sulfate goes down, metals removal and DOC should increase). However,
these correlations were not noted. In addition, the maximum sulfate removal appears to happen
around ~125 PV for all of the columns, which corresponds to pH below 5, where SRB are known
to show reduced activity. Considering these findings and the visual indications of potential
sulfate removal (Chapter 3.5), this data is not considered to be a valid assessment of sulfate
within the system.
Page 119
105
Figure D-1. Sulfate data for continuous-flow columns treating Klondike-1 MIW.
600
800
1,000
1,200
1,400
1,600
1,800
0 50 100 150 200
SO4
2- (
mg
/L)
Pore Volumes
Influent
Sand Control
100% CS
90% CS + 10% SMC
80% CS + 20% SMC
70% CS + 30% SMC
60% CS + 40% SMC
50% CS + 50% SMC
Traditional 90% SMC + 10% LS
Page 120
106
Appendix E
Cation Data Plots
Specific cations of interest (Ca, K, Mg, Na, and P) are discussed in Chapters 3 and 4.
Although some data points are referenced or included in tables in those chapters, the full data sets
are included in this Appendix.
Figure E-1. Dissolved Ca measured in continuous-flow columns treating Klondike-1 MIW. Inset
graph shows maximum values achieved at beginning of experiment; axes have same
units as large plot.
50
100
150
200
250
300
350
400
450
500
0 50 100 150 200
Ca
(m
g/L
)
Pore Volumes
Inf luent
Sand Control
100% CS
90% CS + 10% SMC
80% CS + 20% SMC
70% CS + 30% SMC
60% CS + 40% SMC
50% CS + 50% SMC
Traditional 90% SMC + 10% LS
0
200
400
600
800
1,000
1,200
1,400
1,600
0 5 10 15 20
Page 121
107
Figure E-2. Dissolved K measured in continuous-flow columns treating Klondike-1 MIW. Inset
graph shows maximum values achieved at beginning of experiment; axes have same
units as large plot.
0
50
100
150
200
250
300
350
400
0 50 100 150 200
K (m
g/L
)
Pore Volumes
Inf luent
Sand Control
100% CS
90% CS + 10% SMC
80% CS + 20% SMC
70% CS + 30% SMC
60% CS + 40% SMC
50% CS + 50% SMC
Traditional 90% SMC + 10% LS
0
100
200
300
400
0 1 2 3 4 5
Page 122
108
Figure E-3. Dissolved Mg measured in continuous-flow columns treating Klondike-1 MIW.
0
50
100
150
200
250
300
0 50 100 150 200
Mg
(m
g/L
)
Pore Volumes
Influent
Sand Control
100% CS
90% CS + 10% SMC
80% CS + 20% SMC
70% CS + 30% SMC
60% CS + 40% SMC
50% CS + 50% SMC
Traditional 90% SMC + 10% LS
Page 123
109
Figure E-4. Dissolved Na measured in continuous-flow columns treating Klondike-1 MIW. Inset
graph shows maximum values achieved at beginning of experiment; axes have same
units as large plot.
4
5
6
7
8
9
10
11
12
13
14
0 50 100 150 200
Na
(m
g/L
)
Pore Volumes
Influent
Sand Control
100% CS
90% CS + 10% SMC
80% CS + 20% SMC
70% CS + 30% SMC
60% CS + 40% SMC
50% CS + 50% SMC
Traditional 90% SMC + 10% LS
0
100
200
300
400
500
600
700
800
900
0 1 2 3 4 5
Page 124
110
Figure E-5. Dissolved PO43—
P measured in continuous-flow columns treating Klondike-1 MIW.
0
5
10
15
20
25
30
35
0 50 100 150 200
PO
43
- -P
(m
g/L
)
Pore Volumes
Influent
Sand Control
100% CS
90% CS + 10% SMC
80% CS + 20% SMC
70% CS + 30% SMC
60% CS + 40% SMC
50% CS + 50% SMC
Traditional 90% SMC + 10% LS
Page 125
111
Appendix F
Metals Mass Balance Calculations
Mass balances were conducted on each column to determine the amount, if any, of each
metal (Al, Co, Fe, Mn, Ni, and Zn) retained within the column packing materials at the
completion of the experiment (after 181 days of continuous-flow operations).
The total mass entering each column was calculated using the formula:
Where is the calculated mass (mg) entering the column
n is the sampling iteration
is the influent concentration of the metal (mg/L) at sampling iteration (n)
is the PV of MIW treated between the current sampling iteration (n) and the
previous sampling iteration (n-1)
is the effective pore volume (L) for the column (found in Table 3-2)
The following assumptions were made:
1). The concentration (mg/L) at each sampling iteration was assumed to be constant over
the entire volume of MIW treated since the previous sampling iteration ( ).
2). was assumed to be 1 for the first sampling iteration (immediately
following incubation) as the column was filled with 1 PV of MIW during incubation.
Page 126
112
The total mass of Al, Co, Fe, Mn, and Ni exiting each column was calculated using the
formula:
Where is the calculated mass (mg) exiting the column
nEx.is the sampling iteration at exhaustion (defined as breakthrough to 50% of the influent
concentration)
is the effluent concentration of the metal (mg/L) at sampling iteration (n)
The assumptions stated above were also taken into account.
The results using this method for Zn did not produce logical results. Calculations
indicated mout of the columns exceeding min by significant amounts (> 50% for some columns).
Extractable metals results from the column packing materials (Table 2-4) were considered as a
possible source of the additional Zn. After any potential Zn released from the packing materials
was accounted for, masses still exceeded reasonable results. It is hypothesized that low influent
concentrations of Zn (average 0.26 mg/L) coupled with a high detection limit (0.20 mg/L)
resulted in an inadequate portrayal of mass retained within the system using the equations
described above. Effluent concentrations below the detection limit (BDL) were reported as the
detection limit (0.20 mg/L). During times of complete removal, this resulted in a small portion of
Zn seemingly being removed. For example, if the influent concentration was 0.28 mg/L and the
effluent was BDL, the mout of the column would have been calculated using a concentration of
0.20 mg/L. This would lead to an overestimation of the mass exiting the column, and a resulting
mout value which was significantly larger than the mass inputted into the system.
In order to better estimate the amount of Zn retained within the column, an additional
assumption was made: When concentration of the effluent was BDL, it was assumed that
Page 127
113
complete removal occurred, and an effluent concentration of 0.0 mg/L was used. This resulted in
realistic numbers which are further discussed in section 4.2.4.
Calculations were accomplished in Microsoft Excel, and results are provided in Figure F-1 and
Table F-1.
Figure F-1. Percent of each metal retained within columns treating Klondike-1 MIW at
completion of experiment (after 181 days of continuous-flow conditions).
-10%
0%
10%
20%
30%
40%
50%
60%
70%
Al Co Fe Mn Ni Zn
% R
eta
ined
in
Co
lum
n
Sand Control
100% CS
90% CS + 10% SMC
80% CS + 20% SMC
70% CS + 30% SMC
60% CS + 40% SMC
50% CS + 50% SMC
Traditional 90% SMC + 10% LS
Page 128
114
Table F-1. Metals mass balance for continuous-flow columns conducted at completion of experiment (after 181 days of operation).
Treatment Column
Metals mass balance for continuous-flow columns (all m are in mg)
Al Co
min mout mretained % retained min mout mretained % retained
Sand Control 131 134 -2.5 -2% 20.0 20 -0.2 -1%
100% CS 134 133 1.2 1% 20.4 8.0 12 61%
90% CS + 10% SMC 138 143 -4.5 -3% 20.9 10 11 51%
80% CS + 20% SMC 136 140 -3.5 -3% 20.6 11 10 49%
70% CS + 30% SMC 134 129 4.9 4% 20.1 7.9 12 61%
60% CS + 40% SMC 132 124 7.9 6% 20.0 11 9.5 47%
50% CS + 50% SMC 135 133 1.8 1% 20.4 12 8.3 41%
Traditional 90% SMC + 10% LS 133 142 -8.9 -7% 20.1 17 2.9 15%
Fe Mn
min mout mretained % retained min mout mretained % retained
Sand Control 2870 1770 1100 38% 1704 1730 -26 -2%
100% CS 2900 2090 810 28% 1740 1750 -10 -1%
90% CS + 10% SMC 3020 2090 930 31% 1780 1760 20 1%
80% CS + 20% SMC 2910 2260 650 22% 1760 1780 -20 -1%
70% CS + 30% SMC 2890 1950 940 33% 1710 1720 -10 -1%
60% CS + 40% SMC 2852 2250 602 21% 1710 1730 -20 -1%
50% CS + 50% SMC 2880 2060 820 28% 1730 1750 -20 -1%
Traditional 90% SMC + 10% LS 2880 1790 1090 38% 1720 1760 -40 -2%
Page 129
115
Table F-1. (continued) Metals mass balance for continuous-flow columns conducted at completion of experiment (after 181 days
of operation).
Treatment Column
Metals mass balance for continuous-flow columns (all m are in mg)
Ni Zn
min mout mretained % retained min mout mretained % retained
Sand Control 46 50 -4.3 -10% 13 13 -0.2 -1%
100% CS 47 32 14 31% 13 4.3 8.6 66%
90% CS + 10% SMC 49 37 12 25% 13 10 3.2 24%
80% CS + 20% SMC 47 37 10 22% 13 13 0.3 2%
70% CS + 30% SMC 47 33 14 30% 13 7.1 5.8 45%
60% CS + 40% SMC 46 39 6.5 14% 13 7.1 5.6 44%
50% CS + 50% SMC 47 42 4.8 10% 13 14 -0.9 -7%
Traditional 90% SMC + 10% LS 47 44 2.7 6% 13 14 -0.8 -7%
Page 130
116
Appendix G
Visual MINTEQ Geochemical Modeling
Visual MINTEQ was used to determine solubility of different metal species over a range
of pH values. In addition, models attempted to determine differences in speciation and saturation
indices of metals and other cations under a range of sulfate/sulfide ratios. 9 scenarios were
assessed, 3 each for the 100% CS column, 70% CS + 30% SMC column, and traditional 90%
SMC + 10% LS column. Each scenario contained 6 iterations of different sulfate/sulfide ratios.
The scenarios and iterations are described in more detail in Table G-1 and Table G-2. Selected
results are presented in Figure G-1 and Figure G-2. In addition, these results were used to
determine free ion concentrations of cations in Chapter 4.4.
Page 131
117
Table G-1. Visual MINTEQ geochemical modeling scenarios, consisting of 6 iterations of SO42-
:HS- ratios each
Scenario Description Iteration SO4
2-
(mg/L)
HS-
(mg/L)
1 100% CS column, Cation concentrations immediately following incubation A 75% sulfate removal 250 250
2 100% CS column, Cation concentration average after 10 PV B 50% sulfate removal 500 170
3 100% CS column, Cation concentration when pH =5 C 25% sulfate removal 750 83
4 70% CS column, Cation concentration immediately following incubation D 15% sulfate removal 850 50
5 70% CS column, Cation concentration average after 10 PV E 10% sulfate removal 900 33
6 70% CS column, Cation concentration when pH =5 F 1% sulfate removal 990 3.3
7 Traditional column, Cation concentration immediately following incubation
8 Traditional column, Cation concentration average after 10 PV
9 Traditional column, Cation concentration when pH =5
Table G-2. Carbonate, cation, and dissolved metals concentrations for Visual MINTEQ geochemical modeling scenarios.
Variable Carbonate/Cation Concentrations (mg/L) Constant Dissolved Metals Concentrations
(mg/L)
Scenario CO32-
Ca K Mg Na P Al Co Fe Mn Ni Zn
1 2316 1235 144 215 637 17.8 2.81 0.42 105 36.2 0.92 0.26
2 247 187 7.46 104 6.77 7.69 2.81 0.42 105 36.2 0.92 0.26
3 0 126 7.05 104 5.82 11.3 2.81 0.42 105 36.2 0.92 0.26
4 2290 1590 358 276 770 15.7 2.81 0.42 105 36.2 0.92 0.26
5 284 194 7.9 105 6.5 7.18 2.81 0.42 105 36.2 0.92 0.26
6 0 120 5.27 101 5.3 2.9 2.81 0.42 105 36.2 0.92 0.26
7 434 414 369 127 43 21.1 2.81 0.42 105 36.2 0.92 0.26
8 16.5 153 9.03 104 6 0.033 2.81 0.42 105 36.2 0.92 0.26
9 0 149 7.14 113 6.26 1.02 2.81 0.42 105 36.2 0.92 0.26
Page 132
118
Figure G-1. Scenarios 1 (initial values after incubation), 2 (average after
10 PV), and 3 (pH=5) using the SO42-
:HS- ratio from iteration A. Results
reveal no considerable difference in solubility of metal species related to
variations in cation and carbonate loadings in the 100% CS column within
the pH range encountered during the continuous-flow columns
experiment (pH 2.5-7.5). In fact, iteration A for all 9 scenarios produced
similar results, indicating the SO42-
:HS- ratio dominates solubility of
metals within each of the systems under the given circumstances.
1.E-18
1.E-16
1.E-14
1.E-12
1.E-10
1.E-08
1.E-06
1.E-04
1.E-02
1.E+00
-1 4 9 14
log
[Me
] (M
)
pH
Al
Co
Fe
Mn
Ni
Zn
1A
1.E-18
1.E-16
1.E-14
1.E-12
1.E-10
1.E-08
1.E-06
1.E-04
1.E-02
1.E+00
-1 4 9 14
log
[Me
] (M
)
pH
Al
Co
Fe
Mn
Ni
Zn
2A
1.E-18
1.E-16
1.E-14
1.E-12
1.E-10
1.E-08
1.E-06
1.E-04
1.E-02
1.E+00
-1 4 9 14
log
[Me
] (M
)
pH
Al
Co
Fe
Mn
Ni
Zn
3A
Page 133
119
Figure G-2. Effect on solubility/saturation of total dissolved Fe as
SO42-
:HS- ratios are increased (increased SO4
2-:HS
- ratio indicates limited
or no sulfate reduction is occurring).
1.E-18
1.E-16
1.E-14
1.E-12
1.E-10
1.E-08
1.E-06
1.E-04
1.E-02
1.E+00
-1 4 9 14
log
[Me
] (M
)
pH
Al
Co
Fe
Mn
Ni
Zn
3A
1.E-17
1.E-15
1.E-13
1.E-11
1.E-09
1.E-07
1.E-05
1.E-03
1.E-01-1 4 9 14
log
[Me
] (M
)
pH
Al
Co
Fe
Mn
Ni
Zn
3C
1.E-16
1.E-14
1.E-12
1.E-10
1.E-08
1.E-06
1.E-04
1.E-02
1.E+00
-1 4 9 14
log
[Me
] (M
)
pH
Al
Co
Fe
Mn
Ni
Zn
3E
Page 134
120
Appendix H
Organic Carbon Mass Balance Calculations
An organic C mass balance was conducted on each column to determine the amount, if
any, of organic C remaining within the substrate materials at completion of the experiment (after
181 days of continuous flow operations). The stoichiometric ratio of carbon within the crab shell
structure was determined to be
The starting mass of organic C within each column was calculated using the formula:
Where is the calculated mass (mg) of organic C within the column.
is the mass (mg) of crab shell in the substrate mixture.
is the mass (mg) of spent mushroom compost in the substrate mixture.
is the carbon content of crab shell (%).
is the carbon content of spent mushroom compost (%).
is the % of the total carbon which is organic carbon. Calculated from the
stoichiometric carbon content of chitin, protein, and mineral portions of crab
shells and found to be 58%.
is the % of the total carbon which is organic carbon. Determined to be 100%
for SMC as there are no known sources of inorganic carbon within SMC.
Values for and can be found in Table 2-3and and can be found in Table
2-4.
The total mass of organic C exiting each column was calculated using the formula:
Page 135
121
Where is the calculated mass (mg) of organic C exiting the column
n is the sampling iteration
is the effluent DOC concentration (mg/L) at sampling iteration (n)
is the PV of MIW treated between the current sampling iteration (n) and
the previous sampling iteration (n-1)
is the effective pore volume (L) for the column (found in Table 3-2)
The following assumptions were made:
1). The concentration (mg/L) at each sampling iteration was assumed to be constant over
the entire volume of MIW treated since the previous sampling iteration (
).
2). was assumed to be 1 for the first sampling iteration (immediately
following incubation) as the column was filled with 1 PV of MIW during incubation.
Calculations were accomplished in Microsoft Excel, and results are provided in Table H-1.
Table H-1. Organic carbon mass balance for continuous-flow columns treating Klondike-1 MIW
(performed at completion of experiment, after 181 days of operation).
Treatment Column mOC in mOC out mOCremaining % OC
remaining
Sand Control 126 132 -6 -5%
100% CS 5694 3840 1854 33%
90% CS + 10% SMC 5617 2594 3023 54%
80% CS + 20% SMC 5540 2048 3493 63%
70% CS + 30% SMC 5464 2078 3385 62%
60% CS + 40% SMC 5387 1671 3716 69%
50% CS + 50% SMC 5310 1503 3807 72%
Traditional 90% SMC + 10% LS 4446 250 4196 94%
Page 136
122
Results indicated a general correlation (R2=.88) between the amount of crab shell within
the system and the % OC utilized (Figure H-1).
Figure H-1. Correlation between amount of crab shell within treatment system and amount of
original organic carbon remaining within system at completion of continuous-flow
experiment treating Klondike-1 MIW.
R² = 0.8838
0%
10%
20%
30%
40%
50%
60%
70%
80%
90%
100%
0 20 40 60 80 100
% O
rgan
ic C
Rem
ain
ing
% Crab Shell in System
Page 137
123
Appendix I
Treatment Scale-up using a 1:1 Crab Shell to Proppant Ratio
Chapter 4.5 discussed the longevity estimations for columns packed under ideal usage
conditions with a crab shell to proppant ratio of 1:1 by mass. The following calculations were
used to determine the actual mass of substrate materials that could have theoretically fit into the
~700 mL volume of the continuous-flow column. Bolded lines indicate the closest value to 700
mL. Once total theoretical masses were calculated, they were divided by the actual mass of
substrate used in each treatment column (40 g) to determine a scale-up factor (Table I-8)
Table I-1. Theoretical total mass of crab shell and sand able to fit into a 100% crab shell column
(~700 mL) assuming a 1:1 crab shell to sand proppant mass ratio.
100% Crab Shell
Crab Shell (CS) Sand CS + Sand
Volume
(mL)
Mass
(g)
Volume
(mL)
Mass
(g)
Volume
(mL)
315 700 315 203 903
299 665 299 193 858
284 630 284 183 813
268 595 268 173 768
252 560 252 163 723
249 553 249 161 714
246 546 246 159 705
243 539 243 156 695
189 420 189 122 542
Bulk density of CS = 0.45 g/mL; Bulk density of sand = 1.55 g/mL
Page 138
124
Table I-2. Theoretical total mass of crab shell, SMC, and sand able to fit into a 90% crab shell +
10% SMC column (~700 mL) assuming a 1:1 crab shell to sand proppant mass ratio.
90% Crab Shell & 10% SMC
Crab Shell (CS) SMC Sand CS + SMC + Sand
Volume
(mL)
Mass
(g)
Volume
(mL)
Mass
(g)
Volume
(mL)
Mass
(g)
Volume
(mL)
248 550 28 92 248 160 801
243 539 27 90 243 156 785
238 528 26 88 238 153 769
233 517 26 86 233 150 753
228 506 25 84 228 147 737
223 495 25 83 223 144 721
218 484 24 81 218 141 705
213 473 24 79 213 137 689
Bulk density of CS = 0.45 g/mL; Bulk density of SMC = 0.3 g/mL; Bulk density of sand = 1.55 g/mL
Table I-3. Theoretical total mass of crab shell, SMC, and sand able to fit into a 80% crab shell +
20% SMC column (~700 mL) assuming a 1:1 crab shell to sand proppant mass ratio.
80% Crab Shell & 20% SMC
Crab Shell (CS) SMC Sand CS + SMC + Sand
Volume
(mL) Mass
(g)
Volume
(mL)
Mass
(g)
Volume
(mL)
Mass
(g)
Volume
(mL)
216 480 54 180 216 139 799
212 470 53 176 212 137 783
207 461 52 173 207 134 767
203 451 51 169 203 131 751
199 442 50 166 199 128 735
194 432 49 162 194 125 719
190 422 48 158 190 123 703
186 413 46 155 186 120 687
181 403 45 151 181 117 671
Bulk density of CS = 0.45 g/mL; Bulk density of SMC = 0.3 g/mL; Bulk density of sand = 1.55 g/mL
Page 139
125
Table I-4. Theoretical total mass of crab shell, SMC, and sand able to fit into a 70% crab shell +
30% SMC column (~700 mL) assuming a 1:1 crab shell to sand proppant mass ratio.
70% Crab Shell & 30% SMC
Crab Shell (CS) SMC Sand CS + SMC + Sand
Volume
(mL) Mass
(g)
Volume
(mL)
Mass
(g)
Volume
(mL)
Mass
(g)
Volume
(mL)
191 425 82 273 191 123 822
187 417 80 268 187 121 805
184 408 79 262 184 118 789
180 400 77 257 180 116 772
176 391 75 251 176 114 756
172 383 74 246 172 111 739
168 374 72 240 168 109 723
164 366 70 235 164 106 707
161 357 69 230 161 104 690
Bulk density of CS = 0.45 g/mL; Bulk density of SMC = 0.3 g/mL; Bulk density of sand = 1.55 g/mL
Table I-5. Theoretical total mass of crab shell, SMC, and sand able to fit into a 60% crab shell +
40% SMC column (~700 mL) assuming a 1:1 crab shell to sand proppant mass ratio.
60% Crab Shell & 40% SMC
Crab Shell (CS) SMC Sand CS + SMC + Sand
Volume
(mL) Mass
(g)
Volume
(mL)
Mass
(g)
Volume
(mL)
Mass
(g)
Volume
(mL)
158 350 105 350 158 102 802
154 343 103 343 154 100 786
151 336 101 336 151 98 770
148 329 99 329 148 96 754
145 322 97 322 145 93 737
142 315 95 315 142 91 721
139 308 92 308 139 89 705
135 301 90 301 135 87 689
132 294 88 294 132 85 673
Bulk density of CS = 0.45 g/mL; Bulk density of SMC = 0.3 g/mL; Bulk density of sand = 1.55 g/mL
Page 140
126
Table I-6. Theoretical total mass of crab shell, SMC, and sand able to fit into a 50% crab shell +
50% SMC column (~700 mL) assuming a 1:1 crab shell to sand proppant mass ratio.
50% Crab Shell & 50% SMC
Crab Shell (CS) SMC Sand CS + SMC + Sand
Volume
(mL)
Mass
(g)
Volume
(mL)
Mass
(g)
Volume
(mL)
Mass
(g)
Volume
(mL)
124 275 124 413 124 80 767
121 270 121 404 121 78 752
119 264 119 396 119 77 737
116 259 116 388 116 75 721
114 253 114 380 114 73 706
111 248 111 371 111 72 691
109 242 109 363 109 70 675
106 237 106 355 106 69 660
Bulk density of CS = 0.45 g/mL; Bulk density of SMC = 0.3 g/mL; Bulk density of sand = 1.55 g/mL
Table I-7. Theoretical total mass of SMC and limestone able to fit into a traditional 90% SMC +
10% limestone column (~700 mL).
90% SMC & 10% Limestone Chips
SMC Limestone SMC + Limestone
Volume
(mL)
Mass
(g)
Volume
(mL)
Mass
(g)
Volume
(mL)
210 700 23 18 718
206 686 23 18 704
202 672 22 18 690
197 658 22 17 675
193 644 21 17 661
189 630 21 16 646
185 616 21 16 632
Bulk density of SMC = 0.3 g/mL; Bulk density of limestone = 1.28 g/mL
Page 141
127
Table I-8. Calculated scale-up factors based on theoretical total mass of substrate required to fill
~700 mL volume and actual mass used in the experiment.
Treatment Column
Theoretical
Mass Substrate
Required (g)
Total Mass
Substrate in
Experiment (g)
Scale-up
Factor
100% CS 246 40 6.2
90% CS + 10% SMC 242 40 6.1
80% CS + 20% SMC 238 40 6.0
70% CS + 30% SMC 235 40 5.9
60% CS + 40% SMC 226 40 5.7
50% CS + 50% SMC 213 40 5.3
Traditional 90% SMC + 10% LS 229 40 5.7
Page 142
128
Appendix J
Field Pilot System Installation and Sampling Photos
Figure J-1. MIW at the Klondike-1 site.
Page 143
Figure J-2. Tank piping modifications and installation of underdrain piping network, July 26,
2010.
Figure J-3. Placement of septic tanks used to simulate pilot-scale VFPs to treat MIW at the
Klondike-1 site.
Page 144
Figure J-4. Placement of rock underdrains into tanks, done manually to avoid damage to
underdrain piping system!
Page 145
Figure J-5. Completed installation of limestone rock underdrain system
Figure J-6. 1,000 pound super sack of crab shell unloaded into back of dump truck to be mixed
with sand proppant and SMC.
Page 146
Figure J-7. Filling of organic substrate mixtures into pilot-scale VFPs to treat MIW at the
Klondike-1 site
Page 147
Figure J-8. Placement of microbial tea-bag style sampling pouches 8-10 inches into organic
substrate material.
Page 148
Figure J-9. A layer of pea gravel was added to the top of each reactor to prevent loss/disturbance
of organic substrate.
Page 149
Figure J-10. Installation of influent piping system. Pipes were emplaced to gravity feed from an
oxidation pond of the existing full-scale treatment system at the Klondike-1 site. A
dock was built to facilitate maintenance of influent hose lines.
Page 150
Figure J-11. Individual influent hoses attach to the buried PVC piping approximately 12 inches
below the water surface and feed water to each pilot-scale VFP. Water enters
through ¼ inch holes drilled into the final 2 feet of flexible tubing, which is covered
with mesh to discourage iron precipitates from entering the system.
Figure J-12. Piping network leading from oxidation pond of current full-scale treatment system
to feed pilot-scale VFPs.
Page 151
Figure J-13. View of the four pilot-scale VFPs and aerobic settling ponds.
Figure J-14. Earl Smithmyer, President of the CCWA, assisted tremendously with the pilot-
system installation, specifically with the piping networks.
Page 152
Figure J-15. Water was added to the pilot-scale VFPs on August 2, 2010. Some overflow
problems were encountered with the settling ponds, as they were not properly
leveled.
Figure J-16. Orifices were created to maintain a flow rate of 0.2 gallons per minute throughout
the pilot-scale study.
Page 153
Figure J-17. Aeration of the tank effluent was encouraged via a miniature cascade constructed
with corrugated piping.
Page 154
Figure J-18. The system was flushed and then left to incubate for a week prior to initiation of
continuous-flow operations.
Figure J-19. Sampling event at the pilot-scale VFPs during Fall 2010.
Page 155
Figure J-20. As expected, the pilot systems froze over the winter months.
Page 156
Figure J-21. Many thanks to Shan Lin and Sara Goots, whose help made the pilot system install
go quickly, and who have conducted analysis of the data from the field pilot-scale
study!
Figure J-22. Thanks to Duke, for cheerfully spending his summer at the Klondike-1 site with me!