31
REMOTE SENSING AND GIS Presented by, M.Uma Maheshwari II M.Sc Botany
| Date post: | 28-Jul-2015 |
| Category: |
Environment |
| Upload: | nandhini-rajan |
| View: | 88 times |
| Download: | 1 times |
REMOTE SENSING AND GIS
Presented by,M.Uma Maheshwari
II M.Sc Botany

Remote sensing
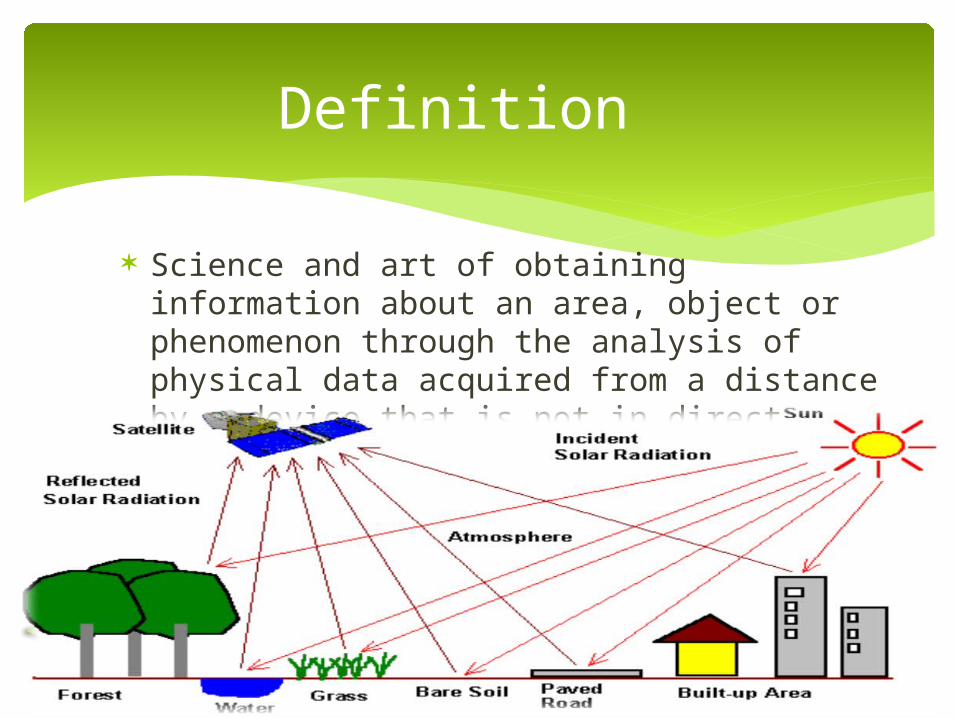
Science and art of obtaining information about an area, object or phenomenon through the analysis of physical data acquired from a distance by a device that is not in direct contact
Definition
1858 Balloonist G.Tournachon made photographs of Paris from his balloon.
Systematic aerial photography developed for military and reconnaissance purposes beginning in World War I and reaching a climax during the Cold War .
Artificial satellites in the latter half of the 20th century
History
Data acquisitionEnergy sourcePropagation of energyAir borne/soil borne sensorsPresentation of sensor data in pictoral or digital form
Data analysis Collection of ground data Interpretation of pictoral data Interpretation of digital data Preparation of maps
Basic concepts
Photographic Non photographic
Sensors used in RS system
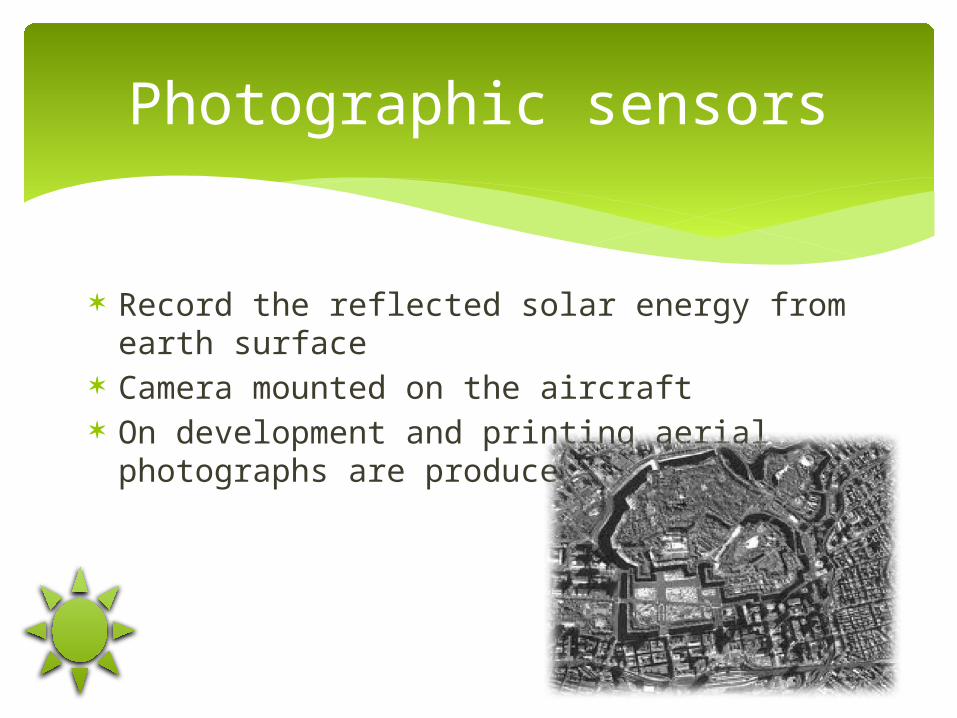
Record the reflected solar energy from earth surface
Camera mounted on the aircraft On development and printing aerial
photographs are produced
Photographic sensors

Also called Multi Spectral Scanner (MSS) Record wide spectral range Operated from aircrafts and satellites Indispensible for satellite borne RS system It scans the ground, line by line
perpendicular to the direction of satellite or air craft
The scanning rate in adjusted
Non photographic sensors
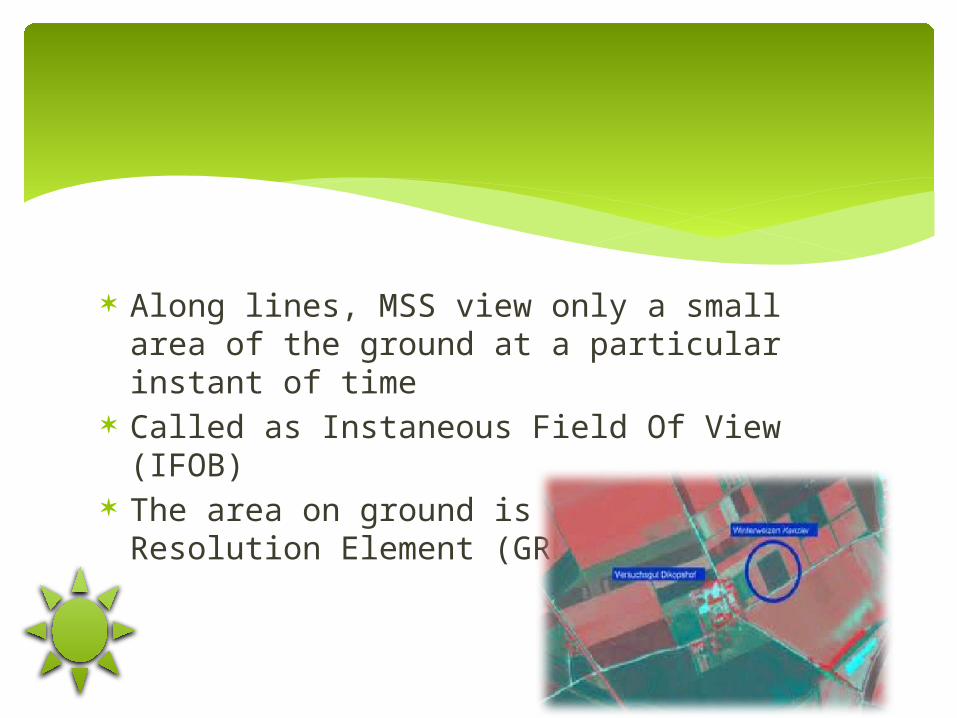
Along lines, MSS view only a small area of the ground at a particular instant of time
Called as Instaneous Field Of View (IFOB) The area on ground is called Ground
Resolution Element (GRE) or pixel

Terrestrial ecology Aquatic ecology Animal ecology Ecological damage
Application
By using FCC existing forest can be studied Study area can be mapped and classified
into various canopy classes Any decrease in forest can be easily
determined Forest map is essential for planning of
sampling sites Evaluation of remote sensing using aerial
photograph in a scale of 1:15000 provide multi level information
Terrestrial ecology

Prohibitive cost Non availability of recent and sequential
photographs Restricted nature Problems related to procurement and scale
distortion
Limitations of RS in forest inventories
AP and FCC can be utilized to locate and determine sites from water samples for planktonic studies
FCC can be used for Determining different natural basins Selection of water sampling sites for determining
various chemical quality Level of pollution of surface water
Aquatic ecology

Location of an animal for plotting movements and calculating home range
To assist in location of an animal for direct observation
To record data like EEG, ECG, respiration rate and internal or surface body temperature
Animal ecology

Environmental impact assessment Offshore fishing Crop inventory Crop yielding forecasting
Other applications in ecology
Monitor ecological threats and long term effects to the earth’s natural surface and areas relevant to human activities
Much damage is imposed on vegetation such as areas affected by forest fires and grassland burns
Very easy to see the destruction deposits with volcanic eruptions and sand storms
Oil spills – another catastrophe Monitoring any changes that threats the lives of
endangered animal or plant life
Ecological damage
GIS-Geographic Information System
GIS is a system for managing spatial data and associated attributes
Performs 5 tasks Input Manipulation Management Query and analysis Visualization
Definition
Relating information from different sources Data representation Data capture Data manipulation Projections, coordinate systems and
registration Spatial analysis Graphic display techniques
Techniques used in GIS

Two components Graphical data about geographical features Tabular data about features in the geography
Working patterns of GIS
Variety of GIS software is available Important functional capabilities include
Data capture Data storage Data management Data retrieval Data analysis Data display
Selecting a GIS

Must have a spatial component All information are geo – referenced Geocoding- two methods
Scanning Digitizing
Involves in identifying the objects, location on earth surface and their spatial relationships
Data capture
Possible to link or integrate information through various means
Agricultural records can indicate how much pesticide has been applied to a parcel of land
By locating the parcels and intersecting them with streams can predict amount nutrient run off
Data integration
Tremendous amount of data into a map Decrease in low cost of disks the
development of high-density storage media Data sets on common server solves storage
problems accessible to multiple users
Data storage

Projection is a fundamental component of map making
Transferring information from earth’s 3 D to 2 D medium (paper or computer screen)
Projection and registration

GIS convert data from one structure to another
Satellite image is converted into readable form in raster format
Raster files can be easily read by the computer
Data structures
1 1 1 1 1 3 3 3
1 1 1 1 1 1 3 3
1 1 1 2 2 1 3 3
1 1 1 2 2 2 3 3
1 1 1 2 2 2 3 3
1 1 1 2 2 3 3 3
1 1 1 1 1 1 3 3
1 1 1 1 1 1 3 3
Samples taken in discrete location Used to depict 2D, 3D of earth’s surface It is easy to locate the different area with pH
value of oil and also soil
Data modeling

Support the retrieval of features or by spatial characteristics
Position of a single feature Buffering is a action that retrieves within a
specified distance of a line, point or area
Data retrieval
Spreadsheet and database analysis Computing new attributes Generating summary statistics Creating reports
Data analysis
GIS is automated map making technology Prolific producer of maps GIS user can change scale at a push of a
button But controlling the content is not so easy
Map making

Environmental studies, geography, geology, planning, business marketing
Help to analyze large datasets Better understanding of terrestrial process Human activities to improve economic
vitality and environmental quality
Application


