May 19-22, 2015 GEO-Latin American & Caribbean Water Cycle Capacity Building Workshop Cartagena, Colombia 1 Climate Variability, Hydrology, and Flooding Remote Sensing Observations for Flood Monitoring and Socioeconomic Data for Flood Management
Transcript
May 19-22, 2015
GEO-Latin American & Caribbean Water Cycle Capacity Building Workshop Cartagena, Colombia
1
Climate Variability, Hydrology, and Flooding
Remote Sensing Observations for Flood Monitoring and Socioeconomic Data for Flood Management
May 19-22, 2015
GEO-Latin American & Caribbean Water Cycle Capacity Building Workshop Cartagena, Colombia
2
Objective
To present NASA remote sensing observations and concepts used for flood monitoring and mapping; and introduce socioeconomic data useful for flood management
May 19-22, 2015
GEO-Latin American & Caribbean Water Cycle Capacity Building Workshop Cartagena, Colombia
3
Outline
▪ Key Concepts for Using Remote Sensing Observations for Flood Monitoring
▪ Hydrological Parameters Relevant to Flood Monitoring ▪ NASA Earth Science Missions and Sensors Relevant to
Flood Monitoring ▪ NASA Flood Monitoring Web-Tools (selected tools will be
covered in detail today) ▪ NASA Socioeconomic Data for Flood Management ▪ Introduction to the UN Disaster Risk Reduction: Global
Assessment Report 2015
There are two basic concepts of using remote sensing observations for flood monitoring 1) Use of satellite-derived rainfall to infer flooding conditions or use the rainfall and surface weather data in a hydrology model to derive streamflow or runoff to monitor flooding conditions. 2) Use satellite-derived land-cover observations to detect flood water on previously dry land surface.
Key Concepts for Using Remote Sensing Observations for Flood Monitoring
4
5
Hydrological Parameters Relevant to Flood Monitoring
Hydrological Information Crucial for Flood Monitoring
❑ Rain Rate and Accumulated Rain Amount
❑ Snow Melt Rate
❑ Soil Condition: soil moisture, temperature, land cover
❑ Reservoir/River Level
❑ Storm Water Drainage System (urban floods)
❑ Terrain
6
❑ Rain ❑ Surface Temperature ❑ Soil Moisture ❑ Snow/Ice ❑ Clouds ❑ Terrain* ❑ Ground Water ❑ Land Cover* ❑ Evapotranspiration ❑ Run off
NASA Satellites and Atmosphere-land Models for Flood Monitoring
All these quantities are available from satellite observations as well as from models Quantities in green are derived from satellite observations Quantities in red are from land and atmosphere-land models in which satellite observations are assimilated
Useful for direct observations of flooding conditions and/or for inputs to hydrology models
*Terrain Data are available from the Shuttle Radar Topography Mission *Land Cover is used for detecting inundated surface surface
7
8
NASA Earth Science Missions and Sensors Relevant to Flood Monitoring
Landsat (07/1972-present)
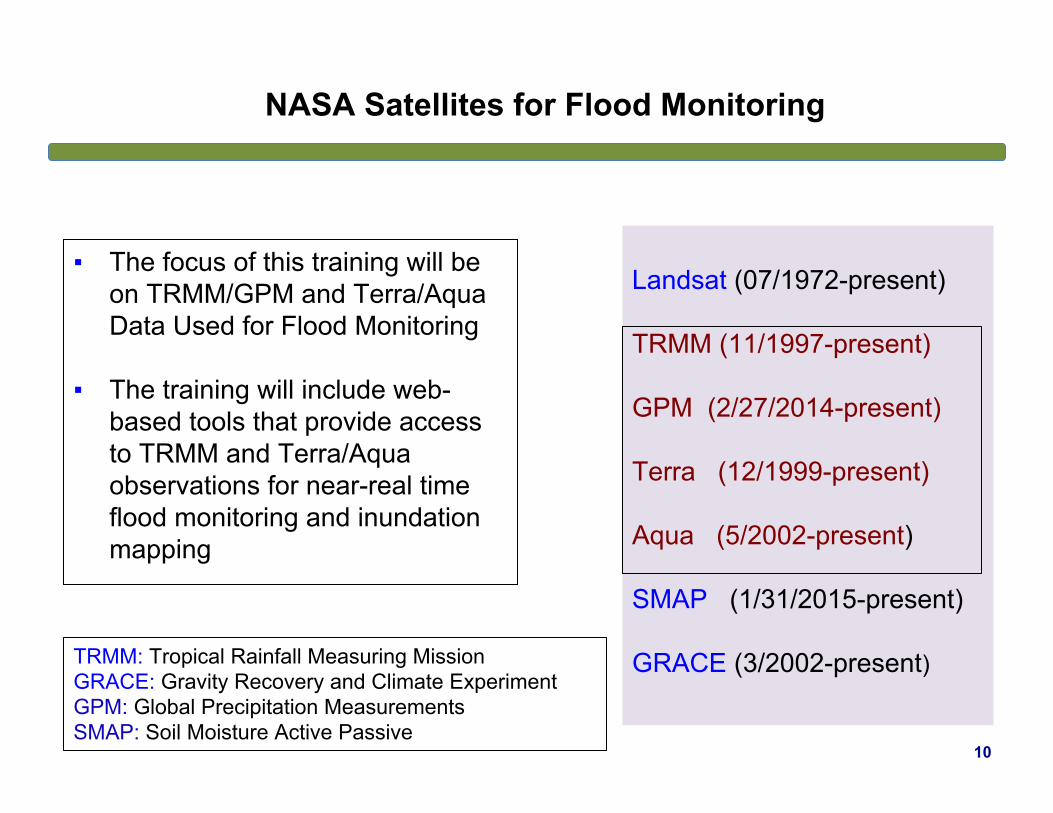
TRMM (11/1997-present) GPM (2/27/2014-present) Terra (12/1999-present) Aqua (5/2002-present) SMAP (1/31/2015-present) GRACE (3/2002-present) TRMM: Tropical Rainfall Measuring Mission
GRACE: Gravity Recovery and Climate Experiment GPM: Global Precipitation Measurements SMAP: Soil Moisture Active Passive
NASA Satellites for Flood Monitoring
9
Landsat (07/1972-present)
TRMM (11/1997-present) GPM (2/27/2014-present) Terra (12/1999-present) Aqua (5/2002-present) SMAP (1/31/2015-present) GRACE (3/2002-present)
TRMM: Tropical Rainfall Measuring Mission GRACE: Gravity Recovery and Climate Experiment GPM: Global Precipitation Measurements SMAP: Soil Moisture Active Passive
NASA Satellites for Flood Monitoring
▪ The focus of this training will be on TRMM/GPM and Terra/Aqua Data Used for Flood Monitoring
▪ The training will include web-
based tools that provide access to TRMM and Terra/Aqua observations for near-real time flood monitoring and inundation mapping
10
TRMM: Most Used for Flood Monitoring and Modeling GPM: Successor of TRMM will Replace TRMM in Late 2015
❑ One active and two passive rain sensors:
Precipitation Radar (PR) TRMM Microwave Imager (TMI) Visible and Infrared Scanner (VIRS) ❑ There are 16 TRMM orbits a day
covering the global tropics between 35° S to 35°N.
❑ Spatial resolution varies from: 5 to 45 km
❑ One active and one passive rain sensors:
Dual Frequency Precipitation Radar (DPR) GPM Microwave Imager (GMI) ❑ There are 16 TRMM orbits a day
covering global tropical and higher latitudes between 65°S to 65°N
❑ Spatial resolution varies from: 4 to 32 km
TRMM (11/1997-Present) GPM (2/2014-Present)
http://pmm.nasa.gov/TRMM http://pmm.nasa.gov/GPM
Review
11
Terra and Aqua Satellites Carry a Suite of Sensors MODIS is used for Inundation Mapping
❑ Multiple Passive Sensors: Advanced Spaceborne Thermal Emission and Reflection Radiometer (ASTER) Clouds and Earth’s Radiant Energy System (CERES) Multi-angle Imaging Spectroradiometer (MISR) Measurements of Pollution in the Troposphere
TRMM /GPM provide direct observations of surface rainfall. The rainfall data: i) are used to infer flooding conditions ii)are used in conjunction with a hydrology model to derive streamflow or runoff MODIS provides observations of land-surface characteristics. MODIS reflectance from various bands indicates the presence of water on land surface.
Flood Monitoring: TRMM/GPM Inundation Mapping: Terra & Aqua/MODIS
15
▪ TRMM Current Heavy Rain, Flood and Landslide Estimates Tool
▪ Extreme Rainfall Detection System – Version 2 (ERDS2) (http://
www.ithacaweb.org/projects/erds/) ▪ Global Flood Monitoring System (http://flood.umd.edu/) ▪ Dartmouth Flood Observatory and Global Disaster Alert and
Coordination System (GDACS) : Experimental River Discharge Data using TRMM Imager
TRMM-based Flooding Tools
16
❑ MODIS NRT Global Flood Mapping (http://oas.gsfc.nasa.gov/floodmap/) ❑ Dartmouth Flood Observatory (http://floodobservatory.colorado.edu/)
MODIS-based Inundation Mapping Tools
17
Flood Tool Satellite/Instrument Or Model
Quan..es Used as Inputs
Hydrological Model
NASA-TRMM ERDS
TRMM/TMPA-RT TRMM/TMPA-RT
Rain Rate Rain rate
NRC-CN1 --------------------
GFMS TRMM/TMPA-RT MERRA
Rain Rate Surface TemperatureWinds
VIC- UMD DRTR2
1Natural Resources Conservation Service (NRCS) runoff curve number (CN) method 2The University of Washington Variable Infiltration Capacity (VIC) land surface model coupled with the University of Maryland Dominant River Tracing Routing (DRTR) model
Flood Tools Using TRMM and Hydrologic Models Most of these tools have interactive, near-real time flood mapping capability with flood potential and/or streamflow/run-off
Summary of Flood Tools
Summary of Flood Tools
MODIS-based Flood Inundation Mapping Tools These tools have interactive, near-real time inundation mapping capability
Flood Tool Satellite/(Instrument
Quan.ty Used
MODIS NRT Terra and Aqua/MODIS
Reflectance Bands 1, 2, 7
DFO Terra and Aqua / MODIS
Reflectance Bands 1, 2, 7
Summary of Flood Tools
Flood Tool Rainfall (Used as Input)
Flood poten.al/Intensity
River Discharge/Streamflow
Inunda.on Map
NASA-‐TRMM ERDS
X X
GFMS X X X
MODIS/NRT X DFO X
(Experimental limited
number of river basins)
X
Flooding Monitoring Output
Ø MODIS provides surface inundation only, can not view the surface in the presence of clouds, mountain and cloud shadows may get interpreted as water
Ø TRMM Rain, used along with hydrologic model and other weather and surface data provide quantitative river streamflow and runoff information but regional calibration and validation are recommended with regional stream gauge data
Summary More About the Flood Tools
Flood Monitoring Tool
Spa.al Coverage and Resolu.on
Comment
NASA-TRMM NRT 50°S-50°N 12 Km
Includes GFMS, Landslide Potential
GFMS 50°S-50°N 12 Km
Will be available at 1Km resolution. Predictive capability
will be added soon
MODIS NRT Global 250 M
May not be effective in presence of clouds
DFO
Experimental
Global 250 m and
10 km
Same as MODIS NRT. River discharge data derived from TMI
and AMSR/AMSR2*
*AMSR : Advanced Microwave Scanning Radiometer flying on Aqua satellite (2002-2011) and and AMSR2 is flying on Global Change Observation Mission (GCOM-W) satellite (May 2012 to present)
22
NASA Socioeconomic Data for Flood Management
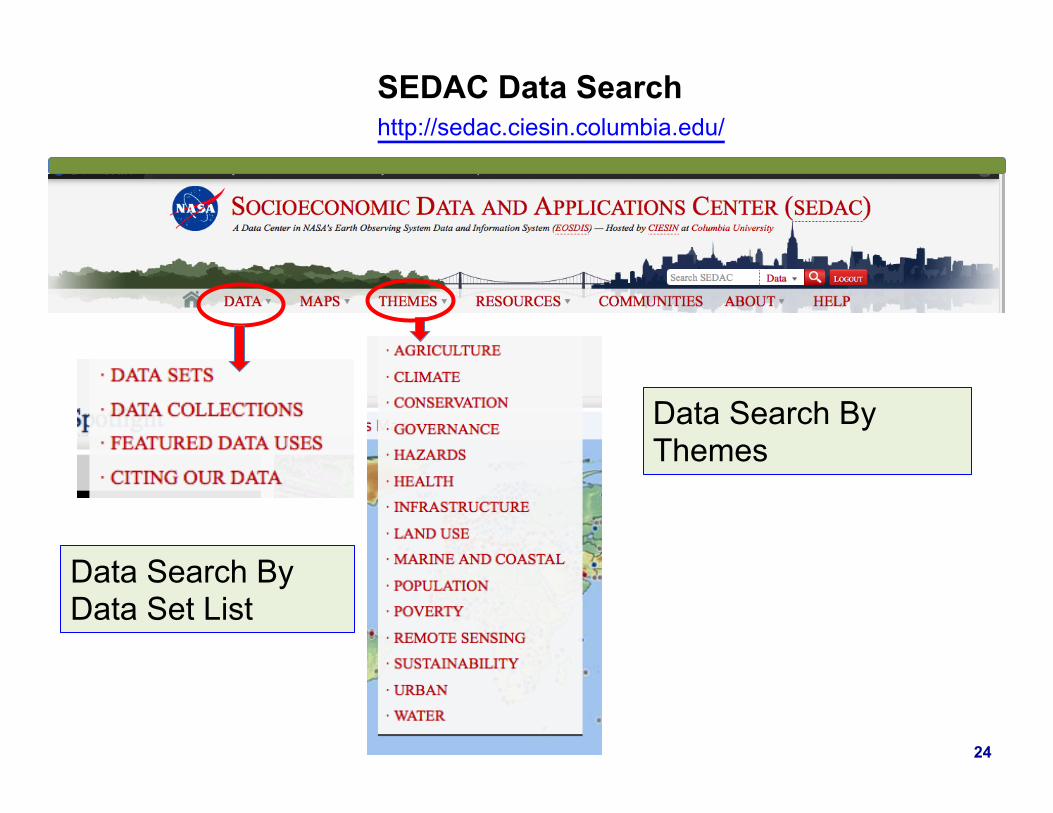
http://sedac.ciesin.columbia.edu/
NASA Socioeconomic Data and Applications Center (SEDAC)
▪ NASA Remote sensing data and tools are useful for the flood warning and preparedness phase
▪ NASA also provides socioeconomic data that can be
used along with the flood monitoring tools to facilitate the post-flooding rescue and recovery phases
▪ These data are available from SEDAC for visualization
and download
23
http://sedac.ciesin.columbia.edu/
SEDAC Data Search
Data Search By Themes
Data Search By Data Set List
24
http://sedac.ciesin.columbia.edu/
SEDAC Data Mapping and Other Resources
Multiple Options for Data Visualization
Information and Documents about the Datasets
25
http://sedac.ciesin.columbia.edu/
SEDAC Data Sets
There are 189 Data Sets for 16 Thematic Areas
26
http://sedac.ciesin.columbia.edu/maps/tools
SEDAC Map Tools
Interactive and easy to use
More advanced tools
27
http://sedac.ciesin.columbia.edu/maps/client
SEDAC Map Viewer
Multiple Layers
Global and Regional Selections
Theme Selection
28
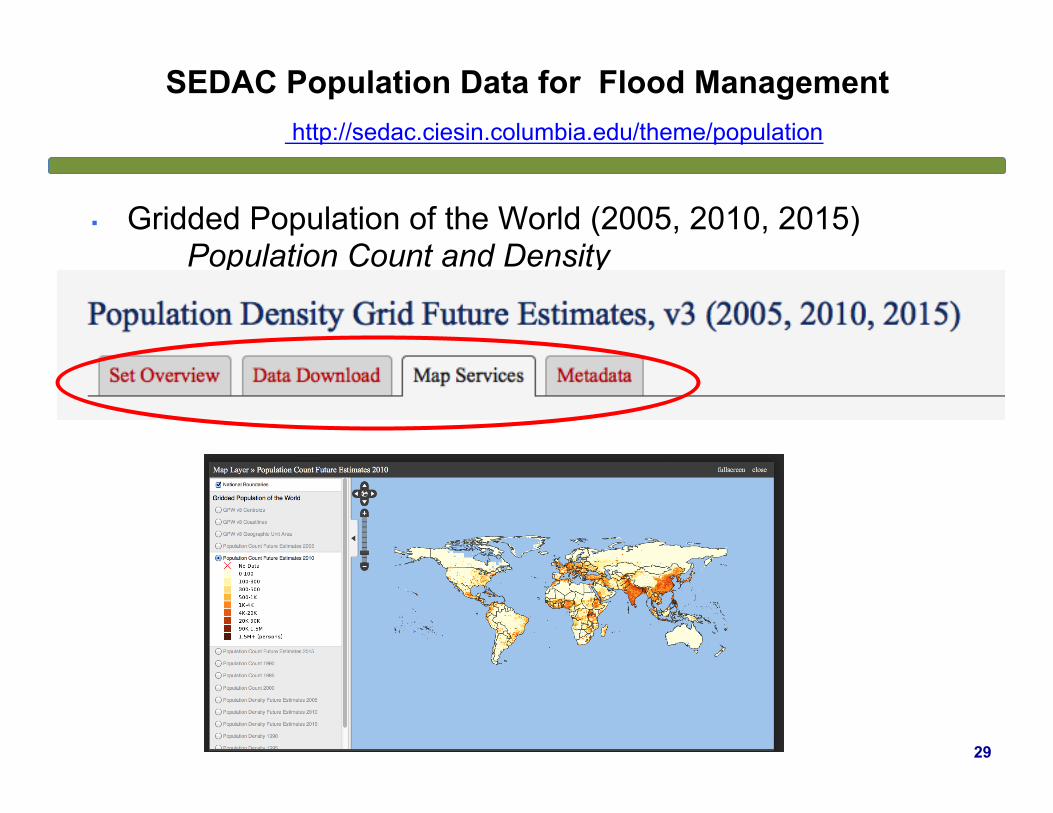
http://sedac.ciesin.columbia.edu/theme/population
SEDAC Population Data for Flood Management
▪ Gridded Population of the World (2005, 2010, 2015) Population Count and Density