Page 1
Removal of H2S Biogas Using Synthesized Activated
Carbon from Different Biomass Waste
By
Janna Qutaina Khullood AL-Junaidi
Supervisors
Dr. Hassan Sawalha
Dr. Maher Maghalseh
Submitted to the College of Engineering
in partial fulfillment of the requirements for the degree of
Bachelor degree in Environmental Technology Engineering
Palestine Polytechnic University
Dec. 2017
Page 2
II
Removal of H2S Biogas Using Synthesized Activated Carbon from
Different Biomass Waste
By
Janna Qutaina Khullood AL-Junaidi
Supervisors
Dr. Hassan Sawalha________________________
Dr. Maher Maghalseh_______________________
Discussants:
Dr.Maher Al-Jabary______________________
Eng.Hiba Slemeyeh_______________________
Submitted to the College of Engineering
in partial fulfillment of the requirements for the degree of
Bachelor degree in Environmental Technology Engineering
Palestine Polytechnic University
Dec. 2017
Page 3
III
Dedication
We would like to dedicate this work to
our beloved Parents and families
For their love, endless support, encouragement
and sacrifices
&
to the
Environmental engineering staff and students, who has
given us wisdom & knowledge,
patience, and love.
Page 4
IV
ACKNOWLEDGEMENTS
We offer sincere thanks to our parents and families for their endless support,
encouragement, and love.
We also would like to express our sincere gratitude for our supervisors Dr. Hassan
Sawalha and Dr. Maher Maghalseh for their guidance, supervision, unlimited patience and
support.
Our heartfelt thanks go to Environmental Engineering family for their support and for
the most beautiful moments that we shared with them from the beginning to now.
Thanks to everyone who contributed to the success of the project;
Environmental engineering Lab. Supervisor; Eng.Hiba Slemeyeh
Chemistry Lab. Supervisors,
Soil Mechanics Lab. Supervisors
Special thanks to our friends for the funny and relaxed moments we have shared all
together.
The task would have certainly been much more difficult without those people’s calm
and generous natures.
Page 5
V
Table of Contents
Dedication ................................................................................................................................... III
Acknowledgements ...................................................................................................................... IV
Table of Contents ......................................................................................................................... V
Lists of Figures ......................................................................................................................... VIII
Lists of Tables .............................................................................................................................. IX
Abstract (English) ........................................................................................................................ X
Abstract(Arabis) .......................................................................................................................... XI
Chapter One
Research Concept
1.1Introduction .............................................................................................................................. 2
1.2 Problem Statement .................................................................................................................. 5
1.3 Goals and Objectives .............................................................................................................. 5
1.4 Significance of Study ............................................................................................................... 6
1.5 Methodology ............................................................................................................................ 6
1.6 Budget ...................................................................................................................................... 6
1.7 Action Plan ............................................................................................................................... 8
Chapter Two
Literature Review
Activated Carbon Production
2.1 Introduction ........................................................................................................................... 10
2.2 Carbonization ........................................................................................................................ 10
2.1.1 Pyrolysis .......................................................................................................................... 11
2.1.2 Types of pyrolysis ........................................................................................................... 12
2.1.3 Products from pyrolysis .................................................................................................. 12
2.2 Biochar ................................................................................................................................... 13
2.3 Factors affecting Biochar production ................................................................................. 13
Page 6
VI
2.3.1 Type of biomass: ............................................................................................................. 13
2.3.2 Heating rate: .................................................................................................................... 15
2.3.3 Temperature: ................................................................................................................... 15
2.3.4 Residence time: ............................................................................................................... 16
2.4 Activation ............................................................................................................................... 16
2.4.1 Physical Activation ......................................................................................................... 17
2.4.2 Chemical Activation........................................................................................................ 17
2.4.3 Physiochemical activation ............................................................................................... 17
2.5 Activated carbon ................................................................................................................... 18
2.6 Literature review on activated carbon production ............................................................ 19
Chapter Three
Literature Review
Adsorption of Hydrogen Sulfide
3.1 Introduction ........................................................................................................................... 22
3.2 Adsorption ............................................................................................................................. 22
3.3 Equilibrium Relations for Adsorbents ................................................................................ 23
3.2.1 Linear isotherm ............................................................................................................... 23
3.2.2 Freundlich isotherm ........................................................................................................ 24
3.2.3 Langmuir isotherm .......................................................................................................... 24
3.4 Breakthrough Curve ............................................................................................................. 24
Chapter Four
Experimental Work
4.1 Materials ................................................................................................................................ 31
4.2 Activated carbon production ............................................................................................... 31
4.3 Adsorption Tests ................................................................................................................... 33
4.3.1 Effect of biomass precursor type..................................................................................... 34
4.3.2 Effect of activation reagent ............................................................................................. 34
4.3.3 Effect of bed height ......................................................................................................... 34
4.4 Data Analysis ......................................................................................................................... 35
Page 7
VII
Chapter Five
Results and Discussion
5.1 Yield of Pyrolysis Process ..................................................................................................... 40
5.2 Bed characteristics ................................................................................................................ 40
5.3 Porosity and pressure drop calculation .............................................................................. 41
5.4 Adsorption tests ..................................................................................................................... 41
5.4.1 Effect of Biomass Precursor Type .................................................................................. 41
5.4.2 Effect of Activation Reagent ........................................................................................... 44
5.4.3 Effect of Bed Height ....................................................................................................... 46
Concluding Remarks .................................................................................................................. 48
Recommendations ....................................................................................................................... 49
References .................................................................................................................................... 50
Page 8
VIII
List of Figures
Figure 1.1 Pores inside activated carbon. .................................................................................. 4
Figure 2.1 Heat conversion processes of biomass and their products. .................................... 11
Figure 3.1 Common Types of Adsorption Isotherms .............................................................. 23
Figure 3.2 Concentration profile for adsorption process in a fixed bed .................................. 25
Figure 3.3 Breakthrough curve, concentration profile for adsorption process........................ 26
Figure 4.1 Schematic Diagram for H2S Adsorption Test. ....................................................... 33
Figure 4.2 AC packed bed input and output............................................................................ 37
Figure 4.3 : Breakthrough curve. ............................................................................................ 37
Figure 5.1 (a) Breakthrough curves, (b) Removal efficiency of H2S , effect of biomass ...... 42
Figure 5.2 (a) Breakthrough curves, (b) Removal efficiency of H2S, activation reagent. ...... 45
Figure 5.3: Adsorption breakthrough curves of H2S, height effect ....................................... 46
Figure 5.4: AC bed height versus the adsorption amount of H2S ........................................... 47
Page 9
IX
List of Tables
Table 1.1: Composition of biogas from different sources . ....................................................... 2
Table 1.2: The total estimated cost for implementing this project ............................................ 7
Table 2.1: Operating conditions for different types of pyrolysis . .......................................... 12
Table 2.2: Proximate and ultimate analysis of the most biomass used in char production . ... 14
Table2.3: Effect of pyrolysis temperature . ............................................................................. 16
Table 2.4: Literature review on activated carbon production. ................................................ 20
Table 3.1: Literature review on adsorption of hydrogen sulfide. ............................................ 27
Table 5.1: Biomasses yield from pyrolysis process ............................................................... 40
Table 5.2: Characteristics of AC bed and biogas. ................................................................... 40
Table 5.3: Void faction and pressure drop for eucalyptus, almond shells and coffee grains. . 41
Table 5.4: Adsorption capacities for almond shells, eucalyptus and coffee grains. ............... 43
Page 10
X
ABSTRACT
This project aims at the removal of H2S from biogas by adsorption using synthesized
activated carbon. The effect of type of precursors, activation reagent and packed bed height
were studied. Adsorption test was performed using a fixed bed filter filled with the produced
activated carbon where the inlet biogas has H2S concentration of 930-970 ppm. The AC was
synthesized according to a previous study H.Sawalha, A.Bader, J.Sarsour, "Preparation of
Activated Carbon through Pyrolysis of Agricultural Waste for Wastewater Treatment
Applications". Three types of biomasses: almond shells, eucalyptus and coffee grains were
collected, grinded, sieved, pyrolysed at 500°C and activated with chemical reagents KOH or
ZnCl2. Two centimeter of each precursors activated with KOH were used in precursor’s effect
study. H2S outlet concentration decreased to less than10 ppm for all samples. The best
performance was for eucalyptus followed by almond shells and coffee grains. The outlet H2S
concentration reached the inlet concentration in 182, 130, 9 minutes respectively. As for
activation chemical, KOH has higher efficiency than ZnCl2 in which 2 cm of eucalyptus
activated with KOH consumed 182 minutes while with ZnCl2 consumed 70 minutes only. In
bed height effect study, 2, 4, 6 and 8 cm of coffee grains were used. Removal efficiency
increased with amount of AC in which the outlet H2S concentration reaches the inlet
concentration within 12, 42, 90 and 170 minutes respectively.
The main conclusion of the present study is that synthesized activated carbon could be
successfully applied for removal of H2S from the biogas.
Key words: Adsorption, H2S removal, activated carbon, pyrolysis, activation,
fixed bed.
Page 11
XI
الملخص
و الذي الفحم المنشط من الغاز الحيوي وذلك باستخدام H2S دروجينييدف ىذا المشروع لفصل غاز كبريتيد الييوتم خلال البحث دراسة تأثير ثلاث عوامل .لمنفايات النباتية الانحلال الحراري والتنشيط الكيميائي عممية تم إنتاجو خلال
عن الغاز الحٍوي وهً نوع النفاٌات العضوٌة المستخذمة و نوع المادة الكٍمٍائٍة المستخذمة H2Sعمى عممية فصل غاز
979-939تمت عممية الادمصاص باستخدام غاز حيوي يحتوي فً التنشٍط إضافة إلى كمٍة الفحم النشط المستخذم.ة لمباحثين د. صوالحة, م. بدر, م. . وتم تصنيع الفحم المنشط بناء عمى دراسة سابق H2Sجزيء في المميون من غاز
ثم ومن .تنخيميا طحنيا و القيوة و الكينيا و أنواع من ىذه النفايات وىي قشور الموز, ثلاثحيث تم تجميع صرصور. التنشيط الكيميائي باستخدام ىيدروكسيد البوتاسيوم وبعد ذلك م° 599الانحلال الحراري عمى درجة حرارة تمت عممية
(KOH) كموريد الزنك وأ (ZnCl2) . تم اختبار عممية ادمصاص كبريتيد الييدروجين و كمواد كيميائية لعممية التنشيط عند أجزاء في المميون 09إلى أقل من H2Sغاز بالفحم المنشط. بعد دراسة تأثير نوع النفايات العضوية انخفض تركيز
القيوة, بعد ذلك الموز و ثم كينيا لم وقد كانت أعمى كفاءة. KOHالمنشطة باستخدام لعينات الثلاثسم من ا 2استخدام لموز 039دقيقة لمكينيا, 082الخارج من الفمتر حتى يصل إلى التركيز الداخل كان H2Sبحيث أن الوقت اللازم لتركيز
فعالية ىيدروكسيد البوتاسيوم أعمى من أنلوحظ فقدـما بالنسبة لممادة الكيميائية المستخدمة في التنشيط أدقائق لمقيوة. 9و دقيقة كي يتساوى 089احتاجت ما يقارب KOH مباستخداسم من الكينيا المنشطة 2 أنفعالية ممح كموريد الزنك, حيث
أما عند دراسة كمية الفحم المستخدم تم دقيقة. 79احتاجت ZnCl2 اخل بالتركيز الخارج, بينما باستخدام التركيز الدولوحظ أن الكفاءة تزداد بازدياد كمية الفحم النشط KOHسم من القيوة المنشطة باستخدام 8و 6, 4, 2استخدام
99سم, 4دقيقة ل 42سم, 2دقيقة ل 02المستخدم. حيث أن الوقت المستغرق ليتساوى التركيز الداخل بالخارج كان سم. 8دقيقة ل 079, و سم 6دقيقة ل
البحث ىي أن الفحم المنشط المصنوع من النفايات النباتية يمكن أن يستخدم بشكل ىذا الخلاصة الرئيسية من
غاز كبريتيد الييدروجين.الغاز الحيوي من لتنقيةفعال
Page 12
Chapter One
Research concept
Page 13
2
1.1 Introduction
Biomass waste is being produced in large amounts and it can be utilized to produce
biogas through anaerobic digestion. The produced biogas can be used to generate energy by
releasing heat from combustion reaction. Various types of gasses are produced during
fermentation in addition to methane CH4 including carbon dioxide CO2, hydrogen sulfide
H2S, and moisture H2O. These pollutants adversely affect electricity generation process.
Sources used to produce biogas including household waste, wastewater treatment plant
sludge, agricultural waste, landfill, and the waste of agrifood industry. The compositions of
biogas differ according to the source of production, which depend on the substrate, organic
matter load and the feeding rate to the digester. Table 1.1 shows the variation in biogas
composition depending on the type of waste.
Table 1.1 Composition of biogas from different sources [1].
Component Household waste wastewater treatment
plant sludge
agricultural
waste
CH4 vol% 50 - 60 60 – 75 60 – 75
CO2vol% 34 - 38 19 – 33 19 – 33
N2 vol% 0 - 5 0 -1 0 -1
O2vol% 0 -1 < 0.5 < 0.5
H2O vol% 6 6 6
H2S mg /m3 100 - 900 1000 – 4000 3000-10000
The range of H2S concentration in biogas was reported by several researchers between
0-5 % v/v. This ratio depends on the type of waste used in biogas generation which differ in
water content, pH and sulfur content. However, the presence of hydrogen sulfide in biogas is
not desirable due to many reasons; its toxicity, bad odor and because it's lethal for human in a
Page 14
3
concentration larger than 1000 ppm within a few seconds [2]. Dissolved hydrogen sulfide
with concentration upwards 50 mg/L causes fermentation inhibition because it is toxic to the
bacteria in the slurry [2]. H2S is also corrosive for metallic parts used in biogas plant facilities.
Furthermore, H2S oxidized during combustion to form acidic sulfur dioxide (SO2) which is a
very high corrosive gas. Based on these reasons, it was necessary to search for technology to
purify biogas from H2S; several methods are used for desulfurization of biogas as follows:
1. Biological desulfurization by addition of air
Hydrogen sulfide can be oxidized into elemental sulfur by microorganisms that grow
on the surfaces when adding 8 to 12% by volume fresh air. Sulfur accumulates on the surfaces
and ultimately passes back into the substrate, where it is partly converted into H2S again. The
efficiency of this process is limited and methane content of biogas is significantly reduced [2].
2. Chemical absorption
A substance such as a liquid or gas is involved the formation of reversible chemical
bonds between solute and solvent. The most chemicals used are solutions of alkaline salts.
Expensive investment requires heat for regeneration, corrosion, decomposition, and poisoning
of amines by O2 or other chemicals and precipitation of salts are common disadvantages for
chemical absorption [3].
3. Water scrubbing
In this method absorption process operated when water is fed on the top of backed bed
and biogas is fed from the bottom. This method can be used for selective removal of H2S
since H2S is more soluble than CO2 in water. This method is undesirable since it requires a
large amount of water, causes corrosion to the equipment by H2S and has a limitation on H2S
removal due to excess of CO2[4].
Page 15
4
4. Membranes
A membrane is a layer of material with fine pores, which is selective between
tow substances when it's exposed to driving force. High-pressure separation process and
selectivity separate H2S and CO2 from CH4. The permeability of gasses through membrane
depends on their solubility in the membrane material. Membranes have low selectivity and
expensive. Comparing between purity of CH4 and the amount of upgraded biogas, multiple
steps required to reach high purity so CH4 is lost [4].
5. Adsorption
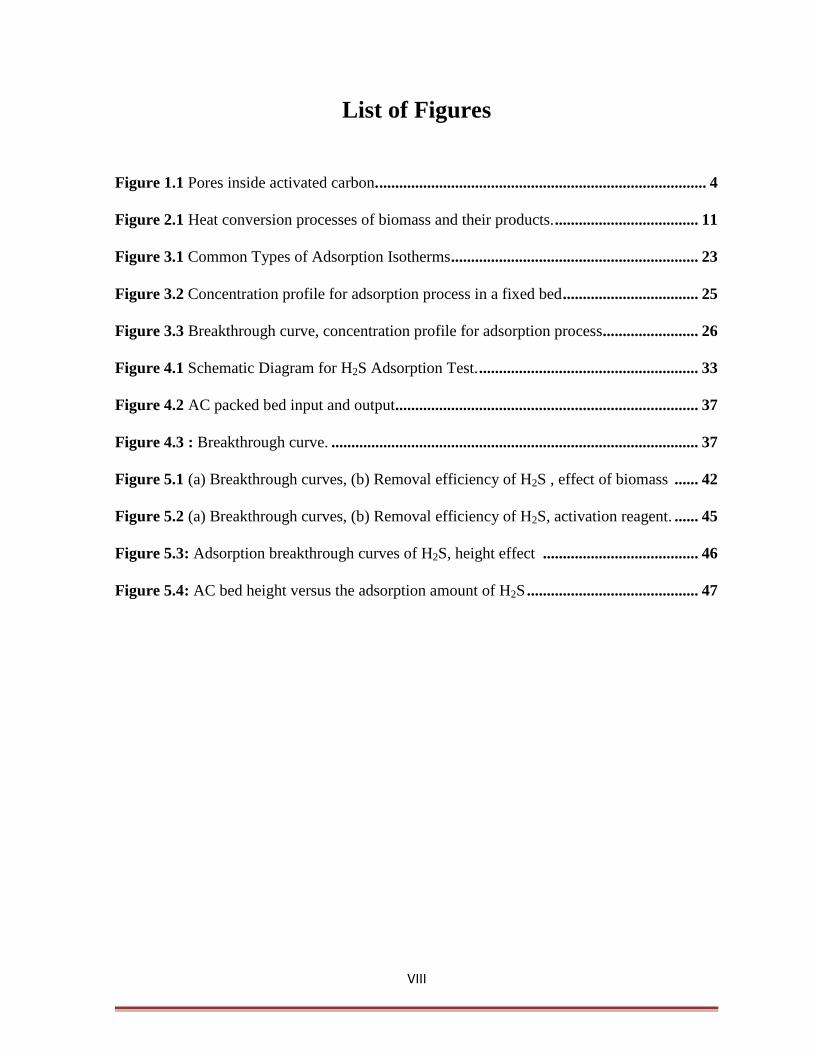
A process in which molecules (gas or liquid) adhere to a surface of a solid by
attraction forces in physical adsorption or by chemical reactions in chemical adsorption. The
most used adsorbents for gasses are silica gel, zeolites, synthetic resins, and activated carbon,
as shown in Figure 1.1.
Activated carbon (AC) is widely available, relatively inexpensive, and highly efficient
due to the high surface area, adsorption capacity, and surface reactivity. AC is used in many
applications such as petroleum refining, wastewater treatment, air pollution treatment and
volatile organic compounds (VOC) adsorption [6], and gold purification [7].AC can be
obtained through pyrolysis of different substances including rubber, tires, coal, petroleum
pitch, and biomass.
Figure 1.1 Pores inside activated carbon[5].
Page 16
5
Several types of biomasses were utilized in the literature for the production of AC such as
nutshells, coconut husk, peat and wood. Lignocellulosic biomass can be categorized into three
different components, mainly cellulose, hemicellulose, and lignin, which is responsible for the
adsorption process in AC [6]. AC is usually classified by its size and shape into powdered,
granulated, spherical, or pelleted activated carbons. It can be activated by physical or
chemical activation. AC was mostly applied for wastewater treatment. However, only few
studies reported in applications of AC in gas purification.
1.2 Problem Statement
This research study deals with the following main and sub main problems:
Research main problem:
What is the technical feasibility of using synthesized AC from biomass in a packed
bed to be applied for H2S removal from biogas?
Sub problems:
1. What is the effect of the type of biomass on H2S removal efficiency and time needed for AC
to be saturated?
2. How does the chemical activation reagent e.g KOH and ZnCl2 affect H2S removal efficiency
and time needed for AC to be saturated?
3. What is the effect of bed height on H2S removal efficiency and time needed for AC to be
saturated?
1.3 Goals and Objectives
The objective of this study is to prepare AC from various types of biomass waste for
application in biogas purification i.e. H2S removal.
The main objectives are:
Page 17
6
To prepare AC using various low-cost biomass wastes including almond shells, eucalyptus barks
and coffee grains.
To purify biogas from H2S using adsorbents prepared through pyrolysis of biomass wastes.
To study the effects of bed height on adsorption conditions in the adsorption process.
To study the effects of activation chemical in the activation process.
1.4 Significance of Study
This project tends to remove H2S from biogas for environmental and safety measures as
it is a toxic and has bad odor. As well as to provide high efficiency production of electricity,
protect equipment in the facility from corrosion by H2S and provide a cheap technology for
biogas purification by treating waste by waste.
1.5 Methodology
The AC from biomass wastes produced through pyrolysis and then activated through
chemical activation. Biogas purification implemented by continuous adsorption using a bed of
synthesized AC.
Page 18
7
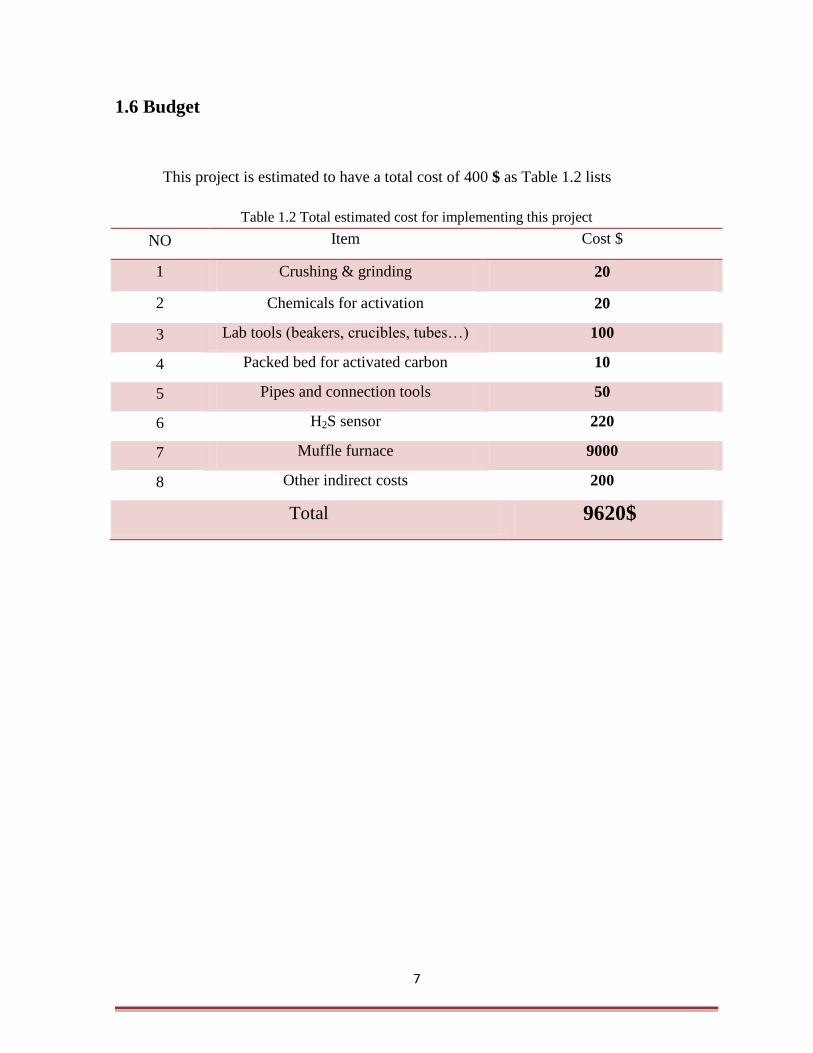
1.6 Budget
This project is estimated to have a total cost of 400 $ as Table 1.2 lists
Table 1.2 Total estimated cost for implementing this project
NO Item Cost $
1 Crushing & grinding 20
2 Chemicals for activation 20
3 Lab tools (beakers, crucibles, tubes…) 100
4 Packed bed for activated carbon 10
5 Pipes and connection tools 50
6 H2S sensor 220
7 Muffle furnace 9000
8 Other indirect costs 200
Total 9620$
Page 19
8
1.7 Action Plan
The First Semester
TASKS 1st
Month 2nd
Month 3rd
Month
4th
Month
W1 W2 W3 W4 W1 W2 W3 W4 W1 W2 W3 W4 W1 W2 W3 W4
Identification of
Project Idea
Literature
Review
Collecting
Biomass
Activation of
biomass
Carbonization of
Biomass
Adsorption Tests
Documentation
Presentation
Page 20
9
The Second Semester
TASKS 1
st Month 2
nd Month 3
rd Month
4
th Month
W1 W2 W3 W4 W1 W2 W3 W4 W1 W2 W3 W4 W1 W2 W3 W4
Preparation of
Samples
Carbonization of
Biomass
Activation of
Carbon
Adsorption Test
Documentation
Final
Presentation
Page 21
Chapter Two
Literature Review Activated Carbon Production
Page 22
01
2.1 Introduction
A lot of agricultural and industrial activities produce large amounts of biomass
residues and wastes which cause an environmental problem. These wastes can be converted to
a valuable products i.e. activated carbon. Production of AC from wastes not only solves
environmental problem but also achieves economic gains. AC production is based on
carbonizing and activating either physically or chemically.
2.2 Carbonization
Biomass can be used to generate energy through heat conversion in three main
processes, pyrolysis, gasification, and combustion. Pyrolysis is a thermal decomposition of
biomass in a medium does not contain oxygen that produces different energy forms such as
char, bio-oil and fuel gas [8]. Gasification is the production of a gaseous fuel from biomass
through heating in a gaseous medium such as air, nitrogen, carbon dioxide, oxygen, or steam.
The produced gas that consists of CO, CO2, H2, and N2 can be used as a chemical feedstock to
produce liquid fuels. On the other hand, it can be used in power gas engines and gas turbines
to generate electricity or in boilers for heat generation [9]. As for combustion, it is the direct
burning of biomass in the presence of oxygen which converts the chemical energy stored in
biomass to heat within a temperature range of 800– 1000 °C [8]. Combustion ensures the
complete oxidation of the biomass while gasification is a partial oxidation in temperature
ranges between 700-900 °C. Figure 2.1 summarize the heat conversion processes of biomass
and their products.
Page 23
00
Figure 2.1Heat conversion processes of biomass and their products [10].
This study is interested in the production of AC from biomass, which is called biochar,
so the study focuses on pyrolysis.
2.1.1 Pyrolysis
It is thermo-chemical decomposition in the absence of oxygen. Pyrolysis can be
applied in organic waste, which has a high content of hemicelluloses, cellulose, and lignin;
these components can be decomposed by the effect of high temperature. The absence Oxygen
allows the temperature to increase above the biomass thermal stability temperature, which
produces more stable products without burning.
Different chemical reactions take place during pyrolysis; these reactions can be
divided into two stages: primary and secondary. In the primary stage when biomass heated to
a temperature around 200 °c the carbohydrate polymers partially depolymerize to short chains
of sugar units. This process accompanied with a slow dehydration to give species with low
content of water. When the temperature reaches 300°C, a series of interactions occur
involving devolatilization, removal of volatile material, and dehydrogenation, removal of
hydrogen from organic molecules. The result of this step is the formation of different carbonyl
groups, carbon atom double-bonded to an oxygen atom: C=O, hydroxyl groups, entity with
the formula OH, and carboxyl groups, carbonyl, and hydroxyl group both linked to a carbon
Page 24
02
atom. In the secondary stage at higher temperatures, the heavy compounds start cracking and
C-C bond breaking down to give char or gasses, and sometimes the resulted gasses condense
to give bio-oil.[8,11,12] Equation 2.1shows the formula of different yields from pyrolysis [8].
(C6H6O6)n (H2+ CO+ CH4+∙∙∙C5H12) + (H2O+CH3OH+CH3COOH+∙∙∙) + C ( 2.1)
Gas yield liquid yield solid yield
2.1.2 Types of pyrolysis
The type of pyrolysis depends on temperature, residence time, and heating rate. It can
be categorized as shown in Table 2.1.
Table 2.1 Operating conditions for different types of pyrolysis [8].
Process Slow Fast Flash Intermediate
Temperature(°C) 550-950 850-1250 900-1200 550-650
Heating rate (°C/s) 0.1-1 10-200 >1000 1-10
Residence time(s) 300-550 0.5-10 <1 0.5-20
Main Products Bio-char Bio-oil Bio-oil Bio-char +
Bio-oil
2.1.3 Products from pyrolysis
The operating conditions during pyrolysis highly affect the final product. Fast and
flash pyrolysis mainly produces bio-oil at a temperature range 850-1250 °C and very short
residence time. Bio-oil produced in fast pyrolysis has a ratio of 60-75% but in flash pyrolysis,
the ratio increases. As for slow pyrolysis, it mainly produces biochar at a temperature
Page 25
03
between 550-950 °C for 1-4 hours. On the other hand, intermediate pyrolysis makes a
balance between liquid and solid production [8].
2.2 Biochar
Biochar, also called charcoal, is the solid product from pyrolysis, or it is the
carbonaceous residue after all volatile matter leaves the biomass as gasses and tar. It has an
internal surface area of 500 to 1500 m2/g [13]. The properties of produced char depend on the
feedstock type and operating conditions during pyrolysis. Generally, it is more favorable to
operate at low temperature and high residence time to produce biochar [8]. The produced char
from pyrolysis has intermediate pores, which improve its ability for filtration and adsorption
of pollutants.
2.3 Factors affecting Biochar production
2.3.1 Type of biomass:
Biochar can be manufactured from agricultural precursors with a high carbon and low
inorganic content. Agricultural waste is being used due to its abundance, low economic value,
low ash content, acceptable hardness, rigidity and its disposal is an environmental concern
[14]. The most common wastes used for the production of char are wood, coconut shell,
bituminous coal, peat, etc [13]. The final properties of the carbon will depend significantly on
the nature of the starting material [13]. Formation of Biochar is enhanced by cellulose and
lignin content. The studies show that the highest lignin content in the biomass waste increase
the biochar production in addition to increase the micropores surface area [6]. Lignin,
cellulose, and hemicelluloses decomposed in different ranges of temperature. Decomposition
of hemicelluloses occurs in a range between 220-315°C, while cellulose decomposes in a
Page 26
04
range between 315-400°C. Finally, lignin is decomposed at a temperature more than 400 °C
[15]. At low temperature, cellulose decomposes to a stable a hydrocellulose material, which
means a higher char production. However, it is converted to volatile products at high
temperature [8].In summary; lignin is the major contributor in char production. By comparing
between olive husk, corncob and tea waste, the olive husk produced the largest amount of
biochar since it has the most lignin content [8]. Biomass with low water content is most
suitable for pyrolysis, moisture content more than 30% require drying before pyrolysis in
order to prevent energy loss in moisture removal. A biomass of less than 5% moisture content
gives higher production of char [8]. It is important to know the constituent of different
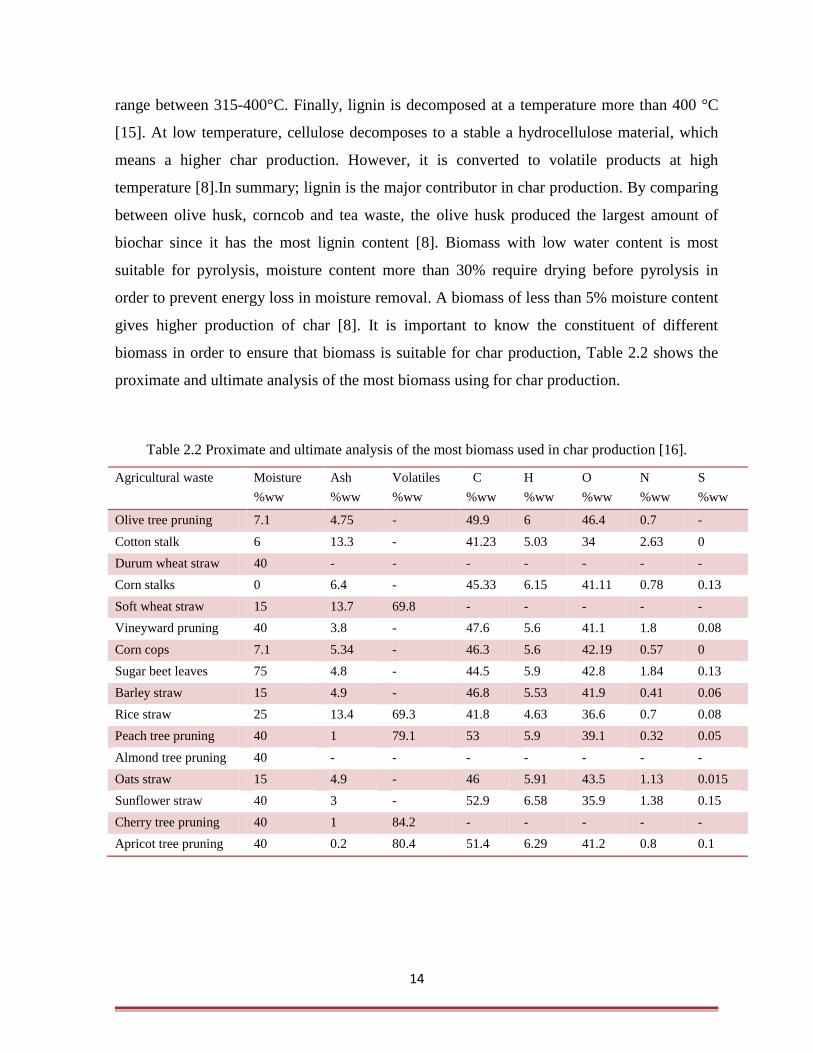
biomass in order to ensure that biomass is suitable for char production, Table 2.2 shows the
proximate and ultimate analysis of the most biomass using for char production.
Table 2.2 Proximate and ultimate analysis of the most biomass used in char production [16].
Agricultural waste Moisture
%ww
Ash
%ww
Volatiles
%ww
C
%ww
H
%ww
O
%ww
N
%ww
S
%ww
Olive tree pruning 7.1 4.75 - 49.9 6 46.4 0.7 -
Cotton stalk 6 13.3 - 41.23 5.03 34 2.63 0
Durum wheat straw 40 - - - - - - -
Corn stalks 0 6.4 - 45.33 6.15 41.11 0.78 0.13
Soft wheat straw 15 13.7 69.8 - - - - -
Vineyward pruning 40 3.8 - 47.6 5.6 41.1 1.8 0.08
Corn cops 7.1 5.34 - 46.3 5.6 42.19 0.57 0
Sugar beet leaves 75 4.8 - 44.5 5.9 42.8 1.84 0.13
Barley straw 15 4.9 - 46.8 5.53 41.9 0.41 0.06
Rice straw 25 13.4 69.3 41.8 4.63 36.6 0.7 0.08
Peach tree pruning 40 1 79.1 53 5.9 39.1 0.32 0.05
Almond tree pruning 40 - - - - - - -
Oats straw 15 4.9 - 46 5.91 43.5 1.13 0.015
Sunflower straw 40 3 - 52.9 6.58 35.9 1.38 0.15
Cherry tree pruning 40 1 84.2 - - - - -
Apricot tree pruning 40 0.2 80.4 51.4 6.29 41.2 0.8 0.1
Page 27
05
2.3.2 Heating rate:
The heating rate has a high influence on products characteristics of biomass pyrolysis. In
pyrolysis of rapeseed, when the heating rate increase from 5 to 50 K/min the mass losses
increase from 1.1 to 10 mg/min [17]. Also in pyrolysis of cherry sawdust the yield of biochar
increases from 29.98% to 39.98% when the heating rate decrease from 10 to 5 °C/min [18].
Fast heating rate leads to quick fragmentation of biomass and produces a high amount of
gasses [12], while the lower heating rate leads to produce more stable a hydrocellulose and
increase char production [18].
2.3.3 Temperature:
Pyrolysis temperature has the most important effect after pyrolysis heating rate, and then
pyrolysis residence time [16]. Increasing temperature usually increases the yield of liquids
and gasses and thus, low yield of char. On the other hand, higher temperature produces higher
char quality. That can be explained by primary decomposition of biomass occurring
significantly at higher temperatures or through secondary decomposition of char residue. The
secondary decomposition of the char at higher temperatures may also give some non-
condensable gaseous products, which also contributes to the increase in gas yield. As the
temperature of pyrolysis increased, the residence time of vapors of the primary degradation
inside the cracked particles must be reduced [16]. The amount of fixed carbon of biochar
produced from cherry sawdust increased from 59.59% to 61.29 % when the temperature
increased from 450 to 800°C, while the yield decreased from 30.4% to 24.72% at heating rate
10°C/min [18]. However, the effect of temperature depends on biomass nature and
composition, so it is difficult to find a suitable specific temperature for biochar production [8].
Table 2.3 shows the relation between pyrolysis temperature and biochar yield for different
biomass types.
Page 28
06
Table2.3 Effect of pyrolysis temperature [8].
Biomass Temperature range
°C
Biochar yield
%
Rice husk 400-600 33-25.5
Ferula Orientals 350-600 40.26-26.29
Corncob 400-700 34.2-20.2
Sewage slug 350-950 52-39
Olive husk 450-1250 44.5-19.4
Corncob 450-1250 30.6-5.7
Pine 300-450 58-26
2.3.4 Residence time:
The biomass should have a sufficient time to react in order to complete repolymerization of
biomass constituents. In addition, sufficient time develops the macro and micro pores of
Biochar [8]. Residence time and temperature do not affect the yield of biochar only, but also
affecting physical, chemical, spectral, and morphological properties of biochar. When
duration increases, yield, volatile matter and the original cell structure is reduced, but C, K
and P contents increase, which give a high quality charcoal [19]. Another study shows that the
biochar yield increases with the increase of residence time at high temperature, but at low
temperatures, increasing residence time will decrease the biochar yield [8].
2.4 Activation
Char is being activated to increase the porosity and to widen the existed micropores and
mesopores [20]. There are three types of activation:
Page 29
07
2.4.1 Physical Activation
Carbonized material is exposed to an oxidizing gasses such as air, carbon dioxide CO2,
steam or a mixture of them under a temperature of 800-1100°C[21]. CO2is usually used as an
activation gas since it's clean, easy to handle and slow reaction rate at 800°C [16]. However,
using steam is more efficient than CO2 since it produces a higher surface area and faster
conversion since the small size of water molecules cause diffusion through porous structure
more effectively [6]. However, physically AC doesn’t have satisfactory characteristics as an
adsorbent or filter [16].
2.4.2 Chemical Activation
The carbonized material is impregnated with an oxidizing agent for dehydration by
mixing or kneading with a concentrated solution of acid or base. The commonly activated
chemicals are ZnCl2, H3PO4, NaOH, KOH, and K2CO3 [16, 21]. These dehydrating agents
prevent tar and other unwanted material to form in carbonization, which produce a higher
percentage of carbon content. To acquire the final porous structure, chemical activation must
be followed by thermal treatment of inert atmosphere. Chemical activation is performed at a
lower temperature and part of the activation chemicals can be recovered, zinc salts and
phosphoric acid for instance [16].
Comparing between chemical and physical activation, the priority for chemical activation
due to lower activation temperatures, shorter treatment time, larger surface area and micro
porosity, and a higher yield of AC production [6].
2.4.3 Physiochemical activation
A combination of the first two activation processes [6]. It's used to prepare granular
AC of a very high surface area and porosity for specific applications, gasoline vapor control
for example.
Page 30
08
2.5 Activated carbon
AC is classified into four main groups according to its structure including granular
activated carbon (GAC), powdered activated carbon (PAC), activated carbon fibers (ACF),
and activated carbon cloths (ACC). GAC is usually prepared from hard materials of high
rigidity and large particles retained on mesh #80, used as filler in columns, can be regenerated
after use. When raw material particles are small, PAC is produced. For having small volumes,
highly efficient adsorption occurs, even though settling and removal are slower in PAC than
GAC. It's disposed of after using. ACF is manufactured from homogeneous polymeric raw
materials, has a mono dispersed pore size distribution. The thin fiber shape develops intra-
particle adsorption. Therefore, the contact efficiency between the media and the adsorbent is
enhanced. "ACC were initially developed using as precursors phenolic or viscose rayon and
are considered to be excellent adsorbents due to their low-pressure drop during the process,
high contact efficiency and flexibility"[14].
AC has a number of unique characteristics such as large internal surface area, chemical
properties, and good accessibility of internal pores for adsorption. According to IUPAC
definitions, three groups of pores can be identified.
1- Macrospores (above 50 nm diameter)
2- Mesopores (2-50 nm diameter)
3- Micropores (Under 2 nm diameter) [13].
The pores properties include the total pore volume, diameter, and size distribution. They
are a function of the rate of heating, final temperature, time it's exposed to the final
temperature, the type of activating agent, biomass properties and its history of carbonization
[21].
Page 31
09
Materials with a high content of lignin produce AC of macropores structure, while
precursors of higher content of cellulose develop AC with micropores structure [16].
However, the surface area of the AC was less important in adsorption than the pore size
distribution [20] and that AC with micropores and mesopores has higher removal efficiency
than AC of macropores due to a higher diffusion rate of H2S and the development of the
deposition of sulfur product in mesopores.
2.6 Literature review on activated carbon production
Many researchers produced AC from agricultural residues after carbonization and
activation for different applications, Table 2.4 shows different biomass wastes used for this
purpose and summarizes the operating conditions during pyrolysis, activation methods used,
characteristics of produced AC and the application that AC has been used for.
Page 32
21
Table 2.4 Literature review on activated carbon production.
Ref Application
(adsorbate material)
Pore
size
Pore
vol
cm3/g
SBET
m2/g
Activation Pyrolysis
Particle
size
Raw Material
Heating
Rate
°C/min
Resid-
ence
Time
Temp
°C
Type
22 H2S
- - 400 Physical (steam) +
Chemical (ZnCl2)
21 1-3 h 600 -800
Slow 0.147–
0.295
mm
Bituminous Coal
23 - - Oat
92.4%
corn 88.7%
Oat(349
-625)
Corn
(311-442)
Physical (steam) - 1.5 s 500 Fast - Oat hulls
& Corn Stover
24 Methylene- blue
phenol
- - 535 Chemical (K2CO3)
10 3 h
500 Slow 25 mm Eucalyptus
25 Iodine 12
µm
- - Chemical (KOH) - 1 h 600 Slow 1-3 mm Walnut shell,
Olive Stone
26 SO2 - 0.11 176 Physical (CO2) 10 2 h 600 Slow 2-2.8mm Oil-Palm
Stone
27 Lead - 0.701 1094.1 Chemical
(H3PO4)
8 1 h 500 Slow - Pine Cones
28 Acid dye - 0.288 970 Chemical (ZnCl2)
10 0.5 h 500 Slow - Corncob
29 malachite
green
- - - Chemical (ZnCl2) - 0.5 h 400 Slow - Groundnut
Shell
30 - - - 1005-
1315
Physical (CO2) 4 1 h 400 Slow 1.5–2.0
mm
Almond Shell
31 - - 0.7
0.5
1700
1100
Chemical (ZnCl2)
(KOH)
- 1,2,3 h 700 Slow 212-300
500-600 ϻm
Macadamia
Nutshell
32 Methylene-
blue
phenol
- - 1522
1374 Chemical (ZnCl2)
(FeCl3)
- 3 h 550
250
Slow - Coffee Husk
20 H2S
- 0.2198 317.6
Activated - - - - 400 – 800
Slow - Anaerobic Digestion
By-Product
33 - - 0.41-
0.64
642-985 Physical (CO2 )
- - 500 Fast Less
than 1mm
Oak
0,68-
0,89
902-1010
Corn Hulls
0.33-
0.54
432-712
Corn Stover
Page 33
Chapter Three
Literature Review Adsorption of Hydrogen Sulfide
Page 34
22
3.1 Introduction
Adsorption process is used worldwide mainly with activated carbon in different gas
and liquid treatment applications. One of these applications is H2S removal from biogas.
Biogas purification is a necessary process in biogas plant for higher electrical generation
efficiency. This chapter studies the adsorption process and the relation between adsorbent and
adsorbate.
3.2 Adsorption
Adsorption is a process in which particles (adsorbate) are separated from a fluid
stream to a porous solid (adsorbent) surface exposed to the fluid. The adsorbate is then
concentrated on the porous solid surface. The fluid can be passed through a fixed bed full of
small solid particles of a highly surface area to obtain high adsorption efficiency. The fixed
bed will reach saturation after a period of time, then, there will be no adsorption and the
efficiency will decrease to 0% where desorption process occurs. The adsorbate can be
recovered and the adsorbent then is ready for another cycle of adsorption. Adsorption can be
applied for the separation of a liquid/gas mixtures or removal of air and water pollutants. In
gas, especially, adsorption is applied for dehumidifying gas, eliminating the odor or pollutants
from gas stream, or recover valuable solvent vapors from the steam. Removal of sulfur
compounds from natural gas or biogas is one of the applications of gas phase adsorption.
Many adsorbents used in other applications of separation, sharing main properties in common
including its porous structure of fine pores, pores volume of 50% of total particle volume and
a shape of small pellets, beads, or granules of 0.1-12 mm in size. The adsorption inside the
solid pores usually forms a monolayer. However, multi-layers sometimes occur.
Page 35
23
3.3 Equilibrium Relations for Adsorbents
The equilibrium between the adsorbate concentration in the fluid phase (c, Kg
adsorbate/m3) and its concentration on the solid surface (q, Kg adsorbate/Kg adsorbent) can
be represented by the adsorption isotherm. Figure 3.1 presents some common types of
adsorption isotherm including Linear, Freundlich, and Langmuir.
Figure 3.1 Common Types of Adsorption Isotherms
3.2.1 Linear isotherm
Linear isotherm occurs when the equilibrium concentrations follow a linear
relationship as equation 3.1 shows. Linear isotherm is used in the dilute region to approximate
data.
(3.1)
Where K is a constant determined experimentally (m3/kg adsorbent)
Page 36
24
3.2.2 Freundlich isotherm
Particularly useful for liquids to approximate data for physical adsorption by the
empirical equation 3.2
(3.2)
Where K and n are constants determined experimentally. When a log-log curve plotted
of q vs. c, the slope then is the exponent n. This equation is sometimes used to correlate data
for hydrocarbon gasses on activated carbon.
3.2.3 Langmuir isotherm
A theoretical basis given in equation 3.3 represent Langmuir isotherm,
(3.3)
Where K (Kg/m3) and qo (Kg adsorbate/Kg solid) are empirical constants. The
Langmuir isotherm assumes that only a monolayer is formed, the adsorption is reversible and
reaches the equilibrium condition. It also assumes that there are a certain number of active
sites for adsorption. The slope is obtained by plotting 1/q vs. 1/c, and is equivalent to K/qo,
whereas the intercept in this system is equivalent to 1/qo.
3.4 Breakthrough Curve
Adsorption can occur in batch or continuous process, batch adsorption mostly used for
liquids when quantities treated are small in amount. Whereas continuous adsorption is a
Page 37
25
widely used method for adsorption of solutes from liquids or gasses by using a fixed bed of
particles. In this case, the concentration of adsorbate in the fluid phase and in the solid phase
changes with time and position in the bed. The difference in concentration is the driving force
for mass transfer between the fluid and solid phases.
At the beginning of adsorption process, the concentration in a fluid phase drop to zero
and adsorption occur in the layer of particles near to inlet. The concentration on solid phase
will increase continuously until the ratio of solute concentration between outlet and inlet
fluids ( c/co) reach 1 after time interval, which means this layer of particles become saturated
as t1 in Figure 3.2 shows, so mass transfer takes place in the next layer of solid particles and
so on. Until all of the particles become saturated and mass transfer stops, this process is
shown in Figure 3.2. The zone where the change in concentration occurs is called mass
transfer zone.
Figure 3.2 Concentration profile for adsorption process in a fixed bed at various positions.
The relation between the concentration of fluid leaving the bed and time can be
represented in a breakthrough curve. As the solution continues to flow at a given time when
almost half of the bed is saturated with solute, the outlet concentration is still approximately
Page 38
26
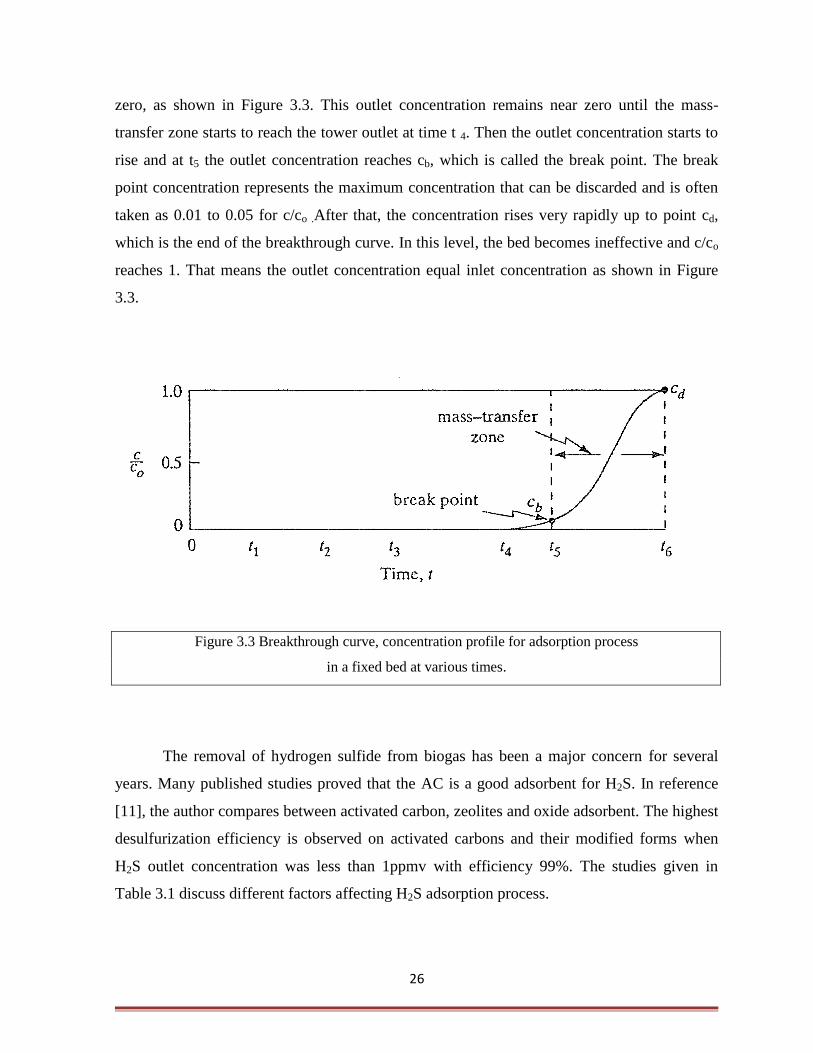
zero, as shown in Figure 3.3. This outlet concentration remains near zero until the mass-
transfer zone starts to reach the tower outlet at time t 4. Then the outlet concentration starts to
rise and at t5 the outlet concentration reaches cb, which is called the break point. The break
point concentration represents the maximum concentration that can be discarded and is often
taken as 0.01 to 0.05 for c/co .After that, the concentration rises very rapidly up to point cd,
which is the end of the breakthrough curve. In this level, the bed becomes ineffective and c/co
reaches 1. That means the outlet concentration equal inlet concentration as shown in Figure
3.3.
Figure 3.3 Breakthrough curve, concentration profile for adsorption process
in a fixed bed at various times.
The removal of hydrogen sulfide from biogas has been a major concern for several
years. Many published studies proved that the AC is a good adsorbent for H2S. In reference
[11], the author compares between activated carbon, zeolites and oxide adsorbent. The highest
desulfurization efficiency is observed on activated carbons and their modified forms when
H2S outlet concentration was less than 1ppmv with efficiency 99%. The studies given in
Table 3.1 discuss different factors affecting H2S adsorption process.
Page 39
27
Table 3.1 Literature review on adsorption of hydrogen sulfide.
Raw
Material
Particle
size
or shape
Activation condition Adsorption condition Ref
Material Temp
°C
Time Ratio Dbed Lbed Temp
°C
AC
mass
Flow
rate
Inlet conc.
Coconut
shell
Granular
1.8-3.6
mm
O3
HNO3
- - - 1.2
cm
5.5
cm
10
30
45
3 g 150
cm3/min
1.01 % with
N2
21
Coconut
shell
Granular NaOH
KOH
Na2CO3
KI
100 30
min
- 12
mm
70
cm
30
30-
550
1 g 100
ml/min
- 35
Bituminous
Coal
0.147–
0.295
mm
Steam ,
ZnCl2
0.5-
2.0
1.2
cm
5.5
cm
550 5.5 g 200
cm3/min
- 22
Commercial
AC from
rayon,
Coconut shell
Fiber,
granular
CO2
H2O
1200
900
- - - - - - Batch
reactor
- 36
Anaerobic
Digestion
Byproduct
- Steam 850 - - - - - - - - 20
Commercial - Without
activatio
n
- - - 9
mm
370
mm
- - 0.5
L/min
3000 ppm 37
Coconut
Shell
4×8US
standard
mesh
size
KOH
NaOH
K2CO3
Room
temp
1 h 0.25 ,
0.5 ,1
1.5 , 2
- - 30-70 - - 1000-5000
ppm
38
Commercial Powder N2,O2 900 6 h - 38
cm
1
cm
23 1g 150
ml/min
200 ppm 39
Page 40
28
Different raw materials of AC used in H2S removal after physical or chemical
activation or without any activation. One of the most biomass waste used for this purpose is
coconut shell due to its high cellulose and lignin content, which produce a highly efficient
AC.
Activation of carbon affects highly the adsorption process. In reference [38], the
author compares between impregnated and unimpregnated carbons. The adsorption capacity
of unimpregnated AC was 1.5 mg/g. Physical adsorption occurs in this case, where molecules
are weakly bonded by van der Walls forces. As a result, the highest capacity of
unimpregnated AC was 1.67 mg /g in reference [39].
Impregnation of AC rises the adsorption capacity 12.3 times in NaOH impregnated
AC and 13.5 times in K2CO3 AC. Adsorption, in this case, is chemical irreversible adsorption
depends on the reaction between H2S and the functional group on AC surface [38].
Different chemicals used to activate carbon but H2S is an acidic gas so the presence of
a basic group on AC surface will improve the adsorption capacity [38]. The surface
acidification of AC was studied and proved that H2S removal efficiency is reduced because
H2S cannot be dissociated with acidic conditions [40]. AS a result, basics are favorable as
activating material for H2S removal and the most basics used are KOH, NaOH, K2CO3 and
KI.
Adsorption of H2S is affected by local pH within pore system which affected by pore
size and acidic groups location. Physical adsorption can exist at low pH while chemical
Page 41
29
adsorption exists at high pH and H2S oxide to polymeric sulfur in this case [37]. pH less than
5 decreases the H2S capacity [40].
Break through capacity was 20 mg/g for K2CO3 AC and 10.9 for NaOH. When NaOH
to carbon mass impregnation ratio increases, the adsorption capacity decreases. That might be
due to pores blockage by NaOH. The same happens when KOH impregnated ratio increases
more than 1.5. However, in the case of K2CO3, the adsorption capacity increases to 35mg/g
when the ratio increases to two [39]. Coconut samples were activated with NaOH, KOH, and
K2CO3. The best adsorption capacity was for AC impregnated with K2CO3 [40].
Decreasing H2S concentration at the inlet increases the removal efficiency as low
concentrations slow down concentration kinetic and decreasing surface acidification [40]. The
adsorption capacity had dropped when the H2S influent concentrations increased from 1000 to
5000 ppm [38].
The flow rate is an important factor as it determines the contact time between gas and
AC. Adsorption capacity increases with decreasing flow rate due to longer contact time [38].
Different amounts of AC were used in reference [38] to study the effect of AC
amount. Increasing AC from 4 to 7 grams led to an increase in the total surface area and
adsorption capacity. Longer time is taken to reach break through concentration at c/co = 0.05.
Page 42
Chapter Four
Experimental Work
Page 43
30
4.1 Materials
Almond shells and eucalyptus were obtained from home garden, Hebron, Palestine.
Coffee grains wastes were also collected from home kitchen, Hebron, Palestine. Two
chemicals were used for activation; ZnCl2 and KOH (ALBEMARLE, Louisiana, Florida,
USA). Biogas was obtained from AL-Jebriny biogas plant in AL-Dhahreieh, Hebron,
Palestine.
4.2 Activated Carbon Production
Almond shells, eucalyptus and coffee grains were collected and washed well with tap
water to remove any impurities then, dried in a drying oven (Daihan LabTech Co., Ltd.,
Korea) at a temperature of 105°C for 24 hours. The samples were then smashed using
stainless steel mill and sieved using the auto sieve analysis shaker for 15 minutes. Meshes #
(10, 18, 40, 60 and 140) were used in sieving process. After that, the samples retained on
mesh #140 that has an opening size of 0.105 mm were chosen for subsequent studies in order
to obtain a uniform particles size.
Samples were then filled in porcelain crucibles for pyrolysis process. To make sure
that pyrolysis occurs in the absence of oxygen, the samples were pressed well to reduce the
voids that may present between particles and contain oxygen. Porcelain crucibles were closed
and covered by aluminum sheets. An isolated muffle furnace (labTech International Ltd. East
Sussex, UK) was used to pyrolyse the samples at a temperature of 500°C for one hour.
Samples then were activated with two different activation agents including KOH and
ZnCl2. Firstly, the activation reagent was added to the pyrolysed biomasses with a mass ratio
of 1:4 (weight of activating agent to weight of sample) then, distilled water was added to the
mixture with a volume equals 10 times of the pyrolysed sample weight. After that, solutions
Page 44
32
were stirred and heated at 80°C, using a hotplate stirrer (labTech International Ltd. East
Sussex, UK) until water was evaporated in a range time 1-2 hours. Next, the drying oven was
used to dry samples completely at 105 °C for 24 hours.
The three biomasses were weighed before and after pyrolysis to obtain yield as shown
in equation 4.1.
(4.1)
Page 45
33
4.3 Adsorption Tests
A fixed bed filter with a dimension 1cm internal diameter and 12 cm height was used
in adsorption tests (see Figure 4.1 for a schematic diagram of setup) of H2S removal. Two thin
layers of a porous cloth with a thickness less than 1 mm were placed at the inlet and outlet of
the filter in order to hold AC. The biogas from digester enters the upper bed inlet (1) then
passes through AC layer where adsorption occurs (2). Then it leaves the bed to the sensor
(ToxiRAE Pro, HONEYWELL, San Jose, California, United status) for measuring H2S outlet
concentration with time, the outlet concentration was measured every minute until outlet
concentration reaches its inlet concentration.
Figure 4.1 Schematic Diagram for H2S Adsorption Test.
Page 46
34
The flow rate of biogas was measured using fluid displacement method, in which an
empty balloon was placed at the end of the inlet pipe and left to be filled with biogas for a
certain time. The filled balloon was then immersed in water bath. The displaced volume of
water was measured and flow rate was calculated using equation 4.2:
(4.2)
4.3.1 Effect of biomass precursor type
The three types of precursors (Almond shells, eucalyptus and coffee grains) activated
with KOH were used to measure biomass effect on H2S removal efficiency. The bed height
was fixed at 2cm and the flow rate was 1.5 L/min. The outlet concentration of H2S was then
measured with time until it reaches the inlet concentration.
4.3.2 Effect of activation reagent
To study the effect of activation reagent on H2S removal efficiency, a bed height of 2
cm of eucalyptus activated with KOH or ZnCl2 was used and the flow rate was 1.5 L/min.
4.3.3 Effect of bed height
To study the effect of bed height, 2, 4, 6 and 8 cm of coffee grains activated with KOH
were used and the flow rate was 1.7 L/min.
Page 47
35
4.4 Data Analysis
The data obtained from experimental work was analyzed according to following
methods and equations.
The type of flow determined by calculating Reynold’s number for flow through a
packed bed with void ratio є according to equation 4.3 [41].
( ) (4.3)
The void ratio for each sample was calculated as shown in equation 4.4 [42].
(4.4)
Where VV is the volume of voids between particles and VT is the total volume of the
sample. Fluid saturation method was used to determine the voids volume [42], where a
specific amount of dry sample was weighted. Then, tap water was added to the sample until
saturation, wet sample was put in a filter paper to expose any excess water. Then, the
saturated sample was weighted. The difference between dry and saturated samples weights
represents the weight of water in pores. Volume of pores can be represented by water volume
in pores that equals weight of water divided by water density. After that fluid displacement
method was used to determine the total volume where the saturated sample was immersed in
water. The volume of displaced water was calculated which equal the total volume.
Page 48
36
Pressure drop for laminar flow through a bed of particles was calculated using
(Carman–Kozeny equation) as shown in equation 4.5 [41].
( )
(4.5)
Where,
ρ: Gas density (Kg/m3)
U: superficial fluid velocity through the bed (m/s)
D: Bed diameter (m)
µ: fluid dynamic viscosity (pa.s)
є: void fraction (dimensionless)
Δp: pressure drop (pa)
H: height of the bed (m)
x: particle diameter (m)
Removal percentage of H2S was calculated by equation (4.6) [34], where the
adsorption capacities were calculated by equation (4.9).
(4.6)
Where co and c are the inlet and outlet concentration of H2S (ppm) respectively.
As shown in the figure 4.2, the mass balance of H2S is
Total adsorption amount = total accumulation = input – output (4.7)
Page 49
37
Figure 4.2: AC packed bed input and output.
Rate of accumulation (R) = co*Q – c*Q
∫ ∫ (
)
∫ ∫ (
)
Total accumulation = ∫ (
) (4.8)
The integral ∫ (
) can be obtained from the shaded area of the breakthrough curve
as shows in figure 4.3.
Figure 4.3 : Breakthrough curve.
Page 50
38
The adsorption capacity of AC can be obtained from equation (4.9)
(4.9)
Where,
co: Inlet concentration of H2S (g/L)
co: Outlet concentration of H2S (g/L)
q: Adsorption capacity of AC (mg H2S/ g AC)
Q: Flow rate (m3/min)
t: Adsorption time (min)
m: Mass of AC used in adsorption (g)
Page 51
Chapter Five
Results and Discussion
Page 52
41
5.1 Yield of Pyrolysis Process
The yield of carbonization was calculated after pyrolysis was performed on the three
biomasses and the results are shown in Table 5.1.
Table 5.1: Biomasses yield from pyrolysis process
Biomass Yield (%)
Eucalyptus 35
Almond shells 28
Coffee grains 23
Formation of biochar is enhanced by cellulose and lignin content in biomass, the
eucalyptus has the highest yield as it has the highest lignin and cellulose content (28% w/w
and 59.8 % w/w respectively) [43]. While for almond shells lignin and cellulose content are
(20.4% w/w and 50 % w/w) [44] and (23% w/w and 12% w/w) for coffee grains waste [45].
5.2 Bed characteristics
Table 5.2 shows the characteristics of AC bed and biogas used in the adsorption tests.
Table 5.2: Characteristics of AC bed, biogas and operating conditions.
Variable Symbol Value Unit
Density (biogas) ρ 1.17 Kg/m3
Dynamic viscosity
(biogas)
µ 1.26*10-5
Pa.s
Flow rate Q 1.5 L/min
Particles average
diameter
x 177*10-6
m
Bed cross sectional area A 7.85*10-5
m2
Superficial velocity U 0.318 m/s
Page 53
40
5.3 Porosity and pressure drop
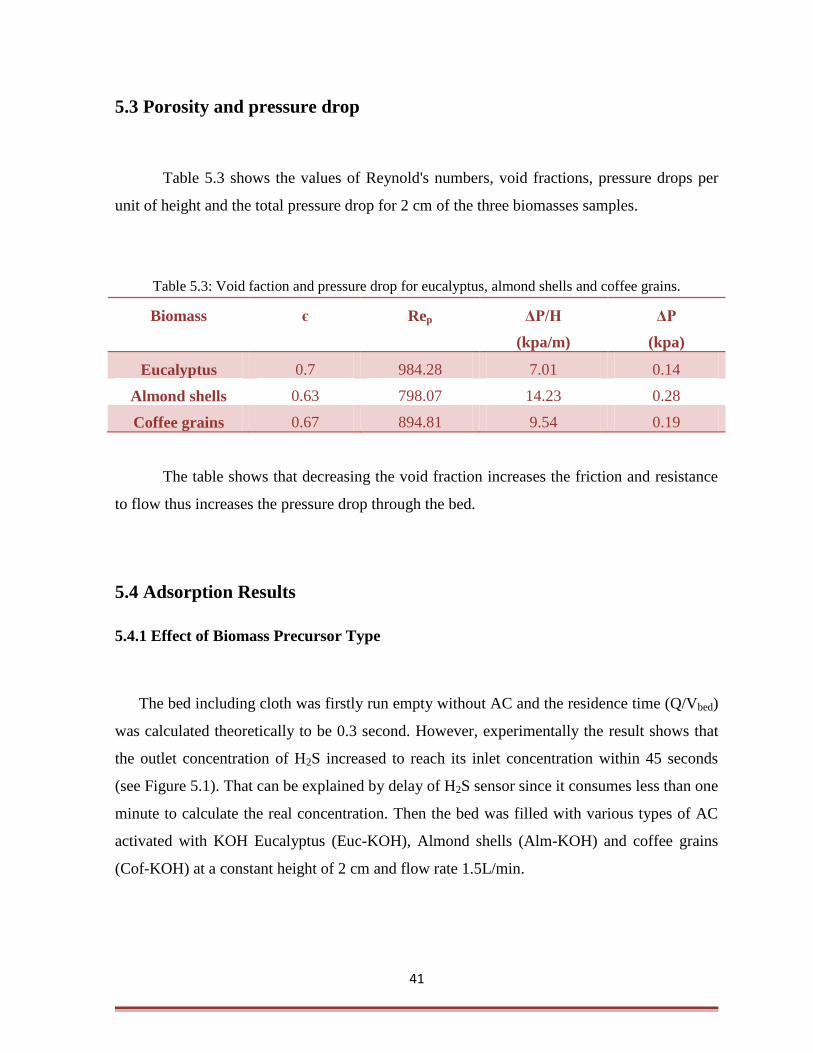
Table 5.3 shows the values of Reynold's numbers, void fractions, pressure drops per
unit of height and the total pressure drop for 2 cm of the three biomasses samples.
Table 5.3: Void faction and pressure drop for eucalyptus, almond shells and coffee grains.
Biomass є Rep ΔP/H
(kpa/m)
ΔP
(kpa)
Eucalyptus 0.7 984.28 7.01 0.14
Almond shells 0.63 798.07 14.23 0.28
Coffee grains 0.67 894.81 9.54 0.19
The table shows that decreasing the void fraction increases the friction and resistance
to flow thus increases the pressure drop through the bed.
5.4 Adsorption Results
5.4.1 Effect of Biomass Precursor Type
The bed including cloth was firstly run empty without AC and the residence time (Q/Vbed)
was calculated theoretically to be 0.3 second. However, experimentally the result shows that
the outlet concentration of H2S increased to reach its inlet concentration within 45 seconds
(see Figure 5.1). That can be explained by delay of H2S sensor since it consumes less than one
minute to calculate the real concentration. Then the bed was filled with various types of AC
activated with KOH Eucalyptus (Euc-KOH), Almond shells (Alm-KOH) and coffee grains
(Cof-KOH) at a constant height of 2 cm and flow rate 1.5L/min.
Page 54
42
A clear difference between the three types of AC in H2S adsorption can be observed as
shown in Figure 5.1 (a and b).
Figure 5.1 (a)
Figure 5.1 (b)
Figure 5.1: (a) Breakthrough curves, (b) Removal efficiency curves of H2S through packed bed of AC
made from eucalyptus, almond shells and coffee grains activated with KOH and empty filter. The
experiments were performed at ambient air temperature, gas flow rate of 1.5L/min, bed height of 2cm
and H2S inlet concentration 970ppm.
0
0.2
0.4
0.6
0.8
1
0 40 80 120 160 200
c/c o
of
H2S
Time (min)
Alm-KOH
Euc-KOH
Cof-KOH
emptyfilter
0
20
40
60
80
100
0 40 80 120 160 200
Rem
oval
effi
cien
cy (
%)
Time (min)
Alm-KOH
Euc-KOH
Cof-KOH
Page 55
43
At the beginning of the adsorption process, the concentration of outlet H2S
dramatically dropped to less than 10 ppm for the three samples; indicating high adsorption
(removal) efficiency. With time, the outlet H2S concentration increased at different rates
depending on the AC sample. For instance, with Cof-KOH, the H2S outlet concentration
rapidly increases to reach its inlet concentration (i.e. 0% removal efficiency) after 9 minutes,.
The Alm-KOH performed better than Cof-KOH as the outlet concentration remains around 0
(i.e. 100 % removal efficiency) for 7 minutes, then it gradually increases to reach its inlet
concentration after 130 minutes (see Figure 5.1) the same was with removal efficiency which
the highest removal efficiency was observed with Euc-KOH the outlet concentration remains
around 0 with a removal efficiency of about 100 for 45 minutes then start to decrease slowly
and reach 0 % after 182 minutes. The results indicated that the adsorption capacity of the ACs
to the H2S is different depending on the type of biomass precursor. Table 5.4 shows the
adsorption capacities of three samples. The higher adsorption capacity indicates a better
performance in adsorption process. Eucalyptus has the highest adsorption capacity which was
490 (mg H2S/g AC). That means one gram of Euc-KOH can adsorb 490 mg of H2S under the
applied operational conditions.
Table 5.4: Adsorption capacities for almond shells, eucalyptus and coffee grains.
Biomass Lignin content
(% w/w)
Cellulose content
(%w/w)
Adsorption capacity
(mg H2S/g AC)
Eucalyptus 28 59.8 490
Almond shells 20.4 50 230
Coffee grains 23 12 22
The results showed that, Euc-KOH has the best performance in H2S adsorption,
followed by Alm-KOH, Cof-KOH respectively. These results might be explained as follows.
The microstructure of AC is strongly affected by original plant texture especially the lignin
and cellulose content in which increasing the lignin content increases the macropores of AC
Page 56
44
whereas increasing the cellulose content increases the micropores where the adsorption
mainly takes place. As eucalyptus has the highest cellulose content (see Table 5.4) its
adsorption capacity was the highest.
5.4.2 Effect of Activation Reagent
The pyrolysed eucalyptus was activated with ZnCl2 and compared with KOH at the
same operating conditions. Figure 5.2 shows break through curves and removal efficiency of
H2S.
The outlet concentration remained zero with a removal efficiency of 100% for 30
minutes for both of Euc-ZnCl2 and Euc-KOH (see Figure 5.2). However, removal efficiency
reached 0 after 70 minutes with Euc- ZnCl2 instead of 182 minutes with Euc-KOH. As well
as, the adsorption capacity decreased from 490 to 160 mg H2S/g AC when KOH replaced
with ZnCl2.
The difference in efficiency can be explained by the higher chemical affinity of H2S
for KOH than ZnCl2. Since KOH is alkaline, it has a high reactivity to the diproton acidic gas
H2S. The reactions are expressed in equation 5.1 [46].
H2S + KOH→KHS + H2O (5.1)
Studies indicate that chemical adsorption is the major factor affecting the adsorption
process in alkaline AC [47]. AC activated with ZnCl2 resulted in greater mesoporosity while
microporosity is major in AC activated with KOH [48].
Page 57
45
Figure 5.2 (a)
Figure 5.2 (b)
Figure 5.2: (a) Breakthrough curves, (b) Removal efficiency of H2S curves through packed bed of AC
made of Euc-KOH and Euc-ZnCl2. The experiments were performed at ambient air temperature, gas
flow rate of 1.5L/min, bed height of 2cm and inlet H2S concentration 970ppm.
0
0.2
0.4
0.6
0.8
1
0 40 80 120 160 200
c/c o
of
H2S
Time (min)
Euc-KOH
Euc-ZNCL2
0
20
40
60
80
100
0 40 80 120 160 200
Rem
oval
effi
cien
cy (
%)
Time (min)
Euc-KOH
Euc-ZnCl2
Page 58
46
5.4.3 Effect of Bed Height
To study the effect of AC bed height, a new adsorption test was implemented on Cof-
KOH at a flow rate 1.7 L/min and inlet H2S concentration 930 ppm. 2, 4, 6 and 8 cm were
used. The breakthrough curves of four samples are shown in Figure 5.5.
Figure 5.3: Adsorption breakthrough curves of H2S through packed bed of AC made of Cof-KOH.
The experiments were performed at ambient air temperature, gas flow rate of 1.7L/min, pressure drop
of 9.36 kpa/m, H2S inlet concentration 930 ppm and heights of 2, 4, 6 and 8 cm
As shown in Figure 5.3, with 2 cm Cof-KOH the c/co ratio increased rapidly from 0 to
1 within 12 minutes but with increasing the bed height to 4 cm the ratio take 42 minutes to
reach 1. With increasing the height to 6 cm the ratio remained zero for 35 minutes and
increased gradually to reach 1 within 90 minutes. Finally, with 8 cm the ratio remained zero
for 80 minutes and increased gradually to reach 1 within 170 minutes. Increasing the amount
0
0.2
0.4
0.6
0.8
1
0 40 80 120 160 200
c/c o
of
H2S
Time (min)
2 cm
4 cm
6 cm
8 cm
Page 59
47
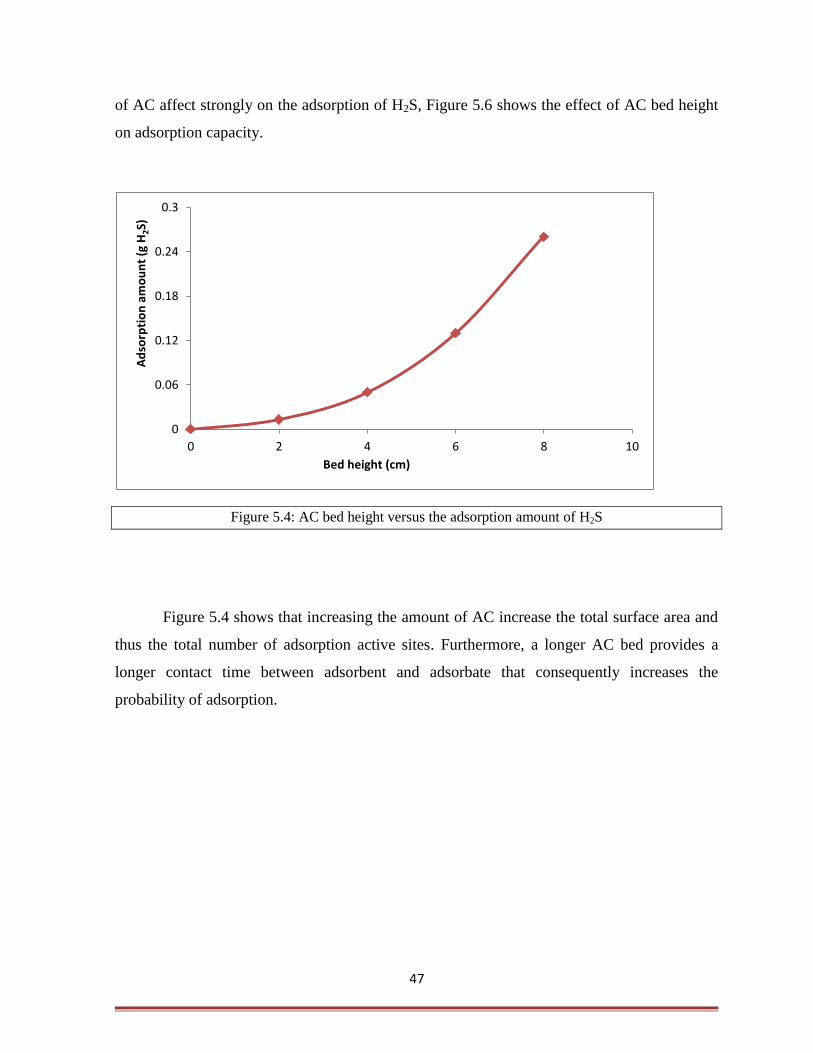
of AC affect strongly on the adsorption of H2S, Figure 5.6 shows the effect of AC bed height
on adsorption capacity.
Figure 5.4: AC bed height versus the adsorption amount of H2S
Figure 5.4 shows that increasing the amount of AC increase the total surface area and
thus the total number of adsorption active sites. Furthermore, a longer AC bed provides a
longer contact time between adsorbent and adsorbate that consequently increases the
probability of adsorption.
0
0.06
0.12
0.18
0.24
0.3
0 2 4 6 8 10
Ad
sorp
tio
n a
mo
un
t (g
H2S
)
Bed height (cm)
Page 60
48
Conclusion
In the current study, the technical feasibility of removing H2S from biogas through
packed bed of synthesized AC prepared from biomass waste was investigated. The findings
revealed that the AC could be successfully synthesized from biomass waste. In addition, the
technical feasibility of H2S adsorption on the synthesized AC has been confirmed. Yield of
carbonization was studied and showed that highest yield for eucalyptus then almond shells
and finally coffee grains, their results were 35%, 28%, 23% respectively. The relation
between removal efficiency of H2S and the type of biomass, activation agent and the amount
of AC used in the bed was studied. Time needed for outlet concentration of H2S to reach its
inlet concentration was 182, 120, 9 minutes for eucalyptus, almond shells and coffee grains
respectively. As for chemical reagents study, eucalyptus activated with ZnCl2 needed 70
minutes comparing to 182 minutes for KOH. Higher adsorption capacity achieved when
increasing the amount of AC. Removal efficiency reached 0 after 12, 42, 90 and 170 minutes
for 2, 4, 6, and 8 cm of Cof-KOH respectively.
Page 61
49
Recommendations
1. Eucalyptus and almond shells are recommended to be used as efficient low cost adsorbents
for gas adsorption applications.
2. We recommend AL-Jebriny Company to use local synthesized AC for biogas purification.
3. Chemical activation is preferred for activation as the required equipments are available and
it's a cheap method.
4. The study of chemical activation to carbonized biomass ratio can be studied in further
research.
5. Activated carbon can be studied as an adsorbent for other gases or liquids from other
industries.
Page 62
51
References
1. Kwaśny, Justyna, and Wojciech Balcerzak. "Sorbents used for biogas desulfurization in the
adsorption process." Polish Journal of Environmental Studies 25.1 (2016): 37-43.
2. KRONOS INTERNATIONAL, Inc., Technische Information5.01: "Hydrogen sulfide
elimination from biogas"2014.
3. Huertas, J. I., N. Giraldo, and S. Izquierdo. " Removal of H2S and CO2 from Biogas by
Amine Absorption". INTECH Open Access Publisher, 2011.
4. Bioenergy, I. E. A. "Biogas upgrading technologies–developments and
innovations." Margareta Persson and Arthur Wellinger (2009).
5. Shabanzadeh, Amir. "Production of activated carbon within the indirect gasification
process." (2012).
6. Nor, Norhusna Mohamad, et al. "Synthesis of activated carbon from lignocellulosic biomass
and its applications in air pollution control—a review." Journal of Environmental Chemical
Engineering 1.4 (2013): 658-666.
7. Soleimani, Mansooreh, and Tahereh Kaghazchi. "Activated hard shell of apricot stones: a
promising adsorbent in gold recovery." Chinese Journal of Chemical Engineering 16.1
(2008): 112-118.
8. Tripathi, Manoj, J. N. Sahu, and P. Ganesan. "Effect of process parameters on production of
biochar from biomass waste through pyrolysis: A review." Renewable and Sustainable
Energy Reviews 55 (2016): 467-481.
9. McKendry, Peter. "Energy production from biomass (part 3): gasification
technologies." Bioresource technology 83.1 (2002): 55-63.
10. Bridgwater, Anthony V. "Review of fast pyrolysis of biomass and product
upgrading." Biomass and bioenergy 38 (2012): 68-94.
Page 63
50
11. Lange, Jean‐Paul. "Lignocellulose conversion: an introduction to chemistry, process and
economics." Biofuels, bioproducts and biorefining 1.1 (2007): 39-48.
12. Kan, Tao, Vladimir Strezov, and Tim J. Evans. "Lignocellulosic biomass pyrolysis: A
review of product properties and effects of pyrolysis parameters." Renewable and
Sustainable Energy Reviews 57 (2016): 1126-1140.
13. http://shodhganga.inflibnet.ac.in/bitstream/10603/34171/7/07_chapter2.pdf, visit date 6- 4-
2017
14. Dias, Joana M., et al. "Waste materials for activated carbon preparation and its use in
aqueous-phase treatment: a review." Journal of Environmental Management 85.4 (2007):
833-846.
15. Yang, Haiping, et al. "In-depth investigation of biomass pyrolysis based on three major
components: hemicellulose, cellulose and lignin." Energy & Fuels20.1 (2006): 388-393.
16. Ioannidou, O., and A. Zabaniotou. "Agricultural residues as precursors for activated carbon
production—a review." Renewable and Sustainable Energy Reviews 11.9 (2007): 1966-
2005.
17. Haykiri-Acma, H., S. Yaman, and S. Kucukbayrak. "Effect of heating rate on the pyrolysis
yields of rapeseed." Renewable Energy 31.6 (2006): 803-810.
18. Gheorghe, Cora, et al. "Effect of pyrolysis conditions on bio-char production from
biomass." Proceedings of the 3rd WSEAS Int. Conf. on Renewable Energy Sources.
University of La Laguna, Tenerife, Canary Islands Spain. 2009.
19. Peng, Xin, et al. "Temperature-and duration-dependent rice straw-derived biochar:
Characteristics and its effects on soil properties of an Ultisol in southern China." Soil and
Tillage Research 112.2 (2011): 159-166.
20. Ho, Natalie. "Modeling hydrogen sulfide adsorption by activated carbon made from
anaerobic digestion by-product". Diss. University of Toronto (Canada), 2012.
21. S. Kruaysawat." Activated Carbon for H2S Removal by Surface Oxidation and Metal
Addition". Suranaree University of Technology,the Degree of Doctor of Philosophy in
Environmental Engineering, 2006, ISBN 974-533-500-2.
Page 64
52
22. Cal, M. P., B. W. Strickler, and A. A. Lizzio. "High temperature hydrogen sulfide
adsorption on activated carbon: I. Effects of gas composition and metal
addition." Carbon 38.13 (2000): 1757-1765.
23. Fan M, Marshall W, Daugaard D, Brown RC. " Steam activation of chars produced from oat
hulls and corn stover". Bioresource Technol 2004;93:103–7.
24. Couto, Gabriela Martucci, et al. "Use of sawdust Eucalyptus sp. in the preparation of
activated carbons." Ciência e Agrotecnologia 36.1 (2012): 69-77.
25. Martinez, M. L., et al. "Preparation and characteristics of activated carbon from olive stones
and walnut shells." Industrial crops and products 23.1 (2006): 23-28.
26. Lua, Aik Chong, and Jia Guo. "Preparation and characterization of activated carbons from
oil-palm stones for gas-phase adsorption." Colloids and Surfaces A: Physicochemical and
Engineering Aspects 179.2 (2001): 151-162.
27. Momčilović, Milan, et al. "Removal of lead (II) ions from aqueous solutions by adsorption
onto pine cone activated carbon." Desalination 276.1 (2011): 53-59.
28. Tsai, W. T., et al. "Adsorption of acid dye onto activated carbons prepared from agricultural
waste bagasse by ZnCl2 activation." Chemosphere 45.1 (2001): 51-58.
29. Malik, R., D. S. Ramteke, and S. R. Wate. "Adsorption of malachite green on groundnut
shell waste based powdered activated carbon." Waste management27.9 (2007): 1129-1138.
30. Marcilla A, Garcıa-Garcıa S, Asensio M, Conesa JA. "Influence of thermal treatment regime
on the density and reactivity of activated carbons from almond shells". Carbon
2000;38:429–40.
31. Ahmadroup A, Do DD. "The preparation of activated carbon from Macadamia nutshell by
chemical activation". Carbon 1997;35:1723–32.
32. Oliveira, Luiz CA, et al. "Preparation of activated carbons from coffee husks utilizing FeCl3
and ZnCl2 as activating agents." Journal of hazardous materials 165.1 (2009): 87-94.
Page 65
53
33. Zhang T, Walawender WP, Fan LT, Fan M, Daugaard D, Brown RC. "Preparation of
activated carbon from forest and agricultural residues through CO2 activation". Chem Eng J
2004; 105:53–9.
34. Christie J.Geankoplis, "Transport process and unit operations", PTR prentice- hall, Inc
,New Jersey , United Nations of America, 1993.
35. using alkaline impregnated activated carbons for hot fuel gas purification." Energy
Procedia 9 (2011): 15-24.Sitthikhankaew, Russamee, et al. "Comparative study of hydrogen
sulfide adsorption by
36. Le Leuch, L. M., A. Subrenat, and P. Le Cloirec. "Hydrogen sulfide adsorption and
oxidation onto activated carbon cloths: applications to odorous gaseous emission
treatments." Langmuir 19.26 (2003): 10869-10877.
37. Adib, Foad, Andrey Bagreev, and Teresa J. Bandosz. "Effect of surface characteristics of
wood-based activated carbons on adsorption of hydrogen sulfide." Journal of colloid and
interface science 214.2 (1999): 407-415.
38. Choo, H. S., et al. "Hydrogen sulfide adsorption by alka-line impregnated coconut shell
activated carbon." J. Eng. Sci. Technol 8 (2013): 741-753.
39. Feng, Wenguo, et al. "Adsorption of hydrogen sulfide onto activated carbon fibers: effect of
pore structure and surface chemistry." Environmental science & technology 39.24 (2005):
9744-9749.
40. Zulkefli, N.N, et al. "Overview of H2S Removal Technologies from Biogas Production. "
International Journal of Applied Engineering Research ISSN 0973-4562 Volume 11,
Number 20 (2016) pp. 10060-10066
41. Martin J. Rhodes." Introduction to Particle Technology", 2nd Edition John Wiley & Sons
Ltd, The Atrium, Southern Gate, Chichester, West Sussex PO19 8SQ, England 2008.
42. Jacob Bear, "Dynamics of Fluids in Porous Media", Dover publications INC, New York
2013.
43. Dutt, Dharm, and C. H. Tyagi. "Comparison of various eucalyptus species for their
morphological, chemical, pulp and paper making characteristics." (2011).
Page 66
54
44. Energieonderzoek Centrum Nederland (ENC)
https://www.ecn.nl/phyllis2/Biomass/View/2314 visit date 12 Dec. 2017
45. Ballesteros, Lina F., José A. Teixeira, and Solange I. Mussatto. "Chemical, functional, and
structural properties of spent coffee grounds and coffee silverskin." Food and bioprocess
technology7.12 (2014): 3493-3503.
46. Tsai, Jiun-Horng, Fu-Teng Jeng, and Hung-Lung Chiang. "Removal of H2S from exhaust
gas by use of alkaline activated carbon." Adsorption 7.4 (2001): 357-366.
47. Chiang, Hung-Lung, et al. "Adsorption characteristics of alkaline activated carbon
exemplified by water vapor, H2S, and CH3SH gas." Separation science and technology 35.6
(2000): 903-918.
48. Ahmadpour, Ali, Bradley A. King, and Duong D. Do. "Comparison of equilibria and
kinetics of high surface area activated carbon produced from different precursors and by
different chemical treatments." Industrial & engineering chemistry research 37.4 (1998):
1329-1334
49. H.Sawalha, A.Bader, J.Sarsour. "Preparation of Activated Carbon through Pyrolysis of
Agricultural Waste for Wastewater Treatment Applications", Palestine Polytechnic
University, 2016.