122
20 11 R enewable Energy Data Book Energy Efficiency & Renewable Energy
| Date post: | 03-Apr-2018 |
| Category: |
Documents |
| Upload: | chandruuncle |
| View: | 213 times |
| Download: | 0 times |

7/28/2019 Renewable Energy Data Book
http://slidepdf.com/reader/full/renewable-energy-data-book 1/128
2011 Renewable Energy Data Bo
Energy Efficiency &
Renewable Energy

7/28/2019 Renewable Energy Data Book
http://slidepdf.com/reader/full/renewable-energy-data-book 2/128
Acknowledgments
This report was produced by Rachel Gelman, edited by Scott Gossett,
and designed by Stacy Buchanan o the National Renewable Energy
Laboratory (NREL). We greatly appreciate the input o Carla Frisch,
Tien Nguyen, and Hoyt Battey o the U.S. Department o Energy, as well
as Lynn Billman, Karlynn Cory, David Kline, and Robin Newmark o NREL.
Front page background photo from iStock/3351020
Front page inset photos (left to right): iStock/754519, iStock/4393369, iStock/354309,
iStock/2101722, iStock/2574180, iStock/5080552, Leslie Eudy, NREL/PIX 17854, iStock/11265066
Page 2: iStock/721000, page 6: iStock/5751076, page 16: photo from Invenergy LLC, NREL/
PIX 14369, page 40: iStock/750178, page 52: iStock/ 754519, page 62: iStock/4393369, page 68:
iStock/354309, page 74: iStock/2101722, page 80: iStock/2574180, page 84: iStock/5080552,
Page 88: photo by Leslie Eudy, NREL/PIX 17854, page 92: iStock/11265066, page 106:
iStock/330791, page 114: iStock/3459287
7/28/2019 Renewable Energy Data Book
http://slidepdf.com/reader/full/renewable-energy-data-book 3/128
Key Findings
• The installed global renewable electricity capacity nearly doubled between 2000 and
2011, although renewable energy is a relatively small portion o total energy supply bothglobally and in the United States.
• Renewable electricity represented nearly 13% o total installed capacity and more than
12% o total electric generation in the United States in 2011 . Installed renewable electricity
capacity is more than 146 gigawatts (GW).
• In 2011 in the United States, wind and solar photovoltaics (PV) were two o the astest
growing electric generation technologies. In 2011, cumulative installed wind capacity
increased by nearly 17% and cumulative installed solar photovoltaic capacity grew more
than 86% rom the previous year.

7/28/2019 Renewable Energy Data Book
http://slidepdf.com/reader/full/renewable-energy-data-book 4/128
Key Findings, continued
• Worldwide, wind energy is one o the astest growing renewable electricity technologies—
between 2000 and 2011, wind electricity generation worldwide increased by a actor o13. The United States experienced even more dramatic growth, as installed wind electricity
capacity increased by a actor o 18 between 2000 and 2011.
• In the United States, renewable electricity has been capturing a growing percentage o new
capacity additions during the past ew years. In 2011, renewable electricity accounted or
more than 35% o all new electrical capacity installations in the United States—a large
change rom 2004 when all renewable electricity captured only 2% o new capacity additions
• Since 2006, the United States has been the world’s leading ethanol producer. Between 2000
and 2011, U.S. production o corn ethanol increased by a actor o 8 . The use o ethanol in
gasoline blends in the United States has tripled since 2005.

7/28/2019 Renewable Energy Data Book
http://slidepdf.com/reader/full/renewable-energy-data-book 5/128
U.S. Energy Background Inormation . . . . . . . . . . . . . . . . . . . . . . . . . . . . . . . . . . . . . . . . . . . . . .
Renewable Electricity in the United States . . . . . . . . . . . . . . . . . . . . . . . . . . . . . . . . . . . . . .
Global Renewable Energy Development . . . . . . . . . . . . . . . . . . . . . . . . . . . . . . . . . . . . . . . . .
Wind . . . . . . . . . . . . . . . . . . . . . . . . . . .. . . . . . . . . . . . . . . . . . . . . . . . . . .. . . . . . . . . . . . . . . . . . . . . . . . . . .. . . . . . . . . . . .
Solar . . . . . . . . . . . . . . . . . . . . . . .. . . . . . . . . . . . . . . . . . . . . . . . . . .. . . . . . . . . . . . . . . . . . . . . . . . . . .. . . . . . . . . . . . . . . . .
Geothermal . . . . . . . . . . . . . . . . . . . . . . . . . . .. . . . . . . . . . . . . . . . . . . . . . . . . . .. . . . . . . . . . . . . . . . . . . . . . . . . . .. . . .
Biopower . . . . . . . . . . . . . . . . . . . . . . . . .. . . . . . . . . . . . . . . . . . . . . . . . . . .. . . . . . . . . . . . . . . . . . . . . . . . . . . .. . . . . . .
Hydropower . . . . . . . . . . . . . . . . . . . . . . . . . .. . . . . . . . . . . . . . . . . . . . . . . . . . .. . . . . . . . . . . . . . . . . . . . . . . . . . .. . . .
Advanced Water Power . . . . . . . . . . . . . . . . . . . . . . . . . . . . . . . . . . . . . . . . . . . . . . . . . . . . . . . . . . . . . . . . . .
Hydrogen . . . . . . . . . . . . . . . . . . . . . . . . .. . . . . . . . . . . . . . . . . . . . . . . . . . .. . . . . . . . . . . . . . . . . . . . . . . . . . . .. . . . . . .
Renewable and Alternative Fuels . . . . . . . . . . . . . . . . . . . . . . . . . . . . . . . . . . . . . . . . . . . . . . . . . . . .
Clean Energy Investments . . . . . . . . . . . . . . . . . . . . . . . . . . . . . . . . . . . . . . . . . . . . . . . . . . . . . . . . . . . . . .
Glossary . . . . . . . . . . . . . . . . . . . . . . . . . . .. . . . . . . . . . . . . . . . . . . . . . . . . . .. . . . . . . . . . . . . . . . . . . . . . . . . . .. . . . . . . .
Reerences . . . . . . . . . . . . . . . . . . . . . . .. . . . . . . . . . . . . . . . . . . . . . . . . . .. . . . . . . . . . . . . . . . . . . . . . . . . . .. . . . . . . .
Table o Contents
7/28/2019 Renewable Energy Data Book
http://slidepdf.com/reader/full/renewable-energy-data-book 6/128
I. U.S. Energy Background Inormation

7/28/2019 Renewable Energy Data Book
http://slidepdf.com/reader/full/renewable-energy-data-book 7/128
U.S. Energy Background Information | Revised February7
Source: EIA; ull reerences are provided starting on p. 123.
Note: Energy consumption is higher than energy production due to oil imports.
All data reported as primary energy.
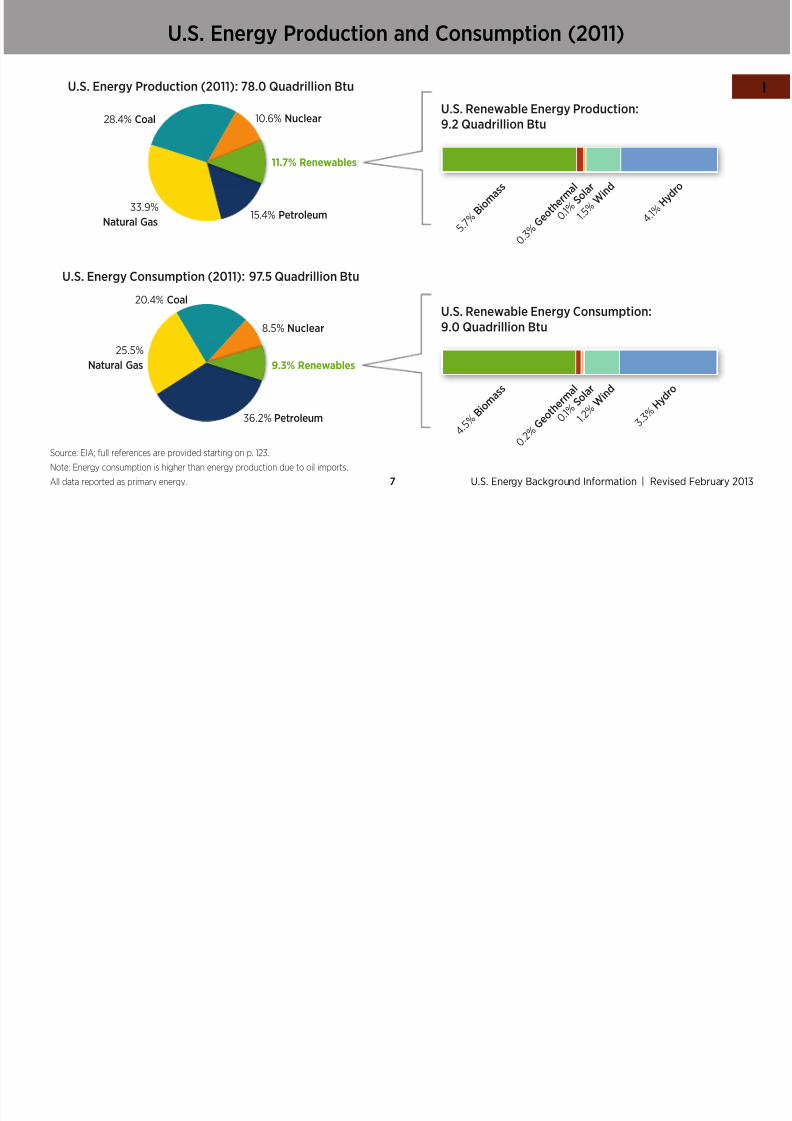
U.S. Energy Production and Consumption (2011)
10.6% Nuclear
11.7% Renewables
28.4% Coal
33.9%
Natural Gas15.4% Petroleum
U.S. Energy Production (2011): 78.0 Quadrillion Btu
U.S. Renewable Energy Production:
9.2 Quadrillion Btu
8.5% Nuclear
4 . 5 % B
i o m a s s
5 . 7 %
B i o m
a s s
0 . 2 %
G e o t h e
r m a l
0 . 3 %
G e o t h
e r m a
l
0 . 1 %
S o l a r
0 . 1 %
S o l a r
1 . 2 %
W i n d
3 . 3 %
H y d
r o
1 . 5 %
W i n d
4 . 1 %
H y d
r o
9.3% Renewables
20.4% Coal
25.5%
Natural Gas
36.2% Petroleum
U.S. Energy Consumption (2011): 97.5 Quadrillion Btu
U.S. Renewable Energy Consumption:
9.0 Quadrillion Btu

7/28/2019 Renewable Energy Data Book
http://slidepdf.com/reader/full/renewable-energy-data-book 8/128
8 U.S. Energy Background Information | Revised February
I
Source: EIA
* Includes natural gas plant liquids.
Note: Annual totals may not equal 100% due to rounding.
U.S. Energy Production by Energy Source (2000–2011)
Coal Natural Gas* Petroleum Nuclear RenewablesTotal Production
(Quadrillion Btu)
2000 31.9% 31.2% 17.3% 11.0% 8.6% 71.3
2001 32.8% 31.7% 17.1% 11.2% 7.2% 71.7
2002 32.1% 31.0% 17.2% 11.5% 8.1% 70.7
2003 31.5% 31.4% 17.2% 11.4% 8.5% 70.0
2004 32.6% 30.7% 16.4% 11.7% 8.6% 70.2
2005 33.4% 30.1% 15.8% 11.8% 9.0% 69.4
2006 33.6% 30.2% 15.3% 11.6% 9.3% 70.8
2007 32.9% 31.1% 15.0% 11.8% 9.2% 71.4
2008 32.6% 31.6% 14.4% 11.5% 9.9% 73.1
2009 29.8% 32.6% 15.6% 11.5% 10.5% 72.6
2010 29.5% 32.9% 15.5% 11.3% 10.9% 74.8
2011 28.4% 33.9% 15.4% 10.6% 11.7% 78.0
7/28/2019 Renewable Energy Data Book
http://slidepdf.com/reader/full/renewable-energy-data-book 9/128
U.S. Energy Background Information | Revised February9
U.S. Energy Consumption by Energy Source (2000–2011)
Source: EIA
Coal Natural Gas Petroleum Nuclear RenewablesTotal Consumption
(Quadrillion Btu)
2000 22.9% 24.1% 38.7% 8.0% 6.2% 98.7
2001 22.8% 23.7% 39.7% 8.4% 5.4% 96.1
2002 22.4% 24.1% 39.2% 8.3% 5.9% 97.6
2003 22.8% 23.3% 39.6% 8.1% 6.1% 97.9
2004 22.5% 22.9% 40.3% 8.2% 6.1% 100.0
2005 22.7% 22.5% 40.3% 8.1% 6.2% 100.2
2006 22.5% 22.3% 40.1% 8.3% 6.7% 99.6
2007 22.5% 23.4% 39.3% 8.3% 6.5% 101.3
2008 22.5% 24.0% 37.6% 8.5% 7.2% 99.3
2009 20.8% 24.8% 37.4% 8.8% 8.0% 94.5
2010 21.4% 24.8% 36.8% 8.6% 8.3% 97.7
2011 20.4% 25.5% 36.2% 8.5% 9.3% 97.5

7/28/2019 Renewable Energy Data Book
http://slidepdf.com/reader/full/renewable-energy-data-book 10/128
10 U.S. Energy Background Information | Revised February
I
Sources: EIA, GEA, LBNL, SEIA/GTM, Larry Sherwood/IREC
Other includes: pumped storage, batteries, chemicals, hydrogen, pitch,purchased steam, sulur, tire-derived uels, and miscellaneous technologies.
* On-grid capacity only.
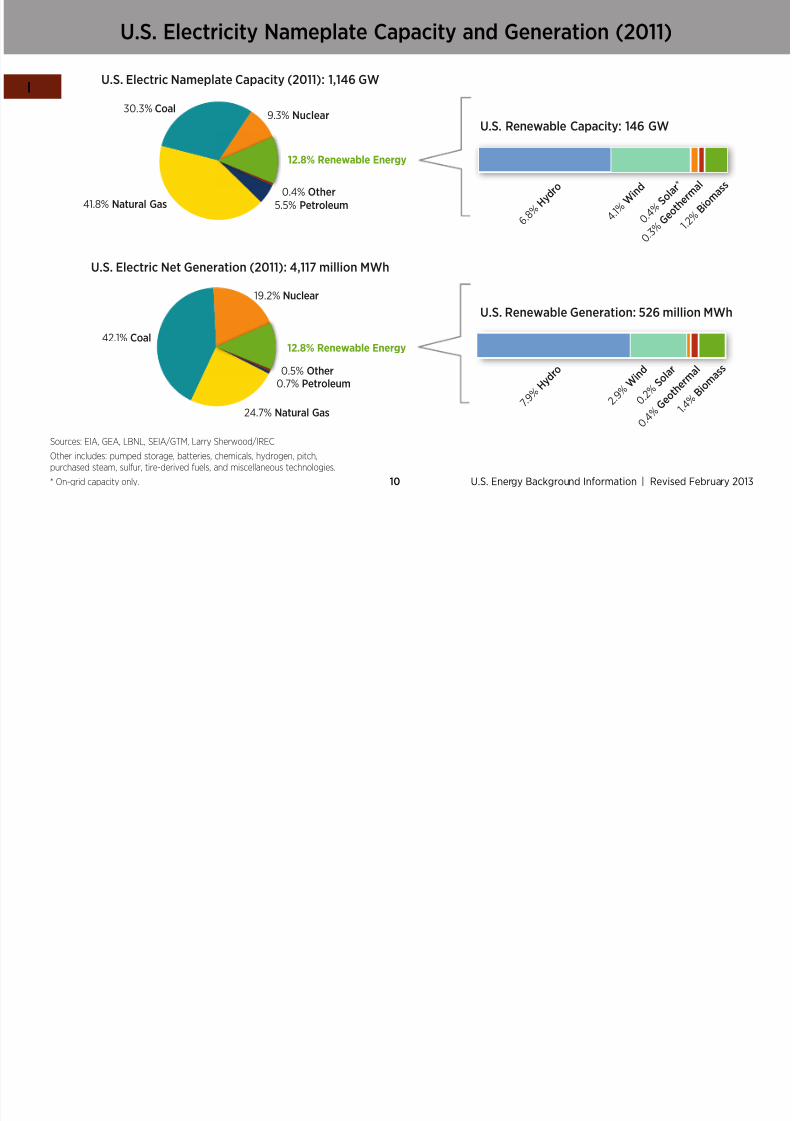
U.S. Electricity Nameplate Capacity and Generation (2011)
9.3% Nuclear
12.8% Renewable Energy
30.3% Coal
41.8% Natural Gas0.4% Other
5.5% Petroleum
U.S. Electric Nameplate Capacity (2011): 1,146 GW
1 . 2 %
B i o m
a s s
0 . 3 %
G e o t h
e r m a
l
0 . 4 %
S o l a r
*
4 . 1 %
W i n d
6 . 8 %
H y d
r o
U.S. Renewable Capacity: 146 GW
42.1% Coal
19.2% Nuclear
12.8% Renewable Energy
0.5% Other
24.7% Natural Gas
0.7% Petroleum
U.S. Electric Net Generation (2011): 4,117 million MWh
1 . 4 %
B i o m
a s s
0 . 4 %
G e o t h
e r m a
l
0 . 2 %
S o l a r
2 . 9 %
W i n d
7 . 9 %
H y d
r o
U.S. Renewable Generation: 526 million MW

7/28/2019 Renewable Energy Data Book
http://slidepdf.com/reader/full/renewable-energy-data-book 11/128
U.S. Energy Background Information | Revised February11Sources: EIA, GEA, LBNL, SEIA/GTM, Larry Sherwood/IREC
U.S. Electric-Generating Capacity by Source (2000–2011)
Coal Petroleum Natural GasOtherGases
Nuclear Renewables OtherTotal Capacity
(MW)
2000 39.6% 8.0% 28.6% 0.3% 12.3% 11.0% 0.1% 848,112
2001 37.6% 8.2% 31.6% 0.2% 11.7% 10.6% 0.1% 895,186
2002 35.2% 6.9% 36.7% 0.2% 10.9% 10.0% 0.1% 960,306
2003 33.2% 6.6% 39.9% 0.2% 10.4% 9.6% 0.1% 1,012,402
2004 32.5% 6.3% 41.0% 0.2% 10.2% 9.5% 0.1% 1,030,056
2005 32.1% 6.2% 41.7% 0.2% 10.1% 9.7% 0.1% 1,047,704
2006 31.8% 6.1% 41.9% 0.2% 10.0% 9.9% 0.1% 1,056,289
2007 31.5% 5.8% 42.1% 0.2% 9.9% 10.3% 0.1% 1,066,961
2008 30.5% 5.6% 41.4% 0.2% 9.6% 11.0% 0.1% 1,083,176
2009 30.7% 5.7% 41.7% 0.2% 9.7% 11.9% 0.1% 1,102,335
2010 30.6% 5.6% 41.7% 0.3% 9.5% 12.3% 0.1% 1,120,188
2011 30.3% 5.5% 41.8% 0.3% 9.3% 12.8% 0.1% 1,145,741

7/28/2019 Renewable Energy Data Book
http://slidepdf.com/reader/full/renewable-energy-data-book 12/128
12 U.S. Energy Background Information | Revised February
I
Sources: EIA, GEA, LBNL, SEIA/GTM, Larry Sherwood/IREC
U.S. Electricity Generation by Source (2000–2011)
CoalPetroleum
Liquids
Petroleum
Coke
Natural
Gas
Other
GasesNuclear Renewables Other
TotalGeneration
(million kWh)
2000 51.6% 2.7% 0.2% 15.8% 0.4% 19.8% 9.4% 0.1% 3,807,955
2001 50.8% 3.1% 0.3% 17.1% 0.2% 20.5% 7.7% 0.3% 3,745,745
2002 50.0% 2.0% 0.4% 17.9% 0.3% 20.2% 8.9% 0.4% 3,867,498
2003 50.7% 2.6% 0.4% 16.7% 0.4% 19.6% 9.1% 0.4% 3,892,115
2004 49.7% 2.5% 0.5% 17.8% 0.4% 19.8% 8.8% 0.4% 3,979,023
2005 49.5% 2.5% 0.6% 18.7% 0.3% 19.2% 8.8% 0.3% 4,062,458
2006 48.9% 1.1% 0.5% 20.1% 0.3% 19.3% 9.5% 0.3% 4,071,962
2007 48.4% 1.2% 0.4% 21.5% 0.3% 19.4% 8.5% 0.3% 4,164,748
2008 48.1% 0.8% 0.3% 21.4% 0.3% 19.5% 9.3% 0.3% 4,127,019
2009 44.4% 0.7% 0.3% 23.3% 0.3% 20.2% 10.6% 0.3% 3,956,989
2010 44.7% 0.6% 0.3% 23.9% 0.3% 19.5% 10.4% 0.3% 4,133,852
2011 42.1% 0.4% 0.3% 24.7% 0.3% 19.2% 12.8% 0.3% 4,117,287

7/28/2019 Renewable Energy Data Book
http://slidepdf.com/reader/full/renewable-energy-data-book 13/128
U.S. Energy Background Information | Revised February13Source: EIA
U.S. Energy Consumption by Sector (2011)
27.7% Transportation
Commercial 18.6%
31.5% Industrial
Residential 22.2%
U.S. Energy Consumption in 2011 was 97.5 Quadrillion Btu
U.S. buildings
represent 40.8%o energy use.

7/28/2019 Renewable Energy Data Book
http://slidepdf.com/reader/full/renewable-energy-data-book 14/128
14 U.S. Energy Background Information | Revised February
I
Source: EIA
U.S. Energy Consumption – Residential and Commercial (2011)
47.4% ElectricalSystem EnergyLosses
52.5% Elect
System EneLosses
22.4% Electricity
Retail Sales
24.9%Electricity
Retail Sales
Renewables 2.6%
Renewables 0.7%
0.03% Coal 0.3% Coal
Natural Gas 22.3% Natural Gas 17.8%
Petroleum 5.3%
Petroleum 3.8%
Residential Energy Consumption
(21.7 Quadrillion Btu) – 2011
Commercial Energy Consumption
(18.1 Quadrillion Btu) – 2011
7/28/2019 Renewable Energy Data Book
http://slidepdf.com/reader/full/renewable-energy-data-book 15/128
U.S. Energy Background Information | Revised February15Source: EIA
U.S. Energy Consumption – Industrial and Transportation (2011)
22.9% Electrical System
Energy Losses
0.2% Electrical SystemEnergy Losses
10.8% ElectricityRetail Sales
0.1% Electricity Retail
7.5% Renewables
4.2% Renewables
Coal 5.4%
0.0% Coal
Natural Gas 27.1%
2.7% Natural Gas
26.3% Petroleum
92.8% Petroleum
Industrial Energy Consumption(30.7 Quadrillion Btu) – 2011
Transportation Energy Consumption(27.1 Quadrillion Btu) – 2011

7/28/2019 Renewable Energy Data Book
http://slidepdf.com/reader/full/renewable-energy-data-book 16/128
II. Renewable Electricity in the United States

7/28/2019 Renewable Energy Data Book
http://slidepdf.com/reader/full/renewable-energy-data-book 17/128
Renewable Electricity in the United States | Revised February17
Renewable Electricity in the United States: Summary
• Since 2000, renewable electricity installations in the United States have more than
tripled, and in 2011 represent 146 GW o installed U.S. capacity.
• Installed renewable electricity capacity has grown at a compounded annual average
o nearly 4.2% per year rom 2000–2011.
• U.S. renewable electricity in 2011 is 12.8% o total overall installed electricity capacity
and 12.8 % o total annual generation in the United States.
• Wind and solar photovoltaics are the astest growing renewable electricity sectors.
In 2011 in the United States, wind installed capacity increased by nearly 17% and
solar photovoltaic installed capacity grew more than 86% rom the previous year.

7/28/2019 Renewable Energy Data Book
http://slidepdf.com/reader/full/renewable-energy-data-book 18/128
Renewable Electricity in the United States | Revised February
II
18
Renewable Electricity in the United States: Summary, continued
• In 2011 in the United States, biomass produced about 11% o total renewable
electricity generation, wind produced 23%, solar (photovoltaics and
concentrating solar power) produced 1%, hydropower produced 62%, and
geothermal produced 3%.
• Wind energy accounted or about 75% o newly installed U.S. renewable
electricity capacity in 2011.
• Electricity generation rom biomass, geothermal, and hydropower have remained
relatively stable since 2000.

7/28/2019 Renewable Energy Data Book
http://slidepdf.com/reader/full/renewable-energy-data-book 19/128
Renewable Electricity in the United States | Revised February19
U.S. Capacity and Generation: All Renewables
Sources: EIA, GEA, LBNL, SEIA/GTM, Larry Sherwood/IREC
0
20,000
40,000
60,000
80,000
100,000
120,000
140,000
160,000
0
100,000
200,000
300,000
400,000
500,000
600,000
MW Million kWh
Generation
Capacity
2 0 0 1
2 0 0 0
2 0
0 2
2 0
0 3
2 0
0 4
2 0
0 5
2 0
0 6
2 0
0 7
2 0
0 8
2 0
0 9
2 0 1 0
2 0 1 1
TotalNameplate
Capacity (MW)
TotalGeneration
(Million kWh)
2000 93,370 356,789
2001 94,943 288,009
2002 95,804 343,740
2003 97,478 355,686
2004 98,195 351,465
2005 101,113 358,129
2006 104,072 386,474
2007 109,845 353,854
2008 119,639 382,276
2009 130,677 419,755
2010 137,286 430,668
2011 146,142 525,707

7/28/2019 Renewable Energy Data Book
http://slidepdf.com/reader/full/renewable-energy-data-book 20/128
Renewable Electricity in the United States | Revised February
II
20
U.S. Renewable Electricity Generating Capacity by Source
Sources: EIA, GEA, LBNL, SEIA/GTM, Larry Sherwood/IREC
* Includes on-grid capacity only.
MW
20012000 2002 2003 2004 2005 2006 2007 2009 2010 201120080
20,000
40,000
60,000
80,000
100,000
120,000
140,000
Geothermal
Wind
CSP
PV*
Biomass
Hydro
7/28/2019 Renewable Energy Data Book
http://slidepdf.com/reader/full/renewable-energy-data-book 21/128
Renewable Electricity in the United States | Revised February21
U.S. Renewable Electricity Nameplate Capacity Added (MW)
Sources: EIA, GEA, LBNL, SEIA/GTM, Larry Sherwood/IREC
- annual decrease annual increase +
Solar PV CSP Wind Geothermal Biomass HydroTotal Capacity
AddedCapacity Added as a % oTotal Renewable Energy
2001 11 0 1,697 0 (100) (35) 1,573 2%
2002 23 0 411 0 291 136 861 1%
2003 45 0 1,667 0 (11) (27) 1,674 2%
2004 58 0 372 0 177 110 717 1%
2005 79 0 2,396 30 189 224 2,918 3%
2006 105 1 2,454 3 331 65 2,959 3%
2007 169 64 5,237 106 185 13 5,773 5%
2008 311 (0) 8,425 104 747 208 9,794 8%
2009 438 11 9,922 46 351 270 11,038 8%
2010 896 78 5,108 15 218 294 6,608 5%
2011 1,858 9 6,816 86 222 33 9,024 6%
U S R bl El t i it N l t C it (MW)

7/28/2019 Renewable Energy Data Book
http://slidepdf.com/reader/full/renewable-energy-data-book 22/128
Renewable Electricity in the United States | Revised February
II
22
U.S. Renewable Electricity Nameplate Capacity (MW)and Percent Cumulative Increase rom Previous Year
Sources: EIA, GEA, LBNL, SEIA/GTM, Larry Sherwood/IREC
* Includes on- and o-grid capacity.
Hydro Solar PV* CSP Wind Geothermal Biomass Total Renewabl
2001 76,911 (0%) 29 (62.4%) 354 (0%) 4,275 (65.8%) 2,798 (0%) 10,576 (-0.9%) 94,943 (1.7%)
2002 77,047 (0.2%) 52 (76.9%) 354 (0%) 4,686 (9.6%) 2,798 (0%) 10,867 (2.8%) 95,804 (0.9%
2003 77,020 (0%) 97 (87.3%) 354 (0%) 6,353 (35.6%) 2,798 (0%) 10,856 (-0.1%) 97,478 (1.7%)
2004 77,130 (0.1%) 155 (59.2%) 354 (0%) 6,725 (5.9%) 2,798 (0%) 11,033 (1.6%) 98,195 (0.7%)
2005 77,354 (0.3%) 234 (51.0%) 354 (0%) 9,121 (35.6%) 2,828 (1.1%) 11,222 (1.7%) 101,113 (3.0%)
2006 77,419 (0.1%) 339 (44.7%) 355 (0.3%) 11,575 (26.9%) 2,831 (0.1%) 11,553 (2.9%) 104,072 (2.9%
2007 77,432 (0%) 508 (49.8%) 419 (18%) 16,812 (45.2%) 2,937 (3.7%) 11,738 (1.6%) 109,845 (5.5%
2008 77,640 (0.3%) 819 (61.2%) 419 (0%) 25,237 (50.1%) 3,040 (3.5%) 12,485 (6.4%) 119,639 (8.9%
2009 77,910 (0.3%) 1,257 (53.5%) 430 (2.6%) 35,159 (39.3%) 3,086 (1.5%) 12,836 (2.8%) 130,677 (9.2%
2010 78,204 (0.4%) 2,153 (71.3%) 507 (18.0%) 40,267 (14.5%) 3,101 (0.5%) 13,053 (1.7%) 137,286 (5.1%)
2011 78,237 (0%) 4,011 (86.3%) 516 (1.7%) 46,916 (16.5%) 3,187 (2.8%) 13,276 (1.7%) 146,142 (6.5%
- annual decrease annual increa
U S R bl El t i it C it
7/28/2019 Renewable Energy Data Book
http://slidepdf.com/reader/full/renewable-energy-data-book 23/128
Renewable Electricity in the United States | Revised February23
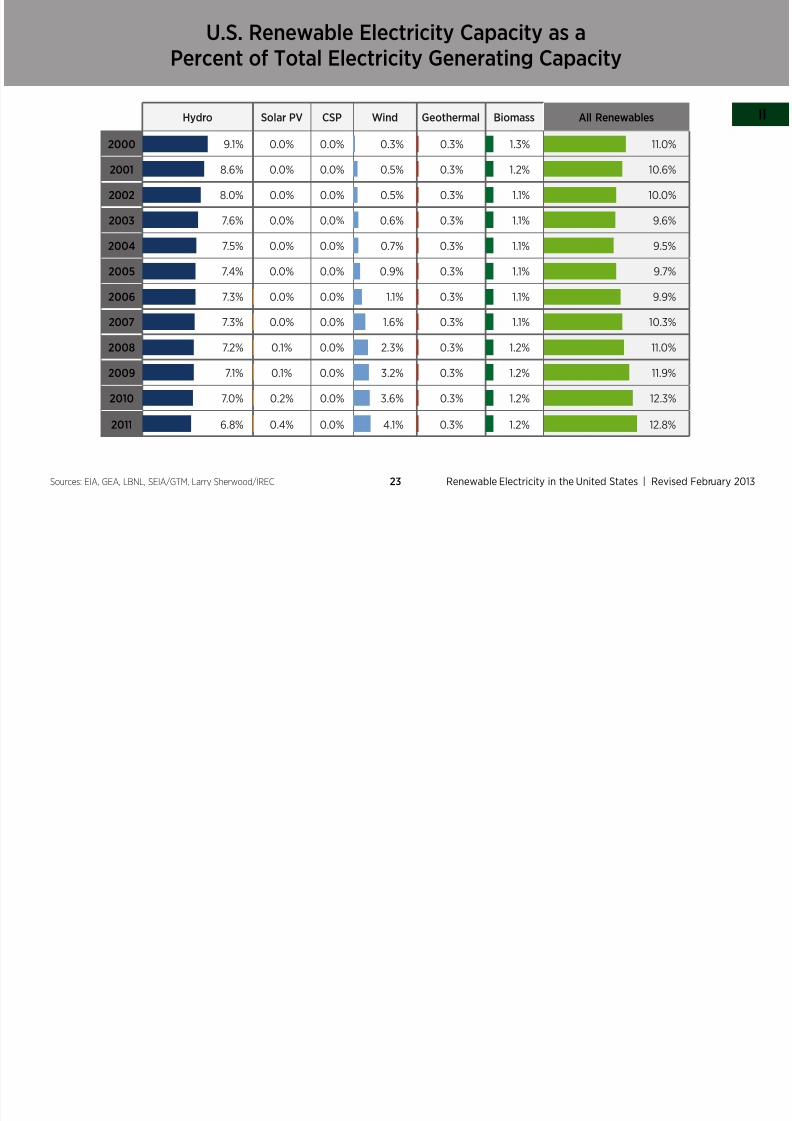
U.S. Renewable Electricity Capacity as aPercent o Total Electricity Generating Capacity
Sources: EIA, GEA, LBNL, SEIA/GTM, Larry Sherwood/IREC
Hydro Solar PV CSP Wind Geothermal Biomass All Renewables
2000 9.1% 0.0% 0.0% 0.3% 0.3% 1.3% 11.0%
2001 8.6% 0.0% 0.0% 0.5% 0.3% 1.2% 10.6%
2002 8.0% 0.0% 0.0% 0.5% 0.3% 1.1% 10.0%
2003 7.6% 0.0% 0.0% 0.6% 0.3% 1.1% 9.6%
2004 7.5% 0.0% 0.0% 0.7% 0.3% 1.1% 9.5%
2005 7.4% 0.0% 0.0% 0.9% 0.3% 1.1% 9.7%
2006 7.3% 0.0% 0.0% 1.1% 0.3% 1.1% 9.9%
2007 7.3% 0.0% 0.0% 1.6% 0.3% 1.1% 10.3%
2008 7.2% 0.1% 0.0% 2.3% 0.3% 1.2% 11.0%
2009 7.1% 0.1% 0.0% 3.2% 0.3% 1.2% 11.9%
2010 7.0% 0.2% 0.0% 3.6% 0.3% 1.2% 12.3%
2011 6.8% 0.4% 0.0% 4.1% 0.3% 1.2% 12.8%
U S Ann al Installed Rene able Electric Capacit Gro th

7/28/2019 Renewable Energy Data Book
http://slidepdf.com/reader/full/renewable-energy-data-book 24/128
Renewable Electricity in the United States | Revised February
II
24Sources: EIA, GEA, LBNL, SEIA/GTM, Larry Sherwood/IREC
U.S. Annual Installed Renewable Electric Capacity Growth
A n n u a l A
d d i t i o n s ( M W )
Capacity
0
2,000
4,000
6,000
8,000
10,000
12,000
20112010200920082007200620052004200320022001
CompoundedAnnual Growth Ra
(2000–2011)
Wind 30.2%
Solar PV 63.4%
CSP 3.5%
Biomass 2.0%
Geothermal 1.2%
Hydro 0.2%
All Renewables 4.2%
U S Renewable Electricity Generation

7/28/2019 Renewable Energy Data Book
http://slidepdf.com/reader/full/renewable-energy-data-book 25/128
Renewable Electricity in the United States | Revised February25
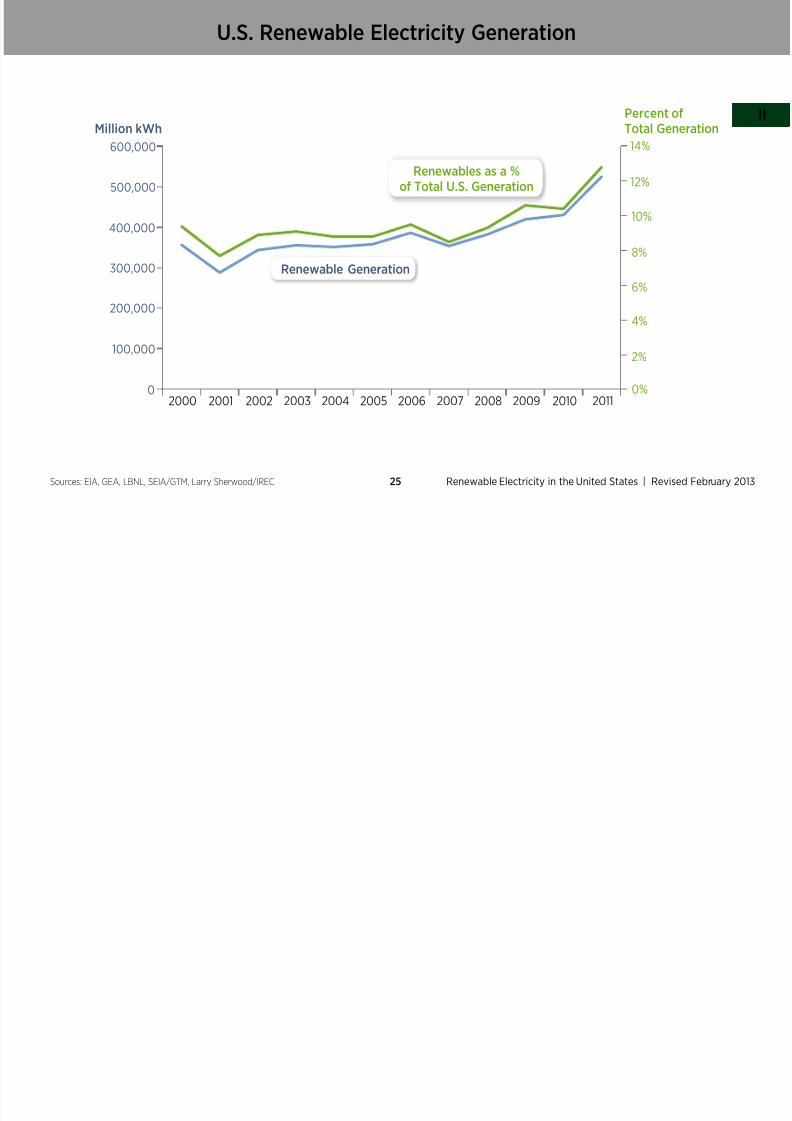
U.S. Renewable Electricity Generation
Sources: EIA, GEA, LBNL, SEIA/GTM, Larry Sherwood/IREC
0
100,000
200,000
300,000
400,000
500,000
600,000
Million kWh
0%
2%
4%
6%
8%
10%
12%
14%
201120102009200820072006200520042003200220012000
Percent of
Total Generation
Renewables as a %
of Total U.S. Generation
Renewable Generation
U S Renewable Electricity Generation by Technology

7/28/2019 Renewable Energy Data Book
http://slidepdf.com/reader/full/renewable-energy-data-book 26/128
Renewable Electricity in the United States | Revised February
II
26
U.S. Renewable Electricity Generation by Technology
Sources: EIA, GEA, LBNL, SEIA/GTM, Larry Sherwood/IREC
0
50,000
100,000
150,000
200,000
250,000
300,000
350,000
201120102009200820072006200520042003200220012000
Million kWh
Biomass
Hydropower
Wind
Geothermal
Solar
U S Renewable Electricity Generation as a Percent o Total U S Generat
7/28/2019 Renewable Energy Data Book
http://slidepdf.com/reader/full/renewable-energy-data-book 27/128
Renewable Electricity in the United States | Revised February27
U.S. Renewable Electricity Generation as a Percent o Total U.S. Generat
Sources: EIA, GEA, LBNL, SEIA/GTM, Larry Sherwood/IREC
Hydro Solar Wind Geothermal Biomass All Renewables
2000 7.2% 0.0% 0.1% 0.4% 1.6% 9.4%
2001 5.8% 0.0% 0.2% 0.4% 1.3% 7.7%
2002 6.8% 0.0% 0.3% 0.4% 1.4% 8.9%
2003 7.1% 0.0% 0.3% 0.4% 1.4% 9.1%
2004 6.7% 0.0% 0.4% 0.4% 1.3% 8.8%
2005 6.7% 0.0% 0.4% 0.4% 1.3% 8.8%
2006 7.1% 0.0% 0.7% 0.4% 1.3% 9.5%
2007 5.9% 0.0% 0.8% 0.4% 1.3% 8.5%
2008 6.2% 0.1% 1.3% 0.4% 1.3% 9.3%
2009 6.9% 0.1% 1.9% 0.4% 1.4% 10.6%
2010 6.3% 0.1% 2.3% 0.4% 1.4% 10.4%
2011 7.9% 0.2% 2.9% 0.4% 1.4% 12.8%
U S Renewable Electricity Generation (Million kWh)
7/28/2019 Renewable Energy Data Book
http://slidepdf.com/reader/full/renewable-energy-data-book 28/128
Global Renewable Energy Development | Revised February
III
28Sources: EIA, GEA, LBNL, SEIA/GTM, Larry Sherwood/IREC
U.S. Renewable Electricity Generation (Million kWh)and Percent Cumulative Increase rom Previous Year
Hydropower Solar Wind Geothermal Biomass All Renewables
2000 275,573 (-13.8%) 804 (8.3%) 5,593 (24.6%) 14,093 (-5.0%) 60,726 (1.9%) 356,789 (-10.6%)
2001 216,961 (-21.3%) 822 (2.2%) 6,737 (20.5%) 13,741 (-2.5%) 49,748 (-18.1%) 288,009 (-19.3%)
2002 264,329 (21.8%) 857 (4.3%) 10,354 (53.7%) 14,491 (5.5%) 53,709 (8.0%) 343,740 (19.4%)
2003 275,806 (4.3%) 929 (8.4%) 11,187 8.0% 14,424 (-0.5%) 53,340 (-0.7%) 355,686 (3.5%)
2004 268,417 (-2.7%) 1,020 (9.8%) 14,144 (26.4%) 14,811 (2.7%) 53,073 (-0.5%) 351,465 (-1.2%)
2005 270,321 (0.7%) 1,145 (12.2%) 17,811 (25.9%) 14,692 (-0.8%) 54,160 (2.0%) 358,129 (1.9%)
2006 289,246 (7.0%) 1,312 (14.6%) 26,589 (49.3%) 14,568 (-0.8%) 54,759 (1.1%) 386,474 (7.9%)
2007 247,510 (-14.4%) 1,718 (31.0%) 34,450 (29.6%) 14,637 (0.5%) 55,539 (1.4%) 353,854 (-8.4%)
2008 254,831 (3.0%) 2,208 (28.5%) 55,363 (60.7%) 14,840 (1.4%) 55,034 (-0.9%) 382,276 (8.0%)
2009 273,455 (7.3%) 2,922 (32.4%) 73,886 (33.5%) 15,009 (1.1%) 54,493 (-1.0%) 419,755 (9.8%)
2010 260,203 (-4.8%) 4,505 (54.2%) 94,652 (28.1%) 15,219 (1.4%) 56,089 (2.9%) 430,668 (2.6%)
2011 325,074 (24.9%) 7,454 (65.5%) 119,747 (26.5%) 16,700 (9.7%) 56,732 (1.1%) 525,707 (22.1%)
- annual decrease annual increase +
State Renewable Energy Inormation: Summary
7/28/2019 Renewable Energy Data Book
http://slidepdf.com/reader/full/renewable-energy-data-book 29/128
Renewable Electricity in the United States | Revised February29
State Renewable Energy Inormation: Summary
• In 2011, Washington had the most installed renewable electric capacity
o any U.S. state (23,970 MW).
• In 2008, Texas became the national leader in wind power development,
and in 2011 has more than 10 GW o wind capacity installed.
• Caliornia installed 921 MW o wind and 538 MW o solar capacity in 2011,
the most o any state.
• A combination o state incentives and renewable portolio standards or
renewable electricity and renewable resource development has driven renewable
growth in many states. Some wind development was driven by economics in
select locations
Top States or Renewable Electricity Installed Capacity (2011)

7/28/2019 Renewable Energy Data Book
http://slidepdf.com/reader/full/renewable-energy-data-book 30/128
Renewable Electricity in the United States | Revised February
II
30Sources: EIA, LBNL, GEA, SEIA/GTM, Larry Sherwood/IREC, U.S. Census
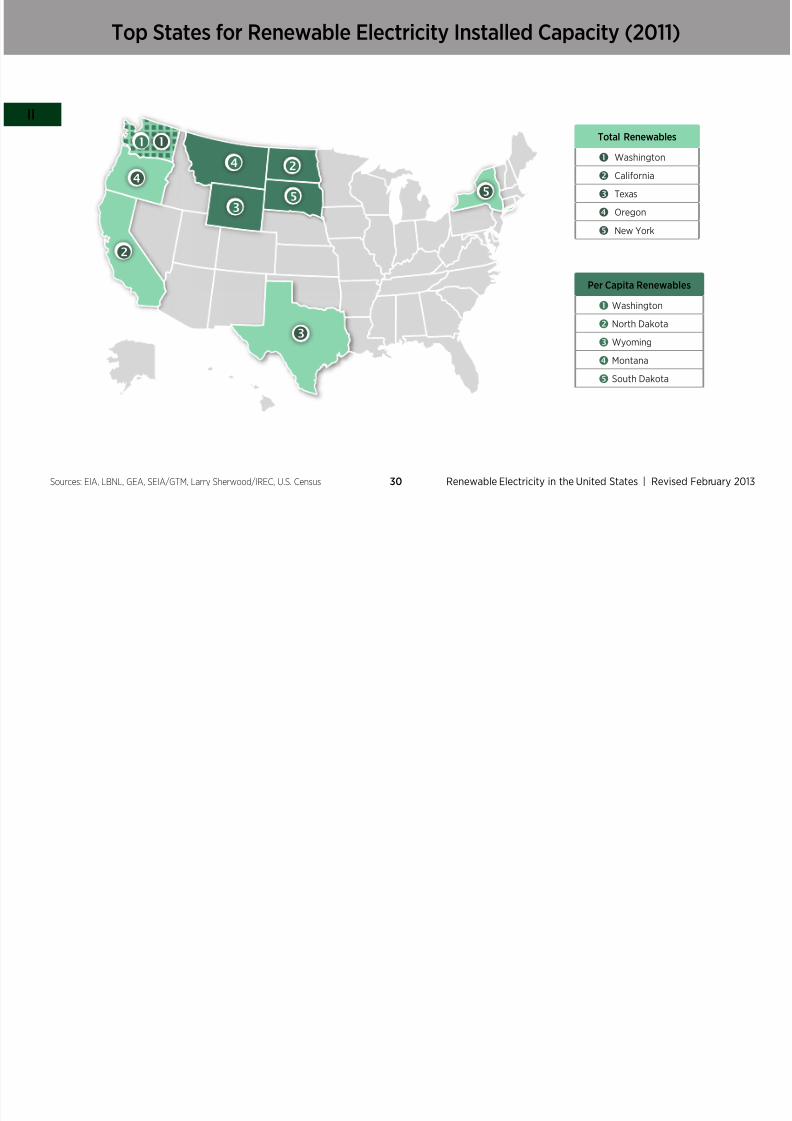
Top States or Renewable Electricity Installed Capacity (2011)
Total Renewables
Washington
Caliornia
Texas
Oregon
New York
Per Capita Renewables
Washington
North Dakota
Wyoming
Montana
South Dakota
Top States or Renewable Electricity Installed Capacity (2011)

7/28/2019 Renewable Energy Data Book
http://slidepdf.com/reader/full/renewable-energy-data-book 31/128
Renewable Electricity in the United States | Revised February31Sources: EIA, LBNL, GEA, Larry Sherwood/IREC, SEIA/GTM
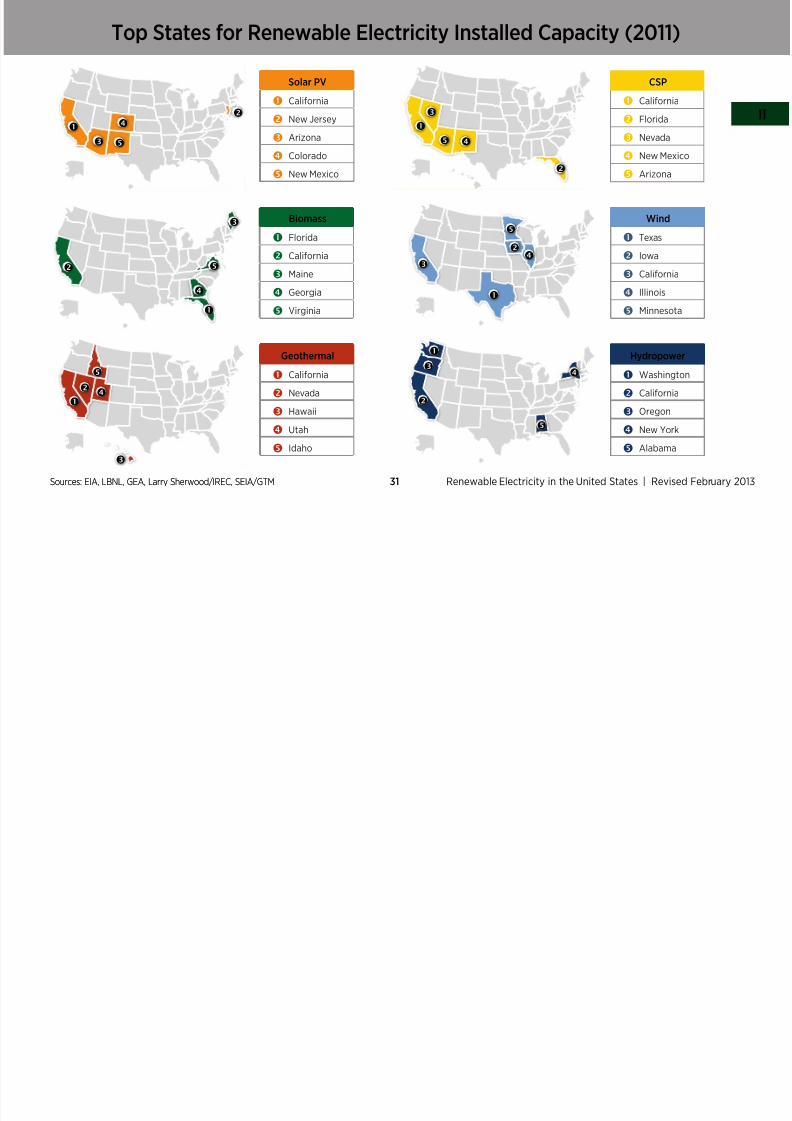
Top States or Renewable Electricity Installed Capacity (2011)
Sources: EIA, LBNL, GEA, Larry Sherwood/IREC, SEIA/GTM
Solar PV
Caliornia
New Jersey
Arizona
Colorado
New Mexico
Biomass
Florida
Caliornia
Maine
Georgia
Virginia
Geothermal
Caliornia
Nevada
Hawaii
Utah
Idaho
CSP
Caliornia
Florida
Nevada
New Mexico
Arizona
Wind
Texas
Iowa
Caliornia
Illinois
Minnesota
Hydropower
Washington
Caliornia
Oregon
New York
Alabama
Renewable Electricity Installed Capacity (MW) (2011)
7/28/2019 Renewable Energy Data Book
http://slidepdf.com/reader/full/renewable-energy-data-book 32/128
Renewable Electricity in the United States | Revised February
II
32
Renewable Electricity Installed Capacity (MW) (2011)NORTHEAST
Sources: EIA, LBNL, GEA, SEIA/GTM, Larry Sherwood/IREC, U.S. Census
* Does not include o-grid installations
Wind PV* CSP Geothermal Biomass HydropowerTotal
RenewablesPer capita REwatts/person
New York 1,403 123.8 0 0 529 4,657 6,713 345
Pennsylvania 789 133.1 0 0 600 778 2,300 180
Maine 397 1.1 0 0 771 726 1,895 1,427
New Jersey 8 565.9 0 0 231 13 818 93
Massachusetts 47 74.6 0 0 365 272 759 115
New Hampshire 26 3.1 0 0 182 446 657 498
Vermont 46 11.7 0 0 88 315 461 736
Connecticut 0 31.1 0 0 221 119 371 103
Rhode Island 2 1.2 0 0 26 3 32 31
Renewable Electricity Installed Capacity (2011)

7/28/2019 Renewable Energy Data Book
http://slidepdf.com/reader/full/renewable-energy-data-book 33/128
Renewable Electricity in the United States | Revised February33
Renewable Electricity Installed Capacity (2011) NORTHEAST
Sources: EIA, LBNL, GEA, SEIA/GTM, Larry Sherwood/IREC
0
1,000
2,000
3,000
4,000
5,000
6,000
7,000
MW
Geothermal
Wind
CSP
PV
Hydropower
Biomass
C o n n e c t i c u t
M a i n e
N e w H a m p s h i r e
N e w J e r s e y
N e w Y o r k
P e n n s y l v a n i a
R h o d e I s l a n d
V e r m o n t
M a s s a c h u s e t t s
Renewable Electricity Installed Capacity (MW) (2011)

7/28/2019 Renewable Energy Data Book
http://slidepdf.com/reader/full/renewable-energy-data-book 34/128
Renewable Electricity in the United States | Revised February
II
34
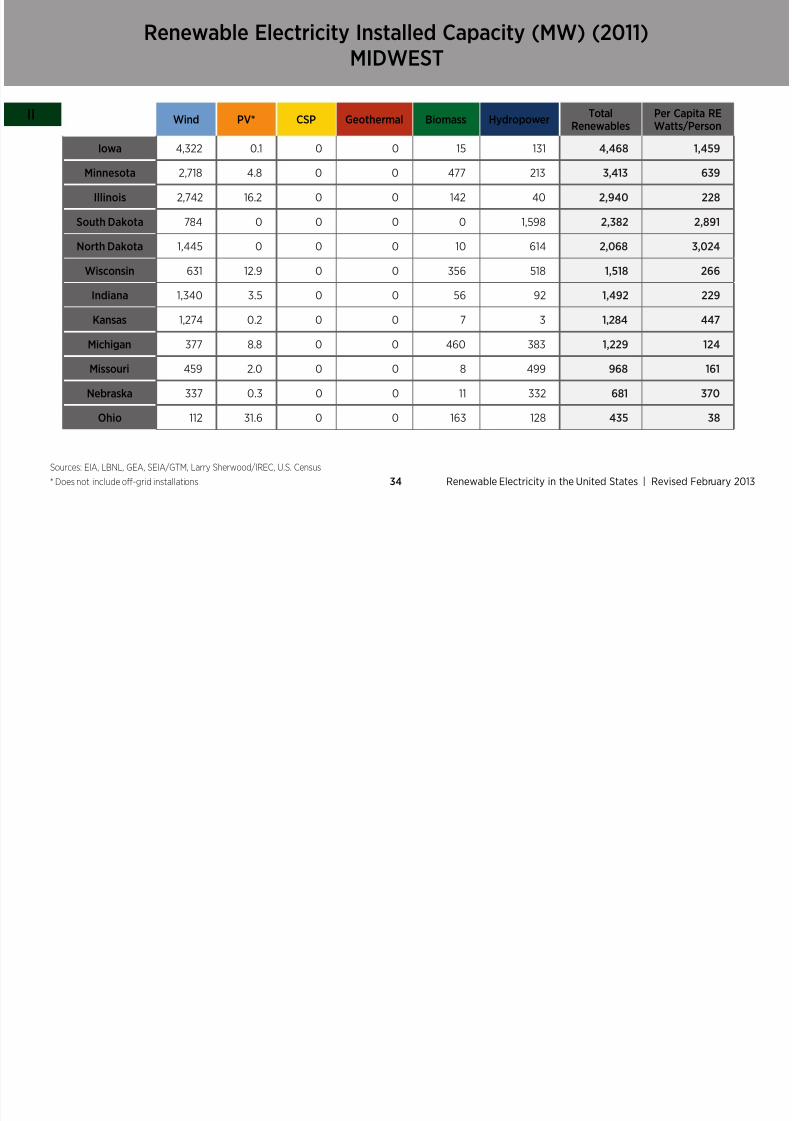
y p y ( ) ( )MIDWEST
Sources: EIA, LBNL, GEA, SEIA/GTM, Larry Sherwood/IREC, U.S. Census
* Does not include o-grid installations
Wind PV* CSP Geothermal Biomass HydropowerTotal
RenewablesPer Capita REWatts/Person
Iowa 4,322 0.1 0 0 15 131 4,468 1,459
Minnesota 2,718 4.8 0 0 477 213 3,413 639
Illinois 2,742 16.2 0 0 142 40 2,940 228
South Dakota 784 0 0 0 0 1,598 2,382 2,891
North Dakota 1,445 0 0 0 10 614 2,068 3,024
Wisconsin 631 12.9 0 0 356 518 1,518 266
Indiana 1,340 3.5 0 0 56 92 1,492 229
Kansas 1,274 0.2 0 0 7 3 1,284 447
Michigan 377 8.8 0 0 460 383 1,229 124
Missouri 459 2.0 0 0 8 499 968 161
Nebraska 337 0.3 0 0 11 332 681 370
Ohio 112 31.6 0 0 163 128 435 38
Renewable Electricity Installed Capacity (2011)

7/28/2019 Renewable Energy Data Book
http://slidepdf.com/reader/full/renewable-energy-data-book 35/128
Renewable Electricity in the United States | Revised February35
y p y ( )MIDWEST
Sources: EIA, LBNL, GEA, SEIA/GTM, Larry Sherwood/IREC
I l l i n o i s
I n d i a n
a I o w
a
K a n s a s
M i c h i g a
n
M i n n e s o t a
M i s s o
u r i
N e b r
a s k a
O h i o
W i s c
o n s i n
N o r t h D a
k o t a
S o
u t h D
a k o t a
0
1,000
2,000
3,000
4,000
5,000
MW
Geothermal
Wind
CSP
PV
Hydropower
Biomass
Renewable Electricity Installed Capacity (MW) (2011)
7/28/2019 Renewable Energy Data Book
http://slidepdf.com/reader/full/renewable-energy-data-book 36/128
Renewable Electricity in the United States | Revised February
II
36
SOUTH
Sources: EIA, LBNL, GEA, SEIA/GTM, Larry Sherwood/IREC, U.S. Census
* Does not include o-grid installations
Wind PV* CSP Geothermal Biomass HydropowerTotal
RenewablesPer Capita REWatts/Person
Texas 10,394 85.6 0 0 345 698 11,523 449Alabama 0 0.5 0 0 636 3,280 3,916 815
Oklahoma 2,007 0.2 0 0 85 805 2,897 764
Tennessee 29 22.0 0 0 202 2,499 2,752 430
Georgia 0 6.9 0 0 698 1,932 2,637 269
North Carolina 0 85.5 0 0 590 1,848 2,523 261
Arkansas 0 1.1 0 0 399 1,321 1,721 586
South Carolina 0 4.1 0 0 337 1,363 1,704 364
Virginia 0 4.5 0 0 681 832 1,518 187
Florida 0 95.0 75 0 1,254 56 1,480 78
Kentucky 0 3.3 0 0 110 804 917 210
West Virginia 564 0.6 0 0 2 325 892 480
Maryland 120 37.1 0 0 161 527 845 145
Louisiana 0 13.4 0 0 366 192 572 125
Mississippi 0 0.6 0 0 244 0 245 82
Delaware 2 26.5 0 0 8 0 37 40
Renewable Electricity Installed Capacity (2011)
7/28/2019 Renewable Energy Data Book
http://slidepdf.com/reader/full/renewable-energy-data-book 37/128
Renewable Electricity in the United States | Revised February37
SOUTH
Sources: EIA, LBNL, GEA, SEIA/GTM, Larry Sherwood/IREC
A l a b a m
a
A r k a
n s a s
D e l a w
a r e
F l o r i d a
G e o r g
i a
K e n t u
c k y
L o u i s i a n
a
M a r y l a n d
M i s s i s s i p p i
N
o r t h C
a r o l i n
a
O k l a h
o m a
S o u t h
C a r o l i n a
T e n n e s s e e
T e x a s
V i r g i n i a
W e s t V
i r g i n i
a
MW
Geothermal
Wind
CSP
PV
Hydropower
Biomass
0
2,000
4,000
6,000
8,000
10,000
12,000
Renewable Electricity Installed Capacity (MW) (2011)

7/28/2019 Renewable Energy Data Book
http://slidepdf.com/reader/full/renewable-energy-data-book 38/128
Renewable Electricity in the United States | Revised February
II
38
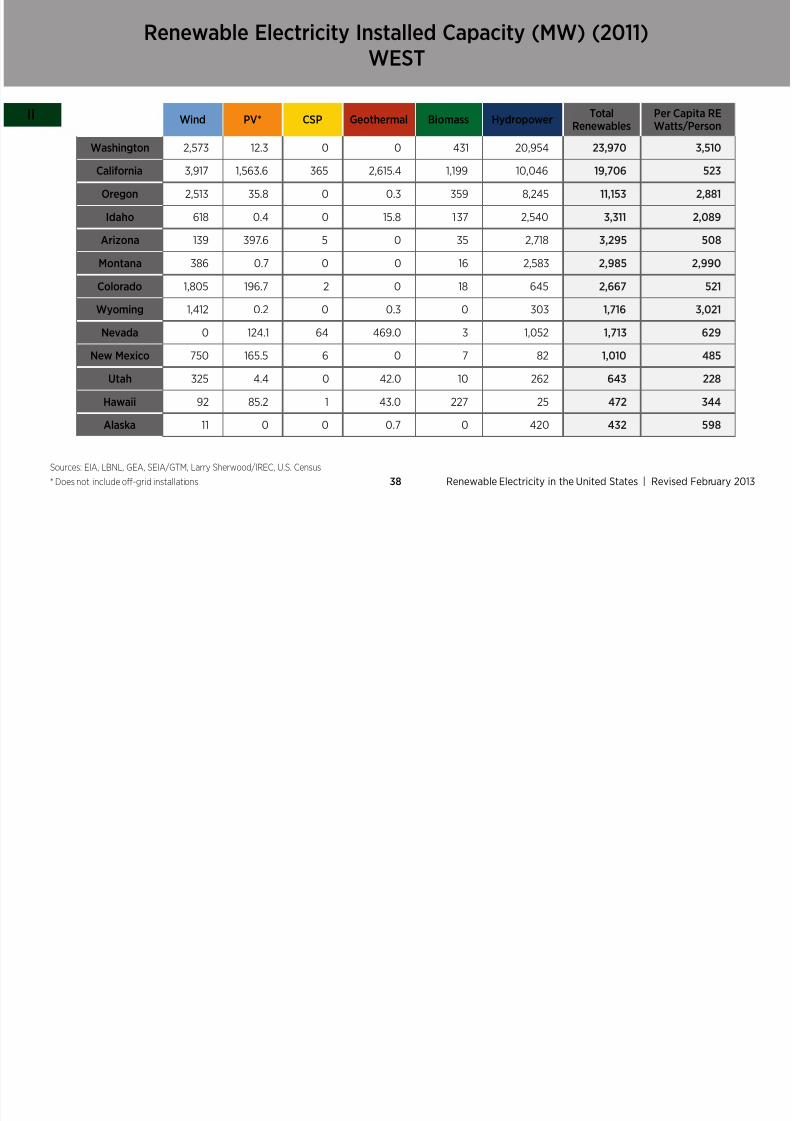
WEST
Sources: EIA, LBNL, GEA, SEIA/GTM, Larry Sherwood/IREC, U.S. Census
* Does not include o-grid installations
Wind PV* CSP Geothermal Biomass HydropowerTotal
RenewablesPer Capita REWatts/Person
Washington 2,573 12.3 0 0 431 20,954 23,970 3,510
Caliornia 3,917 1,563.6 365 2,615.4 1,199 10,046 19,706 523
Oregon 2,513 35.8 0 0.3 359 8,245 11,153 2,881
Idaho 618 0.4 0 15.8 137 2,540 3,311 2,089
Arizona 139 397.6 5 0 35 2,718 3,295 508
Montana 386 0.7 0 0 16 2,583 2,985 2,990
Colorado 1,805 196.7 2 0 18 645 2,667 521
Wyoming 1,412 0.2 0 0.3 0 303 1,716 3,021
Nevada 0 124.1 64 469.0 3 1,052 1,713 629
New Mexico 750 165.5 6 0 7 82 1,010 485
Utah 325 4.4 0 42.0 10 262 643 228
Hawaii 92 85.2 1 43.0 227 25 472 344
Alaska 11 0 0 0.7 0 420 432 598
Renewable Electricity Installed Capacity (2011)
7/28/2019 Renewable Energy Data Book
http://slidepdf.com/reader/full/renewable-energy-data-book 39/128
Renewable Electricity in the United States | Revised February39
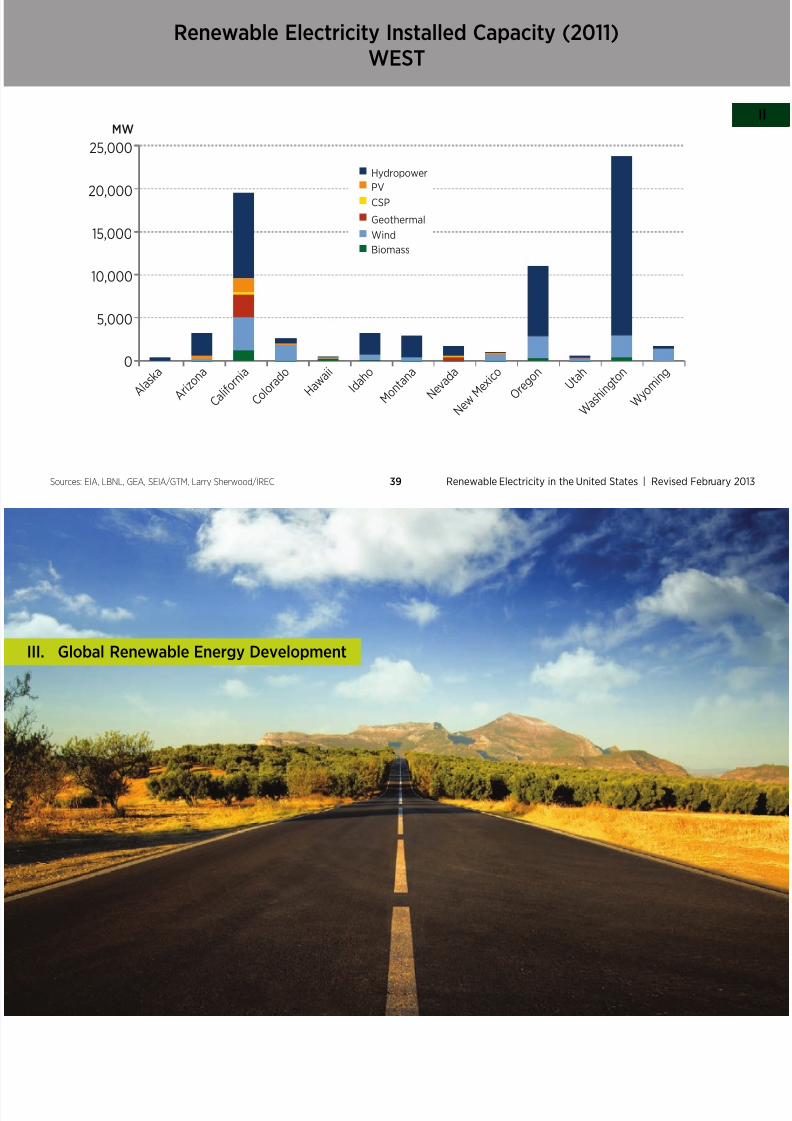
WEST
Sources: EIA, LBNL, GEA, SEIA/GTM, Larry Sherwood/IREC
A l a s
k a
A r i z o
n a
C a l i f o r
n i a
C o l o r
a d o
H a w a
i i I d a
h o
M o n t
a n a
N e v a
d a
N e w M e
x i c o
O r e g
o n U t
a h
W a s
h i n g t
o n
W y o
m i n g
0
5,000
10,000
15,000
20,000
25,000
MW
Geothermal
Wind
CSP
PV
Hydropower
Biomass

7/28/2019 Renewable Energy Data Book
http://slidepdf.com/reader/full/renewable-energy-data-book 40/128
III. Global Renewable Energy Development
Global Renewable Energy Development: Summary

7/28/2019 Renewable Energy Data Book
http://slidepdf.com/reader/full/renewable-energy-data-book 41/128
Global Renewable Energy Development | Revised February41
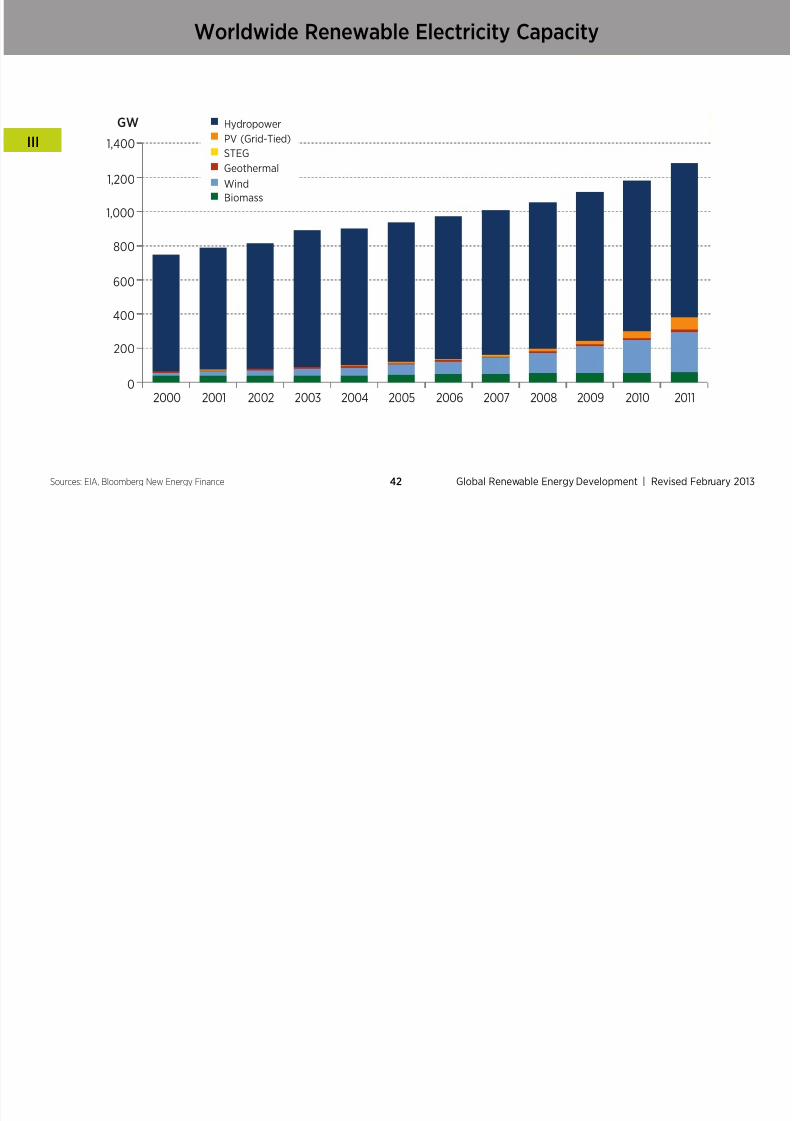
• Cumulative global renewable electricity installed capacity has grown by 72% rom
2000–2011 (rom 748 GW to 1,285 GW).
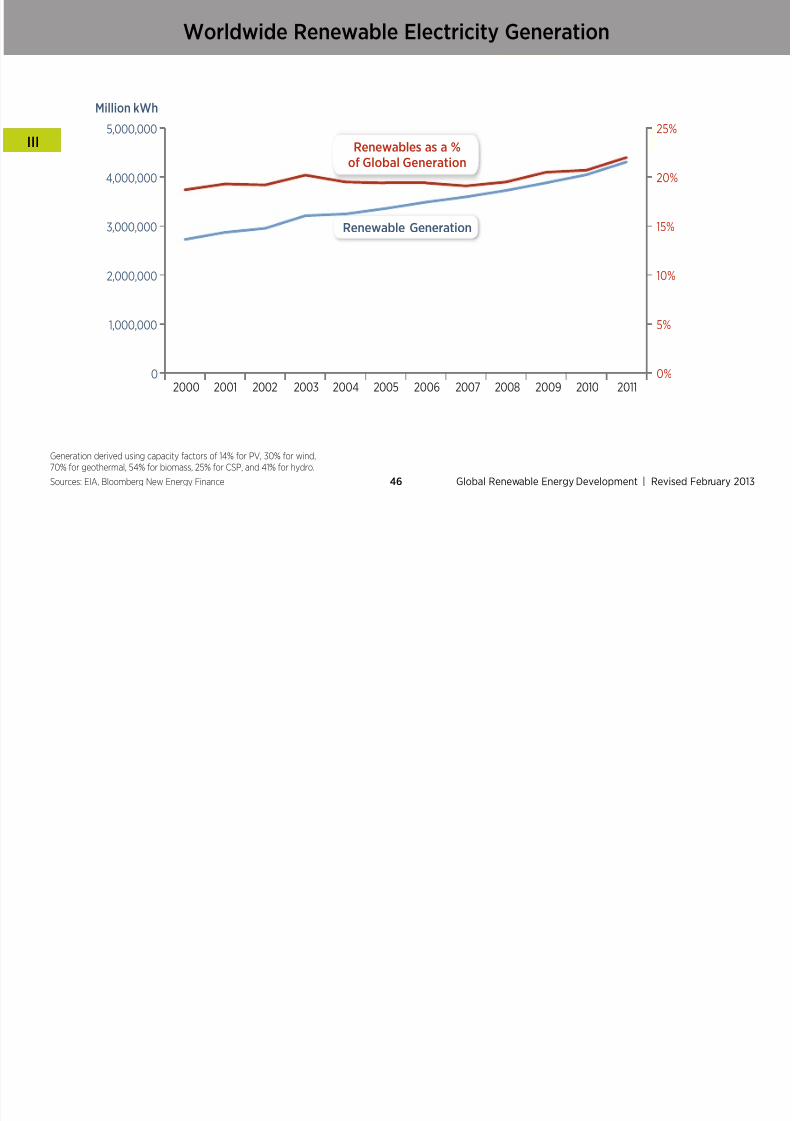
• Renewable energy accounts or 22% o all global electricity generation (4,309 TWh).
• Wind and solar energy are the astest growing renewable electricity technologies
worldwide. Wind generation grew by a actor o 13 and solar photovoltaic generation
grew by a actor o more than 51 between 2000 and 2011.
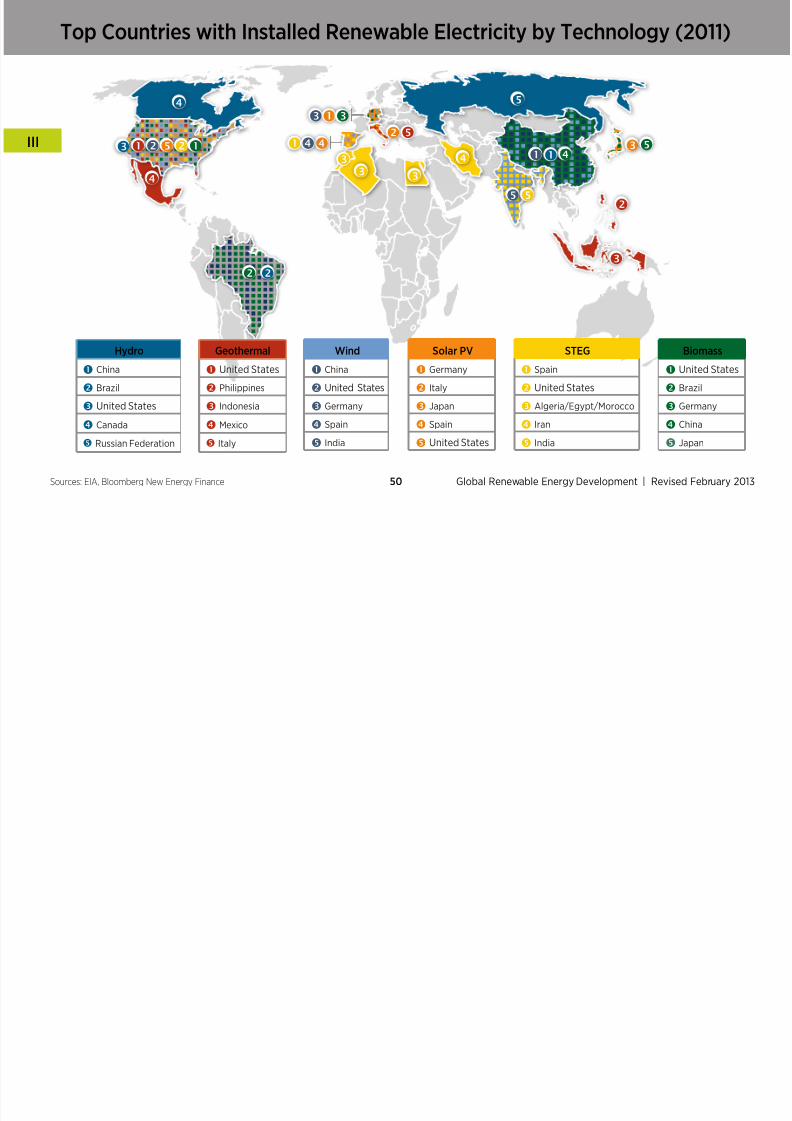
• In 2011, Germany led the world in cumulative solar photovoltaic installed capacity.
The United States leads the world in geothermal and biomass installed capacity.
China leads in wind, and Spain leads in solar thermal electric generation (STEG).
Worldwide Renewable Electricity Capacity

7/28/2019 Renewable Energy Data Book
http://slidepdf.com/reader/full/renewable-energy-data-book 42/128
Global Renewable Energy Development | Revised February
III
42Sources: EIA, Bloomberg New Energy Finance
2000 2001 2002 2003 2004 2005
GW
2006 2007 2008 2009 2010 2011
Geothermal
Wind
STEG
PV (Grid-Tied)
Hydropower
Biomass
0
200
400
600
800
1,000
1,200
1,400
World Renewable Cumulative Electricity CapacityP t I th P i Y
7/28/2019 Renewable Energy Data Book
http://slidepdf.com/reader/full/renewable-energy-data-book 43/128
Global Renewable Energy Development | Revised February43Sources: EIA, Bloomberg New Energy Finance
Percent Increase rom the Previous Year
Hydro Solar PV STEG Wind Geothermal Biomass All Renewables
2000 0% 22% 0% 31% 0% 6% 1%
2001 5% 29% 0% 33% 0% 8% 6%
2002 2% 33% 0% 29% 2% 0% 3%
2003 9% 25% 0% 29% 9% -3% 9%
2004 1% 33% 0% 20% 0% 0% 1%
2005 2% 38% 0% 23% 4% 13% 4%
2006 2% 32% 0% 25% 3% 7% 4%
2007 1% 5% 5% 27% 0% 6% 4%
2008 1% 71% 14% 29% 4% 4% 5%
2009 1% 62% 22% 31% 7% 4% 5%
2010 1% 90% 83% 24% 3% 15% 6%
2011 3% 79% 43% 22% 1% 11% 9%
- annual decrease annual increase +
Renewable Electricity as a Percent o Total InstalledElectricity Capacity Worldwide

7/28/2019 Renewable Energy Data Book
http://slidepdf.com/reader/full/renewable-energy-data-book 44/128
Global Renewable Energy Development | Revised February
III
44Sources: EIA, Bloomberg New Energy Finance
Hydro Solar PV STEG Wind Geothermal Biomass All RenewablesRenewable
Capacity (GW)
2000 19.8% 0.0% 0.0% 0.5% 0.2% 1.1% 21.6% 748
2001 20.1% 0.1% 0.0% 0.7% 0.2% 1.1% 22.2% 789
2002 19.8% 0.1% 0.0% 0.8% 0.2% 1.1% 22.0% 814
2003 20.8% 0.1% 0.0% 1.0% 0.2% 1.0% 23.1% 888
2004 20.2% 0.1% 0.0% 1.2% 0.2% 1.0% 22.7% 901
2005 19.8% 0.1% 0.0% 1.4% 0.2% 1.1% 22.7% 934
2006 19.5% 0.2% 0.0% 1.7% 0.2% 1.1% 22.7% 974
2007 19.0% 0.2% 0.0% 2.1% 0.2% 1.1% 22.6% 1,009
2008 18.6% 0.3% 0.0% 2.6% 0.2% 1.1% 22.8% 1,055
2009 18.1% 0.4% 0.0% 3.3% 0.2% 1.1% 23.1% 1,113
2010 17.6% 0.8% 0.0% 3.9% 0.2% 1.0% 23.6% 1,182
2011 17.4% 1.4% 0.0% 4.6% 0.2% 1.1% 24.8% 1,285
Electricity Capacity Worldwide
Worldwide Annual Installed Renewable Electricity Growth

7/28/2019 Renewable Energy Data Book
http://slidepdf.com/reader/full/renewable-energy-data-book 45/128
Global Renewable Energy Development | Revised February45Sources: EIA, Bloomberg New Energy Finance
2001 2002 2003 2004 2005 2006 2007 2008 2009 2010 2011
GW
0
20
40
60
80
100
Annual Capacity Additions
CompoundedAnnual Growth Rate
(2000–2011)
Wind 26.5%
PV (Grid-Tied) 43.0%
STEG 12.9%
Geothermal 3.1%
Biomass 4.1%
Hydro 2.6%
All Renewables 5.0%
Worldwide Renewable Electricity Generation

7/28/2019 Renewable Energy Data Book
http://slidepdf.com/reader/full/renewable-energy-data-book 46/128
Global Renewable Energy Development | Revised February
III
46
Generation derived using capacity actors o 14% or PV, 30% or wind,70% or geothermal, 54% or biomass, 25% or CSP, and 41% or hydro.
Sources: EIA, Bloomberg New Energy Finance
Million kWh
Renewables as a %
of Global Generation
Renewable Generation
0%
5%
10%
15%
20%
25%
0
1,000,000
2,000,000
3,000,000
4,000,000
5,000,000
201120102009200820072006200520042003200220012000
Worldwide Renewable Electricity Generation by Technology (2000–201
7/28/2019 Renewable Energy Data Book
http://slidepdf.com/reader/full/renewable-energy-data-book 47/128
Global Renewable Energy Development | Revised February47
Generation derived using capacity actors o 14% or PV, 30% o wind,70% or geothermal, 54% or biomass, 25% or CSP, and 41% or hydro.
Sources: EIA, Bloomberg New Energy Finance
2000 2001 2002 2003 2004 2005 2006 2007 2008 2009 2010 2011
Million kWh
Hydro
0
500,000
1,000,000
1,500,000
2,000,000
2,500,000
3,000,000
3,500,000
Wind
Biomass
Solar
Geothermal
Worldwide Renewable Electricity Generationas a Percent o Total Generation

7/28/2019 Renewable Energy Data Book
http://slidepdf.com/reader/full/renewable-energy-data-book 48/128
Global Renewable Energy Development | Revised February
III
48Sources: EIA, Bloomberg New Energy Finance
as a Percent o Total Generation
Hydro Solar PV Biomass Wind Geothermal All RenewablesRenewable Generation
(million kWh)
2000 16.8% 0.0% 1.2% 0.3% 0.3% 18.7% 2,727,082
2001 17.3% 0.0% 1.3% 0.4% 0.3% 19.3% 2,872,463
2002 17.1% 0.0% 1.2% 0.5% 0.3% 19.2% 2,953,879
2003 18.0% 0.0% 1.2% 0.7% 0.3% 20.2% 3,211,282
2004 17.3% 0.0% 1.1% 0.8% 0.3% 19.5% 3,247,899
2005 16.9% 0.0% 1.2% 0.9% 0.3% 19.4% 3,358,626
2006 16.7% 0.1% 1.2% 1.1% 0.3% 19.4% 3,488,055
2007 17.4% 0.1% 1.3% 1.3% 0.3% 20.3% 3,596,408
2008 17.8% 0.1% 1.3% 1.7% 0.3% 21.1% 3,727,159
2009 17.8% 0.1% 1.3% 2.1% 0.3% 21.7% 3,883,180
2010 17.7% 0.3% 1.4% 2.5% 0.3% 22.3% 4,047,871
2011 16.6% 0.5% 1.4% 3.2% 0.4% 22.0% 4,309,125
Top Countries with Installed Renewable Electricity

7/28/2019 Renewable Energy Data Book
http://slidepdf.com/reader/full/renewable-energy-data-book 49/128
Global Renewable Energy Development | Revised February49Sources: EIA, Bloomberg New Energy Finance
Total Renewables (2011)
China
United States
Brazil
Canada
Germany
Top Countries with Installed Renewable Electricity by Technology (2011
7/28/2019 Renewable Energy Data Book
http://slidepdf.com/reader/full/renewable-energy-data-book 50/128
Global Renewable Energy Development | Revised February
III
50Sources: EIA, Bloomberg New Energy Finance
Solar PV
Germany
Italy
Japan
Spain
United States
Biomass
United Sta
Brazil
Germany
China
Japan
Geothermal
United States
Philippines
Indonesia
Mexico
Italy
Hydro
China
Brazil
United States
Canada
Russian Federation
STEG
Spain
United States
Algeria/Egypt/Morocco
Iran
India
Wind
China
United States
Germany
Spain
India

7/28/2019 Renewable Energy Data Book
http://slidepdf.com/reader/full/renewable-energy-data-book 51/128
Global Renewable Energy Development | Revised February51

7/28/2019 Renewable Energy Data Book
http://slidepdf.com/reader/full/renewable-energy-data-book 52/128
IV. Wind
Wind: Summary
7/28/2019 Renewable Energy Data Book
http://slidepdf.com/reader/full/renewable-energy-data-book 53/128
Wind | Revised February53
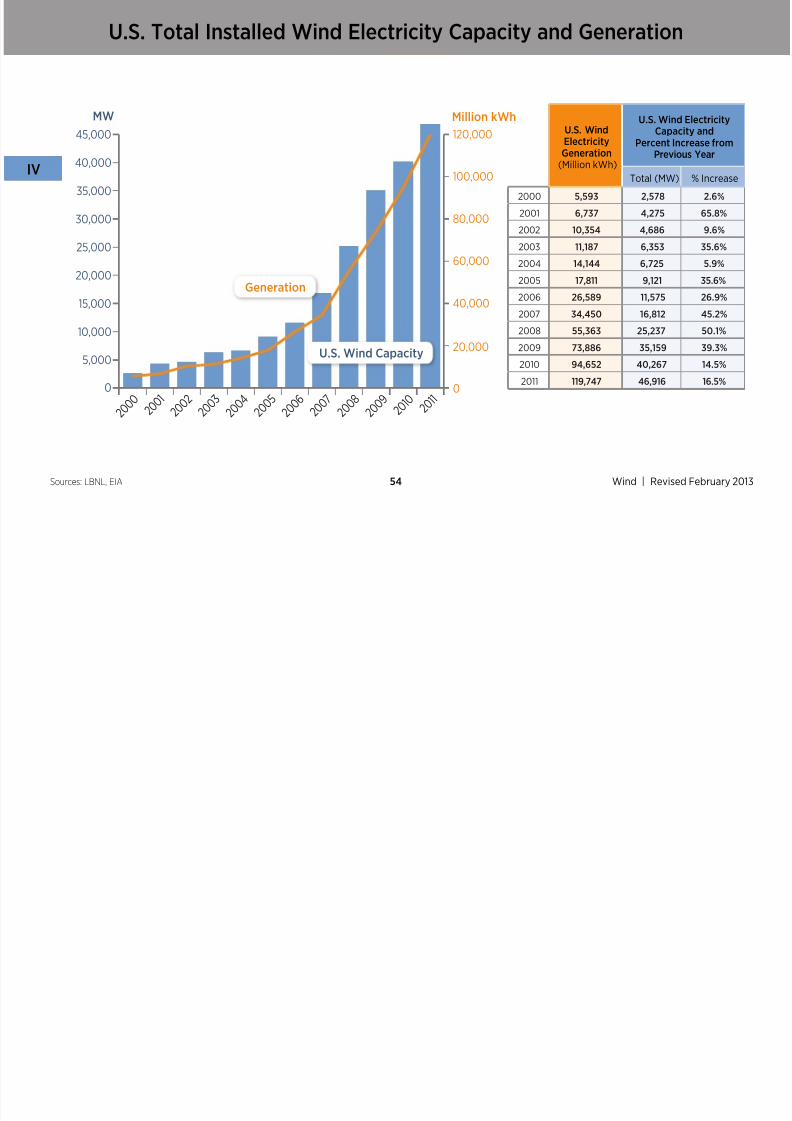
• In the United States, installed wind electricity capacity increased more than
18 old between 2000 and 2011.
• In the United States, wind experienced strong growth in 2011 and nearly 7 GW
o new capacity was added. Caliornia led the United States in wind installations
in 2011, installing 921 MW o wind capacity.
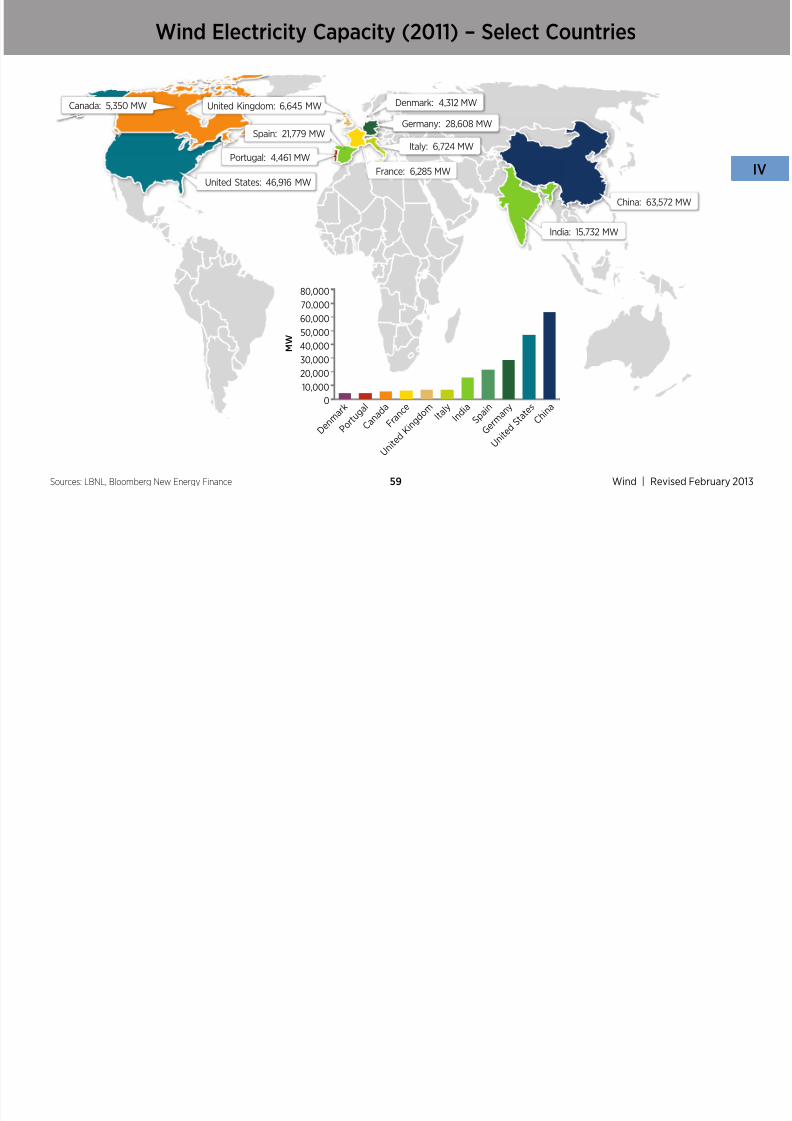
• In 2010, China surpassed the United States as the world leader in cumulativeinstalled wind capacity, with more than 63 GW installed as o the end o 2011.
U.S. Total Installed Wind Electricity Capacity and Generation

7/28/2019 Renewable Energy Data Book
http://slidepdf.com/reader/full/renewable-energy-data-book 54/128
Wind | Revised February
IV
54Sources: LBNL, EIA
Million kWhMW
0
5,000
10,000
15,000
20,000
25,000
30,000
35,000
40,000
45,000
0
20,000
40,000
60,000
80,000
100,000
120,000
U.S. Wind Capacity
Generation
2 0 0 0
2 0 0 1
2 0 0 2
2 0 0 3
2 0 0 4
2 0 0 5
2 0 0 6
2 0 0 7
2 0 0 8
2 0 0 9
2 0 1 0
2 0 1 1
U.S. WindElectricity
Generation(Million kWh)
U.S. Wind ElectricityCapacity and
Percent Increase ro
Previous Year
Total (MW) % Increa
2000 5,593 2,578 2.6%
2001 6,737 4,275 65.8%
2002 10,354 4,686 9.6%
2003 11,187 6,353 35.6%
2004 14,144 6,725 5.9%
2005 17,811 9,121 35.6%
2006 26,589 11,575 26.9%
2007 34,450 16,812 45.2%
2008 55,363 25,237 50.1%
2009 73,886 35,159 39.3%
2010 94,652 40,267 14.5%
2011 119,747 46,916 16.5%
Turbine Manuacturing
7/28/2019 Renewable Energy Data Book
http://slidepdf.com/reader/full/renewable-energy-data-book 55/128
Wind | Revised February55Source: LBNL
U.S. Wind Turbine Market Share 2011
Total Turbine Installations: 6,816 MW
28.9% Vestas
4.2% Nordex
3.8% Clipper
2.5% REpower
1.3% Others
29.4% GE Wind
18.1% Siemens4.9% Suzlon
4.7% Mitsubishi
2.3% Gamesa
Annual U.S. Wind Turbine Installations, by Manuacturer (MW)
7/28/2019 Renewable Energy Data Book
http://slidepdf.com/reader/full/renewable-energy-data-book 56/128
Wind | Revised February
IV
56Source: LBNL
MW
0
2,000
4,000
6,000
8,000
10,000
2011201020092008200720062005
Vestas
Siemens
Suzlon
Gamesa
GE Wind
Mitsubishi
Acciona
REpower
Nordex
Other
Clipper
5,249
2,402
9,922
5,113
6,816
2,454
8,350
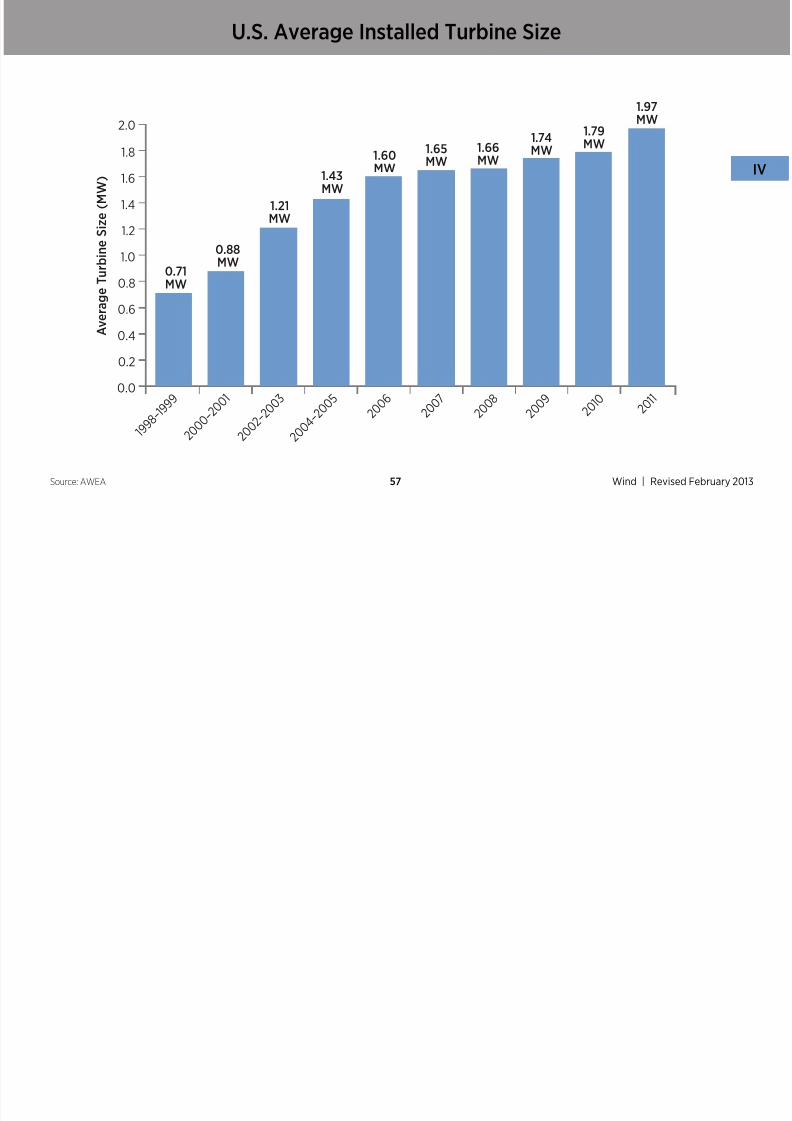
U.S. Average Installed Turbine Size

7/28/2019 Renewable Energy Data Book
http://slidepdf.com/reader/full/renewable-energy-data-book 57/128
Wind | Revised February57Source: AWEA
0.71
MW
0.88
MW
1.21
MW
1.43
MW
1.60MW
1.65
MW
1.66
MW
1.74
MW
1.79
MW
1.97
MW
1 9
9 8 – 1 9 9
9
2 0 0 0 –
2 0 0 1
2 0 0 2 –
2 0 0 3
2 0 0 4 – 2 0
0 5
2 0 0 6
2 0 0 7
2 0 0 8
2 0 0 9
2 0 1 1
2 0 1 0
A v e r a g e T u r b i n e S i z e ( M W )
0.0
0.2
0.4
0.6
0.8
1.0
1.2
1.4
1.6
1.8
2.0
States Leading Wind Power Development

7/28/2019 Renewable Energy Data Book
http://slidepdf.com/reader/full/renewable-energy-data-book 58/128
Wind | Revised February
IV
58Source: LBNL
Cumulative Capacity (2011, MW)
Texas . . . . . . . . . . . . . . . . . . . . . . 10,394
Iowa . . . . . . . . . . . . . . . . . . . . . . . 4,322
Caliornia . . . . . . . . . . . . . . . . 3,917
Illinois . . . . . . . . . . . . . . . . . . . . . 2,742 Minnesota . . . . . . . . . . . . . . . 2,718
Washington . . . . . . . . . . . . 2,573
Oregon . . . . . . . . . . . . . . . . . . . 2,513
Oklahoma . . . . . . . . . . . . . . . 2,007
Colorado. . . . . . . . . . . . . . . . . 1,805
~ North Dakota . . . . . . . . . . 1,445
Annual Capacity (2011, MW)
Caliornia . . . . . . . . . . . . . . . . 921
Illinois . . . . . . . . . . . . . . . . . . . . . 692
Iowa . . . . . . . . . . . . . . . . . . . . . . . 647
Minnesota . . . . . . . . . . . . . . . 542
Oklahoma . . . . . . . . . . . . . . . 525
Colorado. . . . . . . . . . . . . . . . . 506
Oregon . . . . . . . . . . . . . . . . . . 409
Washington . . . . . . . . . . . . 367
Texas . . . . . . . . . . . . . . . . . . . . . . 297
~ Idaho . . . . . . . . . . . . . . . . . . . . . . 265
~
Wind Electricity Capacity (2011) – Select Countries

7/28/2019 Renewable Energy Data Book
http://slidepdf.com/reader/full/renewable-energy-data-book 59/128
Wind | Revised February59Sources: LBNL, Bloomberg New Energy Finance
United States: 46,916 MW
Canada: 5,350 MW Denmark: 4,312 MWUnited Kingdom: 6,645 MW
Spain: 21,779 MW
Portugal: 4,461 MW
Germany: 28,608 MW
Italy: 6,724 MW
France: 6,285 MW
India: 15,732 MW
China: 63,572 MW
M W
C a n a
d a
F r a n
c e
U n i t e
d K
i n g d
o m I t a l y
U n i t e
d S t
a t e s
P o r t u g
a l
D
e n m a r k
I n d i a
C h i n
a
S p a i n
G
e r m a n
y0
10,000
20,000
30,000
40,000
50,000
60,000
70,00080,000
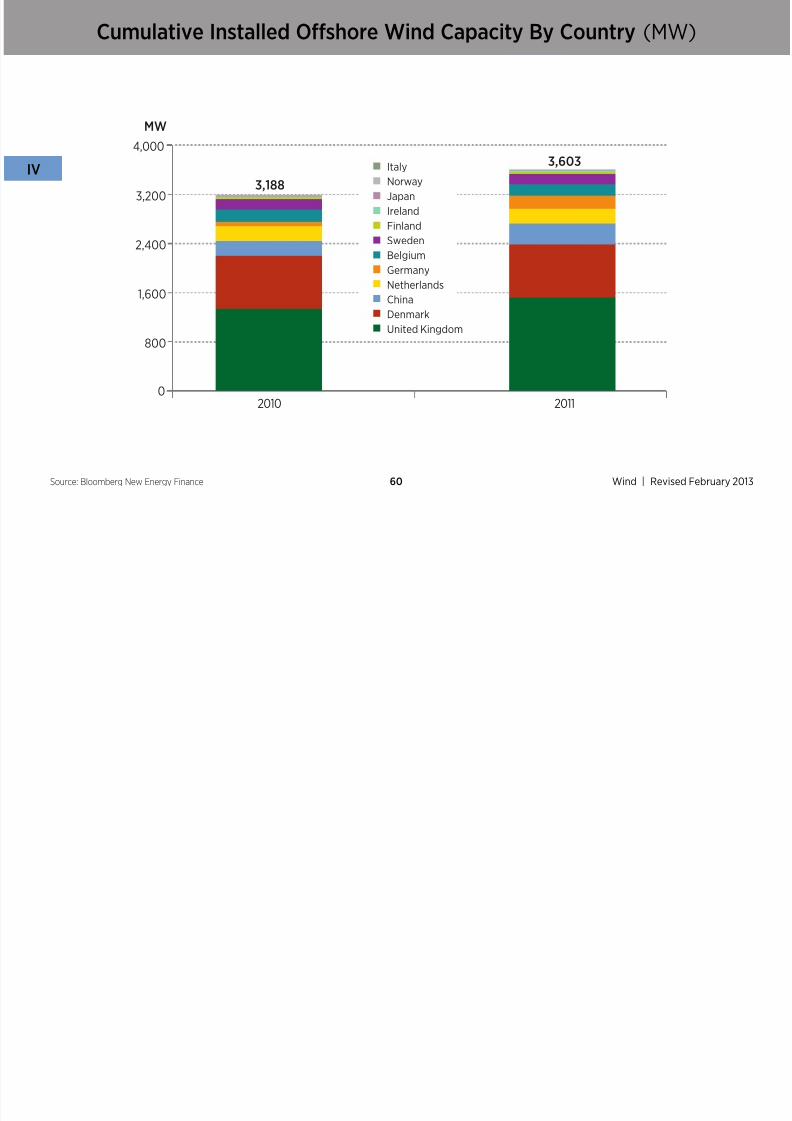
Cumulative Installed Oshore Wind Capacity By Country (MW)

7/28/2019 Renewable Energy Data Book
http://slidepdf.com/reader/full/renewable-energy-data-book 60/128
Wind | Revised February
IV
60Source: Bloomberg New Energy Finance
MW
3,188
3,603
0
800
1,600
2,400
3,200
4,000
20112010
Italy
Norway
Japan
Ireland
Finland
Sweden
Belgium
Germany
Netherlands
China
Denmark
United Kingdom
U.S. Oshore Wind Electricity Proposed Projects

7/28/2019 Renewable Energy Data Book
http://slidepdf.com/reader/full/renewable-energy-data-book 61/128
Wind | Revised February61Source: LBNL, prepared by Navigant Consulting, 2012
State Waters
Federal Waters
0–50 MW
51–250 MW
251–500 MW
501–1,000 MW

7/28/2019 Renewable Energy Data Book
http://slidepdf.com/reader/full/renewable-energy-data-book 62/128
V. Solar
Solar: Summary

7/28/2019 Renewable Energy Data Book
http://slidepdf.com/reader/full/renewable-energy-data-book 63/128
Solar | Revised February63
• Solar electricity generation has grown by a actor o more than 9 between 2000 and
2011, but still represents a very small part o overall U.S. electricity generation (0.2%).
• Countries with extensive solar policies—such as Germany, Spain, Japan, and Italy—
lead the world in solar photovoltaic (PV) deployment. Similarly, U.S. states with
extensive solar incentives lead the United States in both cumulative and annual
installations in 2011 (Caliornia, New Jersey, Colorado, Arizona, and New Mexico).
• U.S. manuacturers currently have a small share o the world PV market. Asian—particularly Chinese—manuacturers lead the market with nearly 77% o the
global photovoltaic cell production.
• A number o concentrating solar power (CSP) plants came online in 2011, including
11.7 MW in the United States.
U.S. Total Installed Solar Electricity Capacity and Generation
7/28/2019 Renewable Energy Data Book
http://slidepdf.com/reader/full/renewable-energy-data-book 64/128
Solar | Revised February
V
64
Sources: SEIA/GTM, Larry Sherwood/IREC
Note: Generation numbers calculated rom installed capacity usinga 18% capacity actor or PV and 25% capacity actor or CSP.
* Includes on- and o-grid capacity.
GWhMW
0
500
1,000
1,500
2,000
2,500
3,000
3,500
4,000
4,500
5,000
0
1,000
2,000
3,000
4,000
5,000
6,000
7,000
8,000
Generation
2 0 0 0
2 0 0 1
2 0 0 2
2 0 0 3
2 0 0 4
2 0 0 5
2 0 0 6
2 0 0 7
2 0 0 8
2 0 0 9
2 0 1 0
2 0 1 1
CSP
PV
U.S. SolarEnergy
Generation(Million kWh)
U.S. Solar EnergyCapacity (MW) and % Incre
rom Previous Year
PV* CSP Total Increa
2000 804 18 354 372 4.3%
2001 822 29 354 383 3.0%
2002 857 52 354 406 5.9%
2003 929 97 354 451 11.2
2004 1,020 155 354 509 12.8
2005 1,145 234 354 588 15.5
2006 1,312 339 355 694 18.0
2007 1,718 508 419 927 33.52008 2,208 819 419 1,237 33.5
2009 2,922 1,257 430 1,686 36.3
2010 4,505 2,153 507 2,660 57.7
2011 7,454 4,011 516 4,527 70.2
Solar Electricity Installed Capacity (2011) – Select Countries

7/28/2019 Renewable Energy Data Book
http://slidepdf.com/reader/full/renewable-energy-data-book 65/128
Solar | Revised February65
Sources: SEIA/GTM, Bloomberg NewEnergy Finance, Larry Sherwood/IREC
* Includes PV and CSP
United States: 4,527 MW
Czech Republic: 1,933 MW
Italy: 12,785 MW
Austria: 1,323 MW
Japan: 4,944 MW
China: 2,995 MW
Germany: 24,562 MW
France: 2,715 MW
Spain: 5,310 MW
Belgium: 1,603 MW
C h i n
a
F
r a n c e
C z e c h R e
p u b l i c
B e
l g i u
m
A
u s t r i a
U n i t e d
S t a t e s
S p a i n
I t a l y
J a p a
n
G e r m
a n y
M W
0
5,000
10,000
15,000
20,000
25,000
Photovoltaic Manuacturing

7/28/2019 Renewable Energy Data Book
http://slidepdf.com/reader/full/renewable-energy-data-book 66/128
Solar | Revised February
V
66Source: GTM PV News, May 2012
59.4%Others
SunPower 2.8%
Tianwei New Energy 2.8%
Hanwha-SolarOne 2.7%
Canadian Solar 4.0%
Yingli Green Energy 4.8%
LDK Solar 2.5%
Hareon Solar 2.5%
Trina Solar 4.3%
Sharp 2.7%
5.8% Suntech PowerFirst Solar 5.7%
Japan 5%1,590 MW
China 61%21,265 MW
United States 4%
1,333 MWRest o World 1%
386 MW
Rest o Asia 16%5,399 MW
Europe 14%4,815 MW
Global Solar Module Production 2011:
34,788 MW
By Country By Manuacturer
States Leading Solar Electricity Development (2011)

7/28/2019 Renewable Energy Data Book
http://slidepdf.com/reader/full/renewable-energy-data-book 67/128
Solar | Revised February67
PV Cumulative
Capacity (2011, MW)
Caliornia. . . . . 1,563.6
New Jersey.. 565.9
Arizona . . . . . . . 397.6
Colorado . . . . . 196.7
New Mexico. 165.5
Pennsylvania 133.1
Nevada . . . . . . . . 124.1
New York . . . . 123.8
Florida . . . . . . . . 95.0
Texas. . . . . . . . . . . 85.6
Sources: SEIA/GTM, Larry Sherwood/IREC
Note: Grid-tied capacity only.
PV Annual Capacity
Additions (2011, MW)
Caliornia. . . . . . . . 537.8
New Jersey. . . . . 306.1
Arizona . . . . . . . . . . 287.8
New Mexico. . . . 122.1
Pennsylvania .. 78.2
Colorado . . . . . . . . 75.5
New York . . . . . . . 68.3
Texas. . . . . . . . . . . . . . 51.1
North Carolina 45.5
Hawaii . . . . . . . . . . . . 40.5
CSP & CPV CumulativeCapacity (2011, MW)
Caliornia . . . . . 364.5
Florida . . . . . . . . 75
Nevada . . . . . . . . 64
New Mexico 6
Arizona . . . . . . . 4.8
Colorado
. . . . . 2.4
Hawaii . . . . . . . . . 0.8

7/28/2019 Renewable Energy Data Book
http://slidepdf.com/reader/full/renewable-energy-data-book 68/128
Geothermal | Revised February
VI
68
VI. Geothermal
Geothermal: Summary

7/28/2019 Renewable Energy Data Book
http://slidepdf.com/reader/full/renewable-energy-data-book 69/128
Geothermal | Revised February69
• U.S. geothermal electricity generation has remained relatively stable rom
2000 to 2011, with the past 11 years experiencing an average o 1.2% growthin annual capacity installed.
• The United States leads the world in installed geothermal electricity
capacity and generation, with most o that power installed in Caliornia.
• As a base-load source o energy, geothermal is distinct rom other renewables
such as wind and solar, because it can provide consistent electricity.
U.S. Geothermal Electricity Capacity and Generation

7/28/2019 Renewable Energy Data Book
http://slidepdf.com/reader/full/renewable-energy-data-book 70/128
Geothermal | Revised February
VI
70Sources: GEA, EIA
0
500
1,000
1,500
2,000
2,500
3,000
3,500
0
5,000
10,000
15,000
20,000
2 0 0 0
2 0 0 1
2 0 0 2
2 0 0 3
2 0 0 4
2 0 0 5
2 0 0 6
2 0 0 7
2 0 0 8
2 0 0 9
2 0 1 0
2 0 1 1
MW Million kWh
Generation
Capacity
U.S. Geothermal
ElectricityGeneration
(Million kWh)
U.S. GeothermalElectricity Capacityand % Increase rom
Previous Year
Total (MW) % Incre
2000 14,093 2,798 2.2%
2001 13,741 2,798 0.0%
2002 14,491 2,798 0.0%
2003 14,424 2,798 0.0%
2004 14,811 2,798 0.0%
2005 14,692 2,828 1.1%
2006 14,568 2,831 0.1%
2007 14,637 2,937 3.7%
2008 14,840 3,040 3.5%
2009 15,009 3,086 1.5%
2010 15,219 3,101 0.5%
2011 16,700 3,187 2.8%
Global Geothermal Electricity Capacity (2011) – Select Countries
Iceland: 670 MW

7/28/2019 Renewable Energy Data Book
http://slidepdf.com/reader/full/renewable-energy-data-book 71/128
Geothermal | Revised February71Source: GEA, Bloomberg New Energy Finance
0
500
1,000
1,500
2,000
2,500
3,000
3,500
M W
E l S a l v
a d o r
C o s t a R i c a
I c e l a n d
N e w
Z e a l a n d
J a p
a n
I n d o n e
s i a I t a l y
M e x i c o
P h i l i p
p i n e
s
U n i t e
d S t a t e
s
Japan: 546 MW
Philippines: 1,999 MW
El Salvador: 248 MW
United States: 3,187 MW
Mexico: 958 MW
Costa Rica: 205 MW
New Zealand: 714 MW
Indonesia: 1,002 MW
Italy: 865 MW
Cumulative State Geothermal Electricity Development (2011)
7/28/2019 Renewable Energy Data Book
http://slidepdf.com/reader/full/renewable-energy-data-book 72/128
Geothermal | Revised February
VI
72Source: GEA
Total Installed Capacity
(2011, MW)
Caliornia . . . . . . . . . 2,615.4
Nevada . . . . . . . . . . . . 469.0
Hawaii. . . . . . . . . . . . . . 43.0
Utah . . . . . . . . . . . . . . . . 42.0
Idaho . . . . . . . . . . . . . . . 15.8
Alaska. . . . . . . . . . . . . . 0.7
Oregon . . . . . . . . . . . . 0.3
Wyoming . . . . . . . . . 0.3
7/28/2019 Renewable Energy Data Book
http://slidepdf.com/reader/full/renewable-energy-data-book 73/128
Geothermal | Revised February73

7/28/2019 Renewable Energy Data Book
http://slidepdf.com/reader/full/renewable-energy-data-book 74/128
Biopower | Revised February
VII
74
VII. Biopower
Biopower: Summary

7/28/2019 Renewable Energy Data Book
http://slidepdf.com/reader/full/renewable-energy-data-book 75/128
Biopower | Revised February75
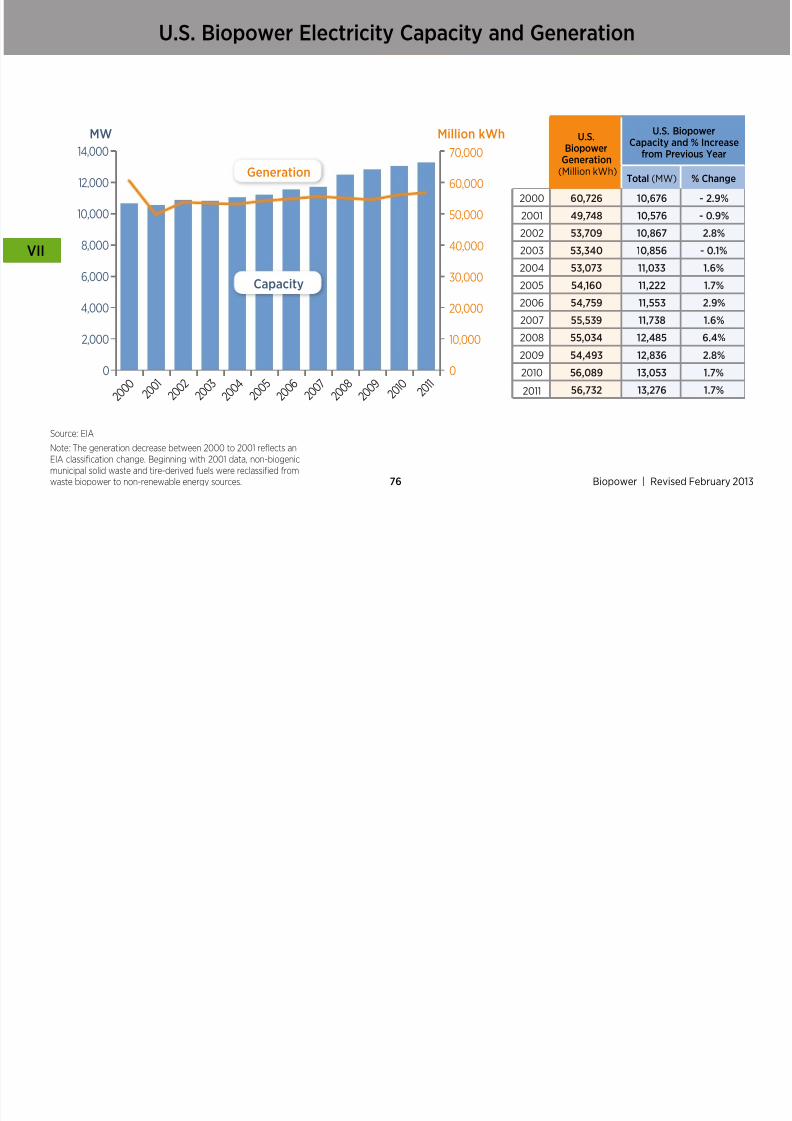
• Biopower electricity generation currently accounts or 11% o all renewableenergy generated in the United States.
• Biomass electricity primarily comes rom wood and agricultural residues
that are burned as a uel or cogeneration in the industrial sector (such as
in the pulp and paper industry).
• U.S. installed biopower capacity has grown recently, with a Compound
Annual Growth Rate (CAGR) o 2.0% rom 2006–2011.
U.S. Biopower Electricity Capacity and Generation

7/28/2019 Renewable Energy Data Book
http://slidepdf.com/reader/full/renewable-energy-data-book 76/128
Biopower | Revised February
VII
76
Source: EIA
Note: The generation decrease between 2000 to 2001 reects anEIA classifcation change. Beginning with 2001 data, non-biogenicmunicipal solid waste and tire-derived uels were reclassifed romwaste biopower to non-renewable energy sources.
U.S.
Biopower
Generation(Million kWh)
U.S. BiopowerCapacity and % Increa
rom Previous Year
Total (MW) % Chang
2000 60,726 10,676 - 2.9%
2001 49,748 10,576 - 0.9%
2002 53,709 10,867 2.8%
2003 53,340 10,856 - 0.1%
2004 53,073 11,033 1.6%
2005 54,160 11,222 1.7%
2006 54,759 11,553 2.9%
2007 55,539 11,738 1.6%
2008 55,034 12,485 6.4%
2009 54,493 12,836 2.8%
2010 56,089 13,053 1.7%
2011 56,732 13,276 1.7%
MW
2 0 0 0
2 0 0 1
2 0 0 2
2 0 0 3
2 0 0 4
2 0 0 5
2 0 0 6
2 0 0 7
2 0 0 8
2 0 0 9
2 0 1 0
2 0 1 1
Million kWh
0
2,000
4,000
6,000
8,000
10,000
12,000
14,000
0
10,000
20,000
30,000
40,000
50,000
60,000
70,000
Generation
Capacity
States Leading Biopower Electricity Development (2011)

7/28/2019 Renewable Energy Data Book
http://slidepdf.com/reader/full/renewable-energy-data-book 77/128
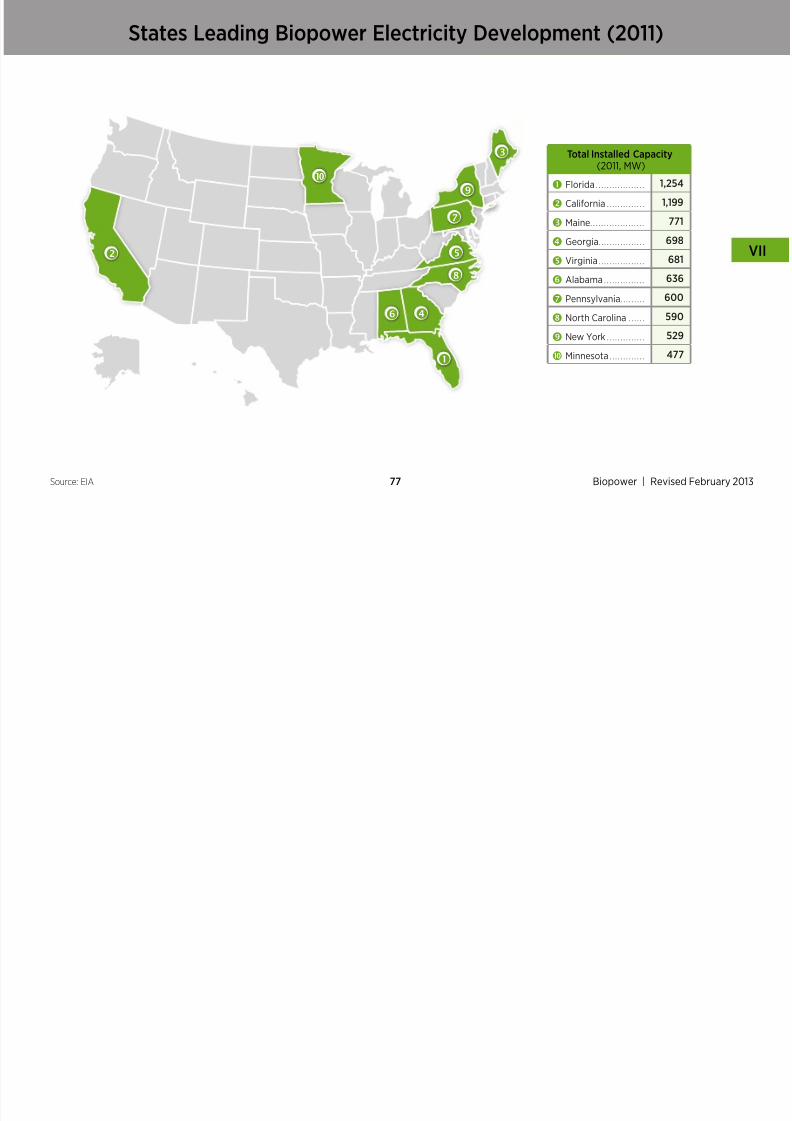
Biopower | Revised February77Source: EIA
Total Installed Capacity
(2011, MW)
Florida . . . . . . . . . . . . . . . . . . 1,254
Caliornia . . . . . . . . . . . . . . 1,199
Maine. . . . . . . . . . . . . . . . . . . . 771
Georgia. . . . . . . . . . . . . . . . . 698
Virginia . . . . . . . . . . . . . . . . . 681
Alabama . . . . . . . . . . . . . . . 636
Pennsylvania. . . . . . . . . 600 North Carolina . . . . . . 590
New York . . . . . . . . . . . . . . 529
Minnesota . . . . . . . . . . . . . 477
Million kWh
U.S. Biopower Electricity Generation Sources (2000–2011)
7/28/2019 Renewable Energy Data Book
http://slidepdf.com/reader/full/renewable-energy-data-book 78/128
Biopower | Revised February
VII
78
Source: EIA
*Note: LFG stands or Landfll Gas and MSW stands or Municipal Solid Waste
**Note: The generation decrease between 2000 to 2001 reects an EIAclassifcation change. Beginning with 2001 data, non-biogenic municipalsolid waste and tire-derived uels were reclassifed rom waste biopowerto non-renewable energy sources.
Million kWh
0
10,000
20,000
30,000
40,000
50,000
60,000
70,000
Other Biomass
LFG/MSW*
Wood & Derived Fuels
2 0 0 0
2 0 0 1
2 0 0 2
2 0 0 3
2 0 0 4
2 0 0 5
2 0 0 6
2 0 0 7
2 0 0 8
2 0 0 9
2 0 1 0
2 0 1 1
LFG/ MSW
OtherBiomass
Wood and
DerivedFuel
TOTA
2000 20,305 2,826 37,595 60,72
2001 12,714** 1,834 35,200 49,74
2002 13,398 1,646 38,665 53,70
2003 13,383 2,428 37,529 53,34
2004 13,281 2,216 37,576 53,07
2005 13,470 2,009 38,681 54,16
2006 14,106 2,004 38,649 54,75
2007 14,462 2,063 39,014 55,53
2008 15,520 2,214 37,300 55,03
2009 16,140 2,303 36,050 54,49
2010 16,555 2,362 37,172 56,08
2011 17,316 2,470 36,946 56,73
7/28/2019 Renewable Energy Data Book
http://slidepdf.com/reader/full/renewable-energy-data-book 79/128
Biopower | Revised February79

7/28/2019 Renewable Energy Data Book
http://slidepdf.com/reader/full/renewable-energy-data-book 80/128
Hydropower | Revised February
VIII
80
VIII. Hydropower
Hydropower: Summary
7/28/2019 Renewable Energy Data Book
http://slidepdf.com/reader/full/renewable-energy-data-book 81/128
Hydropower | Revised February81
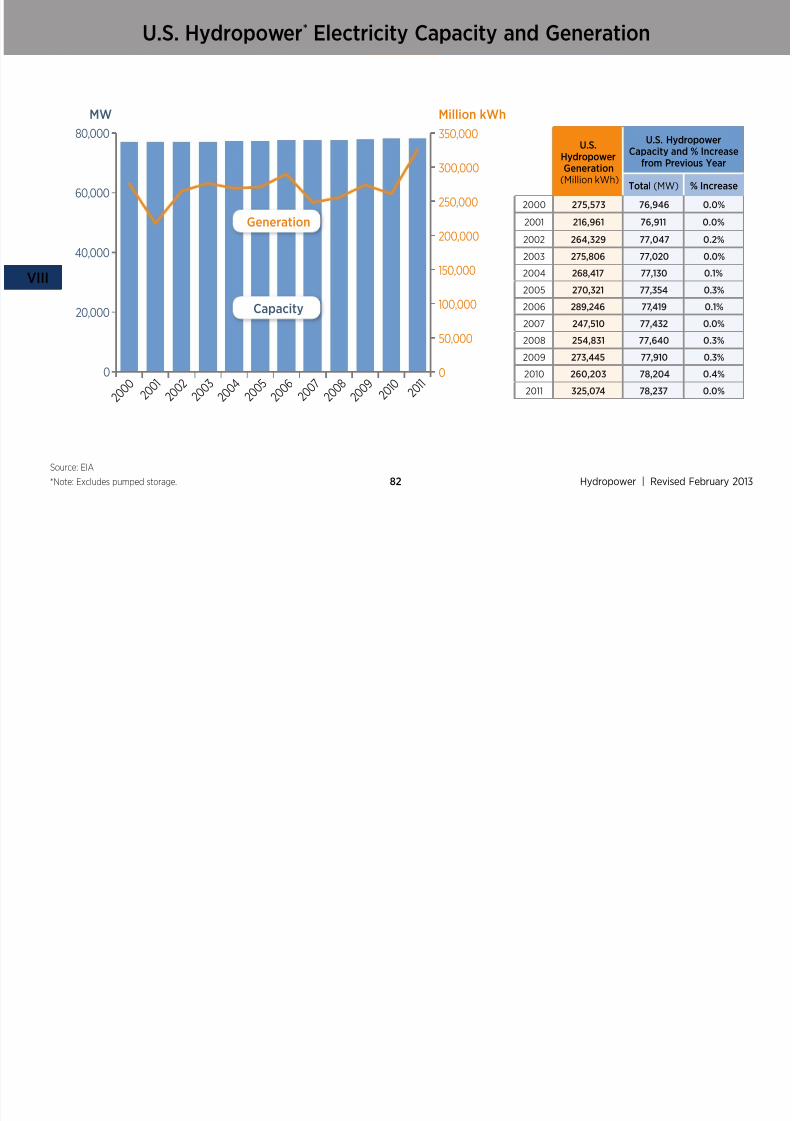
• Hydropower capacity has remained essentially constant between 2000–2011, with
generation uctuation depending on water supply.
• Hydropower remains the largest source o renewable electricity generation, primarily
large-scale hydropower, which accounts or 7.9% o U.S. electricity generation.
U.S. Hydropower* Electricity Capacity and Generation

7/28/2019 Renewable Energy Data Book
http://slidepdf.com/reader/full/renewable-energy-data-book 82/128
Hydropower | Revised February
VIII
82
Source: EIA
*Note: Excludes pumped storage.
0
20,000
40,000
60,000
80,000
0
50,000
100,000
150,000
200,000
250,000
350,000
300,000
2 0 0 0
2 0 0 1
2 0 0 2
2 0 0 3
2 0 0 4
2 0 0 5
2 0 0 6
2 0 0 7
2 0 0 8
2 0 0 9
2 0 1 0
2 0 1 1
MW Million kWh
Generation
Capacity
U.S.
Hydropower
Generation(Million kWh)
U.S. HydropowerCapacity and % Increa
rom Previous Year
Total (MW) % Increa
2000 275,573 76,946 0.0%
2001 216,961 76,911 0.0%
2002 264,329 77,047 0.2%
2003 275,806 77,020 0.0%
2004 268,417 77,130 0.1%
2005 270,321 77,354 0.3%
2006 289,246 77,419 0.1%
2007 247,510 77,432 0.0%
2008 254,831 77,640 0.3%
2009 273,445 77,910 0.3%
2010 260,203 78,204 0.4%
2011 325,074 78,237 0.0%
States Leading Hydropower Electricity Development (2011)
7/28/2019 Renewable Energy Data Book
http://slidepdf.com/reader/full/renewable-energy-data-book 83/128
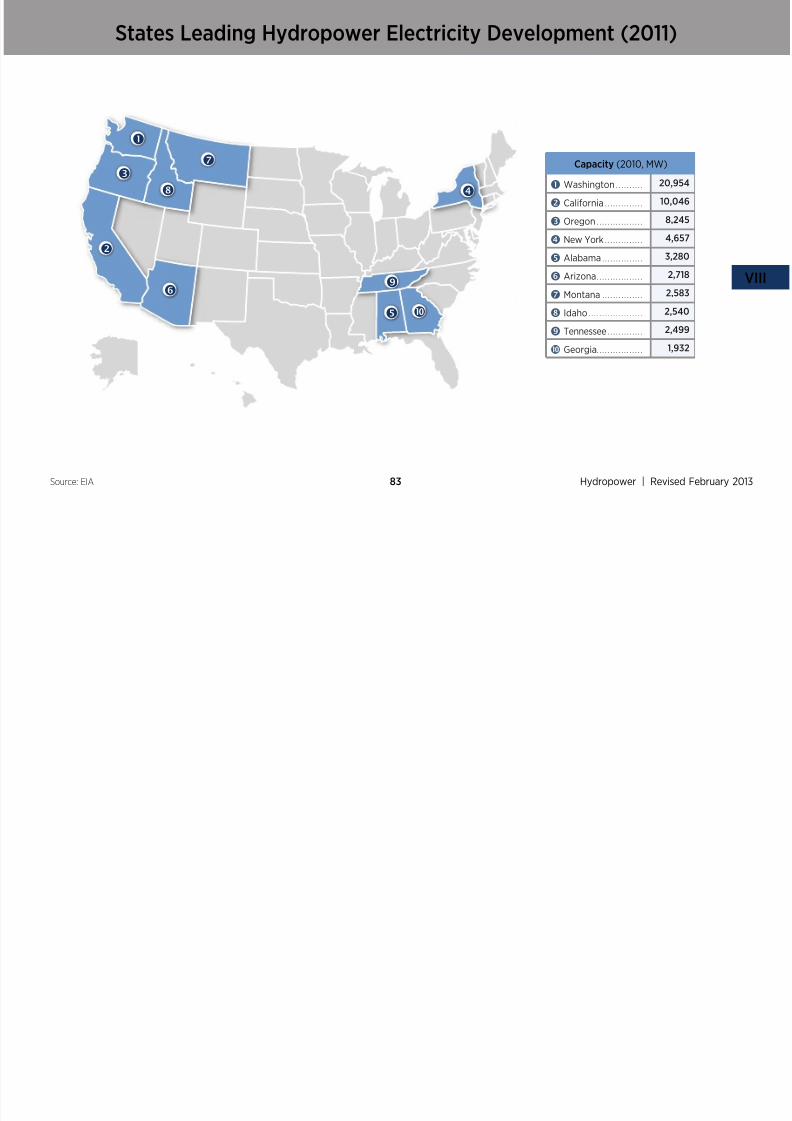
Hydropower | Revised February83Source: EIA
Capacity (2010, MW)
Washington . . . . . . . . . . 20,954
Caliornia . . . . . . . . . . . . . . 10,046
Oregon . . . . . . . . . . . . . . . . . 8,245
New York . . . . . . . . . . . . . . 4,657
Alabama . . . . . . . . . . . . . . . 3,280
Arizona . . . . . . . . . . . . . . . . . 2,718
Montana . . . . . . . . . . . . . . . 2,583
Idaho . . . . . . . . . . . . . . . . . . . . 2,540
Tennessee . . . . . . . . . . . . . 2,499
Georgia. . . . . . . . . . . . . . . . . 1,932

7/28/2019 Renewable Energy Data Book
http://slidepdf.com/reader/full/renewable-energy-data-book 84/128
Advanced Water Power | Revised February
IX
84
IX. Advanced Water Power
Advanced Water Power: Summary
• U.S. interest in advanced water power—such as tidal, river, ocean current, and ocean wave

7/28/2019 Renewable Energy Data Book
http://slidepdf.com/reader/full/renewable-energy-data-book 85/128
Advanced Water Power | Revised February85
energy—has been steadily growing over the past ew years, with many prototype projects in
testing stages and permits being fled at the Federal Energy Regulatory Commission (FERC).
• No commercial wave or tidal plants came online in 2011, although two tidal power projects
received licenses rom FERC in early 2012: one being developed by Ocean Renewable Power
Company in Cobscook Bay Maine, and one by Verdant Power in the East River o New York Ci
• More inormation may be ound at these websites:
– Federal Energy Regulatory Commission (FERC): www.erc.gov/industries/
hydropower/gen-ino/licensing/hydrokinetics.asp
– The Water Power Program at the U.S. Department o Energy: www1.eere.energy.gov/water
– The Ocean Energy Systems Implementing Agreement, established by the International
Energy Agency: www.ocean-energy-systems.org
EMEC Wave andTid l T Si
Morild II
Worldwide Advanced Water Power:Sample o Commercial and Pilot Plants

7/28/2019 Renewable Energy Data Book
http://slidepdf.com/reader/full/renewable-energy-data-book 86/128
Advanced Water Power | Revised February
IX
86
AN-400
Hydro-GenWaveHub Wave Test Site
Kobold II
= Tidal
= Other projects in Phase 3 (open water
testing) and Phase 4 (Full-Scale)
= Wave
PowerBuoyTREK Seagen
Mutriku
FORCE Tidal Test Site
TidGen Power System
Roosevelt Island Tidal Energy (RITE)European PicoPilot Plant
Tidal Test Site
Galway Bay andAtlantic MarineEnergy Test Sites
Wavestar
Morild II
1413
1212
16 15
11
Note: Inormation pertaining to additional projects can be ound on theEERE's Marine and Hydrokinetic Technology Database, accessible online at:http://www1.eere.energy.gov/windandhydro/hydrokinetic/deault.aspx
Sources: Ocean Energy Systems
Worldwide Advanced Water Power:Sample o Commercial and Pilot Plants
PROJECT NAME Type Country Location Size (MW) Installed

7/28/2019 Renewable Energy Data Book
http://slidepdf.com/reader/full/renewable-energy-data-book 87/128
Advanced Water Power | Revised February87
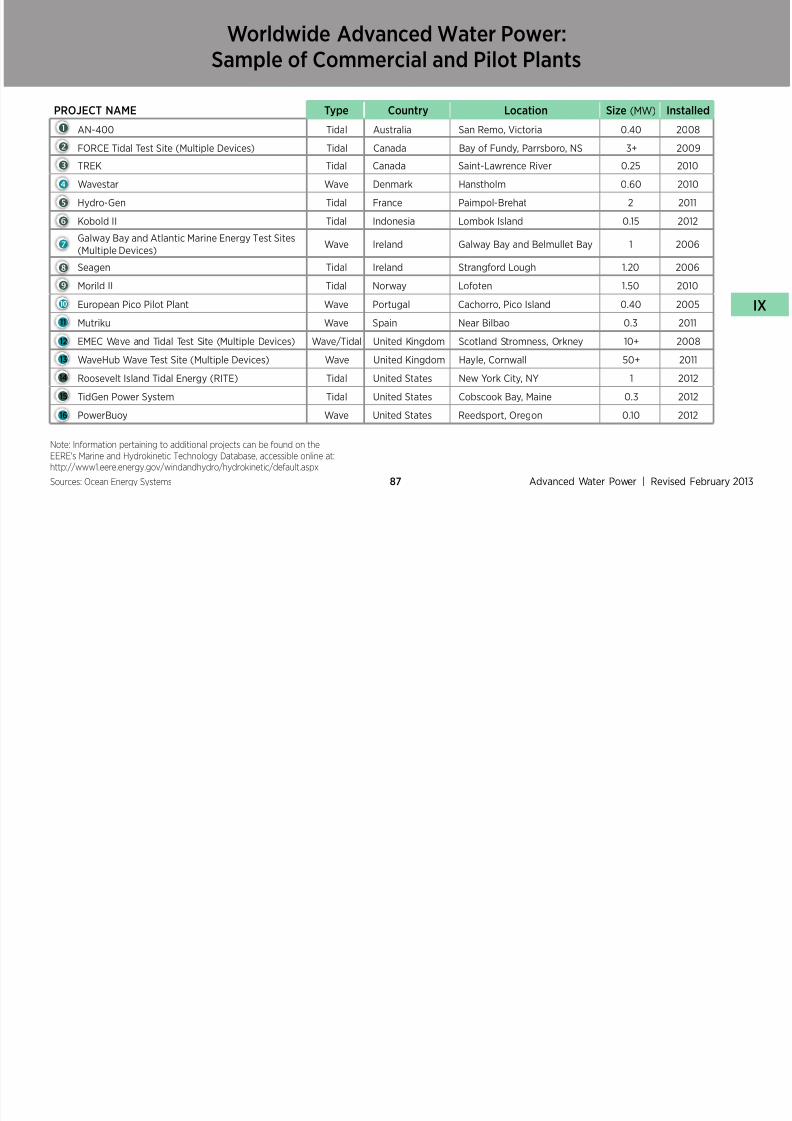
PROJECT NAME Type Country Location Size (MW) Installed
AN-400 Tidal Australia San Remo, Victoria 0.40 2008
FORCE Tidal Test Site (Multiple Devices) Tidal Canada Bay o Fundy, Parrsboro, NS 3+ 2009
TREK Tidal Canada Saint-Lawrence River 0.25 2010
Wavestar Wave Denmark Hanstholm 0.60 2010
Hydro-Gen Tidal France Paimpol-Brehat 2 2011
Kobold II Tidal Indonesia Lombok Island 0.15 2012
Galway Bay and Atlantic Marine Energy Test Sites
(Multiple Devices)Wave Ireland Galway Bay and Belmullet Bay 1 2006
Seagen Tidal Ireland Strangord Lough 1.20 2006
Morild II Tidal Norway Looten 1.50 2010
European Pico Pilot Plant Wave Portugal Cachorro, Pico Island 0.40 2005
Mutriku Wave Spain Near Bilbao 0.3 2011
EMEC Wave and Tidal Test Site (Multiple Devices) Wave/Tidal United Kingdom Scotland Stromness, Orkney 10+ 2008
WaveHub Wave Test Site (Multiple Devices) Wave United Kingdom Hayle, Cornwall 50+ 2011
Roosevelt Island Tidal Energy (RITE) Tidal United States New York City, NY 1 2012
TidGen Power System Tidal United States Cobscook Bay, Maine 0.3 2012
PowerBuoy Wave United States Reedsport, Oregon 0.10 2012
141312
16
15
11
Note: Inormation pertaining to additional projects can be ound on theEERE's Marine and Hydrokinetic Technology Database, accessible online at:http://www1.eere.energy.gov/windandhydro/hydrokinetic/deault.aspx
Sources: Ocean Energy Systems

7/28/2019 Renewable Energy Data Book
http://slidepdf.com/reader/full/renewable-energy-data-book 88/128
Hydrogen | Revised February
X
88
X. Hydrogen
Hydrogen: Summary

7/28/2019 Renewable Energy Data Book
http://slidepdf.com/reader/full/renewable-energy-data-book 89/128
Hydrogen | Revised February89
• As o October 2012, there were approximately 58 hydrogen ueling stations
in the United States.
• There are more than 1,000 stationary uel cell installations worldwide, 35 o
which are greater than 1 MW in capacity.
Hydrogen – Transportation
Number o Operational U.S. Hydrogen Fueling Stations
(October 2012 – Total o 58)

7/28/2019 Renewable Energy Data Book
http://slidepdf.com/reader/full/renewable-energy-data-book 90/128
Hydrogen | Revised February90Sources: EERE, FuelCells.org
(October 2012 – Total o 58)
X
1
1
1
1
3
1
12
2
4
24 2
2
9 1
1
2
1
more less
Hydrogen – Electricity
Stationary Fuel Cell Installations (2011)
7/28/2019 Renewable Energy Data Book
http://slidepdf.com/reader/full/renewable-energy-data-book 91/128
Hydrogen | Revised February91Source: FuelCells.org
Number o installed stationaryuel cells >1 MW = 35
Located in the United States (14),
Canada (1), Germany (1), Italy (1),
Japan (2), South Korea (16)
585 Non-U.S.Installations
498 U.S.Installations
35 U.S.
Stationary Fuel Cell Installations (2011)
31 Non-U.S.
Planned Projects = 66
Worldwide Installations
= 1,083
7/28/2019 Renewable Energy Data Book
http://slidepdf.com/reader/full/renewable-energy-data-book 92/128
Renewable and Alternative Fuels | Revised February
XI
92
XI. Renewable and Alternative Fuels
Renewable and Alternative Fuels
• Corn ethanol production in contrast to Brazil's ethanol, which is produced rom

7/28/2019 Renewable Energy Data Book
http://slidepdf.com/reader/full/renewable-energy-data-book 93/128
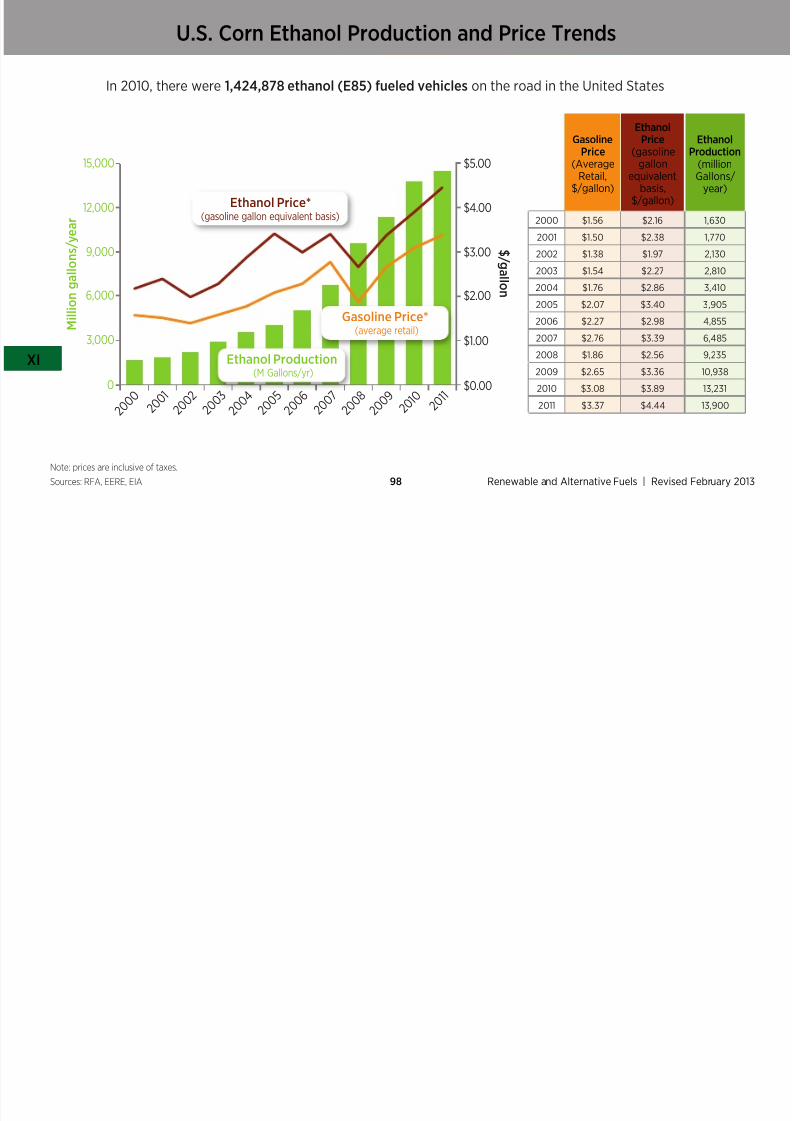
Renewable and Alternative Fuels | Revised February93
* Most U.S. ethanol is currently produced rom corn (in contrast to Brazil’s ethanolcoming rom sugar cane); but eorts are underway by the U.S. Department o Energy
and others to commercialize cellulosic ethanol, which is produced rom non-ood crops.Note: Ethanol is blended with gasoline and generally comprises up to 10% o theuel with gasoline as the other 90% (E10). Additionally, ex-uel vehicles can usea blend o 85% ethanol and 15% gasoline (E85).
p , p
sugar cane, continues to expand rapidly in the United States. Between 2000 and
2011, production increased more than 8 times.
• U.S. ethanol production grew nearly 5% in 2011 over 2010 to reach almost 14,000
million gallons per year.
• In 2011, the United States* produced 62.2% o the world’s ethanol, ollowed by
Brazil at 24.9%, the European Union at 5.4%, China at 2.5%, and Canada at 2.1%.
• In 2011, the number o electric vehicle charging stations expanded by a actor o
9 to 6,033.
Renewable and Alternative Fueling Stations by State
B20
7/28/2019 Renewable Energy Data Book
http://slidepdf.com/reader/full/renewable-energy-data-book 94/128
Renewable and Alternative Fuels | Revised February
XI
94
Note: Data as o 1/31/2012. For the ull list o ueling station counts by state,please visit: http://www.adc.energy.gov/adc/uels/stations_counts.html
Sources: EERE, EIA
MD
DC
NC
DE
NJ
CT
RI
MASS
x4
B20
E85 (85% etha
Electric
Hydrogen
Propane
Number of
Stations
300
50
10
CNG (comprenatural gas)
LGN (liquefiednatural gas)
Renewable and Alternative Fueling Stations
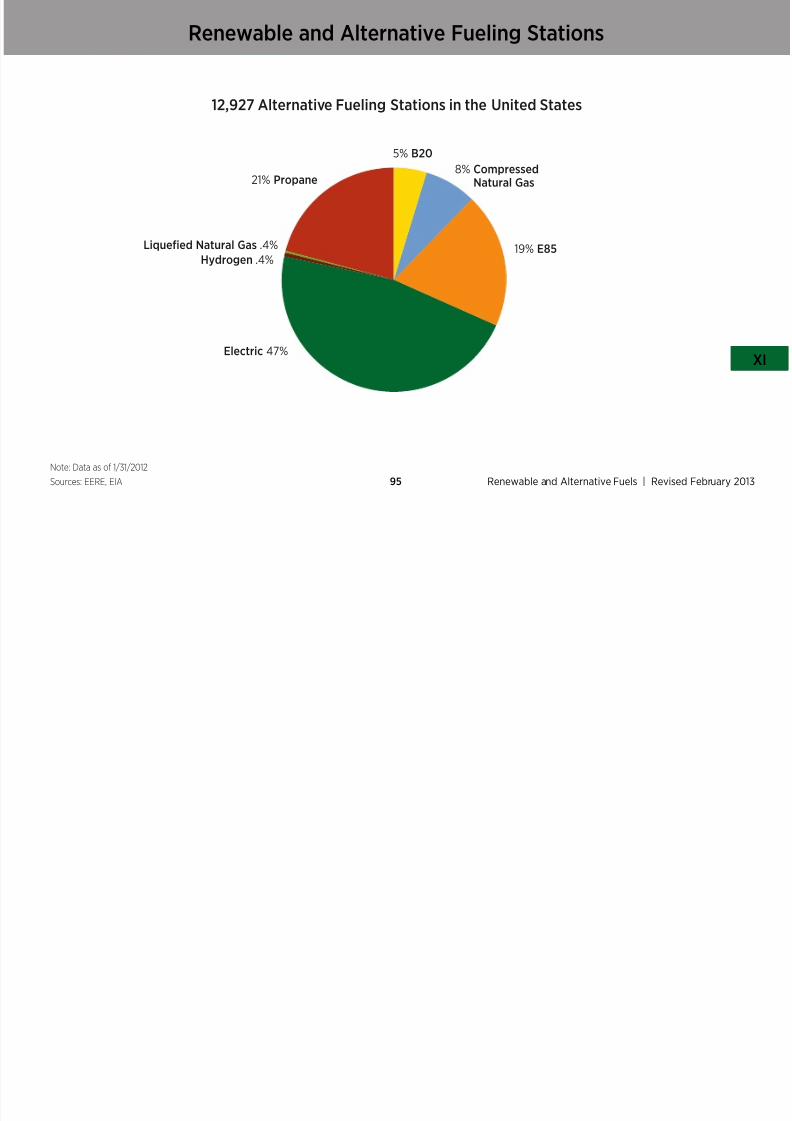
12,927 Alternative Fueling Stations in the United States

7/28/2019 Renewable Energy Data Book
http://slidepdf.com/reader/full/renewable-energy-data-book 95/128
Renewable and Alternative Fuels | Revised February95
Note: Data as o 1/31/2012
Sources: EERE, EIA
19% E85
Electric 47%
5% B20
8% CompressedNatural Gas
Hydrogen .4%
Liquefed Natural Gas .4%
21% Propane
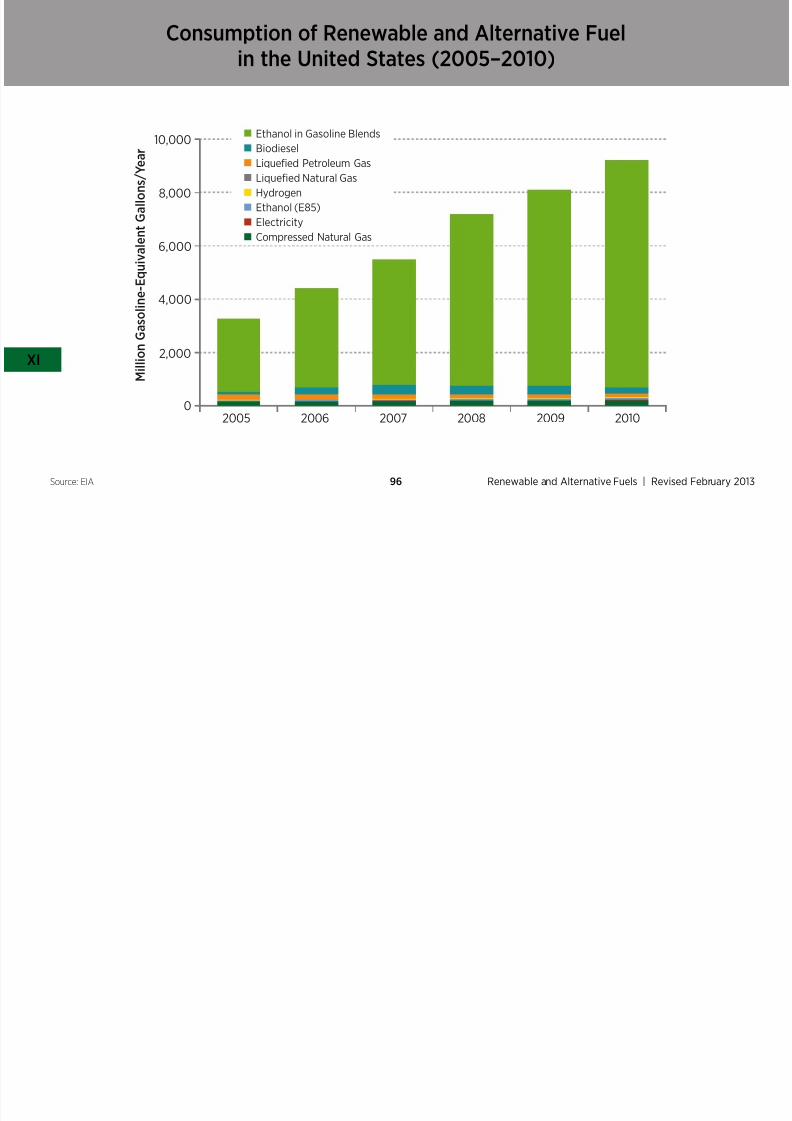
Consumption o Renewable and Alternative Fuelin the United States (2005–2010)

7/28/2019 Renewable Energy Data Book
http://slidepdf.com/reader/full/renewable-energy-data-book 96/128
Renewable and Alternative Fuels | Revised February
XI
96Source: EIA
M i l l i o n G a s o l i
n e - E q u i v a l e n t G a l l o n s / Y
e a r
2005 2006 2007 2008 201020090
2,000
4,000
6,000
8,000
10,000Ethanol in Gasoline Blends
Biodiesel
Liquefied Petroleum Gas
Liquefied Natural Gas
Hydrogen
Ethanol (E85)
Electricity
Compressed Natural Gas
Consumption o Traditional Fuel in the United States (2005–2010)
Diesel
Gasoline

7/28/2019 Renewable Energy Data Book
http://slidepdf.com/reader/full/renewable-energy-data-book 97/128
Renewable and Alternative Fuels | Revised February97
50,000
100,000
150,000
200,000
2009 20102008200720062005
Gasoline
Renewable and Alternative Fuels
0
M i
l l i o n G a l l o n s
Source: EIA
U.S. Corn Ethanol Production and Price Trends
In 2010, there were 1,424,878 ethanol (E85) ueled vehicles on the road in the United States
E h l

7/28/2019 Renewable Energy Data Book
http://slidepdf.com/reader/full/renewable-energy-data-book 98/128
Renewable and Alternative Fuels | Revised February
XI
98
Note: prices are inclusive o taxes.
Sources: RFA, EERE, EIA
0
3,000
6,000
9,000
12,000
15,000
$ / g a l l on
M i l l i o n g a l l o n s / y e a r
$0.00
$1.00
$2.00
$3.00
$4.00
$5.00
Ethanol Price*
(gasoline gallon equivalent basis)
Ethanol Production
(M Gallons/yr)
Gasoline Price*
(average retail)
2 0 0 1
2 0 0 0
2 0 0 2
2 0 0 3
2 0 0 4
2 0 0 5
2 0 0 6
2 0 0 7
2 0 0 8
2 0 0 9
2 0 1 0
2 0 1 1
GasolinePrice
(AverageRetail,
$/gallon)
EthanolPrice
(gasolinegallon
equivalentbasis,
$/gallon)
EthanoProduct
(millioGallon
year)
2000 $1.56 $2.16 1,630
2001 $1.50 $2.38 1,770
2002 $1.38 $1.97 2,130
2003 $1.54 $2.27 2,810
2004 $1.76 $2.86 3,410
2005 $2.07 $3.40 3,9052006 $2.27 $2.98 4,855
2007 $2.76 $3.39 6,485
2008 $1.86 $2.56 9,235
2009 $2.65 $3.36 10,938
2010 $3.08 $3.89 13,231
2011 $3.37 $4.44 13,900
U.S. Corn Ethanol Production Capacity

7/28/2019 Renewable Energy Data Book
http://slidepdf.com/reader/full/renewable-energy-data-book 99/128
Renewable and Alternative Fuels | Revised February99
Note: No sugarcane ethanol is currently produced in the United States.
Source: RFA
Top Five States orU.S. Ethanol (operating)
Production Capacity in 2011(millions o gallons/year)
Iowa. . . . . . . . . . . . . . . . . . . . . . . 3,625
Nebraska. . . . . . . . . . . . . . . . 1,973
Illinois . . . . . . . . . . . . . . . . . . . . 1,486
Minnesota . . . . . . . . . . . . . . 1,129
South Dakota . . . . . . . . . 1,009
U.S. Corn Ethanol Production Capacity
Total U.S. Ethanol Operating Production Capacity (2011):
14 114 million gallons/year

7/28/2019 Renewable Energy Data Book
http://slidepdf.com/reader/full/renewable-energy-data-book 100/128
Renewable and Alternative Fuels | Revised February
XI
100Source: RFA
14,114 million gallons/year
Top Five Ethanol Companies
—Production Capacity 2011
(millions o gallons/year)
Archer Daniels Midland Co. . . . . . . . . . . . . . . 1,750
Poet Biorening . . . . . . . . . . . . . . . . . . . . . . . . . . . . . . . 1,629
Valero Renewable Fuels. . . . . . . . . . . . . . . . . . . . 1,130
Green Plains Renewable Energy. . . . . . . . 730
Flint Hills Resources . . . . . . . . . . . . . . . . . . . . . . . . . 435
Global Ethanol* Production
Top Five Countries (2011) Ethanol Production (millions o gallons/year)
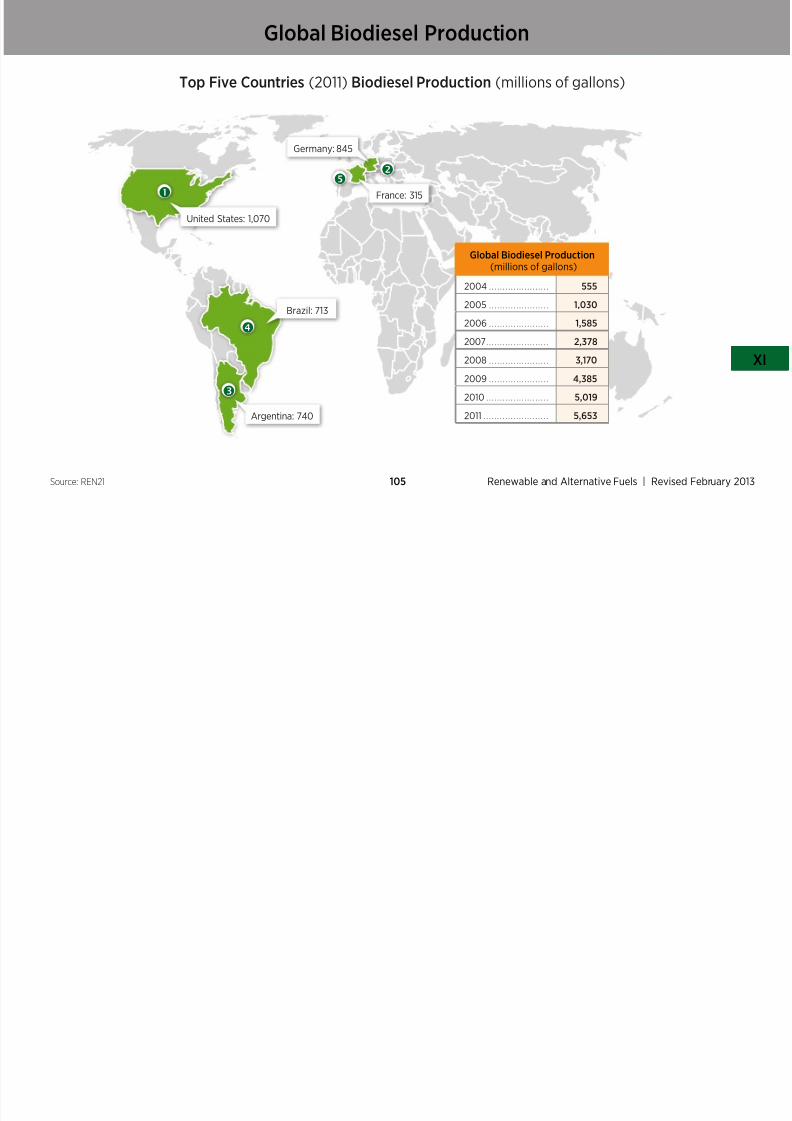
7/28/2019 Renewable Energy Data Book
http://slidepdf.com/reader/full/renewable-energy-data-book 101/128
Renewable and Alternative Fuels | Revised February101* Various eedstocksSource: RFA
United States: 13,900
Brazil: 5,573
European Union 1,199
China: 555
Global Ethanol
Production (millions o gallons/year)
2004 . . . . . . . . . . . . . . 10,770
2005 . . . . . . . . . . . . . . 12,150
2006 . . . . . . . . . . . . . . 13,489
2007. . . . . . . . . . . . . . . 13,102
2008 . . . . . . . . . . . . . . 17,335
2009 . . . . . . . . . . . . . . 19,535
2010 . . . . . . . . . . . . . . . 23,013
2011 . . . . . . . . . . . . . . . . 22,356
Canada: 462
Renewable and Alternative Fuels – Biodiesel: Summary
• Biodiesel has expanded rom a relatively small production base in 2000, to a total
7/28/2019 Renewable Energy Data Book
http://slidepdf.com/reader/full/renewable-energy-data-book 102/128
Renewable and Alternative Fuels | Revised February
XI
102
Biodiesel has expanded rom a relatively small production base in 2000, to a total
United States production o 1 billion gallons in 2011. However, biodiesel is still a
small percentage o the alternative uel pool in the U.S., as 13 times more ethanolwas produced in 2011.
• Biodiesel production in the United States in 2011 is 214 times what it was in 2001.
• The United States leads the world in biodiesel production, ollowed by Germany,Argentina, Brazil, and France.
• Worldwide, biodiesel production globally grew more than 12% rom 2010 to 2011.
U.S. Biodiesel Production and Price (2000–2011)
1 100 $500

7/28/2019 Renewable Energy Data Book
http://slidepdf.com/reader/full/renewable-energy-data-book 103/128
Renewable and Alternative Fuels | Revised February103Sources: Biodiesel.org, EERE
2 0 0 1
2 0 0 2
2 0 0 3
2 0 0 4
2 0 0 5
2 0 0 6
2 0 0 7
2 0 0 8
2 0 0 9
2 0 1 0
2 0 1 1
M i l l i o n G a l l o n s
$ / G a l l on
0
100
200
300
400
500
600
700
800
900
1,000
1,100
$0.00
$1.00
$2.00
$3.00
$4.00
$5.00
Production
Price
Biodiesel Price(gasoline gallon
equivalent basis)($ per gallon)
Total U.S.Production
(milliongallons)
2001 1.80 5
2002 1.70 15
2003 1.80 20
2004 2.20 25
2005 3.40 75
2006 3.30 250
2007 3.40 450
2008 2.68 700
2009 3.28 545
2010 3.59 315
2011 3.88 1,070
U.S. Biodiesel Production Capacity
Total U.S. Biodiesel Production Capacity (2011): 1,404 million gallons/year

7/28/2019 Renewable Energy Data Book
http://slidepdf.com/reader/full/renewable-energy-data-book 104/128
Renewable and Alternative Fuels | Revised February
XI
104Sources: Biodiesel.org, REG, Renewable Biouels Inc,Imperium Renewables, Green Earth Fuels LLC, ADM
Top Five Biodiesel Companies— Production Capacity 2011
(millions o gallons/year)
Renewable Energy Group, Inc . . . . . . . . . . . . . . . . 212
Renewable Biouels, Inc. . . . . . . . . . . . . . . . . . . . . . . . . 180
Imperium Renewables, Inc . . . . . . . . . . . . . . . . . . . . 100
Green Earth Fuels, LLC . . . . . . . . . . . . . . . . . . . . . . . . . 90
Archer Daniels Midland Company . . . . . . . . . 85
Top Five Countries (2011) Biodiesel Production (millions o gallons)
Global Biodiesel Production

7/28/2019 Renewable Energy Data Book
http://slidepdf.com/reader/full/renewable-energy-data-book 105/128
Renewable and Alternative Fuels | Revised February105Source: REN21
United States: 1,070
Germany: 845
Brazil: 713
Argentina: 740
France: 315
Global Biodiesel Production
(millions o gallons)
2004 . . . . . . . . . . . . . . . . . . . . . . 555
2005 . . . . . . . . . . . . . . . . . . . . . . 1,030
2006 . . . . . . . . . . . . . . . . . . . . . . 1,585
2007. . . . . . . . . . . . . . . . . . . . . . . 2,378
2008 . . . . . . . . . . . . . . . . . . . . . . 3,170
2009 . . . . . . . . . . . . . . . . . . . . . . 4,385
2010 . . . . . . . . . . . . . . . . . . . . . . . 5,019
2011 . . . . . . . . . . . . . . . . . . . . . . . . 5,653

7/28/2019 Renewable Energy Data Book
http://slidepdf.com/reader/full/renewable-energy-data-book 106/128
Clean Energy Investments | Revised February
XII
106
XII. Clean Energy Investments
Clean Energy Investments: Summary
• U.S. investment in renewable energy has grown dramatically in the past decade,
and in 2011 annual investment reached more than $35 billion

7/28/2019 Renewable Energy Data Book
http://slidepdf.com/reader/full/renewable-energy-data-book 107/128
Clean Energy Investments | Revised February107
and in 2011 annual investment reached more than $35 billion.
• U.S. investment in wind energy projects grew rom $378 million in 2001 to more
than $5 billion in 2011.
• In 2011, U.S. venture capital and private equity investment in renewable energy
technology companies was nearly $7 billion—up rom $253 million in 2001.
• U.S. venture capital and private equity investment in solar technology companies
has increased rom $50 million in 2001 to more than $1.7 billion in 2011 .
*All fgures in 2011 real dollars.
U.S. and Global Total Investment in Renewable Energy (2011)
Global Total InvestmentU.S. Total Investment
150,00040,000

7/28/2019 Renewable Energy Data Book
http://slidepdf.com/reader/full/renewable-energy-data-book 108/128
Clean Energy Investments | Revised February
XII
108
Source: Bloomberg New Energy Finance
Completed and disclosed deals only. Does not adjust or undisclosed transactions.
Includes VC/PE, public market activity, and asset fnancing.
Biopower
Marine
Carbon Capture & Storage
Digital Energy
Advanced Transportation
Fuel Cells/Hydrogen
Energy Storage
Eciency
Geothermal
Wind
SolarBiofuels
$ i n M i l l i o n s
0
30,000
60,000
90,000
120,000
$ i n M i l l i o n s
0
5,000
10,000
15,000
20,000
25,000
30,000
35,000
,
$136,094$35,464
U.S. Wind Energy Project Asset Financing Transactions (2001–2011)
$11,686
$12,595
12,000
13,000

7/28/2019 Renewable Energy Data Book
http://slidepdf.com/reader/full/renewable-energy-data-book 109/128
Clean Energy Investments | Revised February109
*All fgures in 2011 real dollars.
Figures represent disclosed deals derived romBloomberg New Energy Finance’s Desktop database.
2001 2002 2003 2004 2005 2006 2007 2008 2009 2010 2011
$ i n M i l l i o n s
$378 $287
$2,081
$682
$4,696
$8,349
$9,566 $9,636
$5,304
0
1,000
2,000
3,000
4,000
5,000
6,000
7,000
8,000
9,000
10,000
11,000
U.S. Venture Capital and Private Equity Investment inSolar Energy Technology Companies (2001–2011)
$2,8783,000
7/28/2019 Renewable Energy Data Book
http://slidepdf.com/reader/full/renewable-energy-data-book 110/128
Clean Energy Investments | Revised February
XII
110
*All fgures in 2011 real dollars.
Figures represent disclosed deals derived romBloomberg New Energy Finance’s Desktop database.
$50 $50 $68 $72
$243
$446
$1,039
$1,801 $1,748
$2,134
2001 2002 2003 2004 2005 2006 2007 2008 2009 2010 2011
0
500
1,000
1,500
2,000
2,500
$ i n M i l l i o n s
U.S. Venture Capital and Private Equity Investment inBiouels Technology Companies (2001–2011)
$1,9792,000

7/28/2019 Renewable Energy Data Book
http://slidepdf.com/reader/full/renewable-energy-data-book 111/128
Clean Energy Investments | Revised February111
*All fgures in 2011 real dollars.
Figures represent disclosed deals derived romBloomberg New Energy Finance’s Desktop database.
$31 $29 $47
$252
$482
$1,231
2001 2002 2003 2004 2005 2006 2007 2008 2009 2010 2011
$ i n M i l l i o n s
0
200
400
600
800
1,000
1,200
1,400
1,600
1,800
$691$698
$1,016
$90
U.S. Venture Capital and Private Equity Investment inRenewable Energy Technology Companies (2001–2011)
$6,929$6,8917,000

7/28/2019 Renewable Energy Data Book
http://slidepdf.com/reader/full/renewable-energy-data-book 112/128
Clean Energy Investments | Revised February
XII
112
*All fgures in 2011 real dollars.
Figures represent disclosed deals derived romBloomberg New Energy Finance’s Desktop database.
2001 2002 2003 2004 2005 2006 2007 2008 2009 2010 2011
$ i n M i l l i o n s
Biopower
Energy Storage
Eciency
Marine
Fuel Cells/Hydrogen
Carbon Capture & Storage
Advanced Transportation
Digital Energy
Geothermal
Wind
Solar
Biofuels
$353 $383$695
$849
$2,546
$3,436
$3,927
$5,591$5,237
0
1,000
2,000
3,000
4,000
5,000
6,000
Public Renewable Energy Index Perormance (2011) (Indexed to 100)
(1%)
120

7/28/2019 Renewable Energy Data Book
http://slidepdf.com/reader/full/renewable-energy-data-book 113/128
Clean Energy Investments | Revised February113
Public data
Index perormance is calculated as a percentage o the und or index price as oJanuary 2, 2011. The our indices and unds shown above experienced declines inprice while the S&P 500 remained relatively stable in 2011.
Jan
2011
Mar
2011
Feb
2011
May
2011
April
2011
July
2011
June
2011
Sept
2011
Aug
2011
Nov
2011
Oct
2011
Dec
2011
(41%)
(43%)
(8%)
(1%)
(34%)
WilderHill New Energy Global Index (DJIA: ^NEX)
New Alternatives Fund (NALFX)
Calvert Global Alternative Energy Fund (CGAEX)
Guinness Atkinson Alternative Energy Fund (GAAEX)
S&P 500
0
20
40
60
80
100
7/28/2019 Renewable Energy Data Book
http://slidepdf.com/reader/full/renewable-energy-data-book 114/128
Glossary
B2O
A uel containing a mixture o 20 percent
biodiesel and 80 percent petrodiesel.
Biomass
Organic non-ossil material o biological
origin.
Concentrated Solar Power (CSP)
A solar energy conversion system
characterized by the optical concentration o
solar rays through an arrangement o mirrors

7/28/2019 Renewable Energy Data Book
http://slidepdf.com/reader/full/renewable-energy-data-book 115/128
Glossary | Revised February115
Baseload Capacity
The generating equipment normallyoperated to serve loads on an around-
the-clock basis.
Biodiesel
Any liquid biouel suitable as a diesel
uel substitute or diesel uel additive or
extender. Biodiesel uels are typically made
rom oils such as soybeans, rapeseed, or
sunowers; or rom animal tallow. Biodiesel
can also be made rom hydrocarbonsderived rom agricultural products such as
rice hulls.
Biouels
Liquid uels and blending components
produced rom biomass (plant) eedstocks,
used primarily or transportation.
British Thermal Unit (Btu)
The quantity o heat required to increasethe temperature o 1 pound o liquid water
by 1 degree Fahrenheit at the temperature
at which water has its greatest density
(approximately 39 degrees Fahrenheit).
Capacity Factor
The ratio o the electrical energy produced
by a generating unit or a given period o
time to the electrical energy that could
have been produced at continuous ullpower operation during the same period.
Compound Annual Growth Rate
The year-over-year growth rate applied
during a multiple-year period. The ormula
or calculating CAGR is (Current Value/Base
Value)^(1/# o years) - 1.
y g g
to heat working uid to a high temperature.
Concentrated solar power (but not solar
thermal power) may also reer to a systemthat ocuses solar rays on a photovoltaic cell
to increase conversion eciency.
Digital Energy
The integration o digital communication
technologies into energy systems,
especially the electrical grid. Smart meters,
along with other digital communication
devices embedded in electrical transmission
and distribution systems, allow or a two-way ow o inormation between utilities
and their customers as well as greater
digital control o the electrical grid, a
concept known as the Smart Grid.
E85
A uel containing a mixture o 85 percent
ethanol and 15 percent gasoline.
Ethanol
A clear, colorless, ammable oxygenated
hydrocarbon. Ethanol is typically produced
chemically rom ethylene or biologically
Flexible-Fuel Vehicles
Vehicles that can operate on (1) alternative
uels (such as E85); (2) 100 percent
petroleum-based uels; (3) any mixture
Geothermal Energy
The heat that is extracted rom hot water
or steam that is mined rom geothermal
reservoirs in the earth’s crust Water or
Glossary
7/28/2019 Renewable Energy Data Book
http://slidepdf.com/reader/full/renewable-energy-data-book 116/128
Glossary | Revised February
XIII
116
chemically rom ethylene, or biologically
rom ermentation o various sugars rom
carbohydrates ound in agricultural crops
and cellulosic residues rom crops or wood.
It is used in the United States as a gasoline
octane enhancer and oxygenate (blended
up to 10 percent concentration). Ethanol
can also be used in high concentrations
(E85) in vehicles designed or its use.
Federal EnergyRegulatory Commission (FERC)
The ederal agency with jurisdiction overinterstate electricity sales, wholesale
electric rates, hydroelectric licensing,
some natural gas pricing, oil pipeline rates,
and gas pipeline certication. FERC is an
independent regulatory agency within the
Department o Energy (DOE) and is the
successor to the Federal Power Commission.
petroleum based uels; (3) any mixture
o an alternative uel (or uels) and a
petroleum-based uel. Flexible-uel
vehicles have a single uel system to handle
alternative and petroleum-based uels.
Fuel Cell
A device that produces electricity by
converting the chemical energy o a uel
(e.g., hydrogen) directly into electrical
energy. Fuel cells difer rom conventional
electrical cells in that the active materials
such as uel and oxygen are not contained
within the cell but are supplied rom
outside. It does not contain an intermediate
heat cycle, as do most other electrical
generation techniques.
Generation
The total amount o electric energy
produced by generating units and measured
at the generating terminal in kilowatt-hours
(kWh) or megawatt-hours (MWh).
reservoirs in the earth s crust. Water or
steam can be used as a working uid or
geothermal heat pumps, water heating, or
electricity generation, and then is injected
back into the earth.
Geothermal Heat Pump
A heat pump in which the rerigerant
exchanges heat (in a heat exchanger)
with a uid circulating through an earth
connection medium (ground or ground
water). The uid is contained in a variety
o loop (pipe) congurations depending
on the temperature o the ground and
the ground area available. Loops may be
installed horizontally or vertically in the
ground or submersed in a body o water.
Gigawatt (GW)
One billion watts or one thousand
megawatts or one million kW.
Gigawatt-hour (GWh)
One billion watt-hours.
Incremental Capacity
Landfll Gas
Gas that is generated by decomposition
o organic material at landll disposal
sites. The average composition o landll
Nameplate Capacity
The maximum rated output o a generator
under specic conditions designated by the
manuacturer. Nameplate capacity is usually
Glossary
7/28/2019 Renewable Energy Data Book
http://slidepdf.com/reader/full/renewable-energy-data-book 117/128
Glossary | Revised February117
Incremental Capacity
Capacity added on an annual basis.
Insolation
The amount o radiation rom the sun
received at the surace o the Earth in a
particular geographic location or region.
Kilowatt (kW)
One thousand watts.
Kilowatt-hour (kWh)
A measure o electrical energy dened
as a unit o work or energy, measured
as 1 kilowatt (1,000 watts) o power
expended or 1 hour. One kWh is equivalent
to 3,412 Btu.
g p
gas is approximately 50% methane and
50% carbon dioxide and water vapor by
volume. The methane in landll gas may be
vented, ared, or combusted to generate
electricity or useul thermal energy on-site,
or injected into a pipeline or combustion
of-site.
Megawatt (MW)
One million watts o electricity.
Megawatt-hour (MWh)One thousand kilowatt-hours or 1 million
watt-hours.
Municipal Solid Waste (MSW)
Residential solid waste and some
nonhazardous commercial, institutional,
and industrial wastes.
p p y y
indicated in units o kilovolt-amperes (kVA)
and in kilowatts (kW) on a nameplate
physically attached to the generator.
Ocean Energy
Energy conversion technologies that
harness the energy in tides, waves, and
thermal gradients in the oceans.
Photovoltaic (PV) Cell
PV cells convert incident light directly into
electricity (direct current). An electronic
device consisting o layers o semiconductor
materials abricated to orm a junction
(adjacent layers o materials with diferent
electronic characteristics) and electrical
contacts.
Pumped-StorageHydroelectric Plant
A plant that usually generates electric
energy during peak load periods by using
Solar Thermal Collector
A device designed to receive solar radiation
and convert it to thermal energy. Normally,
a solar thermal collector includes a rame,
Thermoelectric Power Plant
A term used to identiy a type o electric
generating station, capacity, capability, or
output in which the source o energy or
Glossary

7/28/2019 Renewable Energy Data Book
http://slidepdf.com/reader/full/renewable-energy-data-book 118/128
Glossary | Revised February
XIII
118
gy g p p y g
water previously pumped into an elevated
storage reservoir during of-peak periods
when excess generating capacity is
available to do so.
Renewable Energy Resources
Energy resources that are naturally
replenishing but ow-limited. They are
virtually inexhaustible in duration but
limited in the amount o energy that is
available per unit o time. Renewable
energy resources include: biomass, hydro,
geothermal, solar, wind, and ocean energy.
glazing, and an absorber, together with
appropriate insulation. The heat collected
by the solar collector may be used
immediately or stored or later use. Solar
collectors are used or space heating;
domestic hot water heating; and heating
swimming pools, hot tubs, or spas.
Solar Thermal Electric Generation(STEG)
Conversion o solar energy to electricity
using various technologies to heat a
working uid to power a turbine that drives
a generator. Examples o these systems
include central receiver systems, parabolic
dish, and solar trough.
p gy
the prime mover is heat.
Wind Energy
Kinetic energy present in wind motion that
can be converted to mechanical energy or
driving pumps, mills, and electric power
generators.
References
U.S. Energy Production and Consumption — Pages 7–9
• Energy Inormation Administration (EIA) – Monthly Energy Review
• Production: EIA – Monthly Energy Review, March 2012, Table 1.2, http://www.eia.gov/totalenergy/data/monthly/#summary

7/28/2019 Renewable Energy Data Book
http://slidepdf.com/reader/full/renewable-energy-data-book 119/128
References | Revised February119
• Consumption: EIA – Monthly Energy Review, March 2012, Table 1.3, http://www.eia.gov/totalenergy/data/monthly/#summary
U.S. Nameplate Capacity and Generation — Pages 10–12
• EIA – Electric Power Monthly, March 2012, Table 1.1, http://www.eia.doe.gov/cnea/electricity/epm/epm_sum.html
• EIA – Existing Capacity by Energy Source, Form EIA-860, Generator Y10 File, “Exist” tab: http://www.eia.doe.gov/cnea/electricity/page/eia860.html
• EIA – Planned Generating Capacity Additions, by Energy Source, Generator Y10 File, “Proposed” tab:http://www.eia.doe.gov/cnea/electricity/page/eia860.html
• Lawrence Berkeley National Laboratory (LBNL) – 2011 Wind Technologies Market Report, http://eetd.lbl.gov/ea/ems/reports/lbnl-5559e.pd
• Solar Energy Industries Association and Greentech Media (SEIA/GTM) – 2011 Solar Industry Year In Review,http://www.seia.org/research-resources/us-solar-market-insight-report-2011-year-review
• Larry Sherwood/IREC – U.S. Solar Market Trends 2011, http://www.irecusa.org/wp-content/uploads/IRECSolarMarketTrends-2012-web.pd
• Geothermal Energy Association (GEA), Annual U.S. Geothermal Power Production and Development Report – April 2012,http://geo-energy.org/reports/2012AnnualUSGeothermalPowerProductionandDevelopmentReport_Final.pd
U.S. Energy Consumption by Sector — Pages 13–15
• EIA, Monthly Energy Review, March 2012, http://www.eia.gov/totalenergy/data/monthly/#consumption
References
References
Renewable Energy Capacity and Generation in the U.S. — Pages 19–28
• EIA – Electric Power Monthly, March 2012, Table 1.1, http://www.eia.doe.gov/cnea/electricity/epm/epm_sum.html
• EIA – Existing Capacity by Energy Source, Form EIA-860, Generator Y10 File, “Exist” tab:http://www eia doe gov/cnea/electricity/page/eia860 html

7/28/2019 Renewable Energy Data Book
http://slidepdf.com/reader/full/renewable-energy-data-book 120/128
References | Revised February
XIV
120
http://www.eia.doe.gov/cnea/electricity/page/eia860.html
• EIA – Planned Generating Capacity Additions, by Energy Source, Generator Y10 File, “Proposed” tab:
http://www.eia.doe.gov/cnea/electricity/page/eia860.html
• Lawrence Berkeley National Laboratory (LBNL) – 2011 Wind Technologies Market Report, http://eetd.lbl.gov/ea/ems/reports/lbnl-5559e.pd
• Solar Energy Industries Association and Greentech Media (SEIA/GTM) – 2011 Solar Industry Year In Review,http://www.seia.org/research-resources/us-solar-market-insight-report-2011-year-review
• Larry Sherwood/IREC – U.S. Solar Market Trends 2011, http://www.irecusa.org/wp-content/uploads/IRECSolarMarketTrends-2012-web.pd
• Geothermal Energy Association (GEA), Annual U.S. Geothermal Power Production and Development Report – April 2012,http://geo-energy.org/reports/2012AnnualUSGeothermalPowerProductionandDevelopmentReport_Final.pd
• Solar generation – Numbers calculated using capacity actors o 18% or PV and 25% or CSP based on installed capacity.
References
State Numbers by Technology — Pages 30–39
• EIA – Existing Capacity by Energy Source, Form EIA-860, Generator Y10 File, “Exist” tab:http://www.eia.doe.gov/cnea/electricity/page/eia860.html
• EIA – Planned Generating Capacity Additions, by Energy Source, Generator Y10 File, “Proposed” tab:

7/28/2019 Renewable Energy Data Book
http://slidepdf.com/reader/full/renewable-energy-data-book 121/128
References | Revised February121
EIA Planned Generating Capacity Additions, by Energy Source, Generator Y10 File, Proposed tab:http://www.eia.doe.gov/cnea/electricity/page/eia860.html
• Lawrence Berkeley National Laboratory (LBNL) – 2011 Wind Technologies Market Report, http://eetd.lbl.gov/ea/ems/reports/lbnl-5559e.pd
• Solar Energy Industries Association and Greentech Media (SEIA/GTM) – 2011 Solar Industry Year In Review,http://www.seia.org/research-resources/us-solar-market-insight-report-2011-year-review
• Larry Sherwood/IREC – U.S. Solar Market Trends 2011, http://www.irecusa.org/wp-content/uploads/IRECSolarMarketTrends-2012-web.pd
• Geothermal Energy Association (GEA), Annual U.S. Geothermal Power Production and Development Report – April 2012,http://geo-energy.org/reports/2012AnnualUSGeothermalPowerProductionandDevelopmentReport_Final.pd
• United States Census 2011, Annual Population Estimates, http://www.census.gov/popest/data/state/totals/2011/index.html
World Renewable Energy Capacity — Pages 41–50• Bloomberg New Energy Finance, Global Renewable Electricity Installations, March 27 2012.
• Global Generating Capacity – EIA, http://www.eia.gov/capps/ipdbproject/iedindex3.cm?tid=2&pid=2&aid=7&cid=regions&syid=2000&eyid=2009&unit=MK. Estimated or 2010 and 2011.
• World generation derived rom global capacity data by using capacity actors o 14% or PV, 30% or wind, 70% or geothermal, 54% or biomass,25% or CSP and 41% or hydropower.
References
References
U.S. Total Installed Wind Energy Capacity and Generation — Page 54
• Capacity Numbers: Lawrence Berkeley National Laboratory (LBNL) – 2011 Wind Technologies Market Report,http://eetd.lbl.gov/ea/ems/reports/lbnl-5559e.pd
• Generation Numbers: EIA, March 2012, Electric Power Monthly, Table 1.1A, http://www.eia.doe.gov/cnea/electricity/epm/epm sum.html
7/28/2019 Renewable Energy Data Book
http://slidepdf.com/reader/full/renewable-energy-data-book 122/128
References | Revised February
XIV
122
, , y, , p // g / / y/ p / p _
Global Wind Capacity, Oshore Wind, Manuacturing, Turbine Size, Leading States — Pages 55–61
• Lawrence Berkeley National Laboratory (LBNL) – 2011 Wind Technologies Market Report, http://eetd.lbl.gov/ea/ems/reports/lbnl-5559e.pd
• Bloomberg New Energy Finance, Global Renewable Electricity Installations, March 27 2012
• American Wind Energy Association (AWEA), U.S. Wind Industry Fourth Quarter 2011 Market Report,http://www.awea.org/learnabout/publications/reports/upload/4Q-2011-AWEA-Public-Market-Report_1-31.pd
U.S. Total Installed Solar Energy Capacity and Generation — Page 64
• Solar Energy Industries Association and Greentech Media (SEIA/GTM) – 2011 Solar Industry Year In Review,
http://www.seia.org/research-resources/us-solar-market-insight-report-2011-year-review
• Larry Sherwood/IREC – U.S. Solar Market Trends 2011, http://www.irecusa.org/wp-content/uploads/IRECSolarMarketTrends-2012-web.pd
Solar Energy Capacity, Select Countries — Page 65
• Solar Energy Industries Association and Greentech Media (SEIA/GTM) – 2011 Solar Industry Year In Review,http://www.seia.org/research-resources/us-solar-market-insight-report-2011-year-review
• Bloomberg New Energy Finance, Global Renewable Electricity Installations, March 27 2012.
• Larry Sherwood/IREC – U.S. Solar Market Trends 2011, http://www.irecusa.org/wp-content/uploads/IRECSolarMarketTrends-2012-web.pd
References
PV Manuacturing — Page 66
• Greentech Media (GTM) – PV News, May 2012
Top States: Solar Energy Development PV and CSP — Page 67

7/28/2019 Renewable Energy Data Book
http://slidepdf.com/reader/full/renewable-energy-data-book 123/128
References | Revised February123
p gy p g
• Solar Energy Industries Association and Greentech Media (SEIA/GTM) – 2011 Solar Industry Year In Review,
http://www.seia.org/research-resources/us-solar-market-insight-report-2011-year-review
• Larry Sherwood/IREC – U.S. Solar Market Trends 2011, http://www.irecusa.org/wp-content/uploads/IRECSolarMarketTrends-2012-web.pd
Geothermal Capacity and Generation — Page 71–73
• Geothermal Energy Association (GEA), Annual U.S. Geothermal Power Production and Development Report – April 2012,http://geo-energy.org/reports/2012AnnualUSGeothermalPowerProductionandDevelopmentReport_Final.pd
• Bloomberg New Energy Finance, Global Renewable Electricity Installations, March 27 2012.
• Generation Numbers: EIA, March 2012, Electric Power Monthly, Table 1.1A, http://www.eia.doe.gov/cnea/electricity/epm/epm_sum.html
Biopower Capacity and Generation — Pages 77–79
• EIA – Existing Capacity by Energy Source, Form EIA-860, Generator Y10 File, “Exist” tab: http://www.eia.doe.gov/cnea/electricity/page/eia860.html
• EIA – Planned Generating Capacity Additions, by Energy Source, Generator Y10 File, “Proposed” tab:http://www.eia.doe.gov/cnea/electricity/page/eia860.html
• EIA, March 2012, Electric Power Monthly, Table 1.1A, http://www.eia.doe.gov/cnea/electricity/epm/epm_sum.html
References
References
Hydropower Capacity and Generation, State Rankings — Page 83, 84
• EIA – Existing Capacity by Energy Source, Form EIA-860, Generator Y10 File, “Exist” tab:http://www.eia.doe.gov/cnea/electricity/page/eia860.html
• EIA – Planned Generating Capacity Additions, by Energy Source, Generator Y10 File, “Proposed” tab:

7/28/2019 Renewable Energy Data Book
http://slidepdf.com/reader/full/renewable-energy-data-book 124/128
References | Revised February
XIV
124
http://www.eia.doe.gov/cnea/electricity/page/eia860.html
• EIA, March 2012, Electric Power Monthly, Table 1.1A, http://www.eia.doe.gov/cnea/electricity/epm/epm_sum.html
Other Water Power: Wave and Tidal — Pages 87–88
• Marine and Hydrokinetic Technology Database - http://www1.eere.energy.gov/water/hydrokinetic/deault.aspx
• Ocean Energy Systems 2011 Annual Report - http://www.ocean-energy-systems.org/library/annual_reports/2011_annual_report/
Hydrogen — Pages 91–92
• U.S. DOE EERE – Alternative Fuels & Advanced Vehicles Data Center, http://www.adc.energy.gov/adc/uels/stations_counts.html
• FuelCells.org, http://www.uelcells.org/dbs/, http://www.uelcells.org/db/index.php
Alternative Fuels — Pages 95–98
• U.S. DOE EERE – Alternative Fuels & Advanced Vehicles Data Center, http://www.adc.energy.gov/adc/uels/stations_counts.html
• EIA – Consumption o Vehicle Fuels in the United States, http://www.eia.gov/renewable/av/xls/New%20C1%20GEGs.xls
References
Ethanol Production and Price and Alternative Fuels — Page 99–102
• Renewable Fuels Association (RFA), 2012 Ethanol Industry Outlook, http://ethanolra.3cdn.net/d4ad995fb7ae8be_1vm62ypzd.pd
• U.S. DOE EERE – Alternative Fuel Price Report, January 2012, Table 2 http://www.adc.energy.gov/adc/price_report.html
• EIA http://www eia gov/renewable/alternative transport vehicles/pd/att S7 pd

7/28/2019 Renewable Energy Data Book
http://slidepdf.com/reader/full/renewable-energy-data-book 125/128
References | Revised February125
• EIA, http://www.eia.gov/renewable/alternative_transport_vehicles/pd/att_S7.pd
•
U.S. DOE EERE – Alternative Fuels & Advanced Vehicles Data Center, http://www.adc.energy.gov/adc/uels/stations_counts.html• EIA, Alternative Fuel Consumption, http://www.eia.gov/renewable/av/xls/New%20C1%20GEGs.xls
Biodiesel Production and Price — Page 104
• U.S. DOE EERE – Alternative Fuel Price Report, January 2012, Table 2 http://www.adc.energy.gov/adc/price_report.html
• Note: Biodiesel price is an average between B20 and B99–B100.
• Biodiesel.org, http://www.biodiesel.org/production/production-statistics
Top U.S. Biodiesel Companies — Page 105• Biodiesel.org, http://www.biodiesel.org/production/plants
• Renewable Energy Group Inc, http://www.regi.com/locations/bioreneries
• Renewable Biouels Inc, http://www.rbuels.com/port-neches-acility.html
• Imperium Renewables, http://www.imperiumrenewables.com/acilities.html
• Green Earth Fuels LLC, http://www.greenearthuelsllc.com/projects.php
• Archer Daniels Midland (ADM) Company, http://www.adm.com/
References
References
Top Biodiesel Countries — Page 106
• REN21 – Renewables 2012 Global Status Report, http://www.map.ren21.net/GSR/GSR2012_low.pd
U.S. Investments in Clean Energy — Page 109–113

7/28/2019 Renewable Energy Data Book
http://slidepdf.com/reader/full/renewable-energy-data-book 126/128
References | Revised February
XIV
126
• Bloomberg New Energy Finance desktop database, http://bne.com/
• Completed and disclosed deals only.
Public Renewable Energy Index Perormance — Page 114
• Public data

7/28/2019 Renewable Energy Data Book
http://slidepdf.com/reader/full/renewable-energy-data-book 127/128

7/28/2019 Renewable Energy Data Book
http://slidepdf.com/reader/full/renewable-energy-data-book 128/128
For more information, visit:
eere.energy.gov
Printed with a renewable-source ink on paper containing atleast 50% wastepaper, including 10% post consumer waste.
DOE/GO-102012-3598Revised February 2013
Energy Efficiency &
Renewable Energy
Prepared by the National Renewable Energy Laboratory (NRE
NREL is a national laboratory of the U.S. Department of Energ
Office of Energy Efficiency and Renewable Energy
Operated by the Alliance for Sustainable Energy, LLC


![[PPT]Chapter 18 Renewable Energy 18-1 Renewable …environmentalscienceclass.weebly.com/.../ch_18_notes.ppt · Web viewChapter 18 Renewable Energy 18-1 Renewable Energy Today Renewable](https://static.documents.pub/doc/80x56/5b029fb97f8b9a6a2e900bdf/pptchapter-18-renewable-energy-18-1-renewable-envir-viewchapter-18-renewable.jpg)


