48
Renewable energy sources in figures - national and international development Status: May 2006 enviRonMental policy

Renewable energy sources in figures -national and international developmentStatus: May 2006
enviRonMental policy

imprint
Published by: Federal Ministry for the Environment, Nature Conservation and Nuclear Safety (BMU) Public Relations Division – D-11055 Berlin E-mail: [email protected] Internet: www.bmu.de . www.erneuerbare-energien.de
Authors: Dr. Frithjof Staiss, Dipl.-Ing. (FH) Christel Linkohr, Dipl.-Kffr. Ulrike Zimmer Centre for Solar Energy and Hydrogen Research Baden-Wuerttemberg (ZSW), Stuttgart
Edited by: Dr. Wolfhart Dürrschmidt, Andrea Meyer, Dipl.-Ing. (FH) Dieter Böhme BMU, Division KI I 1 “General and fundamental aspects of renewable energies”
Design: Feldes & Vogt GmbH & Co KG commercial agency, Bonn
Printing: Bonifatius GmbH, Paderborn
Photos: Title page: Getty Images (M. Dunning); Enercon / Block Design; Visum (K. Sawabe); zefa; Getty Images (C. Coleman) Page 5: Brigitte Hiss, Christoff Edelhoff, Dieter Böhme, Union zur Förderung von Oel- und Proteinpflanzen e. V. (UFOP), public utility company Crailsheim, EnBW Kraftwerke AG, Stuttgart
Status: May 2006 1st print run: 5,000 copies

Dear Reader,
Energy is essential for our economy and everyday life. We need primary
energy sources for heat, electricity and mobility. In the past, we have used
energy almost exclusively from conventional raw materials like coal, oil,
gas and uranium. But these reserves are finite. Furthermore, we burden our
descendants with climate change and thousands of years of radioactive atomic
waste. Fairness requires us to change our energy policy fundamentally: to
expand the share of renewable energy sources and to increase efficiency in
the conversion and use of energy. The combination of both strategies brings
supply security, cost stability and climate protection.
The share of renewable energy sources again strongly increased in 2005.
Solar, wind and hydropower, bio and geothermal energy now contribute
6.4 % to the final energy consumption. They have reached 10.2 % of the
gross electricity consumption, 5.3 % of heat allocation and 3.6 % of fuel
consumption. In 2005, a total of approximately 84 million tonnes of CO2
were avoided. The Federal Government has an ambitious expansion goal
for renewable energy sources: to cover half of the energy consumption with
renewable energy sources by 2050. We are on the right track for achieving
this goal – together with all those who have invested in renewable energy
sources – be it companies or consumers.
Renewable energy sources are an important economic factor for Germany.
In 2005, the industry had a turnover of approximately 16.4 billion euros.
It provides 170,000 jobs for men and women. The demand for renewable
energy installations is growing on the global market. Our companies now
lead technologically in the field of wind, hydro and solar power as well as
biomass – a situation which is reflected in full order books. Reinforcing the
expansion of renewable energies in our own country and thus developing
our position on the global market protects the environment and offers
advantages for the German economy and for countries which cannot invest
in the development of new technology but suffer the effects of climate
change.
Sigmar Gabriel
Federal Minister for the Environment, Nature Conservation and Nuclear Safety
Foreword
3

Working Group on Renewable energies/Statistics (aGee-Stat)
Working Group on Renewable energies/Statistics (aGee-Stat)
The Federal Environment Ministry agreed to set up a Working Group on Renewable Energies/Statistics (AGEE-Stat) with the Federal Ministry of Economics and Technology and the Federal Ministry of Food, Agriculture and Consumer Protection, to put the statistics of renewable energy sources on a comprehensive, up-to-date and coordinated basis. The results of the work of the AGEE-Stat are incorporated into this brochure.
The AGEE-Stat is an independent expert committee which has been working since 2004. The members are experts of the
• Federal Ministry for the Environment, Nature Conservation and Nuclear Safety (BMU),• Federal Ministry of Economics and Technology (BMWi),• Federal Ministry of Food, Agriculture and Consumer Protection (BMELV), • Federal Environmental Agency (UBA),• Federal Statistical Office (StBA),• Agency of Renewable Resources (FNR),• Centre for Solar Energy and Hydrogen Research Baden-Wuerttemberg (ZSW),• Working Group on Energy Balances (AGEB) and the• German Renewable Energy Federation (BEE).
Dr. Staiss (Centre for Solar Energy and Hydrogen Research Baden-Wuerttemberg, ZSW) was appointed the head of AGEE-Stat.
The work of AGEE-Stat focuses on the statistics of renewable energies. Furthermore, the committee has the task
• to lay the foundation for the Federal Government’s various national, EU-wide and international reporting obligations in the field of renewable energies and• to provide general information and public relations work.
Within the framework of the AGEE-Stat a variety of research work is being undertaken to improve the databases. Workshops and hearings on specified subjects also support the work of the committee.
Further information on the AGEE-Stat and renewable energy sources are available on the website of the BMU www.erneuerbare-energien.de.
4

Wind energy plant
Offshore researchplatform FINO 1 in the North SeaForestry office Grunewald, Berlin
Barrage Iffezheim/Rhein with dam, watergate, hydroelectric power plant and fish pass
Installation of solar thermal collectors in Crailsheim
Housing estate with solar power plant
Fueling with biodiesel
5
Renewable energy sources in Germany

Renewable energy sources in Germany: Guarantees for climate protection and supply security 8
The most important developments in 2005 at a glance! 10
Contribution of renewable energy sources to energy supply, 2005 11
Structure of energy supply from renewable energy sources, 2005 11
Development of energy supply from renewable energy sources and installed capacity, 1990 to the end of 2005 12
Renewable energy sources as a share of energy supply 13 Structure of primary energy consumption, 2005 13
Fossil fuels saved via the use of renewable energy sources, 2005 13
Emissions avoided via the use of renewable energy sources, 2005 14
Development of energy-related emissions, 1990 to 2005 16
Energy-related emissions according to source groups, 2004 17
Source group shares of energy-related CO2 and particulate matter emissions, 2004 17
Turnover from the construction of plants for the use of renewable energy sources, 2005 18
Turnover from the operation of plants for the use of renewable energy sources, 2005 18
Total turnover with renewable energy sources, 2005 19
Employment effects from the use of renewable energy sources 19
Support programmes for renewable energy sources 20
The Market Incentive Programme 21
Research and development for renewable energies technology 22
Feed-in and fees under the Electricity Feed Act and the Renewable Energy Sources Act (EEG) 23
Structure of electricity volumes paid for under the EEG 23
Costs for the electricity consumer 24
Macroeconomic external costs 25
Long-term utilisation potential of renewable energy sources for electricity, heat supply and fuel production 26
Scenario for an intensified expansion of renewable energies 27
6
contents

Renewable energies in europe 28
Share of renewable energy sources in primary energy consumption, 1990 to 2004 28
Use of renewable energy sources in selected EU countries, 2004 29
Expansion of electricity generation from renewable energy sources in the internal European electricity market 30
Instruments for the promotion of renewable energy sources in the electricity market 31
Generation of electricity from renewable energy sources in the EU-15, 1990 to 2004 32
Generation of electricity from wind energy in the EU, 1990 to 2005 32
Total installed wind power capacity in the EU, end of 2005 33
Development of installed wind power capacity in the EU, 1990 to 2005 33
Global use of renewable energy sources 34
Structure of global primary energy consumption, 2003 versus 1971 34
Average growth rates of primary energy consumption and renewable energy sources for the period 1990 to 2003 35
Structure of renewable energy use according to application areas, 2003 35
Share of renewable energy sources in primary energy consumption, 2003 36
Regional distribution of renewable energy sources, 2003 36
Electricity generation from renewable energy sources in various regions, 2003 37
Share of renewable energy sources in global electricity generation, 2003 37
International Conference for Renewable Energies- renewables2004 – and the follow-up process 38
appendix
Methodological notes 39
Conversion factors, greenhouse gases and other air pollutants 44
Bibliography 45
7
contents
Renewable energy sources in Germany:Guarantees for climate protection and supply security
An intelligent provision and economical use of energy – these are the main challenges of the 21st century. In many regions of the world energy demand is growing due to rapid industrialisation. At the same time industrialized nations face the challenge of drastically reducing their energy consumption. Only then can we succeed in alleviating the consequences of the greenhouse effect and become more independent of oil, gas, coal and uranium imports.Alongside the important strategy of an economical use and efficient conversion of raw materials, the Federal Environment Ministry is focussing on the use of renewable energy sources. In recent years renewable energies have made a considerable impact not only on the transport and heating sector but also especially on the electricity market. With a share of more than 10 % of the German electricity supply, they have become an indispensable part of the energy industry. Renewable energies contribute in all manner of ways to a sustainable energy supply:
• They make a considerable contribution to climate protection, because no fossil fuels are burned – in 2005, they prevented the emission of approximately 84 million tonnes of CO2. Without renewable energy sources Germany’s climate protection goal, in the framework of the Kyoto Protocol, would be a distant prospect.• They diversify the variety of raw materials, increase independence from fossil fuels, make a contribution to supply security and prevent raw material conflicts.• In the medium term, renewable energy sources safeguard against cost increases which unavoidably occur with the use of fossil and nuclear resources.• Renewable energy facilities can, at the end of their lifespan, be deconstructed and recycled. They are not a radioactive legacy like nuclear power plants and leave behind no coal cavities.• Renewable energy sources are, in many cases, domestic energy sources that contribute to the regional added value and secure jobs. In Germany in 2005, renewable energy sources achieved a total turnover of 16.4 billion euros; in the same year 170,000 people were working in this sector.• Renewable energy sources can show poor countries the way out of poverty, furthermore they simplify access to energy for large parts of the population, for example through rural electrification.
Renewable energy sources in GermanyThe expansion of renewable energies has so far been a success story. But the goals of the Federal Government are even more ambitious: to double the share of renewables in the energy supply by 2010 compared to the year 2000: with at least a 12.5 % share of electricity. By 2020 their share of primary energy consumption should amount to at least 10 % and the share of electricity supply to at least 20 %. By 2050 half of the German primary energy consumption should derive from renewable energy sources. The BMU considers it feasible to cover 25 % of the electricity supply with renewables by 2020. Further innovative measures, for example a law for the intensified expansion of renewable energy sources in the heating sector, can bring the breakthrough for renewable energies also on the heating market.
Wind powerWind power leads the way in the dynamic expansion of renewable energies. With 18,428 megawatts of installed capacity in 2005, Germany is the global leader; in 2005, these power plants produced 26.5 TWh of electricity, that is 4.3 % of total electricity generation.In the years to come the contribution of wind power will continue to grow. The development of offshore wind parks will be a new emphasis: the wind conditions are excellent in both the North and Baltic Seas. In the framework of its sustainability strategy “Perspectives for Germany” the German Government, under the auspices of the Federal Environment Ministry, has presented a strategy for the use of wind power at sea and identified the first suitable areas for wind parks and sanctuaries.In the coming years, alongside offshore utilisation and further expansion on land, emphasis will also be placed on the modernisation of existing power plants and the considerable increase in output (“repowering”).
8
Renewable energy sources in Germany

BiomassBiomass is a climate compatible and local energy resource that can be used 24 hours a day. It makes an important contribution to a safe energy supply. The Biomass Ordinance that entered into force on 28 July 2001 and the improved fees under the 2004 amendment to the Renewable Energy Sources Act (EEG) paved the way for electricity generation from renewable raw materials and biogenic residues and wastes. In addition biofuels are tax privileged; a blending obligation for biofuels is currently being developed. Already wood heating and wood-fired power plants, biogas installations and biofuels contribute a share of 3.3 % to the energy supply in Germany.
Geothermal energyThe heat from the earth’s interior can be used for heating buildings or the local heating grid but also for electricity generation. In 2003, the first German geothermal power station was inaugurated. Geothermal heating stations were already in existence. To advance the technology and develop the sizable German geothermal potential in multiple sites, the Federal Government supports various projects for geothermal electricity generation. Furthermore, the EEG establishes a feed-in tariff.
HydropowerFor the expansion of hydropower, the most important potential lies in replacing and modernising present facilities. Increasing capacity combined with improving watercourse ecological conditions are the declared goals of the Federal Government.
photovoltaics/solar thermal energyElectricity generation from solar power with solar cells has trippled within two years as a result of the support through the EEG. Approximately one billion kilowatt hours of solar electricity were generated in 2005. Technical innovation and growing markets will continue to reduce the costs of electricity from photovoltaic facilities.Solar collectors are enjoying growing popularity. In Germany approximately 1 million installations support the heating of process and heating circuit water. The costs for solar collectors have halved in the last 12 years. High oil and gas prices and the support under the Federal Government‘s market incentive programme will continue to advance the installation of solar thermal facilities.
Further pillars of the transformation of the energy systemThe Federal Government consistently exploits the potential for rational, economical use of energy and for improving energy efficiency. Pivotal to this are the eco-tax reform introduced in 1999 and the measures contained in the climate protection programme of October 2000. These include the Energy Saving Ordinance, the Combined Heat Power Act and measures in the field of energy consumption labelling. The building modernisation programme to cut CO2 emis-sions has been extended considerably in 2006. Emissions trading will be further developed this year so that German industry can attain its climate protection targets even more cost-effectively and efficiently than before.The revised Atomic Energy Act (AtG) of 22 April 2002 transposed the phase-out of nuclear power into German law. Under this Act, existing nuclear power plants will be decommissioned once they have generated the volume of electri-city specified for each plant. In November 2003 the nuclear power plant Stade and in May 2005 the oldest operating nuclear power plant Obrigheim were decommissioned after the operators definitively renounced the reconnection of the legally disputed nuclear power plant Müllheim-Kärlich. It is estimated that the last nuclear power plant will be shut down in less than 20 years’ time. The protection of the global climate, the protection of valuable resources and a global sustainable development – these are the important challenges we must overcome in the 21st century. A central condition for this is the transformation of the energy system. On the road to a sustainable energy supply, the Federal Government is focussing on the phase-out of nuclear energy, energy saving, energy efficiency and the expansion of renewable energy sources.
9
Renewable energy sources in Germany

10
Renewable energy sources at a glance
the most important developments in 2005 at a glance!
Germany making further advances in solar energy utilisationPhotovoltaics world champion: newly installed capacity of 600 MWp (2004: 500 MWp), higher than in Japan (approximately 330 MWp) [BSW 73];newly installed solar thermal collector area: approximately 960,000 m2 (2004: 750,000 m2) of a total of over 7 million m2.
Wind energy ahead of hydropowerGross newly installed capacity of 1,808 MW approximately 20 % less than in the previous year, however this matches expectations; in total (including the replacement of facilities) 18,428 MW installed.
Biofuels and bioelectricity gaining groundEEG amendment strengthens expansion in the electricity market;the 2 million tonnes mark for biofuels has been exceeded;sales of pellet heaters climb further (approx. 10,000 systems).
Hydropower stabilisedBetter weather conditions have led to higher returns.
Geothermal energy in positionOn the electricity market numerous projects planned;sales of heating pumps continue to rise (over 18,000 systems) [BWP 26].
Share of renewable energy sources in the energy supply4 4.6 % share of total primary energy consumption (2004: 4.0 %)4 10.2 % share of gross electricity consumption (2004: 9.5 %)4 5.3 % share of final energy consumption for heat (2004: 5.1 %)4 3.6 % share of fuel consumption for road traffic (2004: 1.9 %)4 6.4 % share of total final energy consumption (electricity, heat, fuel 2004: 5.7 %)
[%]
Share of TPEC
2004
10
8
6
4
2
2.6
6.3
0
2003
2002
2001
2000
Share of grosselectricity consumption
Share of FEC for heat
Share of fuel for road traffic
3.9
5.3*
0.4
10.2
4.6
2005 3.8
6.4
Share of FEC
3.6
TPEC Total primary energy consumption FEC Final energy consumption
* Since 2003 new data based on the Energy Statistics Act (EnStatG) are taken into account.
Sources:
see table
below
[%]
Share of TPEC
2004
10
8
6
4
2
2.6
6.3
0
2003
2002
2001
2000
Share of grosselectricity consumption
Share of FEC for heat
Share of fuel for road traffic
3.9
5.3*
0.4
10.2
4.6
2005 3.8
6.4
Share of FEC
3.6

TPEC Total primary energy consumption14,238 PJ, status January 2006FEC final energy consumption
1) For an explanation of the methods used to determine primary energy equivalent, cf. Appendix, No. 4; for heat and fuels final energy is here equated with primary energy2) For pumped-storage power stations, only electricity generation from natural inflow3) Biogenic share estimated at 50 %4) Electricity generation from geothermal energy in a pilot phase to date5) Industry = operation of mining, extraction of stone and earth as well as the processing industry, Art. 8 Energy Statistics Act, value of 2005 estimated on the basis of 2003 data6) Pursuant to Art. 3 and 5 Energy Statistics Act7) Partly estimated, gases include the direct use of sewage gas8) In relation to the gross electricity consumption 2005 of 611 TWh9) In relation to FEC of space heating, hot water and other process heat 2003 of 186 million t C.E. or 5,451 PJ Based on fuel consumption in road traffic 2005 of 2,239 PJ In relation to FEC 2004 of 9,237 PJ With a substitution factor of 8,309 kJ/kWh (status 2004, provisional), refer to Appendix, No. 4
For electricity generation from photovoltaics and for heat supply from solar thermal energy, cf. also Appendix, No. 5.
Sources:ZSW [3]; after BSW [10]; IE [20]; AGEB [1], [18]; DIW [11]; StBA [5]; FNR [7]; ZfS [19]; VDEW [17]; ISI [41]; VDN [9]; BMELV [15]
acc. to physical energy
cont. method
acc. to substitution
method
[GWh]
Hydropower 2) 21,524 77.5 211.7 3.53 0.54 1.5
Wind energy 26,500 95.4 251.5 4.34 0.67 1.7
Photovoltaics 1,000 3.6 8.9 0.16 0.025 0.1
Biogenic solid fuels 5,400 44.9 44.9 0.88 0.3 0.3 Biogenic liquid fuels 430 3.6 3.6 0.07 0.03 0.02
Biogas
Sewage gas
Landfill gas
Geothermics
3) Biogenic share of waste
4)
Total 62,468 10.2
Biogenic solid fuels (households) 56,000 201.6 3.70 1.4 1.4
5)
Biogenic solid fuels, CHP/ HP plants
Biogenic liquid fuels
Biogenic gaseous fuels
Biogenic share of waste
Biodiesel
Bioethanol
Final energy
Primary energy equivalent 1) Share of final
energy consumption
Share of total primary
energy consumption 12)
[%] [%] [PJ] [PJ]
acc. to physical energy
cont. method
acc. to substitution
method
Ele
ctri
city
gen
erat
ion
H
eat
gen
erat
ion
Fu
el
4.0
Sh
are
of e
lect
rici
ty c
onsu
mpt
ion
8)
288.2 583.8
7.2 7.2 0.14 0.05 0.05
2,500 20.8 20.8 0.41 0.15 0.14
864
2,200 18.3 18.3 0.36 0.1 0.1
2,050 17.0 17.0 0.34 0.1 0.1
0.2 0.0 0.0 0.00 0.0 0.0
10,833 39.0 0.72 0.3 0.3
3,194 11.5 0.21 0.08 0.08
18,600 67.0 2.99 0.5 0.5
Biogenic solid fuels (industry)
22,330 3.6
Total
80.4 Total
165,358 658.6 954.2 6.4 4.6
0.6
6)
7)
7)
Solar thermal en.
Near-surface geothermal energy
3)
Total
Vegetable oil
2.0
80,560 290.0
2,047 7.4 0.33 0.05 0.05
1,683 6.0 0.27 0.04 0.04
FEC11)
0.6
6.6
5.3 2.0 2.0
Deep geothermal en.
Sh
are
of F
EC
for
hea
t 9
)
3,577 12.9 0.24 0.09 0.09
2,960 10.7 0.20 0.07 0.07
1,472 5.3 0.10 0.04 0.04
114 0.4 0.01 0.003 0.003
417 1.5 0.03 0.01 0.01
Sh
are
of F
EC
at
trib
utab
le t
o
road
tra
nspo
rt 10
)
1,993 7.2 0.13 0.05 0.05
Final energy: 165 TWh(6.4 % share of total final energy consumption)
0.6 %1.0 %
46.0 %
8.1 %13.5 %
16.0 %
13.0 %
Wind energy
Hydropower
Biofuels
Biogenic fuels, electricity
Biogenic fuels, heat
Solar thermal
Geothermal
Photovoltaics
Sources:see table above
1.8 %
11
contribution to energy supply
contribution of renewable energy sources to energy supply, 2005
Structure of energy supply from renewable energy sources, 2005
Around 68 % of all final energy from renewable energy sources is provided by biomass.In terms of heat generation from renewable energy sources, biomass (primarily wood) accounts for a share of 94 %.In terms of electricity generation from renewable energy sources, wind power with a share of 42 % and hydropower with 35 % are of great importance.
10)
11)12)
The current method of calculating the primary energy equivalent of electricity generation from renewable energy sources is the physical energy content method. The substitution method, which for example is applied for calculation of avoided emissions by renewable energies and the fuels provided, is also given here.

Development of energy supply from renewable energy sources and installed capacity, 1990 to the end of 2005
Final energy
The energy supply from hydropower, wind energy and solar energy is subject to natural fluctuations, which may have both a short-term and seasonal effect, and which may also affect the entire annual energy yield.
1) In the case of pumped- storage power stations, electricity generation from natural inflow only2) For 2005 new construc- tion of 1,808 MW, minus 9 MW dismantled wind energy installations3) Until 1998 only feed in the grid of public utilities4) Share of biogenic waste estimated at 50 %5) Differing from the previous years, as of 2003 data pursuant to Art. 3, 5 (cogeneration and heating plants) and 8 (industry) Energy Statistics Act of 2003 as well as direct use of sewage gas and heat from the biogenic share of waste6) For 2005 corresponds to: biodiesel: 1,800,000 tonnes approximately 2,045 million litres; vegetable oil: 196,000 tonnes approximately 213 million litres; bioethanol: 226,000 tonnes approximately 286 million litres
Installed capacity data refers to the status as per the year - end in each case; N/A not available
Sources: ZSW [3]; EnBW [12]; BWE [16]; VDN [9]; StBA [5]; BMVEL [15]; IE [8], [20], [13]; AGEB [2], [18]; FNR [7]; SFV [28]; DIW [11]; DEWI [69]
Bio
mass
h
eat
5)
Sola
r
ther
mal
ener
gy
Tota
l h
eat
gen
erati
on
To
tal
bio
fuel
s
Tota
l fi
nal
ener
gy
su
pply
Sh
are
of
fin
al
ener
gy
co
nsu
mpti
on
Geo
ther
mal
hea
t
[GWh] [GWh] [1,000m2] [MW] [GWh] [GWh] [GWh] [GWh] [GWh] [GWh] [%] [%] [%]
1990 N/A 130 340 238 N/A N/A N/A 0 0 0 N/A N/A N/A
1992 N/A 218 590 413 N/A N/A 52 0 0 52 N/A N/A N/A 1993 N/A 279 749 524 N/A N/A 103 0 0 103 N/A N/A N/A
1994 N/A 351 946 662 N/A N/A 258 0 0 258 N/A N/A N/A
1995 N/A 440 1,159 811 1,425 N/A 310 0 0 310 N/A N/A N/A 1996 N/A 550 1,457 1,020 1,383 N/A 517 0 0 517 N/A N/A N/A
1997 48,546 695 1,821 1,275 1,335 50,576 827 0 0 827 75,908 2.9 2.0
1998 51,613 857 2,194 1,536 1,384 53,854 1,033 0 0 1,033 81,800 3.1 2.2
1999 50,951 1,037 2,641 1,849 1,429 53,417 1,343 0 0 1,343 85,271 3.3 2.3
2000 54,314 1,279 3,284 2,299 1,433 57,026 2,583 0 0 2,583 96,288 3.8 2.6
2001 55,326 1,626 4,199 2,939 1,447 58,399 3,617 0 0 3,617 101,089 3.8 2.7 2002 54,626 1,955 4,749 3,324 1,483 58,064 5,683 0 0 5,683 109,580 4.3 3.0
2003 70,346 2,465 5,478 3,835 1,532 74,343 8,267 52 0 8,319 131,336 5.1 3.6 2004 72,259 2,573 6,235 4,365 1,558 76,390 10,850 52 484 11,386 145,305 5.7 4.0
1991 N/A 166 468 328 N/A N/A 2 0 0 2 N/A N/A N/A
Bio
die
sel 6
)
Bio
eth
an
ol 6
)
Hydro
pow
er 1)
Win
d e
ner
gy
2)
Ph
otov
olt
aic
s
Geo
ther
mal
elec
tric
ity
Tota
l el
ectr
icit
y
gen
erati
on
Sh
are
of
gro
ss
elec
tric
ity
co
nsu
mpti
on
Bio
mass
el
ectr
icit
y 3
)
[GWh] [MW] [GWh] [MW] [GWh] [MW] [GWh] [GWh] [MWp] [GWh] [MW] [GWh] [%]
1990 17,000 4,403 40 56 222 190 1,200 1 2 0 0 18,463 3.4
1991 15,900 4,403 140 98 250 N/A 1,200 2 3 0 0 17,492 3.2 1992 18,600 4,374 230 167 295 227 1,250 3 6 0 0 20,378 3.8
1993 19,000 4,520 670 310 370 N/A 1,200 6 9 0 0 21,246 4.0
1994 20,200 4,529 940 605 570 276 1,300 8 12 0 0 23,018 4.3
1995 21,600 4,521 1,800 1,094 670 N/A 1,350 11 16 0 0 25,431 4.7
1996 18,800 4,563 2,200 1,547 853 358 1,350 16 24 0 0 23,219 4.2
1997 19,000 4,578 3,000 2,082 1,079 400 1,400 26 36 0 0 24,505 4.5
1998 19,000 4,601 4,489 2,875 1,642 409 1,750 32 45 0 0 26,913 4.8
1999 21,300 4,547 5,528 4,444 1,791 604 1,850 42 58 0 0 30,511 5.5 2000 24,936 4,572 7,550 6,112 2,279 664 1,850 64 100 0 0 36,679 6.3
2001 23,383 4,600 10,509 8,754 3,206 790 1,859 116 178 0 0 39,073 6.7
2002 23,824 4,620 15,786 11,965 4,017 952 1,945 188 258 0 0 45,760 7.8
2003 20,350 4,640 18,859 14,609 6,970 1,137 2,162 333 408 0 0 48,674 8.1
2004 21,000 4,660 25,509 16,629 8,347 1,550 2,116 557 908 0.2 0.2 57,529 9.5
Sh
are
of
pr
imar
y e
ner
gy
con
sum
pti
on
Bio
gen
ic s
hare
of
w
aste
, ele
ctri
city
4)
Veg
etable
oil
6)
2005 76,014 2,960 7,197 5,038 1,586 80,560 18,600 2,047 1,683 22,330 165,358 6.4 4.6
2005 21,524 4,680 26,500 18,428 11,394 2,192 2,050 1,000 1,508 0.2 0.2 62,468 10.2
12
temporal development of energy supply

Renewable energy sources as a share of energy supply
Structure of primary energy consumption, 2005
Fossil fuels saved via the use of renewable energy sources, 2005
RES renewable energy sources
1) Reference year for heat 20032) According to physical energy content method, see Appendix, No. 4
Sources:acc. to previous tables; acc. to VDEW [17]; acc. to AGEB [18], [1]; BMELV [15]; BMVBW [68]; DIW [11]; FNR [7]; ZSW [3]
For the calculation of economisation of fossil fuels, cf. also Appendix, No. 6.
1) The substitution of electrical heaters not included here.
Sources: ZSW [3]; IZES [22]; Öko-Institut [24]; acc. to ISI [41]
Renewable energy
Mineral oil
Lignite
Hard coal
Nuclear energy
Natural gas
Others
Total: approx. 14,238 PJ
12.5 %
12.9 %11.2 %
36.0 %
4.6 %
22.7 %
0.1 %
1998 1999 2000 2001 2002 2003 20041)
Final energy consumption (FEC)
Electricity generation (in relation to gross electricity consumption) 4.8 5.5 6.3 6.7 7.8 8.1 9.5 10.2
Heat supply (in relation to
total heat supply) 3.5 3.5 3.9 3.8 3.9 4.9 5.1 5.3
Fuel consumption (based on the fuel consumption in road traffic) 0.2 0.2 0.4 0.6 0.9 1.4 1.9 3.6
Primary energy consumption (PEC)
Electricity generation
(in relation to total PEC) 0.8 0.9 1.1 1.1 1.4 1.6 1.8 2.0
Heat supply
(in relation to total PEC) 1.3 1.3 1.4 1.4 1.5 1.9 1.9 2.0
Fuel consumption
(in relation to total PEC) 0.03 0.03 0.06 0.1 0.1 0.2 0.3 0.6
[%]
RES share of total FEC
Share of total PEC 2)
20051)
3.1 3.3 3.8 3.8 4.3 5.1 5.7 6.4
2.2 2.3 2.6 2.7 3.0 3.6 4.0 4.6
Provisional figures, primary energy consumption status January 2006
Sources: ZSW [3]; acc. to AGEB [1]
13
Structure of primary energy consumption
Lignite Hard coal
Heavy oil / light fuel oil
Dieselfuel
Petrolfuel
Electricity 1)
88.1 67.9 10.7 - - - 166.7
Heat 1.7 0.4 45.9 37.1 - - 85.2
Fuel - - - - 25.5 1.2 26.7
Total 89.8 68.3 56.6 37.1 25.5 1.2 278.6
Total 323.3 245.9 203.8 133.7 91.7 4.4 1,002.8
that equals 35.9 6,029 3,733
mill. litre2,562
mill. litre137
mill. litre
Primary energy [TWh]
Primary energy [PJ]
Natural gas
Total
bn m3mill. t mill. t8.5
Renewable energy
Mineral oil
Lignite
Hard coal
Nuclear energy
Natural gas
Others
Total: approx. 14,238 PJ
12.5 %
12.9 %11.2 %
36.0 %
4.6 %
22.7 %
0.1 %

Emissions arising from electricity generation from biomass included here. Biomass is CO2 neutral.
1) Other greenhouse gases (SF6, PFC, HFC) are not included2) Other air pollutants with acidification potential (NH3, HCl, HF) not included here3) Precursor substance for ground-level ozone
For calculation of the emission factors and avoided emissions, see Appendix, No. 1.
Sources: ZSW [3]; IZES [22]; ISI [41]; Öko-Institut [24]
1) In relation to final energy, only space heating plus central hot water supply to private households; heat supply mix excluding renewable energy sources, 20032) Other greenhouse gases (SF6, PFC, HFC) not included3) Other air pollutants with acidification potential (NH3, HCl, HF) not included here 4) Precursor substance for ground-level ozone
For the calculation of the emission factors and avoided emissions, cf. Appendix, No. 2.
Sources: ZSW [3]; Gemis, Öko-Institut [14]; Stat. Bundesamt [44]; VDEW [17]
electricity generation from hydropower, wind power, biomass, solar energy and geothermal energy: 62,468 GWh
Heat supply from biomass, solar thermal energy and geothermal energy: 80,560 GWh
Combusted biomass is CO2-neutral due to the fact that it emits into the atmosphere the same quantity of CO2 as was absorbed during its growth.
Other greenhouse gases (methane, nitrous oxide) as well as further air pollutants (especially carbon monoxide and dust) arising during the combustion of biomass are disregarded here because their valuation, including the preliminary process chains, is currently being updated in the framework of a research project for the Working Group on Renewable Energies/ Statistics.
In the case of older combustion plants or when wood is burned in tile stoves or fireplaces these pollutants are significantly higher than in the fossil heat supply mix. However, modern wood-fired systems (heaters and heating plants) may substantially reduce emissions.
Emission Avoided
factor emissions
[kg/GWh] [1,000 t]
228,555 18,412
8.3 0.7
1.9 0.2
CO equivalent 229,308 18,473
140.8 11.3
NOx 88.3 7.1
SO2equivalent 203.6 16.4
CO 297.0 23.9
NMVOC 11.6 0.9
Dust 2.9 0.2
Greenhouse gas/
air pollutant
Gre
enh
ouse
effe
ct2
)
Aci
difi
-ca
tion
3)
SO2
CO2
CH4
N2O
2
1)
Ozo
ne4
)
Emission Avoided
factor emissions
[kg/GWh] [1,000 t]
929,147 58,042
12.3 0.8
32.1 2.0
CO equivalent 938,942 58,654
510.8 31.9
NOx 568.8 35.5
SO2 equivalent 907.3 56.7
CO 282.6 17.7
NMVOC 12.0 0.7
Dust 27.6 1.7
Greenhouse gas/
air pollutant
Gre
enh
ouse
effe
ct1)
Aci
difi
-ca
tion
2)
SO2
CO2
CH4
N2O
2
Ozo
ne3
)
14
avoided emissions
emissions avoided via the use of renewable energy sources, 2005

Biofuels: 22,330 GWh (1,800,000 t biodiesel, 196,000 t vegetable oil, 226,000 t bioethanol)
Today, the predominant use of the biofuel biodiesel is not classed as CO2-neutral, because amongst other things methanol of fossil origin is used in its manufacture. However, this can be at least partially compensated through appropriate use of the by-products of biodiesel production, glycerine and rapeseed waste. Laughing gas (N2O) emissions are responsible for the existing differences in the emission factors of CO2 and CO2 equivalent that arise mainly from the fertilisation of plants. For the CO2 equivalent emission factor given in the table, it is assumed that approximately 80 % of the equivalent climate gas emissions of fossil fuels are currently avoided through the use of biofuels.Along with the SO2 and NOx emissions described here, other acidifying pollutant emissions are also included in the calculation of the SO2 equivalents, above all ammonia (NH3). The balance of biogenic fuels is less favourable here than for fossil fuels due to the NH3 emissions arising during the plant cultivation, so that excess emissions (negative reduction factor) result from the acidification.In the future, improved methods of energy plant cultivation, crop rotation and cropping systems will be applied to allow excess emissions to be avoided in the medium term.
total co2 reduction through the use of renewable energy sources
The contribution of renewable energy sources to climate protection is clearly larger than to the energy supply. In 2005, around 84 million tonnes of CO2 were avoided through the use of renewable energies. That means without their use total CO2 emissions (approx. 786 million tonnes) would be around 10.7 % higher. In contrast, the contribution of renewables to primary energy consumption accounts for only 4.6 %.
0 5 10 15 20 25 30 35 40 45 50 55 60 65
Heat: 18.4 million t (229 g CO2
/kWh)
Fuels: 7.5 million t (338 g CO2
/kWh)
Electricity: 58.0 million t (929 g CO2/kWh)
Wind
Hydropower
Biomass
Photovoltaics
Geothermal energy
Solar thermal energy
All figures provisional
Sources: ZSW [3]; ISI [41]; Öko-Institut [14], [24]; IZES [22]
Emission Avoided
factor emissions
[kg/GWh] [1,000 t]
338,055 7,549
260.2 5.8
-382.0 -8.5
CO equivalent 230,970 5,157
609.2 13.6
NOx 128.9 2.9
SO2 equivalent -287.1 -6.4
CO 50.6 1.1
NMVOC 91.1 2.0
Dust 3.6 0.1
Greenhouse gas/
air pollutant
Gre
enh
ouse
effe
ct1)
Aci
difi
-ca
tion
2)
SO2
CO2
CH4
N2O
2
Ozo
ne3
)
15
avoided emissions
Emission factors incl. pre-stages and biodiesel comprising credits for byproducts (colza cake, glycerine) in the pre-stages. In terms of emissions, vegetable oil is equated with rape seed oil.
0 5 10 15 20 25 30 35 40 45 50 55 60 65
Heat: 18.4 million t (229 g CO2
/kWh)
Fuels: 7.5 million t (338 g CO2
/kWh)
Electricity: 58.0 million t (929 g CO2/kWh)
Wind
Hydropower
Biomass
Photovoltaics
Geothermal energy
Solar thermal energy
1) Other greenhouse gases (SF6, PFC, HFC) not included2) Other air pollutants with acidification potential (NH3, HCl, HF) are not declared here, however they are contained in the calculation of the SO2 equivalent3) Precursor substance for ground-level ozone
Sources: ZSW [3]; Öko-Institut [24]

Status March 2006; figures including diffuse emissions in the generation, conversion and distribution of fuels.
1) Includes CO2, CH4 and N2O2) Calculated as NO2
3) Includes SO2, NOX and NH3
4) Calculation/estimate DIW
For the significance and calculation of CO2 and SO2 equivalents, see Appendix, No. 3.
The Federal Environmental Agency undertook a retrospective methodological change in the calculation of CO2 emissions. Due to new research findings, emission factors were updated and the separation in process and energy-related emissions were brought into line with the data of emissions trading. Therefore, the figures differ from those of previous years.
Sources:UBA [4]; DIW [40]; ZSW [3]
Between 1990 and 2005, energy-related CO2 emis-sions were cut by around 15 %; total energy-related greenhouse gas emissions were cut by around 16 % up to the year 2004.
Energy-related emissions of sulphur dioxide were reduced by around 90 % between 1990 and 2004.
CO2
[million t] [1,000 t] [1,000 t] [million t] [1,000 t] [1,000 t] [1,000 t] [1,000 t] [1,000 t] [1,000 t] [1,000 t]
1990 946 1,513 25 985 5,231 2,727 15 7,185 11,413 2,174 2,364
1991 916 1,425 24 953 3,835 2,513 16 5,646 9,252 1,684 740
1992 872 1,288 24 906 3,144 2,366 17 4,855 7,971 1,462 427
1993 864 1,325 23 899 2,785 2,263 18 4,429 7,215 1,209 276
1994 844 1,199 23 877 2,326 2,124 19 3,874 6,263 937 188
1995 840 1,141 23 871 1,641 2,027 18 3,121 5,785 832 154
1996 867 1,125 23 898 1,361 1,945 19 2,788 5,512 745 146
1997 833 1,117 22 863 1,130 1,874 20 2,509 5,426 683 142
1998 826 1,011 22 854 887 1,837 20 2,241 5,061 619 130
1999 804 1,062 22 833 709 1,811 20 2,045 4,726 549 127
2000 803 995 22 831 563 1,749 20 1,855 4,386 465 123
2001 821 941 22 847 564 1,661 20 1,795 4,110 434 120
2002 808 931 21 834 528 1,575 19 1,698 3,849 394 117
2003 814 888 22 839 530 1,506 19 1,649 3,730 362 115
2004 805 771 21 828 505 1,457 18 1,588 3,515 339 114
CO
2 e
qu
ivale
nt1)
SO
2 e
qu
ivale
nt3
)
CH4 N2O SO2 NOX2) NH3 CO NMVOC Dust
4) 2005 786 N/A N/A N/A N/A N/A N/A N/A N/A N/A N/A
16
energy-related emissions
1) Public electricity and heat supply, district heat plants as well as industrial combustion and industrial power plants of mineral oil processing, the extraction and production of solid fuels and other energy industries
Source: UBA [4]
1)
1990 1991 1992 1993 1994 1995 1996 1997 1998 1999 2000 2001 2002 2003
0
50
100
150
200
250
300
350
400
450
]m
illio
n t
[
Industry
Transport
Household and small consumers
Energy industry
2004
0
500
1.000
1.500
2.000
2.500
3.000
3.500
1990 1991 1992 1993 1994 1995 1996 1997 1998 1999 2000 2001 2002 2003 2004
]1,
00
0 t
[
Source: UBA [4]
Industry
Transport
Household and small consumers
Energy industry
Development of energy-related emissions, 1990 to 2005
Development of energy-related co2 emissions, 1990 to 2004
Development of energy-related So2 emissions, 1990 to 2004
0
500
1.000
1.500
2.000
2.500
3.000
3.500
1990 1991 1992 1993 1994 1995 1996 1997 1998 1999 2000 2001 2002 2003 2004
]1,
00
0 t
[
Source: UBA [4]
Industry
Transport
Household and small consumers
Energy industry
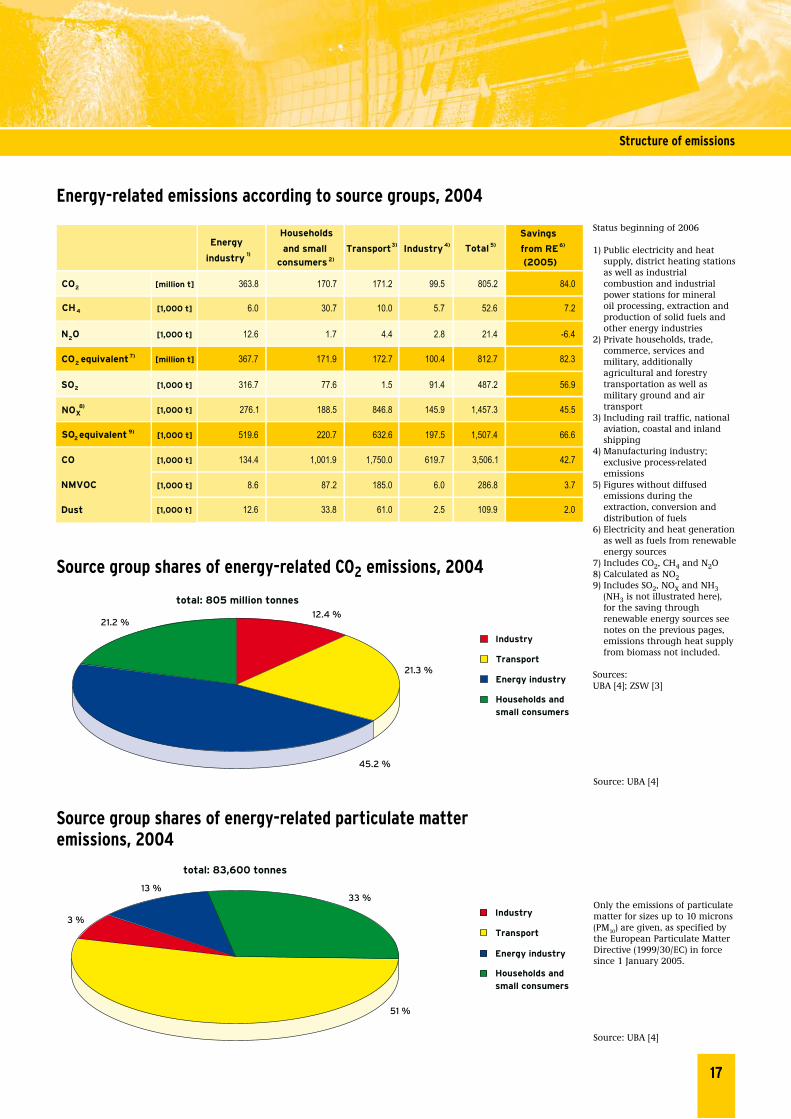
energy-related emissions according to source groups, 2004
Source group shares of energy-related co2 emissions, 2004
Source group shares of energy-related particulate matter emissions, 2004
Status beginning of 2006
1) Public electricity and heat supply, district heating stations as well as industrial combustion and industrial power stations for mineral oil processing, extraction and production of solid fuels and other energy industries 2) Private households, trade, commerce, services and military, additionally agricultural and forestry transportation as well as military ground and air transport3) Including rail traffic, national aviation, coastal and inland shipping4) Manufacturing industry; exclusive process-related emissions5) Figures without diffused emissions during the extraction, conversion and distribution of fuels6) Electricity and heat generation as well as fuels from renewable energy sources7) Includes CO2, CH4 and N2O8) Calculated as NO29) Includes SO2, NOX and NH3 (NH3 is not illustrated here), for the saving through renewable energy sources see notes on the previous pages, emissions through heat supply from biomass not included.
Sources: UBA [4]; ZSW [3]
45.2 %
21.3 %
12.4 %21.2 %
total: 805 million tonnes
Industry
Transport
Energy industry
Households and small consumers
17
Structure of emissions
CO2 [million t] 363.8 170.7 171.2 99.5 805.2 84.0
CH4 [1,000 t] 6.0 30.7 10.0 5.7 52.6 7.2
N2O [1,000 t] 12.6 1.7 4.4 2.8 21.4 -6.4
CO2 equivalent7) [million t] 367.7 171.9 172.7 100.4 812.7 82.3
SO2 [1,000 t] 316.7 77.6 1.5 91.4 487.2 56.9
NOX8)
[1,000 t] 276.1 188.5 846.8 145.9 1,457.3 45.5
SO2 equivalent 9) [1,000 t] 519.6 220.7 632.6 197.5 1,507.4 66.6
CO [1,000 t] 134.4 1,001.9 1,750.0 619.7 3,506.1 42.7
NMVOC [1,000 t] 8.6 87.2 185.0 6.0 286.8 3.7
Dust [1,000 t] 12.6 33.8 61.0 2.5 109.9 2.0
Total 5)
Savings
from RE6)
(2005)
Energy
industry 1)
Households
and small
consumers 2)
Transport3) Industry 4)
Only the emissions of particulate matter for sizes up to 10 microns (PM10) are given, as specified by the European Particulate Matter Directive (1999/30/EC) in force since 1 January 2005.
Source: UBA [4]
51 %
33 %13 %
3 %
total: 83,600 tonnes
Industry
Transport
Energy industry
Households and small consumers
Source: UBA [4]

turnover from the construction of plants for the use of renewable energy sources, 2005
This primarily concerns the construction of new plants and to a small extent the expansion or upgrading of existing plants, such as the reactivation of old hydropower plants.
turnover from the operation of plants for the use of renewable energy sources, 2005
In the case of electricity generation, turnover is generated from the feed-in fees payable under the Renewable Energy Sources Act or from the price attainable on the open electricity market, and in the case of fuel, from the sale of biofuels. For heat generation, turnover only refers to the sale of fuels, i.e. as a rule wood, since in the majority of cases the heat produced is not sold, but used internally.
Total: approx. EUR 9 bn
EUR 1,600 m(17.7 %)
EUR 750 m(8.3 %)
EUR 3,000 m(33.2 %)
EUR 270 m(3.0 %)
EUR 70 m(0.8 %)
EUR 1,250 m(13.8 %)
EUR 2,100 m(23.2 %)
Hydropower
Geothermal energy
Solar thermal energy
Biomass electricity
Biogenic heat
1)
Wind
Photovoltaics
Estimate
1) Large installations and heat pumps
Source: ZSW [3]
18
turnover
Hydropower
Geothermal energy
Biofuels
Biomass electricity
Biogenic solid fuels1)
WindTotal: approx. EUR 7.4 bn
EUR 1,100 m(14.9 %)
EUR 500 m (6.8 %)
EUR 1,800 m(24.3 %)
EUR 1,100 m(14.9 %)
EUR 500 m (6.8 %)
EUR 2,400 m(32.4 %)
Photovoltaics
Estimate
1) Only fuels used exclusively for the supply of heat
For explanatory comments cf. Appendix, No. 7.
Source: ZSW [3]
EUR 0.03 m(<0.1 %)

total turnover with renewable energy sources, 2005
employment effects from the use of renewable energy sources
Renewable energies are a job creator for Germany. Their continuous expansion in Germany has led to a noticeable growth in employment.
In 2004, 157,000 jobs could be assigned to the renewables sector. The branch with the largest employment is still wind power (64,000 jobs). This is followed by the biomass branch (57,000 jobs) – including the employment effects created by the demand for biogenic fuels and biofuels – and the solar industry (25,000 jobs), which have both recently grown faster than the wind power branch in view of the activated employment impetus. Hydropower and geothermal energy are responsible for approximately 11,000 jobs. These figures are based on an ongoing BMU research project which conducted a broad survey of companies in summer 2005 to indicate the flow of goods and services in the various branches of the renewable energies sector.
Due to the broad empirical database, the results only have limited comparability to previous employment figures of renewable energy sources.
In 2005, the employment effect can be estimated at approximately 170,000. That equals a rise of almost 10 % compared to 2004.
19
total turnover/jobs
Wind
Geothermie1)
Wasserkraft
Solarenergie2)
Biomasse
gesamt: ca. 11,6 Mrd. EUR
2.300 Mio. EUR(19,8 %)
900 Mio. EUR
(7,8 %)
200 Mio. EUR
(1,7 %)
4.600 Mio. EUR
(39,7 %)
3.600 Mio. EUR
(31,0 %)
Wind
Geothermal energy
Hydropower
Solar energy
Biomass
Total 2004: approx. 157,000 jobs
6 %1 %
16 %
36 %41 %
Source: BMU [64]
Wind
Geothermal energy 1)
Hydropower
Solar energy 2)
Biomass
Total: approx. EUR 16.4 bn
EUR 4,250 m(25.9 %)
EUR 1,170 m
(7.1 %)
EUR 270 m
(1.6 %)
EUR 4,500 m
(27.4 %)
EUR 6,250 m
(38.0 %)
Estimate
1) Large installations and heat pumps2) Photovoltaics and solar thermal energy
Source: ZSW [3]
Wind
Geothermal energy 1)
Hydropower
Solar energy 2)
Biomass
Total: approx. EUR 16.4 bn
EUR 4,250 m(25.9 %)
EUR 1,170 m
(7.1 %)
EUR 270 m
(1.6 %)
EUR 4,500 m
(27.4 %)
EUR 6,250 m
(38.0 %)
Estimate
1) Large installations and heat pumps2) Photovoltaics and solar thermal energy
Source: ZSW [3]

Support programmes for renewable energy sources
The Federal Government supports renewable energies through research and development as well as various measures for market development. The main impact on the electricity market has been from the Renewable Energy Sources Act, while biofuels for the transportation sector profit from the mineral oil tax exemption under the eco-tax reform. In future the market launch of biofuels will be supported with a compulsory blending regulation. The Market Incentive Programme for the support of measures for the utilisation of renewable energy sources, which is also financed through the eco-tax reform, serves primarily for the expansion of heat generation from biomass, solar power and geothermal energy. In 2005 around 193 million euros were allocated to this.Smaller installations of private investors are supported with grants, larger installations with loans at a reduced rate of interest and partial debt acquittal. Details of the support are stated in the support guidelines.In the residential sector the main focus is especially on the promotion of solar thermal collector systems and biomass heaters (pellet systems and wood gasification boilers). Furthermore, biogas plants (limited until the end of 2006) as well as plants for the utilisation of solid biomass and geothermal energy are supported, in part with district heating systems. In the course of the programme, the support guidelines were repeatedly adjusted to market development.
As of March 2006, new support guidelines apply to the Market Incentive Programme (guidelines of 14 March 2006). The increases in prices for fossil energy generation led to the clear decrease of the additional costs of renewables. Therefore it was possible to lower the grants for solar facilities, pellet and wood gasification boilers by 20 % in comparison to the 2005 guidelines without affecting the attractiveness of the support programme. The new rates allow the support of considerably more facilities than in previous years and a corresponding market growth. In future too, market developments will be quickly met with new guidelines to assure the efficient use of the federal budgetary funds.
In the building sector, the Reconstruction Loan Corporation (KfW) has attractive financing programmes. These also include the use of renewable energy sources and the conversion of heating systems. Furthermore, investment credits are granted for photovoltaic systems (“solar power generation”), for the new construction of energy-saving houses (“ecological construction”) and for modernisation measures in the housing inventory (“housing modernisation”) (further information under: www.kfw-foerderbank.de).
Information on the grants under the Market Incentive Programme is issued by the Federal Office of Economics and Export Control (BAFA), phone: +49 (0)6196 908-625 (www.bafa.de).
Questions on the granting of low-cost loans for commercial or municipal applicants are answered by the Reconstruction Loan Corporation (KfW) information centre, phone: +49 (0)1801 335577 (www.kfw-foerderbank.de).In addition, whoever wishes to access comprehensive energy consultation for older residential buildings will receive a grant for the cost of the advice (programme “local consultations to save energy” www.bafa.de).
Support at federal level is supplemented by numerous measures in different federal states and local authorities. The nationwide campaign “climate seeks protection” provides on overview at www.klimasuchtschutz.de, where information regarding energy saving in the household can also be found.
In cooperation with the BINE information service (www.bine.info) the Federal Environment Ministry has published an extensive brochure about all support possibilities at EU, national, state and local level as well as those of energy supply companies (www.bmu.de/klimaschutz/).
A comprehensive database on support is provided by the Federal Ministry of Economics and Technology (http://db.bmwi.de).
20
Market launch of renewable energy sources

the Market incentive programme
The Market Incentive Programme for the promotion of measures for the utilisation of renewable energies, which is financed through the ecological tax reform, supports the construction of plants for generating heat and/or electricity from renewable energy sources. The programme for the market launch of heat generating technologies is particularly important. From the beginning of the programme up to the end of 2005, over 421,500 solar collectors with an area of 3.6 million square metres and over 60,000 small biomass boilers were installed.
The Reconstruction Loan Corporation (KfW Kreditanstalt für Wiederaufbau) grants supplementary loans for biogas plants, larger plants for the incineration of solid biomass and plants for the utilisation of geothermal energy. Between 2000 and 2005 2,567 loans amounting to 741 million euros were approved. Since the beginning of the programme more than 485,000 investment projects for the use of renewable energies have been promoted by the Market Incentive Programme.
Since the beginning of the programme in the year 2000, funds amounting to 665.4 million euros have triggered an investment volume of almost 5 billion euros, of which approximately 3.2 billion euros were used for solar collectors and 0.96 billion euros for small biomass facilities. In 2005, approximately one third of the calculatory revenue from the taxation of electricity from renewables, amounting to 659 million euros, went into the Federal Market Incentive Programme. As from March 2006, new support guidelines apply to the Market Incentive Programme (see page 20).
number of installations supported with investment grants
BiofuelsSince 1 January 2004, also biogenic blend fractions of e.g. biodiesel, bioethanol or bio-ETBE in fossil fuels are exempt from the mineral oil tax in Germany, alongside the already exempt biogenic undiluted fuels.Directly after this the petroleum industry began adding biodiesel to fossil diesel fuel in noticeable amounts up to the permitted maximum of 5 %. In 2005 the share of biogenic fuels in the fuel supply was approx. 3.6 % and increased considerably compared to the previous year’s figure. Worldwide Germany is the largest biodiesel producer. Plant capacity for the production of biodiesel increased tenfold in the last 10 years. Compared with biodiesel the significance of bioethanol and vegetable oil as a fuel was still low last year.
In the long term, development will move towards second generation biofuels. Second generation biofuels are to be understood as fuels that can access a wider raw material basis thus noticeably increasing the potential of biofuels compared to today. Furthermore, a wider raw material basis leads to a considerably better CO2 balance than is possible for biofuels of the first generation.
BTL (Biomass-to-liquid) and bioethanol that is obtained by enzymatical decomposition of cellulose belong to the second generation of biofuels.
2000 2001 2002 2003 2004
0
100,000
200,000
300,000
400,000
500,000
Total per annum
Total accumulated
2005
Status December 2005
Market launch of renewable energy sources
21

Research and development
Research and development for renewable energies technology
Research and development projects for the use of renewable energy sources can be promoted through the Energy Research Programme of the Federal Government. The necessary cost-cutting and the degression of the payment rates for renewable electricity as defined in the EEG have to be achieved, i.a. through technical innovation.The support of research is also significant with regard to job market policy. Companies based in Germany directly benefit from this and in turn so does employment security.
Main focus of research supportGoals and main focus of research support are• lowering costs for renewable energy systems, • ecologically sound and nature-friendly further development,• integration into the electricity grid and• quick technology transfer from research to the market.
In 2005, 102 new projects with a total volume of over 98 million euros were approved in the fields of photovoltaics, wind, geothermal, low temperature solar thermal energy, solar thermal power stations as well as overall strategy and overarching issues.
The main areas of research support lie in photovoltaics and wind energy. In photovoltaics research and development activities are required because the EEG fees show the highest degression and corresponding cost reductions have to be achieved. Moreover the largest innovation potential exists here. Ultimately it is a matter of securing the international leading position of German photovoltaics research and improving the competitiveness of German companies on a rapidly growing global market.
The high significance of wind energy research arises from the major technical challenge especially in the offshore sector and the research need as regards the environmentally sound development of the potential. At the same time, the integration of wind power into the grid plays a deciding role.
In other fields research support is also being carried forward on a high level. To achieve the ambitious expansion goals of the Federal Government, all renewable energy sources are needed. For geothermal energy the emphasis is on demonstrating the economic feasibility of geothermal electricity generation in various geological formations – the Upper Rhine Graben, the South German Molasse Basin and the North German Basin. An overview of the ongoing research projects can be found under www.erneuerbare-energien.de/inhalt/36049/.
approved, ongoing and completed projects 2005
1) Of these 169 individual schemes within the scope of the 250 MW wind energy programme2) Of these 122 individual schemes within the scope of the 250 MW wind energy programme
[number] [1,000 EUR] [number] [1,000 EUR] [number] [1,000 EUR]
Photovoltaics 21 32,277 115 119,912 38 30,311
Wind 24 22,649 226 1) 74,711 130 34,725
Geothermal energy 11 18,027 31 41,982 7 12,454
Low temperature
solar thermal energy12 3,903 42 21,629 4 1,896
Solar thermal
electricity generation 20 7,531 46 17,961 10 2,028
Cross-sectoral research and other 14 13,632 21 17,268 3 9,019
Total 102 98,019 481 293,463 192 90,433
newly approved projects current projects completed projects
2)
22

Feed-in and fees under the electricity Feed act and the Renewable energy Sources act (eeG)
On 1 April 2000, the Electricity Feed Act was replaced by the Renewable Energy Sources Act (EEG), with improved fees. Around two-thirds of the total electricity subject to the fixed rates is currently attributable to electricity from wind power and only 2 % to electricity from photovoltaics. In 2004 for the first time, fees were paid under the EEG for geothermal electricity, following commencement of operations of the first geothermal electricity generating plant in Germany. About 80 % of electricity from hydropower derives from older plants with more than 5 MW capacities. This electricity is not covered by the fees under the EEG.
The contribution of private generators to the electricity supply through renewable energies is very high. According to the VDEW [21], about 37 TWh of electricity were provided in 2005.
Structure of electricity volumes paid for under the eeG
1) Body of the year: 01.04. - 31.12.20002) Figures 2005 adjusted on the basis of the VDN prognosis from 04.11.2005 particularly as a result of lower electricity production of wind power in 2005 (estimated 26,500 GWh instead of 29,593 GWh) and an upper electricity production of biomass paid for under
the EEG (estimated 8,330 GWh instead of 6,993 GWh). Final values with certificate of a chartered accountant will presumably be available in October 2006. The figures of the previous years correspond with the year statements (certificates of the chartered accountant)3) Due to the equalisation provision (Art. 16 EEG) privileged end consumption (since July 2003)4) Quota for not privileged end consumption5) Landfill, sewage and pit gas first mentioned in 2005, only for additional generation
Sources: acc. to VDN [9]; ZSW [3]
2004 for first time fee taking into consideration the avoided grid usage fee
1) Private and public feed-in2) Estimation
Sources: VDEW [55]; VDN [9]; ZSW [3]
23
Stromeinspeisungsgesetz/eeG
Feed-in under the EEG1)
Feed-in under the Electricity Feed Act
Fees
1.3 1.6 2.3
4.86.8 7.9
3.5
25.0
28.5
38.5
18.1
10.4
0
5
10
15
20
25
30
35
40
1991 1992 1993 1994 1995 1996 1997 1998 1999 2000 2001 2002 2003 2004 2005
2)
][
0
500
1,000
1,500
2,000
2,500
3,000
3,500
4,000
][
13.9
EU
R m
TW
h
4,50045 43.7
1.02.8 3.7
Total fee [bill. EUR] 0.88 1.58 2.22 2.60 3.61 4.19
1)2000 2001 2002 20032)2004
Total end consumption [GWh] 344,663 464,286 465,346 478,016 487,627 483,886
Privileged end consumption
3) [GWh] - - - 6,552 36,865 60,633
EEG electricity quantity Total [GWh] 10,391 18,145 24,970 28,496 38,511 43,690
Hydropower, gases
5)
[GWh] - 6,088 6,579 5,874 7,205 7,711
Biomass [GWh] - 1,472 2,442 3,469 5,241 8,330
Geothermal en. [GWh] - - - - 0.2 0.2
Wind energy [GWh] - 10,509 15,786 18,859 25,509 26,500
Solar irradiation energy
[GWh] - 76 162 294 557 1,002
EEG quota4) [%] 3.01 3.91 5.37 6.03 8.48 10.0
Average fee [ct/kWh] 8.50 8.69 8.91 9.14 9.29 9.58
2005
Gases [GWh] 147
Feed-in under the EEG1)
Feed-in under the Electricity Feed Act
Fees
1.3 1.6 2.3
4.86.8 7.9
3.5
25.0
28.5
38.5
18.1
10.4
0
5
10
15
20
25
30
35
40
1991 1992 1993 1994 1995 1996 1997 1998 1999 2000 2001 2002 2003 2004 2005
2)
][
0
500
1,000
1,500
2,000
2,500
3,000
3,500
4,000
][
13.9
EU
R m
TW
h
4,50045 43.7
1.02.8 3.7
electricity Feed act/eeG

24
costs for the electricity consumer
costs for the electricity consumer
Today, electricity from renewable energy sources is still more expensive than that from conventional energy sour-ces1). Its average additional costs (EEG apportionment) per kilowatt hour electricity are calculated as follows:
The EEG average fee and the EEG quota are being published by the Association of German network operators (VDN) firstly as prognoses and will be finalised by 31 October of the following year in the annual statement. The avoided electricity purchase price that is due to the EEG feed-in has to be approximately determined because as yet no solid database exists. The published figures concerning the level of the EEG apportionment at times diverge clearly from each other because different assumptions are made.In a research project of the BMU concerning the expansion of renewable energy sources until 2020 [6], the value of the avoided electricity purchase price is set e.g. for 2005 at 4.3 cents per kWh. With a provisional EEG quota of 10 % (for not privileged end users according to Art. 16 EEG) and a provisional average fee of 9.58 cents per kWh, the EEG apportionment provisionally amounts to approximately 0.53 cents per kWh2).
expected development of monthly eeG apportionment of an average household
With a provisional EEG electricity amount of approximately 43.7 TWh, the EEG causes additional costs of approxi-mately 2.3 billion euros – noticeably less than the EEG fees of 4.2 billion euros paid to operators of EEG electricity generation plants. Therefore, the EEG only has a share of approximately 3 % of the costs for a kilowatt hour of household electricity in 2005 (on average 18.6 cents/kWh). Despite the further increasing feed-in of electricity from renewable energy sources, the share will not rise significantly in the future. For a household with 3,500 kWh of electricity consumption per year the EEG causes additional costs of approximately 1.55 euros per month. With a continuing vigorous expansion of renewable energies, these EEG related costs will peak at approximately 2.80 euros in the middle of the next decade and then fall again [6].
Average household: annual consumption of 3,500 kWh/a
Source: BMU [43]
Average electricity price of a 3-person household with an annual consumption of 3,500 kWh/a in Cent/kWhCHP Act Combined Heat and Power Act
Source: BMU [43]
1) A detailed description of the costs of renewable energy sources is given in the BMU publication “What electricity really costs”.2) If the avoided electricity purchase price were set to only 3.3 cents/kWh, the EEG apportionment would rise to approximately 0.63 cents/kWh.
composition of the electricity price in the household sector, 2005
1.00
1.25
1.50
1.75
2.00
2.25
2.50
2.75
3.00
2005 2006 2007 2008 2009 2010 2011 2012 2013 2014 2015 2016 2017 2018 2019 2020
EU
R/m
onth
Durchschnitts-Haushalt:
Jahresverbrauch von 3.500 kWh/a Quelle: BMU [43]
Electricity generation,transport and distribution
Turnover tax
CHP Act
Electricity tax (ecological tax)
Concession levy
total: 18.6 cents/kWh
60 %
EEG
14 %
10 %
11 %2 % 3 %
EEG apportionment = EEG quota x (EEG average fee - avoided energy purchase price )
Electricity generation,transport and distribution
Turnover tax
CHP Act
Electricity tax (ecological tax)
Concession levy
total: 18.6 cents/kWh
60 %
EEG
14 %
10 %
11 %2 % 3 %

Macroeconomic external costs
The costs of the EEG that were derived from the figures of the previous page are not sufficient for a comprehensive economic evaluation of renewable energy sources. As microeconomic dimensions, they do not reflect the fact that conventional electricity generation still causes significantly more environmental damage than electricity from renewable energy sources, despite all environmental progress in the last decades. These so-called external costs (negative external effects) are not yet incorporated into the electricity prices as required by the polluter pays principle.
According to a current scientific survey for the BMU [72], greenhouse gas emissions play a key role: the best estimate for the costs of climate damage arising from this can currently be set to 70 euros/t CO2. In addition, health and material damage caused by air pollutants are important, and, to a lesser extent, agricultural revenue losses. External costs for electricity generation from hard coal and lignite - even taking modern technology into consideration - amount to 6 to 8 cents/kWh. For modern, gas-fired gas and steam plants the external costs are still approximately 3 cents/kWh1).
In contrast, electricity generation from renewable energies causes comparatively minor external costs (generally under 0.5 cents/kWh; only photovoltaics at present approximately 1 cent/kWh). The construction and disposal of the plants are included in these calculations1).
external costs of electricity generation for various options
Under the – scientifically proven – assumption that the electricity paid for pursuant to the EEG at present fully displaces fossil generated electricity, the above mentioned survey estimates the external costs avoided in the electricity sector through renewables in 2005 to be at least 2.8 billion euros. This is considerably higher than the EEG expenditure for the promotion of renewables in the same period (according to the survey approximately 2.4 billion euros) and shows that the promotion of renewable energy sources through the EEG is worthwhile due to the avoided external costs alone. Numerous other strategic and economic advantages of renewable energy sources can be added.
25
Macroeconomic external costs
PV PhotovoltaicsSP steam plantGSP gas and steam plant
Source: BMU [72]
Greenhouse effect(70 euros/t CO2)
Air pollutants
0
1
2
3
4
5
6
7
8
PV (today)
][ C
ent/
kWh
9
PV (2030)
Run-of-river Windonshore
Windoffshore
LigniteSP 40%
LigniteGSP 48%
Hard coalSP 43%
Hard coalGSP 46%
Natural gasGSP 57%
1) Due to a lack of solid data, further external effects of fossil electricity generation (damage to biodiversity, ecosystems and supply security as well as geopolitical risks) can hardly be quantified. The values mentioned above are only a sub- total of the currently expected actual external costs.
Greenhouse effect(70 euros/t CO2)
Air pollutants
0
1
2
3
4
5
6
7
8
PV (today)
][ C
ent/
kWh
9
PV (2030)
Run-of-river Windonshore
Windoffshore
LigniteSP 40%
LigniteGSP 48%
Hard coalSP 43%
Hard coalGSP 46%
Natural gasGSP 57%

long-term utilisation potential of renewable energy sources for electricity, heat supply and fuel production
26
Utilisation potential
Due to varying assumptions regarding the availability of suitable locations, the technical characteristics of the utilising technologies, combined with a number of other factors, the results of potential estimates may vary considerably.The guideline values given here make particular allowance for the requirements of nature and landscape conservation, and hence represent the lower limits of the technically feasible potential.
The energetic use of biomass has a high degree of flexibility. Depending on requirements, therefore, the percentages allocated to the segments electricity, heat and fuel supply may vary. This is particularly applicable to the cultivation of energy crops (based here on a cultivation area of 4.2 million hectares).
Imports of energy sources on the basis of renewables not included in the figures.
1) excluding ocean energy2) Figures in relation to modular capacity (MWp), the corresponding A/C capacity is 106,000 MW3) Space heating, hot water and other process heat
Sources: Work group DLR, ifeu, WI [27]; Work group Öko-Institut, FhG-Umsicht, IE, ifeu, izes, TU Berlin, TU Braunschweig,TU München [38]; ZSW [3]
Utilisation Comments
2005 Yield Capacity
Electricity generation [TWh] [TWh/a] [MW]
Hydropower 21.5 24 5,200 Run-of-river plants and natural inflow to reservoirs
Wind energy
onshore 26.5 55 25,000
offshore - 110 30,000
Biomass 13.4 60 10,000 Generation partly in combined heat/power generation
Photovoltaics 1.0 105 115,000 2)Only suitable roof, facade and human settlement areas
Geothermal energy 0.0002 200 30,000 Bandwidth 66 - 290 TWh depending on heat
utilisation requirements (combined heat/power)
Total 62.5 554
10.2 % 91 %
Heat generation [TWh] [TWh/a]
Biomass 76.0 200 Including useful heat from combined heat/power generation
Geothermal energy 1.6 330 Only energy supply from hydrothermal sources
Solar thermal energy 3.0 290 Only suitable roof and human settlement areas
Total 80.6 820
Share in relation to final energy
5.3 % 54 %
Fuels [TWh] [TWh/a]
Biomass 22.3 60
Total 22.3 60
Share in relation to fuel consumption
of road traffic 2004 3.6 % 10 %
Share in relation to final
energy consumption 2004 6.4 % 56 %
Potential
electricity consumption 2005
consumption for heat3) 2003
Proportion in relation to gross
1)

Scenario for an intensified expansion of renewable energies
The scenario represents the potential development of energy supply up to the year 2050, facilitating an 80 % reduction in CO2 emissions compared with 1990 figures through the intensified expansion of renewable energies and a more efficient use of energy. It is hoped that by the year 2020, 12 % of primary energy consumption and 30 % of electricity generation can be met from renewable energy sources. By the year 2050, according to the scenario, the share of electricity generation from renewables will increase to 68 %, while the contribution of renewable energies to heat supply will increase to around 50 %.
Development of primary energy consumption and co2 emissions up to 2050
Development of electricity generation up to 2050
Development of heat supply up to 2050
Sources: DLR, ifeu, WI [27] ; AGEB [1]
27
Scenario of increased expansion
RES, domestic & imported
Natural gas
Mineral oil
Coal
Nuclear energy
CO2 emissions
0
100
200
300
400
500
600
2004 2010 2020 2030 2040 2050
Geothermal energy
Solar collector
Biomass
District heating
Electricity
Gas
Coal, oil
0
200
400
600
800
1,000
1,200
1,400
1,600
0
2,000
4,000
6,000
8,000
10,000
12,000
14,000
16,000
2004 2010 2020 2030 2040 2050
][
0%
20%
40%
60%
80%
100%
Imported RES
Photovoltaics
Geothermal energy
Wind
Hydropower
Biomass
CHP fossil
Coal/gas
Nuclear energy
PJ/a
][T
Wh
/a
C0
2 e
mis
sion
s (1
99
0 =
10
0 %
)
][T
Wh
/a
2004 2010 2020 2030 2040 2050
700
RES renewable energy sources
Sources: DLR, ifeu, WI [27]; AGEB [1]
From 2030 including the electricity needed for the generation of hydrogen (2050: 70 TWh/a)
CHP Combined heat/ power generation
Sources: DLR, ifeu, WI [27] ; AGEB [1]
RES, domestic & imported
Natural gas
Mineral oil
Coal
Nuclear energy
CO2 emissions
0
100
200
300
400
500
600
2004 2010 2020 2030 2040 2050
Geothermal energy
Solar collector
Biomass
District heating
Electricity
Gas
Coal, oil
0
200
400
600
800
1,000
1,200
1,400
1,600
0
2,000
4,000
6,000
8,000
10,000
12,000
14,000
16,000
2004 2010 2020 2030 2040 2050
][
0%
20%
40%
60%
80%
100%
Imported RES
Photovoltaics
Geothermal energy
Wind
Hydropower
Biomass
CHP fossil
Coal/gas
Nuclear energy
PJ/a
][T
Wh
/a
C0
2 e
mis
sion
s (1
99
0 =
10
0 %
)
][T
Wh
/a
2004 2010 2020 2030 2040 2050
700
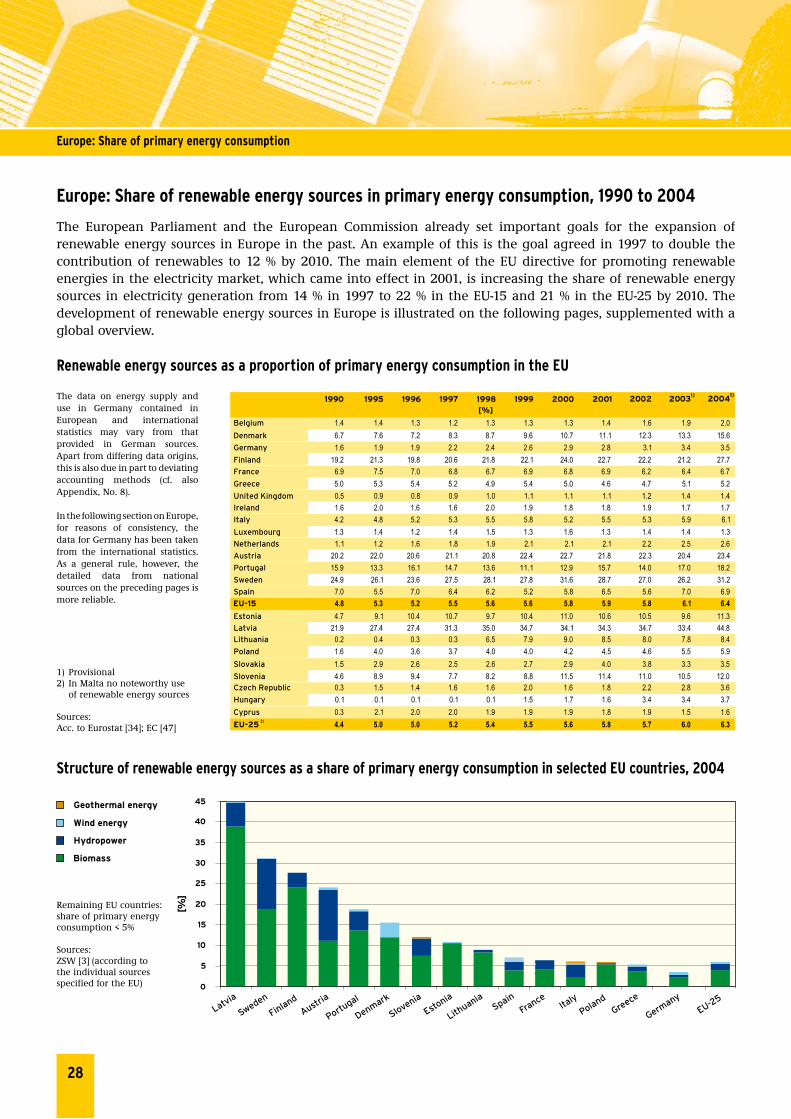
The data on energy supply and use in Germany contained in European and international statistics may vary from that provided in German sources. Apart from differing data origins, this is also due in part to deviating accounting methods (cf. also Appendix, No. 8).
In the following section on Europe, for reasons of consistency, the data for Germany has been taken from the international statistics. As a general rule, however, the detailed data from national sources on the preceding pages is more reliable.
28
europe: Share of primary energy consumption
Geothermal energy
Wind energy
Hydropower
Biomass
0
5
10
15
20
25
30
35
40
]%[
Latvia
Sweden
Austria
Finland
Portugal
Denmark
Slovenia
Estonia
Lithuania
France
PolandIta
lyGreece
EU-25
45
Germany
Spain
Remaining EU countries: share of primary energy consumption < 5%
Sources: ZSW [3] (according to the individual sources specified for the EU)
1) Provisional2) In Malta no noteworthy use of renewable energy sources
Sources:Acc. to Eurostat [34]; EC [47]
1990 1995 1996 1997 1998 1999 2000 2001 2002 2003
Belgium 1.4 1.4 1.3 1.2 1.3 1.3 1.3 1.4 1.6 1.9 2.0
Denmark 6.7 7.6 7.2 8.3 8.7 9.6 10.7 11.1 12.3 13.3 15.6
Germany 1.6 1.9 1.9 2.2 2.4 2.6 2.9 2.8 3.1 3.4 3.5
Finland 19.2 21.3 19.8 20.6 21.8 22.1 24.0 22.7 22.2 21.2 27.7
France 6.9 7.5 7.0 6.8 6.7 6.9 6.8 6.9 6.2 6.4 6.7
Greece 5.0 5.3 5.4 5.2 4.9 5.4 5.0 4.6 4.7 5.1 5.2
United Kingdom 0.5 0.9 0.8 0.9 1.0 1.1 1.1 1.1 1.2 1.4 1.4
Ireland 1.6 2.0 1.6 1.6 2.0 1.9 1.8 1.8 1.9 1.7 1.7
Italy 4.2 4.8 5.2 5.3 5.5 5.8 5.2 5.5 5.3 5.9 6.1
Luxembourg 1.3 1.4 1.2 1.4 1.5 1.3 1.6 1.3 1.4 1.4 1.3
Netherlands 1.1 1.2 1.6 1.8 1.9 2.1 2.1 2.1 2.2 2.5 2.6
Austria 20.2 22.0 20.6 21.1 20.8 22.4 22.7 21.8 22.3 20.4 23.4
Portugal 15.9 13.3 16.1 14.7 13.6 11.1 12.9 15.7 14.0 17.0 18.2
Spain 7.0 5.5 7.0 6.4 6.2 5.2 5.8 6.5 5.6 7.0 6.9
EU-15 4.8 5.3 5.2 5.5 5.6 5.6 5.8 5.9 5.8 6.1 6.4
Estonia 4.7 9.1 10.4 10.7 9.7 10.4 11.0 10.6 10.5 9.6 11.3
Latvia 21.9 27.4 27.4 31.3 35.0 34.7 34.1 34.3 34.7 33.4 44.8Lithuania 0.2 0.4 0.3 0.3 6.5 7.9 9.0 8.5 8.0 7.8 8.4
Poland 1.6 4.0 3.6 3.7 4.0 4.0 4.2 4.5 4.6 5.5 5.9
Slovakia 1.5 2.9 2.6 2.5 2.6 2.7 2.9 4.0 3.8 3.3 3.5
Slovenia 4.6 8.9 9.4 7.7 8.2 8.8 11.5 11.4 11.0 10.5 12.0Czech Republic 0.3 1.5 1.4 1.6 1.6 2.0 1.6 1.8 2.2 2.8 3.6
Hungary 0.1 0.1 0.1 0.1 0.1 1.5 1.7 1.6 3.4 3.4 3.7
Cyprus 0.3 2.1 2.0 2.0 1.9 1.9 1.9 1.8 1.9 1.5 1.6
EU-25 4.4 5.0 5.0 5.2 5.4 5.5 5.6 5.8 5.7 6.0 6.3
[%]
1)
2)
20041)
Sweden 24.9 26.1 23.6 27.5 28.1 27.8 31.6 28.7 27.0 26.2 31.2
Structure of renewable energy sources as a share of primary energy consumption in selected eU countries, 2004
Geothermal energy
Wind energy
Hydropower
Biomass
0
5
10
15
20
25
30
35
40
]%[
Latvia
Sweden
Austria
Finland
Portugal
Denmark
Slovenia
Estonia
Lithuania
France
PolandIta
lyGreece
EU-25
45
Germany
Spain
europe: Share of renewable energy sources in primary energy consumption, 1990 to 2004
The European Parliament and the European Commission already set important goals for the expansion of renewable energy sources in Europe in the past. An example of this is the goal agreed in 1997 to double the contribution of renewables to 12 % by 2010. The main element of the EU directive for promoting renewable energies in the electricity market, which came into effect in 2001, is increasing the share of renewable energy sources in electricity generation from 14 % in 1997 to 22 % in the EU-15 and 21 % in the EU-25 by 2010. The development of renewable energy sources in Europe is illustrated on the following pages, supplemented with a global overview.
Renewable energy sources as a proportion of primary energy consumption in the eU

29
europe: Use of renewable energy sources
Remaining EU countries: energy supply from renewable energy sources < 15 TWh; solar energy negligible
Source:See table below
1) Electricity and heat generation from solid biomass, biogas and biogenic proportion of waste as well as biofuels; missing figures substituted by previous year value2) Missing figures for EU accession countries substituted by previous year value; for pumped storage stations only generation from natural inflow3) Heat and electricity generation; electricity generation in Italy 5.4 TWh, Portugal 0.08 TWh, France 0.03 TWh, Austria 0.002 TWh. In 2003, geothermal electricity was produced for the first time in Germany 4) Glazed and unglazed collectors; conversion factor 0.7 kWth/m2
5) Photovoltaics including plants in overseas departments6) Total includes 7.1 TWh (25.6 PJ) of solarthermal energy and 0.73 TWh (2.6 PJ) of photovoltaics
Sources: Biomass: Eurostat [52]; Observ’ER [53] ; IEA [31]Hydropower: IEA [31]; EIA [33]Wind power: Observ’ER [46]Geothermal energy: IEA [31]; Lund [62];Eurostat [34]; Observ’ER [67]Solarthermal energy: Observ’ER [36]Photovoltaics: Observ’ER [37]; Eurostat [52]
Use of renewable energy sources in selected eU countries, 2004
Use of renewable energy sources area/ installedin the eU, 2004 capacity in 2004
Geothermal energy
Wind energy
Hydropower
Biomass
0
20
40
60
80
100
120
140
160
] F
inal en
ergy
T
Wh
[
Sweden
Austria
Finland
Portugal
Denmark
United Kingdom
France
Poland Ita
ly
Greece
180
Germany
Spain
200 Geothermal energy
Wind energy
Hydropower
Biomass
0
20
40
60
80
100
120
140
160
] F
inal en
ergy
T
Wh
[
Sweden
Austria
Finland
Portugal
Denmark
United Kingdom
France
Poland Ita
ly
Greece
180
Germany
Spain
200
Bio-
mass1)
Hydro-
power2)
Wind
energy
Geothermal
energy3)
Total
Photo-
voltaics5)
[1,000 m2] [MWth] [kWp]
Belgium 6.4 0.3 0.13 0.01 6.9 52 36 1,461
Denmark 22.2 0.0 6.61 0.02 28.8 328 230 2,245
Germany 76.3 20.6 25.00 1.56 123.5 6,199 4,339 794,000
Finland 74.2 14.9 0.12 - 89.3 12 9 3,702
France 119.9 59.7 0.61 1.53 181.7 793 555 20,119Greece 10.7 4.6 1.04 0.01 16.4 2,827 1,979 4,544
United Kingdom 13.4 5.0 1.94 0.01 20.3 176 123 7,803
Ireland 1.8 0.6 0.66 - 3.1 8 5 100
Italy 22.9 41.3 1.83 7.96 73.9 458 320 30,300
Luxembourg 0.3 0.1 0.04 - 0.4 12 8 26,000
Netherlands 5.5 0.1 1.88 - 7.5 504 353 47,740
Austria 34.6 37.4 1.20 0.23 73.4 2,400 1,680 19,833
Portugal 30.1 9.9 0.78 0.10 40.9 109 76 2,275
Sweden 94.3 64.2 0.85 - 159.3 225 157 4,140
Spain 49.6 31.6 14.18 0.09 95.4 440 308 38,696
EU-15 562.1 290.4 56.85 11.52 920.9 14,542 10,179 1,002,958
Estonia 4.8 0.006 0.04 - 4.9 1 0 2Latvia 11.8 2.1 0.05 - 14.0 2 1 4Lithuania 6.9 0.3 0.001 - 7.2 2 1 17
Poland 45.9 2.1 0.14 1.70 49.8 95 66 234Slovakia 3.6 4.1 0.004 0.02 7.6 57 40 60
Slovenia 5.1 3.1 - 0.17 8.4 102 71 88Czech Republic 10.7 2.0 0.01 0.02 12.7 50 35 363
Hungary 9.5 0.2 0.01 0.95 10.7 48 34 138
Cyprus 0.1
EU-25 660.5 304.3 57.10 14.39 1,044.2 15,362 10,754 1,004,063
EU-25 2,377.9 1,095.5 205.6 51.8 3,759.0
Final energy [TWh]
Final energy [PJ]
Solar thermal
energy4)
- - - 0,1 450 315 1906)
6)
Malta - - - - - 15 11 9
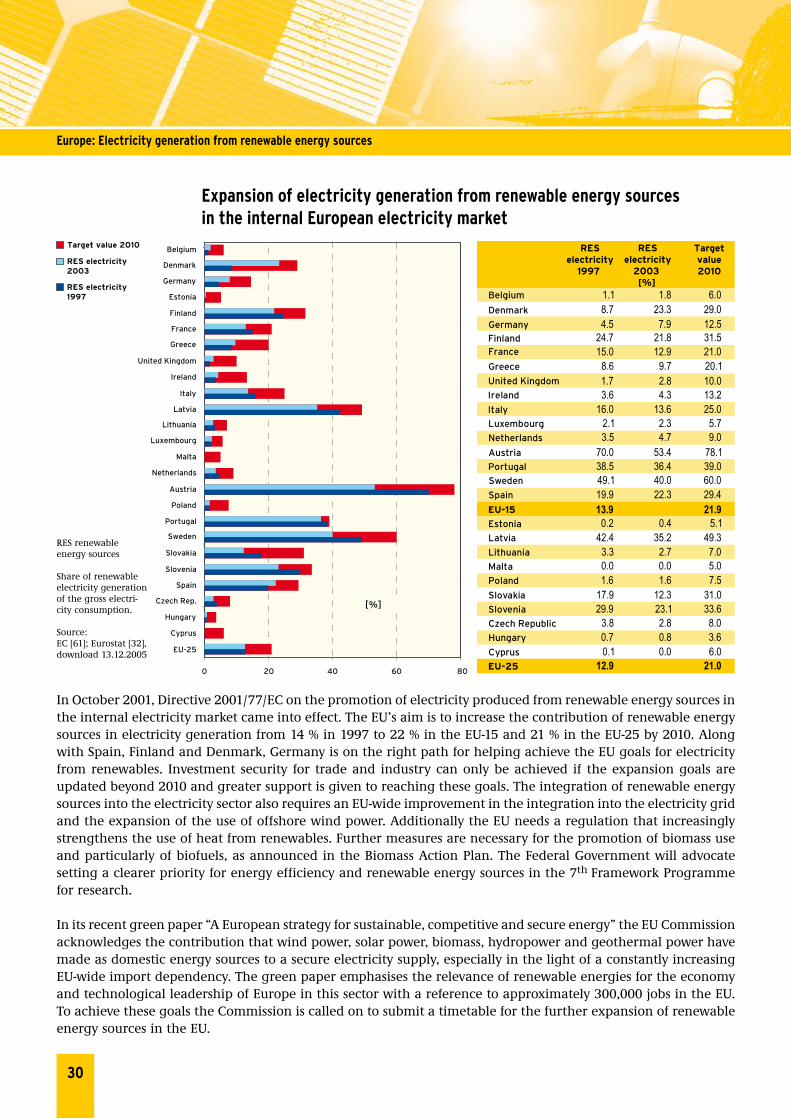
expansion of electricity generation from renewable energy sources in the internal european electricity market
In October 2001, Directive 2001/77/EC on the promotion of electricity produced from renewable energy sources in the internal electricity market came into effect. The EU’s aim is to increase the contribution of renewable energy sources in electricity generation from 14 % in 1997 to 22 % in the EU-15 and 21 % in the EU-25 by 2010. Along with Spain, Finland and Denmark, Germany is on the right path for helping achieve the EU goals for electricity from renewables. Investment security for trade and industry can only be achieved if the expansion goals are updated beyond 2010 and greater support is given to reaching these goals. The integration of renewable energy sources into the electricity sector also requires an EU-wide improvement in the integration into the electricity grid and the expansion of the use of offshore wind power. Additionally the EU needs a regulation that increasingly strengthens the use of heat from renewables. Further measures are necessary for the promotion of biomass use and particularly of biofuels, as announced in the Biomass Action Plan. The Federal Government will advocate setting a clearer priority for energy efficiency and renewable energy sources in the 7th Framework Programme for research.
In its recent green paper “A European strategy for sustainable, competitive and secure energy” the EU Commission acknowledges the contribution that wind power, solar power, biomass, hydropower and geothermal power have made as domestic energy sources to a secure electricity supply, especially in the light of a constantly increasing EU-wide import dependency. The green paper emphasises the relevance of renewable energies for the economy and technological leadership of Europe in this sector with a reference to approximately 300,000 jobs in the EU. To achieve these goals the Commission is called on to submit a timetable for the further expansion of renewable energy sources in the EU.
30
europe: electricity generation from renewable energy sources
RESelectricity
1997
Targetvalue2010
Belgium 1.1 1.8 6.0Denmark 8.7 23.3 29.0Germany 4.5 7.9 12.5Finland 24.7 21.8 31.5France 15.0 12.9 21.0Greece 8.6 9.7 20.1United Kingdom 1.7 2.8 10.0Ireland 3.6 4.3 13.2Italy 16.0 13.6 25.0Luxembourg 2.1 2.3 5.7Netherlands 3.5 4.7 9.0Austria 70.0 53.4 78.1Portugal 38.5 36.4 39.0Sweden 49.1 40.0 60.0Spain 19.9 22.3 29.4EU-15 13.9 21.9Estonia 0.2 0.4 5.1Latvia 42.4 35.2 49.3Lithuania 3.3 2.7 7.0
Poland 1.6 1.6 7.5Malta 0.0 0.0 5.0
Slovakia 17.9 12.3 31.0Slovenia 29.9 23.1 33.6Czech Republic 3.8 2.8 8.0Hungary 0.7 0.8 3.6Cyprus 0.1 0.0 6.0EU-25 12.9 21.0
[%]
RESelectricity
2003
Target value 2010
RES electricity 2003
RES electricity 1997
0 20 40 60 80
EU-25
Cyprus
Hungary
Czech Rep.
Spain
Slovenia
Slovakia
Sweden
Portugal
Poland
Austria
Netherlands
Malta
Luxembourg
Lithuania
Latvia
Italy
Ireland
United Kingdom
Greece
France
Finland
Estonia
Germany
Denmark
Belgium
[%]
Target value 2010
RES electricity 2003
RES electricity 1997
0 20 40 60 80
EU-25
Cyprus
Hungary
Czech Rep.
Spain
Slovenia
Slovakia
Sweden
Portugal
Poland
Austria
Netherlands
Malta
Luxembourg
Lithuania
Latvia
Italy
Ireland
United Kingdom
Greece
France
Finland
Estonia
Germany
Denmark
Belgium
[%]
RES renewable energy sources
Share of renewable electricity generation of the gross electri-city consumption.
Source: EC [61]; Eurostat [32], download 13.12.2005

instruments for the promotion of renewable energy sources in the electricity market
The prerequisite for raising the share of renewable energy sources in the electricity market to 21 % by 2010 is achieving the national indicative targets for the EU member states that were laid down by the European Commission. The member states are called upon to promote the expansion of renewable energy sources on a national level through appropriate framework conditions.The example of wind power shows that achievements in individual EU states vary significantly and are far from being on one level. This can be attributed above all to the respective energy policy framework conditions and less to natural potential. In the international comparison of support models the Renewable Energy Sources Act (EEG) stands out. In a report of December 2005, the European Commission determined that feed-in regulations such as the EEG are very effective for promoting wind power. Quota systems with tradable certificates that were implemented in some countries have not shown comparable results. Although in theory the established market mechanisms that are used by quota systems would lead us to expect lower fees, the costs are higher than in countries with feed-in regulations. This reflects the higher risks for operators of facilities. While the EEG guarantees a legally fixed fee for twenty years, the revenues from the sale of electricity and certificates in the quota system are extremely insecure and depend on a multitude of factors that are difficult to assess. Through the EEG Germany will in all likelihood achieve its national expansion goals that were formulated by the European Union. As things stand at present only Denmark and Spain (both countries with feed-in regulations) as well as Finland, where the use of renewable energies is granted tax concessions, are also expected to succeed in reaching their goals. Due to the achievements of national feed-in regulations and the lack of success of other support regulations, the EU Commission is no longer calling for the displacement of the EEG in favour of a Europe-wide harmonized quota system.
promotion models of renewable electricity in the eU
31
europe: electricity generation from renewable energy sources
Feed-in tariffs Quota obligation
Fiscal incentiveTenders
HUCZ LA
SI
CYLT
PLSK
EE
IE
FR
GRLUPT
DKAT
ES
DE NL
UK
BE
UK
FI
SE
PL
CZ
SI
MT
Certificate systems
ITFR
At the 2004 International Confe-rence for Renewable Energies in Bonn, Spain and Germany decided to share their experience of their feed-in regulations for electricity from renewables and to intensify their cooperation. By signing a joint declaration in 2005, this collaboration was put on a legal basis (International Feed-in Coope-ration).
Further goals are to assist other countries in improving and developing a feed-in system and to introduce experience acquired into international forums, especially in the process of political debate in the EU. Altogether more than half of the EU member states have priority and fee regulations that are comparable with the German and Spanish system. Further information on the German-Spanish cooperation is available on the internet at www.feed-in-cooperation.org.
Source: EC [71]

32
europe: electricity generation from renewable energy sources
Generation of electricity from renewable energy sources in the eU-15, 1990 to 2004
Since 1997, electricity generation from renewables in the EU-15 has increased on average 3 % p. a. to 408.6 TWh in 2004 and contributes 14.6 % to the electricity supply. The previous rise is particularly due to the developments in two sectors of renewable energies: wind power, with an average growth of approximately 35 % p. a., and the use of biomass for electricity generation with 10 % p. a. Appropriate growth rates in the other sectors are needed to allow 22 % of the total gross electricity to be replaced by renewables in the EU-15 by 2010. Achieving the objectives will only be possible with an ideal combination of all renewable energy sources.
Generation of electricity from wind energy in the eU, 1990 to 2005
RES renewable energy sources1) Provisional figures2) Including municipal waste and biogas3) For pumped-storage power stations, only generation from natural inflow
Sources:Biomass: Eurostat [32], download 13.12.2005; IEA [31]Hydropower: EIA [33]; IEA [31]Wind energy: Observ’ER [46]; Eurostat [32], download 9.03.06 Geothermal energy: Systèmes Solaires [39]; IEA [31]Photovoltaics: BSW [74], IEA [31]; DGEMP [54], [66]; Faninger [57]Share of RES: ZSW [3]
Since 2004 including generation in the new EU Member States
1) Generation < 1.5 TWh/a in each case
Sources: Eurostat [3], Download 09.03.2006; Observ’ER [46]
1990 1991 1992 1993 1994 1995 1996 1997 1998 1999 2000 2001 2002 20031)
Biomass 2) 16.6 17.3 18.0 19.4 21.2 23.6 24.4 28.0 31.5 35.0 39.3 39.5 48.4 57.2 55.1
Hydropower3) 257.2 264.3 282.5 286.9 295.1 288.8 287.5 294.3 302.1 300.8 316.2 335.7 277.6 276.6 290.4
Wind energy 0.8 1.1 1.6 2.4 3.0 4.1 4.8 7.3 11.3 14.2 22.2 27.0 35.6 44.2 56.9
Geothermal en. 3.2 3.2 3.5 3.7 3.4 3.4 3.8 3.9 4.3 4.5 4.8 4.6 4.8 5.4 5.5
Photovoltaics 0.01 0.02 0.02 0.03 0.03 0.05 0.05 0.06 0.08 0.09 0.12 0.19 0.28 0.47 0.73
Total 277.8 285.9 305.6 312.3 322.7 319.9 320.6 333.6 349.2 354.5 382.7 406.9 366.7 383.9 408.6
13.3 12.8 13.6 13.9 14.1 13.6 13.3 13.7 13.9 13.9 14.5 15.0 13.5 13.7 14.6RE share of
gross electricity
consumption [%]
[TWh]
20041)
0
10
20
30
40
50
1990 1991 1992 1993 1994 1995 1996 1997 1998 1999 2000 2001 2002 2003 2004 2005
][
United Kingdom
Netherlands
Denmark
Spain
Germany
Other EU countries
1)
Italy
TW
h
Austria
60
70
0
10
20
30
40
50
1990 1991 1992 1993 1994 1995 1996 1997 1998 1999 2000 2001 2002 2003 2004 2005
][
United Kingdom
Netherlands
Denmark
Spain
Germany
Other EU countries
1)
Italy
TW
h
Austria
60
70

33
europe: electricity generation from renewable energy sources
total installed wind power capacity in the eU, end of 2005
Development of installed wind power capacity in the eU, 1990 to 2005
Germany18,428
Spain10,027
Netherl.1,219
Italy1,717
UnitedKingdom
1,353
Greece573
France757
Austria819
Portugal1,022
Ireland
2)
496
Belgium167
Finland82
Luxem.35
EU-251) – 40,504 MW
Poland73
Latvia26
Estonia30
Czech Rep.26 Slovakia
5
Hungary17
Lithuania7
Africa/ Middle East
1 %
America17 %Asia
12 %
Worldwide: 59,322 MW
Europe69 %
Australia/Pazific1 %
Denmark3,122
Sweden500
Since 2003 including installed capacities in the new EU Member States
Sources: EWEA [59]; BWE [16]; Eurostat [34], download 22.03.06
Figures in MW
1) No wind energy use in Malta, Slovenia and Cyprus2) without figures for December 2005
Sources: EWEA [50]; GWEC [60]
Germany
EU
1,547 2,0822,875
4,4446,112
8,75411,965
14,60916,629
1,094
23,159
17,315
12,887
9,678
6,4534,753
2,4971,6831,211844629439
34,371
0
5,000
10,000
15,000
20,000
25,000
30,000
35,000
1990 1991 1992 1993 1994 1995 1996 1997 1998 1999 2000 2001 2002 2003 2004 2005
]M
W[
Spain
40,000
18,428
834455
40,504
2,235
3,337
4,825
6,203
8,263
10,027
1,459
45,000
28,598
3,476
Over recent years, the use of wind power has had a very dynamic upturn especially in the countries of the EU. In the last five years alone the installed capacity in the EU has more than doubled to over 40,000 MW. This increase can especially be attributed to growth in the wind power market in Germany and Spain. At the end of 2005 more than 18,000 MW (newly installed capacity 2005: 1,808 MW) were installed. In Spain in 2005, 1,764 MW were installed, whereby Spain crossed the 10,000 MW mark. Therefore these two countries account for almost three quarters of the total installed capacity in the EU. Approximately 60,000 MW were in operation globally, of which more than two thirds in the EU.

34
World: Structure of primary energy consumption
Global use of renewable energy sources
The high value of renewable energies for sustainable development is recognised. At present, however, their share of global primary energy consumption remains on a par with that of the early seventies, at 13.3 % (cf. also Appendix, No. 9). Although the supply of energy from renewables has almost doubled since then, the use of fossil energies and nuclear energy has also increased.
In order to meet the challenges of global energy supply and, in particular, climate protection, in addition to using energy more efficiently it is also necessary to increase the development momentum of renewables. This is particularly true of wind, solar and geothermal energy, but also of modern techniques for the use of biomass. The traditional uses which have dominated up until now – the provision of heat from firewood and coal (traditional use of biomass), and the generation of electricity from hydropower – are fast approaching their limits and are sometimes not a sustainable use of renewable energies (see also page 36).
The Federal Government and the European Union have undertaken to double the share of energy supply from renewable energy sources by the year 2010.
Structure of global primary energy consumption,2003 versus 1971
RES renewable energy sources
1) Includes non-renewable share of waste2) Geothermal energy, wind, solar energy, etc.
Sources: IEA [31]; [23]
In accordance with international agreements, electricity from nuclear energy is valued at an average conversion efficiency of 33 % in terms of primary energy. For hydropower, on the other hand, a figure of almost 100 % is used. For the share of primary energy consumption attributable to nuclear energy, this produces a significantly higher figure, whereas the contributions to electricity generation are almost identical in both cases; cf. Appendix, No. 4.
Other2)
0.5 %
Biomass10.6 %
Hydropower2.2 %
Oil34.4 %
Nuclear6.5 %
Gas21.2 %
2003Total: approx. 443,000 PJ
0.2 %
Biomass11.7 %
Hydropower1.9 %
Oil43.8 %
0.5 %
Gas16.0 %
Coal25.9 %
Anteil EE(13,8 %)
Total: 234,000 PJ
Coal24.4 %
RES
1)
13.3 %
(13,8 %)13.8 %
1971
Other2)
RES Nuclear

35
World: Growth and application examples
average growth rates of primary energy consumption andrenewable energy sources for the period 1990 to 2003
Structure of renewable energy use according to application areas, 2003
Against the background of various climate protection targets, i.e. those of the Kyoto Protocol, the development of renewable energies since 1990 is of particular interest. To date, however, efforts to significantly raise their value for energy supply have been unsuccessful. Although global energy supply increased by an average of 1.8 % up to 2003, growth was only slightly higher than that of primary energy consumption as a whole, at 1.6 % p. a. In the western industrialised countries (OECD), the contribution of renewable energy sources actually declined, from 5.9 % in 1990 to 5.6 % in 2003.
Globally, around 60 % of renewable energies are currently used to supply heat in private households and in the public and services sectors. This essentially refers to wood and coal. The second principal application area is that of electricity generation. However, there are substantial regional differences: whereas in the western industrialised countries (OECD), half of renewable energy sources are used to generate electricity, in Non-OECD countries this figure is only 13.4 %. The proportion attributable to decentralised heat supply in such countries is correspondingly high, at approximately 70 %, compared with only about 19 % in the OECD countries.
Non-OECD
World
OECD
1.6 1.8 1.6 2.1 1.6
8.2
6.1
1.4 1.10.5
1.4
11.7
6.2
23.923.3
0
5
10
15
20
25
30
TPES RES
in total power energy
Hydro- Geothermal Solid biomass
Other biomass 1)
Solar Wind
58.6
21.3
11.3
2.9
18.9
49.9
11.0
18.5
1.6
69.6
13.4
4.5
9.3
3.3
0
10
20
30
40
50
60
70
80
Private house-holds, service
and public sector
Power plants Other transformation/energy sectors
Industry Other
Gro
wth
rate
%
per
an
nu
m]
[ sh
are
in
%]
[
World
OECD
5.9
0.1
energy energy
RES renewable energy sourcesTPES total primary energy supply
The OECD Member States are listed in Appendix, No. 10.
1) Biogenic share of municipal waste, biogas, liquid biomass
Source: IEA [31]
Source: acc. to IEA [31]
Non-OECD
World
OECD
1.6 1.8 1.6 2.1 1.6
8.2
6.1
1.4 1.10.5
1.4
11.7
6.2
23.923.3
0
5
10
15
20
25
30
TPES RES
in total power energy
Hydro- Geothermal Solid biomass
Other biomass 1)
Solar Wind
58.6
21.3
11.3
2.9
18.9
49.9
11.0
18.5
1.6
69.6
13.4
4.5
9.3
3.3
0
10
20
30
40
50
60
70
80
Private house-holds, service
and public sector
Power plants Other transformation/energy sectors
Industry Other
Gro
wth
rate
%
per
an
nu
m]
[ sh
are
in
%]
[
World
OECD
5.9
0.1
energy energy

Share of renewable energy sources in primary energy consumption, 2003
Regional distribution of renewable energy sources, 2003
Regional structure of the use of renewable energy sources, 2003
Transition countries: countries that are in a transition phase from central planned economy to a market economy; under this term the IEA includes countries from non OECD Europe and of the former USSR.
1) Biogenic share of waste; in the Non-OECD countries a clear separation of the biogenic and non-biogenic share is not always possible2) Geothermal energy, solar power, wind power, etc.
Sources: IEA [31]
1) Including China
Source: IEA [45]
36
World: Regional differences
The share of energy that is generally considered renewable is particularly high in Africa. The reason for this is the traditional use of biomass that however is not sustainable in the long term. Basic forms of cooking and heating result in health damage through the use of open fires as well as the often irreversible effects of deforestation. Successfully reducing poverty is a basic requirement for the development of a sustainable energy supply. The use of hydropower through large embankment dams is sometimes also an unsustainable use of renewable energies, since they can entail serious social and ecological consequences.
1) Without China
Source: IEA [45]
TPES
1)
Africa 23,400 11,719 50.1 2.6 97.1 0.3 Latin America 19,423 5,673 29.2 35.9 62.6 1.4 Asia 51,263 16,747 32.7 4.0 92.5 3.5 China 59,700 10,191 17.1 10.0 90.0 0.0 Middle East 18,661 134 0.7 42.7 33.2 24.1 Transition economies 44,598 1,557 3.5 62.1 36.8 1.0 OECD 225,865 12,757 5.6 35.1 53.3 11.7 World 442,909 58,770 13.3 16.2 80.0 3.8
[PJ] [PJ] [%]Hydro-power
OthersBiomass/waste
2)
Thereof
RES
Share of RES
in TPES
Share of most important RES
in total RES [in %]
OECD
Transition economies
Developing countries 1)
China 64.8 %
1.2 %
14.5 %19.5 %
46.9 %
10.1 %
10.7 %32.2 %
66.5 %
0.6 %
32.8 %
Biomass, waste approx. 47,000 PJ
Hydropower approx. 9,530 PJ
Geothermal energy, solar energy,
wind, etc. approx. 2,230 PJ
Traditional biomass
Other RES
Hydropower
Modern biomass
0
5,000
10,000
15,000
20,000
25,000
30,000
35,000
40,000
] P
J[
Developing countries 1)
45,000
OECD Transition economies
Renewable energies sourcestotal: approx. 59,000 PJTraditional biomass
Other RES
Hydropower
Modern biomass
0
5,000
10,000
15,000
20,000
25,000
30,000
35,000
40,000
] P
J[
Developing countries 1)
45,000
OECD Transition economies
Renewable energies sourcestotal: approx. 59,000 PJ
OECD
Transition economies
Developing countries 1)
China 64.8 %
1.2 %
14.5 %19.5 %
46.9 %
10.1 %
10.7 %32.2 %
66.5 %
0.6 %
32.8 %
Biomass, waste approx. 47,000 PJ
Hydropower approx. 9,530 PJ
Geothermal energy, solar energy,
wind, etc. approx. 2,230 PJ

China
OECDca. 1.460 TWh
Africa86.5
Latin America
1) 587.4
Asia
1) 210.4
China286.2
formerUSSR223.3
Australia18.2
Japan113.5
USA358.9
EU-25387.1
Biomass9.1 %
Hydropower84.6 %
Geothermal energy2.3 %
Wind4.0 %
OECDapprox. 1,470 TWh
Hydropower96.4 %
Geothermal energy 1.3 %
Wind 0.3 %
Biomass1.9 %
Non-OECDca. 1,460 TWh
Worldtotal approx. 2,930 TWh
Geothermal energy
Wind energy
Hydropower
Biomass
Other0.7 %
Hydro15.9 %
Nuclear15.8 %
Gas19.4 %
Oil6.9 %
Coal40.1 %
Biomass/ waste
2)
1.0 %
RES
1)
17.6 %
RES total approx. 2,930 TWh
East15.8
Middle
electricity generation from renewable energy sources in various regions, 2003
Worldwide, renewable energy sources account for 17.6 % of total electricity generation, a slight decline against the 1990 figure (19.3 %). The reason for this is the relatively low growth in the use of hydropower in western industrialised countries (OECD), which fell short of the increase in electricity generation as a whole. This was not compensated by the use of other resources such as biomass or wind energy. Worldwide, hydropower dominates electricity generation from renewable energy sources. It accounts for around 90 % (corresponding to 15.9 % of total electricity generation), while biomass accounts for 6 % and the remaining renewable energies for almost 4 %.
37
World: electricity generation
Figures in TWh
1) Asia without China and Latin America without Mexico
The contribution of solar, wave energy, etc. accounted for approx. 1.7 TWh globally in 2003.
Source: IEA [70], [31]
RES renewable energy sources
1) Includes non-renewable share of waste2) Geothermal, biomass/waste, solar, wind, etc.
Sources: IEA [31], [70]
Share of renewable energy sources in global electricity generation, 2003
38
Renewables 2004
international conference for Renewable energies– renewables2004 – and the follow-up process
The International Conference for Renewable Energies in Bonn, renewables2004, was the global beginning of a new energy age. The successful implementation of almost 200 activities of the Bonn International Action Programme (IAP) will have a major impact on the global climate and social development: from 2015, 1.2 billion t CO2
p. a. should be avoided, which is equivalent to approximately 5 % of global emissions in 2015. The implementation would trigger investment of over 300 billion euros and up to 300 million people would get their first access to electricity.
China has considerably contributed to this: it is planning to increase the renewables’ share of the total installed electrical capacity to 10 % by 2010. China has since even raised this target. To achieve this goal, China has passed a regulation comparable to the German Renewable Energy Sources Act with fixed feed-in tariffs that came into effect at the beginning of 2006. In cooperation with other participants the government will raise more than 50 billion euros.
The Federal Government is working intensively on the implementation of Germany’s contribution to the IAP. Important contributions such as a new financing facility for energy efficiency and renewable energies have already been implemented. A further conference result that has been implemented is the founding of a global policy network (Renewable Energy Policy Network - REN 21). In REN 21 governments, international organisations and representatives of civil societies will work in cooperation and engage in further high-level political dialogue. The REN 21 Network published a 2005 global status report on renewables at the follow-up conference in Beijing in November 2005. According to this report already 17 % of global energy consumption comes from renewable sources. The report gives a comprehensive overview of the established support policies, markets and investment and associated employment (the report is available at www.ren21.net ). The official closing document which summarises the main conference documents and the analysis of the IAP are available under www.renewables2004.de.
From 7 to 8 November 2005, the Chinese government held the first follow-up conference - the Beijing International Renewable Energy Conference (BIREC 2005), with the support of the German Government. With 1,300 participants from 100 countries, including 30 government representative at ministerial level, the conference successfully made clear that renewable energy sources do not apply exclusively to industrialised countries. The Chinese government strengthened the commitment it made at the Bonn conference. The share of electricity from renewable energy sources should climb to 30 % by 2020. BIREC 2005 sent a clear message to the meeting of the Commission for Sustainable Development in 2006/07: renewable energies and the question of how their expansion will be regularly reviewed are on the agenda. The results of the conference are available under www.birec2005.cn.

39
appendix: Methodological notes
appendix: Methodological notes
The data published here in part reflects only provisional results. This is also true of individual time series which are currently being reviewed by the Working Group on Renewable Energies/Statistics (AGEE-Stat) (cf. also www.erneuerbare-energien.de). Changes may still arise compared with earlier publications until finalised data is published. Differences between the figures in the tables and the corresponding column or line totals are due to rounding up or down.The standard terminology in energy statistics includes the term (primary) energy consumption, although this is not strictly accurate in a physical sense, because energy is neither extracted nor consumed, but can merely be transformed into different forms of energy (such as heat, electricity, mechanical energy). Admittedly, this process is not completely reversible, so that a certain proportion of energy’s useful work potential is lost.
1. calculation of emission factors for electricity generation
The figures regarding the avoidance of emissions are based on the “Report on CO2 Reduction through the Use of Renewable Energy Sources” of the Fraunhofer Institute for System and Innovation Research [41]. The paper examines in detail to what extent renewable energies can replace conventional energy sources in light of the current power plant park.
For the most part, the feed-in of wind power replaces electricity from hard coal-fired medium load power plants, and to a lesser extent electricity from natural gas power stations; in times of strong winds and low load it can replace lignite power plants. Hydropower on the other hand, substitutes for lignite in the base load because of its feed-in characteristics. The same applies to electricity generation from geothermal energy, landfill and sewage gas. In contrast, biogas power plants follow the grid load daily and seasonally, whether they are heat or power directed. Therefore they predominantly replace medium (hard coal) and peak load power stations (natural gas). Liquid and solid biogenic fuels, which are flexible because they can be stored, mostly substitute hard coal and to a lesser extent lignite and natural gas. Electricity generation from photovoltaics follows the power demand with its generation profile. For the most part it substitutes for natural gas and to some extent hard coal.
Due to the currently available base load supply a substitution of renewable energy sources for nuclear energy is not anticipated because of its lower marginal costs compared to lignite power plants that are also used in base load.
1) Only biogenic share
Source: ISI [41]Nuclear power Lignite Hard coal Gas
Wind energy 0 % 20 % 70 % 10 %
Geothermal en. and hydropower 0 % 100 % 0 % 0 %
Biomass/Waste 1) 0 % 30 % 60 % 10 %
Photovoltaics 0 % 0 % 50 % 50 %
Biogas 0 % 0 % 70 % 30 %
Landfill and sewage gas 0 % 100 % 0 % 0 %
Substitution The emission factors were calculated
according to the fuel substitution listed here.

40
appendix: Methodological notes
2. calculation of emission factors and avoided emissions for heat generation
The calculation only considers direct emissions (including auxiliary power and heat distribution), i.e. no upstream or downstream processes such as the manufacture or disposal of plants. The calculation assumes the following structure of the heat supply mix which is substituted by renewable energy:
3. co2 and So2 equivalent
co2 equivalentKey greenhouse gases are the so-called Kyoto gases CO2, CH4, N2O, SF6, PFC and HFC, which must be reduced under the Kyoto Protocol. They contribute in different degrees to the greenhouse effect. In order to be able to compare the greenhouse effect of the individual gases, they are allocated a factor known as relative greenhouse potential (GHP), which represents a measure of their greenhouse effect compared with the reference substance CO2.The CO2 equivalent of the Kyoto gases is calculated by multiplying the relative greenhouse potential by the mass of the respective gas, and indicates the quantity of CO2 which would account for the same greenhouse effect over an observation period of 100 years.
So2 equivalent
Source: GEMIS, Öko-Institut [2]
The figures reflect the current scientific status according to IPCC [65]. For the Kyoto Protocol the italic printed figures are relevant according to IPCC [51]. This brochure was calculated with the new data.
1) based on a time horizon of 100 years2) Reference substance
Sources: acc. to VDEW [17]; acc. to Statistisches Bundesamt [44]
Natural gas Coal Electricity
52.9 % 41.5 % 1.5 % 4.1 %
Gas
SO2 Sulphur dioxide 1
NOx Nitrogen oxide 0.696
HF Hydro fluoride 1.601
HCl Hydro chloride 0.878
H2S Hydrogen sulphide 0.983
NH3 Ammonia 3.762
Gas
CO 2 Carbon dioxide 1 1
CH4 Methane 23 21
N2O Dinitrogen oxide (Laughing gas) 296 310
SF6 Sulphur hexafluoride 22,200 23,900
HFC Hydrofluorocarbons 12 - 12,000 140 - 11,700
PFC Perfluorinated carbons 8,600 - 11,900 6,500 - 9,200
relative greenhouse potential 1)
2) 2)
relative acidification potential
Heating oil
The acidification potential of SO2, NOX, HF, HCl, H2S and NH3 is determined analogously to the CO2 equivalent. The SO2 equivalent of these air pollutants indicates the quantity of SO2 which would produce the same acidifying effect.
Natural gas Coal Electricity
52.9 % 41.5 % 1.5 % 4.1 %
Gas
SO2 Sulphur dioxide 1
NOx Nitrogen oxide 0.696
HF Hydro fluoride 1.601
HCl Hydro chloride 0.878
H2S Hydrogen sulphide 0.983
NH3 Ammonia 3.762
Gas
CO 2 Carbon dioxide 1 1
CH4 Methane 23 21
N2O Dinitrogen oxide (Laughing gas) 296 310
SF6 Sulphur hexafluoride 22,200 23,900
HFC Hydrofluorocarbons 12 - 12,000 140 - 11,700
PFC Perfluorinated carbons 8,600 - 11,900 6,500 - 9,200
relative greenhouse potential 1)
2) 2)
relative acidification potential
Heating oil

41
appendix: Methodological notes
4. calculation of the primary energy equivalent for electricity, heat and fuels from renewable energy sources
In the physical energy content method, the primary energy for electricity is deduced from final energy using an efficiency factor of 100 % for energy sources which cannot be assigned a calorific value, such as hydropower, wind power and photovoltaics. Thus e.g. 1 kWh of electricity from hydropower corresponds to a primary equivalent of 1 kWh.
With the substitution method, the primary energy equivalent for electricity from hydropower, wind power and photovoltaics is stated as the fuel substituted through the electricity generation of the respective energy source in conventional power plants. For the calculation of fuel savings, the survey quoted under point 1 is used.
For calculating the primary energy equivalent for electricity from biomass, a so-called average substitution factor is applied for both methods. It is calculated from the ratio of fossil fuel used for electricity generation in public power stations to the gross electricity generation from these energy sources, and for 2004 amounts to 8,309 kJ/kWh (status 2004, provisional) AGEB [1]. Primary energy use for the different technologies will not be evaluated here.
For calculating the primary energy equivalent for the supply of heat and fuels from renewable energies, final energy and primary energy are equated.
5. Supply of energy from photovoltaics and solar thermal energy
photovoltaicsElectricity generation for 2005 is equivalent to the medium-term prognosis of VDN [9] of November 2005. The information for 2004 corresponds to the annual statement of October of the same year. Up to and including 2003, electricity generation was calculated using the installed capacity at the beginning of the year and half of the capacity increase of the respective year multiplied by a specific electricity output. The specific electricity output for Germany was provided by the Solar Promotion Association of Germany [28] as an average value. Taking half the capacity increase allows for the fact that newly installed capacity of the respective year only proportionally contributes to the electricity generation.
Solar thermal energyThe specified heat supply is calculated from the installed collector area and an average annual yield of 450 kWh/m2 for glazed collectors, and 300 kWh/m2 for swimming pool absorbers. Because the collector area available during the course of the year is lower than the specified installed area at the end of the year due to the construction of new plants, only half of the area increase in any given year is used when calculating heat supply for that year.

42
appendix: Methodological notes
It must be borne in mind that the different renewable energy sources save different fossil fuels. Therefore, hydropower reduces the energy generation of base load power plants (lignite), while wind power primarily reduces electricity generation in medium load power plants (hard coal, natural gas). The systematics are described in detail in ISI [41] (see also 1.). In contrast to electricity generation, for calculating the saving of fossil fuels through heat generation from renewables the preliminary processes of energy supply are taken into account.
It is assumed that for the utilisation of renewable energies mainly wood heaters are used. Therefore, for each used kilowatt-hour of energy from renewable sources there is a saving of 1.11 kWh (primary energy) compared with oil heaters and 1.08 kWh compared with natural gas. For the various coal heaters, the figures are 1.59 (hard coal briquettes), 1.80 (lignite briquettes) and 2.03 (hard coal coke). The extent to which fossil fuels are substituted is specified according to the structure of the heat supply mix described under point 2. For coal heaters, it is assumed that 79.6 % lignite briquettes, 12.9 % hard coal briquettes and 7.5 % hard coal coke are substituted. In the calculation electric heaters were not taken into account.
With the saving of fossil fuels through biofuels, the preliminary processes of energy supply are also taken into account. Thus, every used kilowatt-hour of biodiesel results in a saving of 1.26 kilowatt-hours (primary energy) compared with diesel fuel. For biodiesel, the credits for by-products are included. For bioethanol the figure compared to petrol is 0.72, for rape seed oil compared to diesel 0.99. Vegetable oil is here equated with rape seed oil.
7. Sales proceeds from the use of renewable energy sources
Turnover from the generation of electricity may be estimated based on the quantity of electricity fed into the grid and the payment rates according to the Renewable Energy Sources Act. The revenues from facilities that do not fall under the scope of the Act must be added, especially hydropower plants over 5 MW capacity and electricity generation from thermal waste handling (only biogenic share). An average value of 4.6 cents/kWh can be determined according to the stock market price for base load electricity. With an electricity generation of just under 19 TWh in 2005, a value of approximately 0.9 billion euros can be assigned.
For the fuel sector the revenues can be calculated directly from the sale of biofuels. This must take into account the different types of fuel as well as the distribution channels. An average price of 82 cents/l net (95 cents/l gross), for example, was estimated for the sale of biodiesel to public petrol stations. Lower prices were assumed for sales to vehicle fleets and the blending of diesel fuel.
36.6 %
Average efficiencyfactor
Lignitepower plants
Hard coalpower plants
Natural gaspower plants
37.6 % 43.9 %
kWhprim/kWhinput
Oil heating 1.20
Gas heating 1.17
Hard coal briquette heating 1.68
Hard coal coke heating 2.12
Lingnite briquette heating 1.89
Wood heating 0.09
Consumption of primary energy
(fossil)
Energy source kWhprim/kWhinput
Petrol 1.23
Diesel 1.16
Bioethanol 0.51
Rape seed oil 0.17
Biodiesel -0.10
Consumption of primary energy
(fossil)
Source: Öko-Institut [24]
6. Saving fossil fuels through renewable energy sources
The saving of fossil fuels in electricity generation is calculated with a typical level of utilisation of lignite, hard coal and natural gas power plants.
Source: ISI [41]

43
appendix: Methodological notes
The value of heat supply from renewable energies is disregarded, since the heat is mainly used internally. One conceivable valuation in such cases, however, would be the avoided costs for fuel oil or natural gas. Taking a substituted heat volume of approximately 73 TWh and an average fuel oil price of 55 cents per litre, this would correspond to approximately 4 billion euros for the private household sector. The costs of maintenance and repair of heat- generating plants as well as the revenues from the sale of heat in district heating systems are also not taken into account. This leaves the valuation of biogenic input materials such as logging residues and industrial wood residues, wood pellets etc. as well as a proportion of the used firewood, that is estimated at a total of 0.5 billion euros.
8. calculation of the primary energy equivalent of renewable energy sources for the eU
When calculating the primary energy equivalent for electricity generation from hydropower, wind energy and photovoltaic energy, primary energy is here equated with the generation of electricity according to the physical energy content method, in conformity with Eurostat. Biomass and biofuels for electricity and heat generation are evaluated in accordance with their calorific value (in conformity with Eurostat, but deviating from the methodology used in this brochure for Germany; cf. Appendix, No.4). For geothermal electricity generation, an efficiency factor of 10 % is assumed, i.e. 1 GWh of electricity from geothermal energy is valued at 36 TJ primary energy. For heat generation from geothermal and solar thermal energy, final energy and primary energy are considered equal.
The deviations arising from the different methodologies are minimal and can be disregarded when calculating the overall contribution of renewable energy sources to primary energy consumption.
9. Share of renewable energy sources in global primary energy consumption
Different sources give different figures for the share of global primary energy consumption that is attributable to renewable energies. The reasons for this include the accounting of thermal recovery of domestic and industrial waste and the generation of electricity in pumped-storage power stations. However, the greatest influence is the so-called traditional use of firewood and coal, which can only be estimated with considerable uncertainties, and for which figures can vary by more than 50 %. For this reason, traditional biomass use is not always included in energy statistics. With due regard for the current status of knowledge in this field, it can be said that renewables account for around 13.3 % of primary energy consumption.
10. oecD
The Organization for Economic Cooperation and Development was founded on 30 September 1961. Its main tasks include the coordination of economic policy, particularly trade cycle and currency policy, and the coordination and intensification of development aid from the Member States: Australia, Belgium, Germany, Denmark, Finland, France, Greece, United Kingdom, Ireland, Iceland, Italy, Japan, Canada, Korea, Luxembourg, Mexico, New Zealand, Netherlands, Norway, Austria, Portugal, Poland, Sweden, Switzerland, Slovak Republic, Spain, Czech Republic, Turkey, Hungary and USA. OECD headquarters is in Paris. The International Energy Agency (IEA) is a sub-organisation of the OECD; it is also located in Paris.

conversion factors
Units for energy and capacity
conversion factors
Greenhouse gases
other air pollutants
44
These units have been statutorily binding in Germany since 1978. The calory and derived units such as coal equivalent and crude oil equivalent are still used as an aid.
The figures refer to calorific value.
appendix: conversion factors, greenhouse gases and other air pollutants
Kilo k 103
Mega M 106
Giga G 109
Tera T 1012
Peta P 1015
Exa E 1018
Joule J for energy, work, heat quantity
Watt W for capacity, energy flow, heat flow
1 Joule (J) = 1 Newton metre (Nm) = 1 Watt second (Ws)
PJ TWh Mio. t SKE Mio. t RÖE
1 Petajoule PJ 1 0.2778 0.0341 0.0239
1 Terawatt hour TWh 3.6 1 0.123 0.0861
1 million t coal equivalent Mio. t ce 29.308 8.14 1 0.7
1 million t crudeoil equivalent
Mio. t oe 41.869 11.63 1.429 1
Terawatt hour: 1 TWh = 1 billion kWh
Gigawatt hour: 1 GWh = 1 million kWh
Megawatt hour: 1 MWh = 1,000 kWh
SO2 Sulphur dioxide
NOX Nitrogen oxide
HCl Hydrogen chloride
HF Hydrogen fluoride
CO Carbon monoxide
NMVOC Non-methane volatile organic compounds
CO 2 Carbon dioxide
CH4 Methane
N2O Dinitrogen oxide (Laughing gas)
SF6 Sulphur hexafluoride
HFC Hydrofluorocarbons
PFC Perfluorinated carbons
Kilo k 103
Mega M 106
Giga G 109
Tera T 1012
Peta P 1015
Exa E 1018
Joule J für Energie, Arbeit, Wärmemenge
Watt W für Leistung, Energiestrom, Wärmestrom
1 Joule (J) = 1 Newtonmeter (Nm) = 1 Wattsekunde (Ws)
PJ TWh Mio. t SKE Mio. t RÖE
1 Petajoule PJ 1 0,2778 0,0341 0,0239
1 Terawattstunde TWh 3,6 1 0,123 0,0861
1 Mio. t Steinkohleeinheit Mio. t SKE 29,308 8,14 1 0,7
1 Mio. t Rohöleinheit Mio. t RÖE 41,869 11,63 1,429 1
Terawattstunde: 1 TWh = 1 Mrd. kWh
Gigawattstunde: 1 GWh = 1 Mio. kWh
Megawattstunde: 1 MWh = 1.000 kWh
SO2 Schwefeldioxid
NOX Stickoxide
HCl Chlorwasserstoff (Salzsäure)
HF Fluorwasserstoff (Flusssäure)
CO Kohlenmonoxid
NMVOC flüchtige Kohlenwasserstoffe ohne Methan
CO 2 Kohlendioxid
CH4 Methan
N2O Lachgas
SF6 Schwefelhexafluorid
H-FKW wasserstoffhaltige Fluorkohlenwasserstoffe
FKW perfluorierte Kohlenwasserstoffe
Kilo k 103
Mega M 106
Giga G 109
Tera T 1012
Peta P 1015
Exa E 1018
Joule J for energy, work, heat quantity
Watt W for capacity, energy flow, heat flow
1 Joule (J) = 1 Newton metre (Nm) = 1 Watt second (Ws)
PJ TWh Mio. t SKE Mio. t RÖE
1 Petajoule PJ 1 0.2778 0.0341 0.0239
1 Terawatt hour TWh 3.6 1 0.123 0.0861
1 million t coal equivalent Mio. t ce 29.308 8.14 1 0.7
1 million t crudeoil equivalent
Mio. t oe 41.869 11.63 1.429 1
Terawatt hour: 1 TWh = 1 billion kWh
Gigawatt hour: 1 GWh = 1 million kWh
Megawatt hour: 1 MWh = 1,000 kWh
SO2 Sulphur dioxide
NOX Nitrogen oxide
HCl Hydrogen chloride
HF Hydrogen fluoride
CO Carbon monoxide
NMVOC Non-methane volatile organic compounds
CO 2 Carbon dioxide
CH4 Methane
N2O Dinitrogen oxide (Laughing gas)
SF6 Sulphur hexafluoride
HFC Hydrofluorocarbons
PFC Perfluorinated carbons
Kilo k 103
Mega M 106
Giga G 109
Tera T 1012
Peta P 1015
Exa E 1018
Joule J for energy, work, heat quantity
Watt W for capacity, energy flow, heat flow
1 Joule (J) = 1 Newton metre (Nm) = 1 Watt second (Ws)
PJ TWh Mio. t SKE Mio. t RÖE
1 Petajoule PJ 1 0.2778 0.0341 0.0239
1 Terawatt hour TWh 3.6 1 0.123 0.0861
1 million t coal equivalent Mio. t ce 29.308 8.14 1 0.7
1 million t crudeoil equivalent
Mio. t oe 41.869 11.63 1.429 1
Terawatt hour: 1 TWh = 1 billion kWh
Gigawatt hour: 1 GWh = 1 million kWh
Megawatt hour: 1 MWh = 1,000 kWh
SO2 Sulphur dioxide
NOX Nitrogen oxide
HCl Hydrogen chloride
HF Hydrogen fluoride
CO Carbon monoxide
NMVOC Non-methane volatile organic compounds
CO 2 Carbon dioxide
CH4 Methane
N2O Dinitrogen oxide (Laughing gas)
SF6 Sulphur hexafluoride
HFC Hydrofluorocarbons
PFC Perfluorinated carbons

45
Bibliography
personal reference: [1] Working Group on Energy Balances (AGEB), Berlin, January 2006[2] Working Group on Energy Balances (AGEB): Satellitenbilanz Erneuerbare Energieträger 1995-1999, Berlin[3] Centre for Solar Energy and Hydrogen Research Baden-Wuerttemberg (ZSW), Stuttgart[7] Agency of Renewable Resources (FNR), Gülzow, 2004, 2005, 2006[9] Association of German Network Operators (VDN), Berlin[10] Bundesverband Solarwirtschaft (BSW), Berlin[12] EnBW Kraftwerke AG Stuttgart, 2005[15] Federal Ministry of Food, Agriculture and Consumer Protection, (BMELV), April 2006[19] Rationelle Energietechnik GmbH (ZfS), Hilden [22] Institut für Zukunfts-Energie-Systeme (IZES): Umwelteffekte der Strom- und Wärmebereitstellung sowie der Kraftstoffnutzung im Jahr 2004, Saarbrücken[24] U. Fritsche, Öko-Institut Darmstadt, 2005[26] Bundesverband WärmePumpe (BWP) e. V., München, April 2006[28] Solarenergie-Förderverein Deutschland e. V. (SFV), Aachen, 2005[42] Federal Office of Economics and Export Control (BAFA), Eschborn, February 2004
literature:[4] Federal Environmental Agency (UBA): Deutsches Treibhausgasinventar 1990- 2004, Nationaler Inventarbericht 2006, Dessau, 2006:[5] Federal Statistical Office, Wiesbaden, 2004, 2005, 2006 [6] Federal Ministry for the Environment, Nature Conservation and Nuclear Safety (BMU) (ed.): Ausbau Erneuerbarer Energien im Stromsektor bis zum Jahr 2020: Vergütungszahlungen und Differenzkosten durch das Erneuerbare-Energien-Gesetz, Stuttgart, Wuppertal, Dezember 2005[8] Institute for Energy and Environment (IE): Fortschreibung der Daten zur Stromerzeugung aus Biomasse, Leipzig, 2004, 2005[11] German Institute for Economic Research (DIW) (Ed.): Hohe Energiepreise dämpfen Primär- energieverbrauch in Deutschland, in: Wochenbericht Nr.10/2006[13] Institute for Energy and Environment (IE): Monitoring zur Wirkung der Biomasseverordnung auf der Basis des Erneuerbare-Energien-Gesetzes, Endbericht, Leipzig, 2003[14] Öko-Institut – Institut für angewandte Ökologie: Gesamt-Emissions-Modell integrierter Systeme (GEMIS), Version 4, Darmstadt 2001[16] German WindEnergy Association (BWE), Osnabrück 2005[17] Verband der Elektrizitätswirtschaft e. V. (VDEW): Endenergieverbrauch in Deutschland, VDEW-Materialien, Frankfurt a. M., 1998/1999/2000/2001/2002/2003[18] Working Group on Energy Balances (AGEB): Auswertungstabellen zur Energiebilanz für Deutschland von 1990 bis 2005, Berlin[20] Institute for Energy and Environment (IE): Erfahrungen mit dem novellierten EEG hinsichtlich der Stromerzeugung aus Biomasse, Leipzig, Februar 2006[21] Verband der Elektrizitätswirtschaft e. V. (VDEW): Pressemitteilung vom 18.04.2005[23] International Energy Agency: World Energy Outlook 2002, IEA/OECD, Paris 2002[25] Erfahrungsbericht der Bundesregierung: Bericht über den Stand der Markteinführung und der Kostenentwicklung von Anlagen zur Erzeugung von Strom aus erneuerbaren Energien (Erfahrungsbericht zum EEG) vom 28. Juni 2002, Berlin
Bibliography

46
Bibliography
[27] German Aerospace Center (DLR), Institute for Energy and Environmental Research Heidelberg (Ifeu), Wuppertal Institute for Climate, Environment and Energy (WI): Ökologisch optimierter Ausbau der Nutzung der erneuerbaren Energien in Deutschland, 2004, im Auftrag des Bundesumweltministeriums[29] Verband der Industriellen Energie- und Kraftwirtschaft (VIK): Statistik der Energiewirtschaft, Essen, 2000/2001[30] International Energy Agency (IEA): World Energy Outlook 2004, OECD/IEA, 2004[31] International Energy Agency (IEA), Paris: Renewables Information, Edition 2002, Edition 2003, Edition 2004, Edition 2005, IEA/OECD[32] European Commission: Eurostat Online Database: Table es_105a.tab, http://epp.eurostat.cec.eu.int/[33] Energy Information Administration (EIA): International Energy Annual, Edition 2003, http://www.eia.doe.gov/iea/elec.html, released May - July 2005, Washington DC[34] European Commission : Eurostat Online Database: Tables es_100a, es_1071a, es_1072a, es_113a, http://epp.eurostat.cec.eu.int/[35] Observatoire des énergies renouvelables (Observ’ER): European Barometer 2002, Le bilan 2002 des énergies renouvelables, in: Systèmes Solaires, n°148, 04/2002[36] Observatoire des énergies renouvelables (Observ’ER): Solar Thermal Barometer, in: Systèmes Solaires, n°168, August 2005[37] Observatoire des énergies renouvelables (Observ’ER): Photovoltaic Energy Barometer, in: Systèmes Solaires, n°166, April 2005[38] Öko-Institut, Frauenhofer Institut Umwelt-, Sicherheits- Energietechnik (UMSICHT), Institut für Energetik und Umwelt, Institut für Energie- und Umweltforschung Heidelberg (ifeu), Institut für ZukunftsEnergieSysteme (izes), TU Berlin, TU Braunschweig, TU München: Stoffstromanalyse zur nachhaltigen energetischen Nutzung von Biomasse, 2004, im Auftrag des Bundesumweltministeriums[39] Systèmes Solaires: La production d’électricité d’origine renouvelable dans le monde, Paris, September 2000[40] German Institute for Economic Research (DIW): DIW-Wochenberichte Nr. 9/2005,12/2006, Berlin[41] Fraunhofer Institute for Systems and Innovation Research (FhG-ISI): Gutachten zur CO2-Minderung im Stromsektor durch den Einsatz erneuerbarer Energien, Karlsruhe, 2005 [43] Federal Ministry for the Environment, Nature Conservation and Nuclear Safety (BMU): Was Strom aus erneuerbaren Energien wirklich kostet, February 2006[44] Federal Statistical Office: Mikrozensus-Zusatzerhebung 2003[45] International Energy Agency (IEA): Renewables in Global Energy Supply – An IEA Fact Sheet, IEA/OECD, Paris[46] Observatoire des énergies renouvelables (Observ’ER): Wind Energy Barometer, in: Systèmes Solaires n° 171, February 2006[47] European Commission: Energy - Monthly Statistics, 2-2006[48] German Advisory Council on Climate Change (WBGU): World in Transition: Towards Sustainable Energy Systems, Berlin 2003[49] Institute for Energy and Environmental Research Heidelberg (Ifeu): Gutachten zur Erweiterung der Ökobilanz für RME, May 2003[50] European Wind Energy Association (EWEA): Wind Power Installed in Europe by End of 2005 (Cumulative), http://www.ewea.org/, download 08.03.2006[51] Intergovernmental Panel on Climate Change (IPCC): Guidelines for National Greenhouse Gas Inventories, 1996[52] Eurostat, Statistical Office of the European Communities, Luxembourg: Energy, annual statistics, 2001 Edition, 2002 Edition, 2003 Edition, 2004 Edition
Bibliography
[53] Observatoire des énergies renouvelables (Observ’ER): Biofuels Barometer, in: Systèmes Solaires, n° 167, June 2005[54] Direction Générale de l’Énergie et des Matières Premières [DGEMP] : La production d’énergie renouvelable en France en 2004, Paris, Juin 2005[55] E. Wagner: Nutzung erneuerbarer Energien durch die Elektrizitätswirtschaft, in: VDEW: Elektrizitätswirtschaft, Heft 24, 2000[56] German Institute for Economic Research (DIW): Aktualisierung der Schätzung der Beschäftigungszahlen im Umweltschutz. Gutachten im Auftrag des Umweltbundesamtes. Berlin, 2004 [57] Faninger, G.: Der Photovoltaik-Markt in Österreich 2003, iff-Universität Klagenfurt, March 2004[58] European Solar Thermal Industry Federation (ESTIF)/ International Energy Agency (IEA): Press Release: Worldwide capacity of solar thermal energy greatly underestimated, 10 November 2004[59] European Wind Energy Association (EWEA): NEWS RELEASE, European record for wind power: over 6,000 MW installed in 2005. Wind energy has surpassed EC white Paper targets for 2010, Brussels, 1st February 2006[60] Global Wind Energy Council (GWEC): Press Release: Record year for wind energy: Global wind power market increased by 43 % in 2005, Brussels, 17 February 2006[61] European Commission, Directorate-General for Energy and Transport, Beatriz Yordi: Situation of the Renewable Electricity Directive, ECOSOC, 4 April 2005[62] Lund, John W.: 100 Years of geothermal power production, GHC Bulletin, September 2004[63] International Energy Agency (IEA): Energy Balances of OECD Countries, 2004 Edition[64] Federal Ministry for the Environment, Nature Conservation and Nuclear Safety (BMU): Wirkung des Ausbaus der Erneuerbaren Energien auf den deutschen Arbeitsmarkt unter besonderer Berücksichtigung des Außenhandels, Pressemeldung 22.03.2006[65] Intergovernmental Panel on Climate Change (IPCC): Third Assessment Report (TAR), 2001[66] Direction Générale de l’Énergie et des Matières Premières [DGEMP] : Les énergies renouvelables en France 1970-2003, Paris, Janvier 2005[67] Observatoire des énergies renouvelables (Observ’ER): Geothermia Barometer, in: Systèmes Solaires, n° 170, December 2005[68] Federal Ministry of Transport, Building and Housing (BMVBW) (Ed.): Verkehr in Zahlen 2005/2006, Deutscher Verkehrs-Verlag [69] Deutsches Windenergie-Institut (DEWI): Windnutzung in Deutschland – Stand 31.12.2005, DEWI Magazin Nr. 28, Februar 2006[70] International Energy Agency (IEA): Energy Balances of Non-OECD Countries, 2004 Edition[71] European Commission, Directorate general for Energy and Transport, Beatriz Yordi: Communication on the support of electricity from renewable energy sources (COM (2005) 627), 2005[72] German Aerospace Center (DLR), Fraunhofer Institute for Systems and Innovation Research (FhG-ISI): Externe Kosten der Stromerzeugung aus erneuerbaren Energien im Vergleich zur Stromerzeugung aus fossilen Energieträgern, Gutachten im Rahmen von Beratungsleistungen für das Bundesministerium für Umwelt, Naturschutz und Reaktorsicherheit, 6. April 2006[73] Bundesverband Solarwirtschaft (BSW): Aktuelle Entwicklungen im deutschen Photovoltaikmarkt, Vortrag von G. Stryi-Hipp, 21.Symposium Photovoltaische Solarenergie, 08.-10. März 2006, Kloster Banz, Bad Staffelstein[74] Bundesverband Solarwirtschaft (BSW): www.solarwirtschaft.de, Berlin

Contacts:Federal Ministry for the Environment, Nature Conservation and Nuclear SafetyPublic Relations DivisionD– 11055 BerlinFax: (01888) 3 05 - 20 44Internet: www.bmu.deE-mail: [email protected]
This brochure constitutes part of the Federal Ministry for the Environment, Nature Conservation and Nuclear Safety‘s public relations work. It is supplied free of charge and is not intended for sale. Printed on 100 % recycled waste paper.
“Mindful of its responsibility for future generations, the state shall protectthe natural foundations of life ...”
Germany’s Basic Law, Article 20 A


