Reply to Essential Details sought on 15-10-2016 EDS: Kindly apply at MoEF&CC. Reply: As per the amendment in the EIA Notification vide S.O. 1599 (E), dated 25 th June 2014, the criteria for General Condition has been changed to 5 km from 10 km. We have applied at state level because after the said amendment, general conditional is not applicable to our project for amendment in EC for existing polyester chips manufacturing plant at GIDC, Sarigam.
Transcript
Reply to Essential Details sought on 15-10-2016
EDS:
Kindly apply at MoEF&CC.
Reply:
As per the amendment in the EIA Notification vide S.O. 1599 (E), dated 25th June 2014, the criteria for
General Condition has been changed to 5 km from 10 km.
We have applied at state level because after the said amendment, general conditional is not applicable to
our project for amendment in EC for existing polyester chips manufacturing plant at GIDC, Sarigam.
Reply of Essential Details sought on 29/09/2016
EDS:
Please specify the distance from interstate boundary.
Reply:
The approximate distance of our site boundary from the boundary of Daman & Diu (U.T.) is 8.30 km
please refer Figure-1 for your ready reference.
The approximate distance of our site boundary from the boundary of Dadra & Nagar Haveli (U.T.) is
7.20 km please refer Figure-2 for your ready reference.
Figure-1: Map indicating the approximate distance of our site boundary from boundary of Daman &
Diu (U.T.)...
Figure-2: Map indicating the approximate distance of our site boundary from boundary of Dadra &
Nagar Haveli (U.T.)...
PROJECT PRE FEASIBILITY REPORT
For
AMENDMENT IN EC For
Existing Polyester Chips Manufacturing Plant For
Change in Fuel For
9.9MW Captive Power Generation
AT
Plot No 11, 12& 215 to 231, GIDC, Sarigam - 396155 Dist.: Valsad, Gujarat.
Project proponent:
Project Pre-feasibility Report
1
Project: Amendment in EC for Change in Fuel for 9.9 MW Captive Power Generation
CONTENTS
CHAPTERS S.NO. PARTICULARS PAGE NO.
CHAPTER 1 EXECUTIVE SUMMARY 4-6 1.1 Project Summary 4 CHAPTER 2 INTRODUCTION OF THE PROJECT 7-10 2.1 IDENTIFICATION OF THE PROJECT AND PROJECT
PROPONENT 7
2.1.1 IDENTIFICATION OF THE PROJECT 7 2.1.2 PROJECT PROPONENT 8 2.1.3 NATURE OF THE PROJECT 9 2.1.4 NEED OF PROJECT & DEMAND-SUPPLY GAP 9 2.1.5 IMPORTS VS. INDIGENOUS PRODUCTION 10 2.1.6 EXPORT POSSIBILITY 10 2.1.7 DOMESTIC / EXPORT MARKETS 10 2.1.8 EMPLOYMENT GENERATION DUE TO PROJECT 10 CHAPTER 3 PROJECT DISCRIPTION 12-32 3.1 TYPE & LOCATION OF PROJECT 12 3.1.1 TYPE 12 3.1.2 LOCATION 12 3.2 DETAILS OF THE ALTERNATIVE SITE 16 3.3 SIZE & MAGNITUDE OF OPRATION 16 3.4 PROJECT DESCRIPTION WITH PROCESS DETAILS 16 3.4.1 CAPITIVE POWER PLANT 16 3.4.2 AUXILIARY SYSTEMS 18 3.4.2.1 COAL HANDLING SYSTEM 18 3.4.2.2 LIME DOSING SYSTEM 18 3.4.2.3 ASH HANDLING SYSTEM 18 3.5 RAW MATERIAL FOR FINISHED PRODUCTS 20 3.6 HAZARDOUS CHEMICAL STORAGE & HANDLING 20 3.7 RESOURCE OPTIMIZATION &AVALABILITY 20 3.7.1 LAND & BUILDING REQUIREMENT 20 3.7.2 EQUIPMENT 20 3.7.3 POWER REQUIREMENT 21 3.7.4 FUEL REQUIREMENT 21 3.7.5 WATER REQUIREMENT 22 3.7.6 MAN-POWER REQUIREMENT 22 3.8 QUANTITY OF WASTE TO BE GENERATED 23 3.8.1 WASTE WATER GENERATION & MANAGEMENT 23 3.8.2 WASTE CHARACTERSTICS 25 3.8.3 WASTE WATER TREATMENT &DISPOSAL 26 3.8.4 AIR EMISSIONS & CONTROL 29 3.8.4.1 PROCESS EMISSION 29 3.8.4.2 UTILITY EMISSION 29 3.8.4.3 FUGITIVE EMISSION 30 3.8.5 HAZARDOUS/NON-HAZARDOUS WASTE MANAGEMENT 30 3.8.6 NOISE CONTROL 30 3.9 HEALTH AND SAFETY MEASURES 31
Project Pre-feasibility Report
2
Project: Amendment in EC for Change in Fuel for 9.9 MW Captive Power Generation
3.10 ENVIRONMENTAL HEALTH & SAFETY CELL 32 3.11 POST PROJECT MONITORING PLAN 32 CHAPTER 4 SITE ANALYSIS 33-35 4.1 CONNECTIVITY 33 4.2 LAND FORM, LAND USE & LAND OWNERSHIP 33 4.3 TOPOGRAPHY 33 4.4 SALIENT FEATURES 33 4.5 EXISTING INFRASTRUCTURE 34 4.6 SOIL CLASSIFICATION 34 4.7 CLIMATE & METEROLOGY 34 4.7.1 TEMPERATURE 35 4.7.2 HUMIDITY 35 4.7.3 RAINFALL 35 4.7.4 WIND PATTERN 35 4.8 SOCIO INFRASTRUCTURE 35 CHAPTER 5 PLANNING BRIEF 36-37 5.1 PLANNING CONCEPT 36 5.2 POPULATION PROJECTION 36 5.3 AREA STATEMENT 36 5.4 ASSESMENT OF INFRASTRUCTURE DEMAND (PHYSICAL &
SOCIAL) 37
5.5 AMENITIES/FACILITIES 37 CHAPTER 6 PROPOSED INFRASTRUCTURE 38-39 6.1 INDUSTRIAL AREA 38 6.2 RESIDENTIAL AREA 38 6.3 GREENBELT 38 6.4 SOCIAL INFRASTRUCTURE 38 6.5 CONNECTIVITY 38 6.6 DRINKING WATER MANAGEMENT 38 6.7 SEWERAGE SYSTEM 39 6.8 INDUSTRIAL WASTE MANAGEMENT 39 6.9 SOLID WASTE MANAGEMENT 39 6.10 POWER REQUIREMENT & SOURCE OF SUPPLY 39 CHAPTER 7 REHABILITATION & RESETTLEMENT (R&R) PLAN 40 7.1 POLICY TO BE ADOPTED 40 CHAPTER 8 PROJECT SCHEDULE & COST ESTIMATES 41 8.1 TIME SCHEDULE OF THE PROJECT 41 8.2 ESTIMATED PROJECT COST 41 CHAPTER 9 ANALYSIS OF PROPOSAL 42 9.1 FINANCIAL & SOCIAL BENEFITS 42
LIST OF TABLES S.No. Particulars Page No. TABLE 1.1 PROJECT SUMMARY 4 TABLE 2.1 LIST OF PRODUCTS 8 TABLE 2.2 LIST OF DIRECTORS 9 TABLE 2.3 JUSTIFICATION FOR PROPOSING THE FUEL CHANGE &
FINANCIAL FEASIBILITY 10
TABLE 3.1 LIST OF PROPOSED EQUIPMENT 21 TABLE 3.2 DETAILS OF FUEL 21 TABLE 3.3 TOTAL WATER CONSUPTION (KLD) 22
Project Pre-feasibility Report
3
Project: Amendment in EC for Change in Fuel for 9.9 MW Captive Power Generation
TABLE 3.4 MAN-POWER REQUIREMENT 23 TABLE 3.5 CATEGORY-WISE WASTEWATER GENERATION (IN KLD) 23 TABLE 3.6 EXPECTED CHARACTERISTICS OF WASTEWATER 25 TABLE 3.7 ADEQUACY OF EXISTING ETP 28 TABLE 3.8 DETAILS OF UTILITY EMISSION 29 TABLE 3.9 DETAILS OF HAZARDOUS WASTE GENERATION & DISPOSAL 30 TABLE 3.10 POST PROJECT MONITORING PLAN 32 TABLE 4.1 SALIENT FEATURES OF THE PROJECT SITE 33 TABLE 4.2 SUMMARY OF METEOROLOGICAL DATA AT NEAREST IMD
STATION DAHANU 34
TABLE 5.1 AREA STATEMENT 36 TABLE 8.1 TOTAL CAPITAL COST PROJECTION 41
LIST OF FIGURES S. No. Particulars Page No. FIGURE 3.1 PROJECT SITE 13 FIGURE 3.2 BASE MAP OF STUDY AREA 14 FIGURE 3.3 LAYOUT OF PROJECT SITE 15 FIGURE 3.4 FLOW DIAGRAM OF COAL FIRED 9.9 MW CPP 17 FIGURE 3.5(a) EXISTING WATER BALANCE DIAGRAM ( IN KLD ) 24 FIGURE 3.5(b) PROPOSED WATER BALANCE DIAGRAM ( IN KLD ) 25 FIGURE 3.6 FLOW DIAGRAM OF ETP 27
LIST OF ANNEXURES S. No. Particulars Page No. ANNEXURE-1 (a) COPY OF EXISTING EC WITH AMENDMENTS 1-9 ANNEXURE-1 (b) FORWARDING LETTER TO EC COMPLIANCE REPORT
SUBMITTED TO RO BHOPAL 10
ANNEXURE-2 COPY OF EXISTING CC&A 11-14 ANNEXURE-3 TECHNICAL SPECIFICATION OF COAL HANDLING PLANT 15-17 ANNEXURE-4 TECHNICAL SPECIFICATION OF ASH HANDLING
SYSTEM 18
ANNEXURE-5 MoU WITH COAL SUPPLIER 19-20 ANNEXURE-6 DISPERSION MODELING REPORT 21-46 ANNEXURE-7 MoU WITH BRICK MANUFACTURERS FOR FLY ASH 47-48
Project Pre-feasibility Report
4
Project: Amendment in EC for Change in Fuel for 9.9 MW Captive Power Generation
CHAPTER 1
EXECUTIVE SUMMARY The project is summarized in the below table: Table1.1: Project Summary
PARTICULARS DETAILS NAME OF THE UNIT
M/s. JBF Industries Ltd.
OCCUPIER Mr. R. K. Srivastava (Vice President)
PRODUCTS Sr. No.
Name of the Product Quantity Existing Proposed
Additional Total
1. Polyester Chips of various types & grades
*49500MT/Month - *49500MT/Month
2. Power Generation through Captive Power Plants
**9.9 MW - --
3. Power Generation through Coal fired Captive Power Plant
- @9.9 @9.9
Note: 1. * = EC has been obtained for 49500 MT/Month Polyester chips of various types & grades and 8.7 MW power generations through Captive Power Plants in 2012. 2. ** = An amendment in EC for dual fired power engine of 1.2 MW capacities & for change in existing fuel, i.e. Coal instead of Natural Gas by installing 4 Coal fired thermic fluid heaters has been obtained in 2014. 3. @ = After obtaining amendment in EC for installation of 9.9 MW Coal fired Captive Power Plant, existing Captive Power Plants shall be stand by till suitable/ acceptable customers are found/available for sale/disposal. Even after proposed amendment is granted the company will not generate more than 9.9 MW net effective power
Power Existing Average load utilization: 9.5 MW After Proposed Amendment: 10.4MW ( 900 KW is Auxilliary power comsumption)
Existing:DGVCL After Proposed Amendment: 9.9 MW coal fired power plant & DGVCL
Project Pre-feasibility Report
5
Project: Amendment in EC for Change in Fuel for 9.9 MW Captive Power Generation
PARTICULARS DETAILS Fuel Existing:
Natural Gas* 150000SCM/day Indian Coal - 77 MT/day Indonesian Coal 173 MT/day FO 650 lit/hr HSD* 250 lit/hr After Proposed Amendment: Natural Gas* 150000SCM/day Indian Coal - 77 MT/day Indonesian Coal 323 MT/day FO 650 lit/hr HSD* 250 lit/hr
NG from GSPC Coal Shree Hari Coal Corporation, Adani Enterprizes FO from HPCL/BPCL HSD from petrol pump Natural gas based equipments will be stand by only due
to techno commercial reasons, issues regarding uncertainty of continuous supply and pricing factors.
After Proposed Amendment: Domestic: 50 KLD Industrial: 707 KLD
In existing operations, the total domestic wastewater generated @50 KLD andis treated along with the industrial effluent and discharged into GIDC U/G drain.
Wastewater generated from industrial activities @675 KLD is treated in ETP. All the domestic sewage shall also be treated along with the industrial effluent to meet the discharge standards. Out of which 190 KLD is treated in RO. Permeate from RO @131 KLD is recycled to cooling tower makeup. Remaining treated effluent @485 KLD & RO reject @59 KLD is discharged through GIDC underground drainage from where ultimately it is conveyed into the deep Arabian Sea.
After proposed amendment project, waste water generated @32 KLD will be addition to the existing quantity of industrial waste water. Hence, total 707 KLD waste water will be treated in ETP. Out of which 227 KLD will be treated in RO. Permeate from RO @161 KLD will be recycled to cooling tower makeup. Remaining treated effluent @474 KLD & RO reject @70 KLD will be discharged through GIDC underground drainage from where ultimately it will be conveyed into the deep Arabian Sea.
Air Emissions Existing continous Installations: Gas Turbine with WHR System - 4.5 MW Gas based Power Engine - 2 MW 1.2 MW Dual fired engine FO fired Genset - 2.2MW Thermic Fluid Heater -14 M.KCal/hr (2 Nos) Thermic Fluid Heater -10 MCal/hr (2 Nos) (1
In Existing operations, the company has 2 Nos. of Coal fired Heaters of capacities @14 M.kCal/Hr and 2 Nos. @10 M.kCal/Hr in operating condition.
Captive Power Plant comprising of 4.5 MW Gas Turbine, 2.2 MW and Gas Engine, 1.2 MW Dual fired engine and 2 MW FO based generator are all stand-by.
Naturl gas fired 4 Nos old Thermic Fluid Heater -10 Lakh.KCal/are standby/idle)
After proposed amendment project for installation of 9.9 MW coal based power plant, one boiler of 45 TPH will be installed.
All existing power generation systems will be stand-by arrangement till suitable/ acceptable customers are found/available for sale/disposal.
Out of 2 Nos. of coal fired Heaters of capacities @14 M.kcal/Hr and 2 Nos. @10 M.kcal/Hr, 3 nos. is operating under standard working conditions and one is kept as standby.
Three field ESP followed by stack of 63m & lime dosing in furnace is provided to meet the emission standards in existing thermic fluid heaters of 10 M.kcal/Hr& 14 M.kcal/Hr
In proposed amendment four fields ESP with supporting
Project Pre-feasibility Report
6
Project: Amendment in EC for Change in Fuel for 9.9 MW Captive Power Generation
PARTICULARS DETAILS systems will be installed for the proposed coal fired 9.9.MW power plant.
Dry Fly ash shall be collected and conveyed through dense phase pneumatic conveying system to silos and disposed in compliance with the Fly Ash Rules.
Proper dust arrestors/suppressor and extraction system will be installed to prevent spread of dust with the wind
All conveying /handling will be done using enclosed conveyors
Good housekeeping will be maintained in the plant. Hazardous & solid waste
Non - Hazardous Waste Existing: Fly Ash : 50 MT/day. After Proposed Amendment: Fly ash: 75 MT/day
The Hazardous wastes are handled, stored,transported & disposed ofas per CPCB/ MoEF Guidelines and GPCB Authorization
No increase in Hazardous waste generation percived. Fly ash is being disposed in compliance with the Fly Ash
Rules. Same practice will be followed after proposed
amendment. Noise Expected levels
Inside the plant: <85dB(A) For the proposed installation of 9.9 MW power plant, suitable silencers and insulation will be provided at the vent of boilers and turbine to reduce the noise level to below 85 dB level.
Regular maintenance will be done
Project Pre-feasibility Report
7
Project: Amendment in EC for Change in Fuel for 9.9 MW Captive Power Generation
CHAPTER 2
INTRODUCTION OF THE PROJECT
2.1 IDENTIFICATION OF THE PROJECT AND PROJECT PROPONENT
2.1.1 IDENTIFICATION OF THE PROJECT JBF has manufacturing facilities located at Sarigam & Silvassa in India. The Sarigam plant is
engaged in the manufacturing of Polyester Chips of Various Types & Grades. The plant is
located at Plot No. 11, 12 & 215 to 231, GIDC Estate, Sarigam-396155, Dist. Valsad (Gujarat).
JBF had obtained Environmental Clearance from Ministry of Environment and Forest in 2012 for
expansion of project by capacity enhancement of Polyester Chips (36000 TPM to 49500 TPM)
& Captive Power Generation Capacity (4.5MW to 8.7MW) dated 16th Aug 2012.
Earlier, JBF has obtained two amendments in EC
1) For installation of 1.2 MW dual fired power engine as a standby arrangement. EC
amendment has been obtained for the same on 7th Jan 2014.
2) For change in existing fuel i.e. Coal instead of Natural Gas by installing 4 Coal fired
heaters. EC amendment has been obtained for the same on 25th Sep 2014.
The copy of existing EC letter with all the amendments is attached as Annexure-1 (a).
Now, JBF is planning for an amendment in EC for existing polyester chips manufacturing plant
for change in fuel for 9.9 MW captive power generation. The existing captive power plants will
be standby till suitable/ acceptable customers are found/available for sale/disposal after the
proposed amendment. The company is not going to generate net effective power more than 9.9
MW even after proposed amendment.
The list of products is mentioned in Table no. 2.1.
Project Pre-feasibility Report
8
Project: Amendment in EC for Change in Fuel for 9.9 MW Captive Power Generation
Table 2.1: List of Products Sr. No.
Name of the Product Quantity Existing Proposed
Additional Total
1. Polyester Chips of various types & grades
*49500 MT/Month - *49500 MT/Month
2. Power Generation through Captive Power Plants
**9.9 MW - --
3. Power Generation through Coal fired Captive Power Plant
- @9.9 MW @9.9 MW
Note: 1. * = EC has been obtained for 49500 MT/Month Polyester chips of various types & grades and 8.7 MW power generations through Captive Power Plants in 2012. 2. ** = An amendment in EC for dual fired power engine of 1.2 MW capacities& for change in existing fuel, i.e. Coal instead of Natural Gas by installing 4 Coal fired thermic fluid heaters has been obtained in 2014. 3. @ = After obtaining amendment in EC for installation of 9.9 MW Coal fired Captive Power Plant, existing Captive Power Plants will be standby.
The copy of existing CC&A is attached as Annexure 2.
2.1.2 PROJECT PROPONENT
JBF Industries Ltd., today, stands on a gleaming pinnacle of success as an industry leader in
Polyester Chips & as one of the top 5 players in the Polyester Partially Oriented Yarns (POY) in
India.
The company conceived as a private limited company in 1982, attained the corporate status by
becoming public limited company in the year 1986.
JBF Industries Limited is a Public Limited Company promoted by Mr. B.C. Arya. All the board of
directors have experience of over a decade in the various fields in textile business. Under the
leadership of Mr. Arya and the contribution of individuals and the teamwork has made this fast
paced growth possible.
The list of the board of directors are given below:
Project Pre-feasibility Report
9
Project: Amendment in EC for Change in Fuel for 9.9 MW Captive Power Generation
Table 2.2: List of Directors Sr. No. Name of Directors Designation Nationality
1. Mr. Bhagirath C. Arya Exe. Chairman& Promoter Indian 2. Mrs. Veena B. Arya Non-Exe. Director& Promoter Indian 3. Mr. Rakesh Gothi Managing Director Indian 4. Mr. N K Shah Director Commercial Indian 5. Mr. Prakash Mehta Non-Executive Director Indian 6. Mr. B R Gupta Non-Executive Director Indian 7. Mr. Sunil Diwakar Non-Executive Director Indian 8. Mr.Brij Mohan Bansal Non- Executive Director Indian 9. Mr. Banvar.A. Prabhakar Non-Executive Director Indian 10. Mr. Nikhil kumar Srivastava Non-Executive Director Indian 11. Mr. Vijay S.Bapna Non-Executive Director Indian
2.1.3 NATURE OF THE PROJECT
The Project proponent is seeking amendment in Environmental Clearance for existing polyester
chips manufacturing plant for change in fuel for 9.9 MW captive power generation. The existing
captive power plants will be standby till suitable/ acceptable customers are found/available for
sale/disposal, after proposed amendment. Even after proposed amendment the company is not
going to generate net effective power more than 9.9 MW.
2.1.4 NEED OF PROJECT & DEMAND-SUPPLY GAP
Present requirement of electrical energy is met through the 66 KV (10 MVA contract
demand) power utility connection from DGVCL.
The existing CPP is mostly Natural gas based turbine/generators. But currently it is not
operating due to very high cost of natural gas.
The current energy cost of power supplied by DGVCL is Rs. 7.61 per unit which has
substantial impact on operational cost of the company.
Power generation using natural gas is not economically viable, power supply from DGVCL
which is currently used is also becoming increasingly also. Hence, both conditions are not
viable under current domestic & export market scenario.
Considering the inconsistencies in assured NG supply & economic feasibility, JBF
proposes a fuel change from gas to coal based 9.9 MW CPP to make the manufacturing
cost effective and sustainable.
Project Pre-feasibility Report
10
Project: Amendment in EC for Change in Fuel for 9.9 MW Captive Power Generation
After proposed fuel change for captive generation by installing a 9.9 MW coal based
steam power plant, the electrical energy cost can be reduced upto Rs. 5.00 per unit
considering interest and depreciation and would be viable by continuous operation.
However, while proposing switch-over of fuels, JBF also intends to ensure that the
proposed installations will meet the permissible norms by installing the required APCD like
ESP and lime dosing system.
Most of our competitors are either located in UT of DNH or Daman who have the privilege
of lower power cost (Rs 4.2/unit) or in Gujarat have their own coal base power plant. This
makes our operation difficult and put our sales under lot of pressure.
After the proposed amendment the company will not add any load on the state power grid,
the surrendered power to DGVCL can be beneficial for other power starved industries.
Also, most of the power in grid supply is based on coal so proposed change in fuel for
captive power generation will not increase the overall coal load as the quantity of grid
power consumption will reduce.
The financial feasibility due to proposed change in fuel is provided in below given table 2.3.
Table 2.3: Justification for proposing the fuel change & financial feasibility
S. No.
Description Cost factors:9.9MW CPP with Existing fuel profile
Cost factors: 9.9MW CPP after the Proposed fuel change
4.5 MW Gas Turbine + 2 MW Gas based Power Engine - A Type of fuel Natural Gas -- B. Natural Gas Consumption per
day 54000 SCM/day --
C. Cost of Natural gas per SCM 23 Rs./ SCM -- D. Cost of Natural gas per day 1242000 Rs./day -- 1.2MW Dual fired engine E. Type of fuel HSD -- F. HSD Consumption per day 6000 lit/day -- G. Cost of HSD per lit 50 Rs./lit -- H. Cost of HSD per day 300000 Rs./day -- 2.2MW FO Genset I. Type of fuel Furnace Oil -- J. Furnace Oil Consumption per day 15600 kg/day -- K. Cost of Furnace Oil per kg 23 Rs./kg -- L. Cost of Furnace Oil per day 358800 Rs./day -- After the proposed fuel change M. Type of fuel -- Coal N. Coal Consumption per day -- 1,50,000 kg/day O Total effective power
generated/day 1,90,000 units
P. Cost of power generations @ -- Rs. 950000/-
Project Pre-feasibility Report
11
Project: Amendment in EC for Change in Fuel for 9.9 MW Captive Power Generation
S. No.
Description Cost factors:9.9MW CPP with Existing fuel profile
Cost factors: 9.9MW CPP after the Proposed fuel change
Rs.5.00 / unit Power Output 9.9 MW 9.9 MW Q. Estimated Cost profile 1900800 Rs./day Rs. 950000/day R. Projected Cost/benefit Rs.950800/day Difference in Cost = Total cost per day for Existing Power Plant - Total cost per day for
Proposed Power Plant = 1900800 - 950000= 950800 Rs./day
= 950800 x 330 days = 313764000 Rs./Annum Current cost of power from DGVCL @ Rs.7.61/unit After proposed amendment in fuel change, generation cost from coal will Rs.5.00 Differential cost of Rs.2.61 / unit x 190000 units x 330 days = Rs.16,36,47,000/- per annum Therefore after fuel change from gas to coal and power purchase from DGVCL, the company shall have projected benefit of Rs.31.37 Cr. and Rs.16.36 Cr/Annum respectively
2.1.5 IMPORTS VS. INDIGENOUS PRODUCTION
In-house requirements of power will be fulfilled by proposed 9.9 MW coal fired power plant as in
existing operations it is sourced from DGVCL due to high cost of natural gas.
2.1.6 EXPORT POSSIBILITY Not applicable. It is project for amendment in EC conditions for existing polyester chips
manufacturing plant for change in fuel for 9.9 MW captive power generation to cater in-house
power requirements.
2.1.7 DOMESTIC / EXPORT MARKETS Not applicable. It is project for amendment in EC conditions for existing polyester chips
manufacturing plant for change in fuel for 9.9 MW captive power generation to cater in-house
power requirements.
2.1.8 EMPLOYMENT GENERATION DUE TO PROJECT It is project for amendment in EC conditions for existing polyester chips manufacturing plant for
change in fuel for 9.9 MW captive power generation. However there is scope for about 20
employment.
Project Pre-feasibility Report
12
Project: Amendment in EC for Change in Fuel for 9.9 MW Captive Power Generation
CHAPTER 3
PROJECT DESCRIPTION
3.1 TYPE &LOCATIONOF THE PROJECT
3.1.1 TYPE The proposed project for amendment in EC conditions for existing polyester chips
manufacturing plant for change in fuel for 9.9 MW captive power generation.
3.1.2 LOCATION The existing unit of M/s. JBF Industries Ltd. located at plot no. 11, 12 & 215 to 231, GIDC
Estate, Sarigam, and District: Valsad & the proposed 9.9 MW power plant will be installed in the
existing as well as additional adjoining plots 7/12& 7/13.The location of the project is given in
the figure 2.1.
There is cluster of profuse large-scale, medium scale and small-scale industries, engaged in
manufacturing of pharmaceuticals, organic pigments, organic and inorganic chemicals, textiles,
plastic items, etc.
The GIDC area has a Disaster management cell set up by Sarigam Industrial Association.
Sarigam Waste & Effluent Management Co. Ltd. is affiliated with Vapi Waste & Effluent
Management Co. Ltd., Vapi for the disposal of hazardous waste at its common hazardous waste
disposal site at Vapi. Also, there is proper underground drainage system & a 15MLD CETP
available for further treatment and disposal of the treated effluent to Arabian sea from the
industries.
Location of project site is shown in figures 3.1 & 3.2 and Layout with key plan is shown in figure
3.3.
Project Pre-feasibility Report
13
Project: Amendment in EC for Change in Fuel for 9.9 MW Captive Power Generation
Figure 3.1: Project Site
Project Pre-feasibility Report
14
Project: Amendment in EC for Change in Fuel for 9.9 MW Captive Power Generation
Figure 3.2: Base map of study area
Project Pre-feasibility Report
15
Project: Amendment in EC for Change in Fuel for 9.9 MW Captive Power Generation
Figure 3.3: Layout of Project Site
Project Pre-feasibility Report
16
Project: Amendment in EC for Change in Fuel for 9.9 MW Captive Power Generation
3.2 DETAILS OF THE ALTERNATIVE SITE
Not applicable because proposed project will be located on existing site as well additional land
which is closer to the existing site.
3.3 SIZE & MAGNITUDE OF OPERATION The total magnitude of operation will be 9.9 MW.
3.4 PROJECT DESCRIPTION WITH PROCESS DETAILS
3.4.1 Captive Power Plant
The process comprises, the generation of steam in the boiler and utilization of energy content of
steam in the steam turbine for doing the work on turbine blades to generate mechanical energy.
The mechanical energy is converted to electrical energy by the generator coupled to the steam
turbine.
The steam is generated in a 45 Ton capacity AFBC boiler at a working pressure of 87 bar and
515 OC temp.
The major system and components of boiler includes feed water system, coal feeding system
with combustion control, FD & ID fan, air pre-heater, ESP, ash removal &handling system.
The steam generated in the boiler is piped to the inlet of steam turbine and pass through the
nozzles where pressure energy of steam is converted to kinetic energy and directed towards a
series of moving and stationary blades to do the work on the turbine wheel and expands to a
lower pressure and finally to vacuum in the range of 0.186 (abs) bar. The outlet steam from the
turbine is passed to air cooled condenser, where it is condensed back to water in the range of
54OC and water is further re-utilized for continuous feed supply to boiler and cycle is repeated.
Project Pre-feasibility Report
17
Project: Amendment in EC for Change in Fuel for 9.9 MW Captive Power Generation
Figure 3.4: Flow Diagram of Coal Fired 9.9 MW CPP
Project Pre-feasibility Report
18
Project: Amendment in EC for Change in Fuel for 9.9 MW Captive Power Generation
3.4.2 Auxiliary Systems
Auxiliary system contains of coal handling system and Ash handling system.
3.4.2.1 Coal Handling System
The design criteria for receipt of Indonesian coal/ Indian Coal are by covered trucks. The coal is
delivered in fully covered coal yard and stacked by the stackers. The stacker loader, load the
coal in coal hopper. From hopper, coal is fed through vibratory feeder to the belt conveyor,
crusher and sieving screen and particles of less than 10 mm size is fed through a series of belt
conveyors to the coal bunkers.
Conveyer belts will be as per the Indian Standards IS: 1891 (Part I) 1994, Nylon nylon type
with suitable top & bottom cover. The number of plies will be suitably selected with due regard
to load/ flexibility of toughing & shall be not less than operating tension of the belt at specified
full load & shall not exceed 90% of the rated strength. However, the number of plies shall not be
less than 3 & the grading shall be suitable for heavy duty application. All belts shall be joined by
vulcanized splicing. The clearance between the return side of the belt & the conveyor floor shall
be adequate to avoid fouling of the return belt with the spilled coal. The technical specifications
for Coal Handling System are attached as Annexure 3.
Suitable and adequate water sprinkler system will be provided over dust generation points, to
contain and minimise possible dusting during to coal handling. It is proposed to utilize treated
effluent for water sprinklers.
GPCB guidelines for Coal handling is being followed.
3.4.2.2 Lime Dosing System
Every feed zone in boiler shall be provided with lime feeding system to control the SO2
generation from coal burning. There will be provision for online dosing of quality lime stone in
the FBC boiler for control and containment of Sulphur dioxide emissions into atmosphere
3.4.2.3 Ash Handling System
The flue gas will pass through economizers, air pre heaters, and electrostatic precipitators and
ID fan to the chimney. The collection vessels will be provided at the bottom of the economizers,
Project Pre-feasibility Report
19
Project: Amendment in EC for Change in Fuel for 9.9 MW Captive Power Generation
air pre heater and the electrostatic precipitator hoppers. The dry ash collected in vessels will be
conveyed to ash silos by the application of compressed air. The ash accumulated in ash silos
will be loaded in to tankers/covered trucks given to the manufacturer of Bricks and ready mix
concretes for promoting fly ash utilization, in compliance with the Fly Ash Rules. The technical
specifications for Ash Handling System are attached as Annexure 4.
Ash handling will be done by dense phase pneumatic conveying.
Dense Phase Conveying System
One major concern for operating a Coal based Thermal power plant is the proper management
of Ash generated after combustion of Coal, which is generally generated in the furnace itself
and is trapped by the ESP. If proper system is installed for handling this ash, major hurdle of
ash management can be overcome.
The Dense Phase Conveying System is the most reliable; efficient to minimize particularly the
problems for handling the wide and adequate range of dry bulk solids up to 200 TPH capacities
at the exceeding terminal distances - 1,200 mtrs. This system includes weighing, batching,
blending, lump breaking, storage, master control equipments etc. through Dense Phase
Conveying System for bulk material handling in the plant.
Dense Phase System is applicable to push the highly dense concentration of bulk solids
effectively at a low constant speed inside the conveying pipe lines. Any type of material (heavy,
abrasive or, fragile, crystalline or granular) can be conveyed without causing the degradation
due to low velocity and less wear to the system components. This type of conveying is reliable,
flexible and maintenance free due to less number of moving parts and it can be easily installed
at places where space availability is very less specially for installing conventional conveying
systems.
The limited volume of air is utilized at the transporting vessel to move the material into the line
at maximum density while the balance air quantity is added along the conveying line through
coupling unit provided at starting on the pipeline to overcome the pipeline frictional losses; thus
pumping material at the highest obtainable efficiency. The Coupling Unit ensures a uniform
gradient and helps to maintain the material at maximum density. It also helps in maintaining the
desired velocity and overcoming the pipeline / bend's friction and helps to restart the flow of
Project Pre-feasibility Report
20
Project: Amendment in EC for Change in Fuel for 9.9 MW Captive Power Generation
blocked material if any along the conveying line regardless of length. This Coupling Unit also
helps in minimizing the compressed air consumption and pipe abrasion.
The plugging problem is prevented by improving the ratio of the material to air throughout the
system to convey the material at the highest obtainable efficiency and degree of reliability. The
highly abrasive materials can be conveniently conveyed at lowest possible velocities consuming
nominal quantity of air with the help of these systems. The highly flexible check valve provided
with Coupling Unit fittings are very responsive to any back feeding due to changes in conveying
line pressure thereby allowing throttling of the air supply pressure and volume automatically.
The designing of the system depends upon the properties of the material like convey ability,
moisture contents, product degradation, bulk densities etc.
3.5 RAW MATERIAL FOR FINISHED PRODUCTS Not applicable. The project is for amendment in EC conditions for existing polyester chips
manufacturing plant for change in fuel for 9.9 MW captive power generation.
3.6 HAZARDOUS CHEMICAL STORAGE & HANDLING
Not applicable. It is project for amendment in EC conditions for existing polyester chips
manufacturing plant for change in fuel for 9.9 MW captive power generation.
3.7 RESOURCE OPTIMIZATION& AVAILABILITY The major resources for the proposed project will be plant & machinery, raw-materials, power,
fuel, water, man-power, etc.
3.7.1 Land & Building Requirement
The proposed installation will be accommodated in the existing land & some part of proposed
installation will be done on additionally adjoining plots 7/12 & 7/13.The existing plots and
additional land are taken on lease from the GIDC.
3.7.2 Equipment Based on process necessity, list of the proposed and machinery is as below
Project Pre-feasibility Report
21
Project: Amendment in EC for Change in Fuel for 9.9 MW Captive Power Generation
Table 3.1: List of Proposed Equipment
S. No. Name of Equipment Quantity 1. 45 TPH FBC Boiler with auxiliaries 1 2. 9.9 MW steam turbine with 11 KV Alternator 1 3. Coal conveying system 1 set 4. Ash Conveying system 1 set 5. Air cooled condenser 1 set 6. ESP 1 7. Chimney: 63 metre 1
3.7.3 Power Requirement In existing operations, the unit has a power requirement of 9.5MW. The total requirement is
fulfilled by DGVCL.
For the proposed amendment project, total 10.4 MW power will be required. Out of which 9.5
MW for process plant & the auxiliary power requirement @0.9 MW for power plant. From
DGVCL contract demand 10 MVA will be reduced to 4.50 MVA after implementation of
proposed amendment.
3.7.4 Fuel Requirement
The fuel requirement is given below in Table no. 3.2.
Require for power generation (shall be standby after proposed amendment f 9 9 MW l fi d2. Indian Coal 77 MT/ day -- 77 MT/
day Shri Hari Coal Corporation
Required in existing TFH
3. Indonesian Coal
173 MT/ day
150 MT/ day 323 MT/ day
Adani Enterprise Ltd.
Required in existing TFH & proposed CPP
3. Furnace Oil 650 kg/Hr -- 650 kg/Hr HPCL/BPCL Required for power generation as standby
4. HSD* 250 Lits/Hr -- 250 Lits/Hr
Petrol pump Required for power generation as standby
Note: *Natural gas based equipment will be stand by only due to techno commercial reasons, issues regarding uncertainty of continuous supply and pricing factors.
Project Pre-feasibility Report
22
Project: Amendment in EC for Change in Fuel for 9.9 MW Captive Power Generation
The MoU with Coal Supplier is attached as Annexure 5.
3.7.5 Water Requirement
The water requirement for the existing unit is catered through the GIDC Water Supply Dept.
Total water consumption is 1154 KLD out of which fresh water consumption is 1023 KLD.
Remaining 131 KLD water requirements is fulfilled by recycled water.
After proposed amendment project, there will be increase in water requirements by 98 KLD.
Hence, total water requirement will be 1252 KLD out of which fresh water consumption is
1091KLD. Remaining 161 KLD water requirements is fulfilled by recycled water. The source of
water will be GIDC Water Supply Dept.
Table 3.3: Total Water Consumption (KLD) Sr. No. Details Existing Qty Proposed
Additional Qty Total Qty
1 Domestic 55.00 2.00 57.00 2 Gardening 15.00 -- 15.00 3 Industrial 1084.00 96.00 1180.00 a Process 80.00 -- 80.00 b Process Steam Makeup Water
from WHRB 48.00 -- 48.00
c Boiler -- 69.00 69.00 d DM regeneration 5.00 3.00 8.00 e Cooling make-up 745.00 24.00 769.00 f Washings 206.00 -- 206.00
Total 1154.00 98.00 1252.00 Note:
In existing operations, total cooling tower requirement 745 KLD = 614 KLD fresh water + 131 KLD recycled water
After proposed amendment project, total cooling tower requirement 769 KLD = 608 KLD fresh water + 161 KLD recycled water
(Source: JBF Industries Ltd - Sarigam)
3.7.6 Man-Power Requirement
It is project for amendment in EC conditions of existing polyester chips manufacturing plant for
change in fuel for 9.9 MW captive power generation. However, there is scope for about 20
employment.
Project Pre-feasibility Report
23
Project: Amendment in EC for Change in Fuel for 9.9 MW Captive Power Generation
Table 3.4: Man-power Requirement
S. No. Level of Employee Numbers 1. First class Boiler Operator (3 + 1) 4.00 2. Turbine Operator (3 + 1) 4.00 3. Helper for Operation & Maintenance 12.00
3.8 QUANTITY OF WASTE TO BE GENERATED
3.8.1 Waste Water Generation & Management There will be marginal increase in quantity of waste water generation due to the proposed
amendment. However, the quantity of wastewater disposal will remain same.
After proposed amendment project, the wastewater generated @707 KLD will be treated in the
existing ETP and 161 KLD will be reused as partial cooling water makeup after passing through
RO. The rejects from the RO plant @70 KLD & remaining 474 KLD ETP treated water will be
discharged through GIDC underground drainage from where ultimately it will be conveyed into
the deep Arabian Sea.
The category wise bifurcation of the waste water generation is given in Table 3.5. Table 3.5:Category-wise Wastewater Generation (in KLD) Sr. No. Details Existing Qty Proposed
Additional Qty Total Qty
1 Domestic 50.00 -- 50.00 2 Gardening -- -- -- 3 Industrial 675.00 32.00 707.00 a Process *325.00 -- *325.00 b Blow down of Process Steam
from WHRB 14.00 -- 14.00
c Boiler blow down -- 26.00 26.00 d DM regeneration 5.00 3.00 8.00 e Cooling blow down 125.00 3.00 128.00 f Washings 206.00 -- 206.00
Total 725.00 32.00 757.00 *Reaction water from Esterification
Project Pre-feasibility Report
24
Project: Amendment in EC for Change in Fuel for 9.9 MW Captive Power Generation
Figure 3.5 (a): Existing Water Balance Diagram (in KLD)
Project Pre-feasibility Report
25
Project: Amendment in EC for Change in Fuel for 9.9 MW Captive Power Generation
Figure 3.5 (b): Proposed Water Balance Diagram (in KLD)
3.8.2 WASTE WATER CHARACTERISTICS The wastewater characteristic of effluent before treatment in ETP is given below in Table No.
(Sea Discharge through CETP) 1. pH 4.5 to 6 7 to 8.5 6.5 to 8.5 2. SS 50 to 200 10 to 50 <300 3 TDS 500 to 1000 700 to 1600 <2100 4. COD 5000 to 8000 100 to 200 < 750 5. BOD 1500 to 2500 20 to 60 < 300 Note: All above values in mg/ lit except pH or where specified
(Source: JBF Industries Ltd - Sarigam)
Project Pre-feasibility Report
26
Project: Amendment in EC for Change in Fuel for 9.9 MW Captive Power Generation
3.8.3 WASTE WATER TREATMENT & DISPOSAL
In existing operations, the total domestic wastewater generated @50 KLD and is treated
along with the industrial effluent and discharged in to GIDC u/g drain
Wastewater generated from industrial activities @675 KLD is treated in ETP. Out of which
190 KLD is treated in RO.
Permeate from RO @131 KLD is recycled to cooling tower makeup.
Remaining treated effluent @485 KLD & RO reject @59 KLD is discharged through GIDC
underground drainage from where ultimately it is conveyed into the deep Arabian Sea.
After proposed amendment project, there will be no increase in domestic waste water.
Whereas, wastewater generated from industrial activities @707 KLD waste water will be
treated in ETP. Out of which 231 KLD will be treated in RO.
Permeate from RO @161 KLD will be recycled to cooling tower makeup.
Remaining treated effluent @474 KLD & RO reject @70KLD will be discharged through
GIDC underground drainage from where ultimately it will be conveyed into Arabian Sea.
Effluent Treatment Scheme The existing effluent treatment plant consists of pre-treatment, primary, secondary and tertiary
treatment units.
The existing operation have adequate ETP infrastructure to meet all the consent standards.
Project: Amendment in EC for Change in Fuel for 9.9 MW Captive Power Generation
Table 3.7: Adequacy of Existing ETP
Sr. No.
Unit Quantity (Nos.)
Capacity/Holding volume (m3)
Retention Time/ Capacity/ Working volume
Remarks
Required Provided
Wastewater Flow: 707 KLD 1.
Stripping Column 2 1
12 m3/hr. 9 m3/hr
-- -- The total installed capacity of the strippers is 768m3/day which is more than adequate as there is no increase in production capacity or effluent generation
Proposed additional installation for amendement by installation of 9.9 MW Power Plant Steam Boiler Capacity: 45 MT/hr
Imported Coal @5.4 MT/hr.
H: 63 m D: 2.2 m
PM, SO2, NOx ESP, Lime dosing
--
Note: 1. H = Height of stack from ground level, D = Top diameter of stack 2. Besides above installations, 4 nos. of old Natural gas fired TFHs (10 M.kCal/hr. each) are also stand-by. There will be no change after the proposed amendment.
The air dispersion modeling report is attached as Annexure 6.
Project Pre-feasibility Report
30
Project: Amendment in EC for Change in Fuel for 9.9 MW Captive Power Generation
3.8.4.3 Fugitive Emission Fugitive emissions are likely to be generated in form of dust while unloading, grinding, handling
and conveying the Coal & ash handling. Loading/unloading of Coal is/ will be done in completely
closed environment. All conveying /handling is/ will be done using enclosed conveyors. Ash is/
will be collected in vessel from the bottom of the economizers, air pre heater and the
electrostatic precipitator hoppers & conveyed to ash silo by the application of compressed air.
Ash handling will be done by dense phase pneumatic conveying. From silo, it will be loaded in
to tankers or covered trucks to the manufacturer of Bricks and ready mix concretes
Properly closed of storage facilities and dust arrestors/suppression & extraction system will be
installed to contain and minimize spread of dust. Adequate water sprinkling system will be
installed in the Coal storage area as well as covered coal conveyance system.
3.8.5 HAZARDOUS/NON-HAZARDOUS. WASTES MANAGEMENT The hazardous wastes are generated, handled, stored, transported and disposed as per CPCB/
MoEF guidelines and incompliance with the GPCB Authorization. The company has
membership of TSDF Site - Saurashtra Enviro Projects Pvt. Limited. There will be no increase in
generation of hazardous waste due to proposed installation. However, fly ash will be generated
from the burning of coal in the boiler. Fly ash will be given to brick manufacturers and the
remaining utilized for cement brick/ready to use cement aggregate manufacturers and civil
construction in compliance with Fly ash rules. The MoU with brick manufacturers for utilization
of fly ash is attached as Annexure-7.
Table 3.9: Details of Hazardous Waste Generation & Disposal
Particulars Existing Qty Proposed
Additonal Qty
Total Qty Disposal
Fly Ash 50 MT/day 25 MT/day 75MT/day Fly ash from boiler will be given to the brick manufacturers/ and the rest utilised in compliance with Fly ash rules.
3.8.6 NOISE CONTROL In existing operations, noise generated in the process area is mainly from operation of heavy
duty motors, chip cutters, blowers and compressors in various sections of the manufacturing
Project Pre-feasibility Report
31
Project: Amendment in EC for Change in Fuel for 9.9 MW Captive Power Generation
plant area. The compressors and operation in utility area also result in high noise
generation viz. above 85 dB (A). Due to power plant operations, noise pollution is arising from
turbine, compressor, generator room, etc. The control measures to be taken for reduction in
noise levels are as below:
The turbine is provided with an acoustic enclosure.
The plant and equipment is specified and designed with a view to minimize noise
pollution.
The major noise producing equipment such as turbine is provided with acoustic
enclosure.
Sturdy foundation & pads to all the noise generating equipment is/ will be provided.
Ear Plugs and Ear muffs is/ will be provided to the workers in Utility Section.
Regular maintenance of is/ will be carried out to minimize the noise
generated by the .
Regular monitoring of noise levels at all areas is/ will be carried out.
Greenbelt will be maintained.
For the proposed installation of 9.9 MW coal fired power plant, acoustic enclosure will be
provided for turbine and silencers will be provided at vent of boilers to reduce the vibration &
noise <85 dB level. Also there will no generation of noise from soot blowing.
3.9 HEALTH AND SAFETY MEASURES The company is concerned about occupational health and safety among its
work force as the man power is the biggest asset to the company.
The following key safety measures are implemented in the existing operation & same will be
practiced after proposed amendment project:
All the electrical fittings shall be flameproof.
Applicable PPEs is provided to all workers in the plant.
Standard First Aid Box is available in each department.
Dedicated Occupation Health Centre is provided to deal with any emergency.
List of emergency contact numbers is displayed at all strategic locations.
Emergency alarm is provided at each individual unit.
Maximum handling of material with the help of stacker and forklift to minimize manual handling.
Project Pre-feasibility Report
32
Project: Amendment in EC for Change in Fuel for 9.9 MW Captive Power Generation
Safety / Health records and MSDS are maintained.
3.10 ENVIRONMENTAL HEALTH & SAFETY CELL The company has a full-fledged environment health & safety cell (EHS) in order to keep a close
watch on the performance of the pollution control equipment, emissions from the sources and
the quality of surrounding environment in accordance with the monitoring program. The cell is
also entrusted with the responsibilities of regulating the safety measures inside the plant
campus. The cell is also responsible for maintaining the records of all data, documents and
information in line within the legislative requirement. The company is committed to comply with
ISO 9001; ISO 14001; IOHSAS 18001certifications and all the statutory requirements.
3.11 POST PROJECT MONITORING PLAN The company has developed in-house facilities for monitoring all major components. Where it is
not possible to establish such facilities, the same has been done by appointing external
recognized/approved agencies. The proposed post-project monitoring plan is given below:
Table 3.10: Post Project Monitoring Plan
Components Parameters Frequency of in house monitoring
Frequency of third party monitoring
Waste water monitoring
pH, TSS, TDS, BOD, COD, Oil & Grease
Daily (At all stages of ETP)
Quarterly(treated and untreated)
Air-ambient monitoring
PM10, PM2.5, SO2, NO2 -- Quarterly
Stack monitoring PM, SO2, NOx -- Quarterly Noise monitoring Noise levels in dB (A) -- Once in a month at
different locations inside the plant site.
Workplace monitoring PM10 -- Quarterly.
Project Pre-feasibility Report
33
Project: Amendment in EC for Change in Fuel for 9.9 MW Captive Power Generation
CHAPTER 4
SITE ANALYSIS
4.1 CONNECTIVITY The existing unit located at Plot No. 11, 12 & 215 to 231, GIDC Estate, Sarigam-396 155, and
District: Valsad & the proposed power plant will be set up in the existing site & additional
adjoining plots near the existing site. The Site is 1.10 km from Sarigam. The site is 4.2 km from
National Highway. The land and infrastructure is already available and the raw material is easily
available through the easy transport via road connectivity. The nearest Railway station is Bhilad
railway station which is 4 km and Surat airport is 91.90 km from the project site.
4.2 LANDFORM, LAND USE & LAND OWNERSHIP
The proposed installation will be accommodated in existing as well as the additional adjoining
plot no. 7/12& 7/13.The existing plots and additional land are/will be taken on lease from the
GIDC.
4.3 TOPOGRAPHY
The proposed site for installation of turbine is flat.
4.4 SALIENT FEATURES Table 4.1: Salient Features of the Project Site
Project: Amendment in EC for Change in Fuel for 9.9 MW Captive Power Generation
Particulars Details Protected areas (National parks/ sanctuaries)
None within 10 km radial periphery
4.5 EXISTINGINFRASTRUCTURE
Well-developed infrastructure is available at site and around the site.
4.6 SOIL CLASSIFICATION
Not applicable as application for amendment in EC for existing polyester chips manufacturing
plant for change in fuel for 9.9 MW captive power generation.
4.7 CLIMATE& METEROLOGY The year can be divided into four seasons. Climate is warm and dry from mid-March to June,
during season of summer, climate remains warm and dry, while during rainy season, from mid-
June to end of September, climate is humid and pleasant. From October to November mild
warm climate prevails, and from December to February climate is cold.
The Table 4.2 indicates the summary of meteorological pattern at the nearest observatory of
IMD, Dahanu published by IMD.
Table 4.2: Summary Meteorological Data at nearest IMD Station Dahanu
Location: In the compound of Old Girdhardhas Dispensary, DAHANU, Maharashtra ( Lat: N 19o o Aerial Dist from Project Site: Approx.40.48 km (SSW) Height of installation: 11m above MSL, Month Temperature (oC) Relative
Humidity (%)
Cloud Cover (Oktas)
Mean Wind Speed
(m/s)
Pre-dominant Wind
Direction
Rainfall (mm)
Max. Min. Mor. Eve. Max. Min. January 27.7 16.5 67 69 1.3 1.1 11.3 N 0.2 February 28.3 17.4 66 69 1.1 0.8 11.7 N 0.2 March 30.3 20.7 68 67 1.4 1.1 12.9 N 0.1 April 32.2 24.0 74 69 2.1 1.4 13.7 W 0.1 May 33.1 26.8 77 73 3.8 2.3 15.5 W 5.2 June 32.2 26.3 85 80 6.1 5.6 17.7 SW 522.1 July 30.1 25.0 89 84 7.1 6.8 22.6 SW 771.7 August 29.5 24.7 88 83 6.9 6.7 22.6 W 502.3 September 30.0 24.0 87 79 5.4 4.9 14.6 W 319.1 October 32.1 23.1 77 72 2.8 2.4 10.0 E 44.4 November 32.1 20.5 67 71 1.9 1.9 9.4 N 17.1 December 29.8 18.0 67 71 1.6 1.5 10.0 N 0.3
in India (1951 -
Project Pre-feasibility Report
35
Project: Amendment in EC for Change in Fuel for 9.9 MW Captive Power Generation
4.7.1 TEMPERATURE
The summer season from March to May is a one of continuous increase in temperatures which
decreases during monsoons, increases slightly during the post-monsoon season and again
decreases during the winter. May is generally the hottest month with the mean daily maximum
temperature recorded at 33.1 oC and mean daily minimum temperature recorded at 26.8oC.
January is the coldest month with the mean daily maximum temperature as 27.7 oC and mean
daily minimum temperature observed as 16.5 oC.
4.7.2 HUMIDITY
The climate of the region is characterized by a humid summer because of the closeness to
coastline. Humidity is usually high during the monsoon months, with average relative humidity
generally exceeding 80%. Humidity decreases gradually during the post-monsoon months and
for rest of the year i.e. the period of December to April, the average relative humidity ranges
around 50-70%.
4.7.3 RAINFALL
About 95% of the annual rainfall is received during the southwest monsoon season i.e. from
June to September, July being the month with highest rainfall. The total annual rainfall observed
from the historical data of year 1951-1980 is 2182 mm.
4.7.5 WIND PATTERN
The annual resultant vector for wind direction shows winds blowing from WSW. During
summers and monsoon, the winds blow mostly from the sea i.e. the SW or WSW direction. The
post-monsoon & winter seasons experience a change in direction, with the winds blowing from
NE, ENE or NNE. The wind speed is high during monsoon and post monsoon seasons, slightly
moderate during summer and winter seasons.
4.8 SOCIAL INFRASTRUCTURE
Not applicable as application for amendment in EC for existing polyester chips manufacturing
plant for change in fuel for 9.9 MW captive power generation.
Project Pre-feasibility Report
36
Project: Amendment in EC for Change in Fuel for 9.9 MW Captive Power Generation
CHAPTER 5
PLANNING BRIEF
5.1 PLANNING CONCEPT The existing unit located at Plot No. 11 & 215 to 231, GIDC Estate, Sarigam-396 155, and
District: Valsad & the proposed power plant will be installed at additional plot No. 12. The
nearest town from the project site is Vapi.
The region is well planned with all the basic infrastructural facilities like internal roads, water
supply, arrangements for power, streetlights, solid waste disposal sites etc.
5.2 POPULATION PROJECTION
Not applicable as application for amendment in EC for existing polyester chips manufacturing
plant for change in fuel for 9.9 MW captive power generation.
5.3 AREA STATEMENT The proposed installation will be accommodated in the existing open area of 1712m2as well as
additionally acquired land of 1350 m2. The total area of the plot is 59907m2& the new acquired
area will be 1350 m2. Hence, the total area after proposed installation will be 61257 m2.out of
which Green belt area of the plant is 6562.74m2which is 10.95%. The bifurcation of the same is
given below in table no. 5.1.
Table 5.1: Area Statement
Particular Area (m2) Existing Proposed Addition/
Reduction Total
Plant area 5596.89 3062.00* 8658.89 Utility area 9191.65 ------ 9191.65 ETP area 3780.5 -------- 3780.50 Finished goods area 8007.00 ------- 8007.00 RM storage area 5826.34 -------- 5826.34 Parking area 3540.00 -------- 3540.00 Greenbelt area 6562.74 -------- 6562.74 Internal roads 8638.91 --------- 8638.91 Open area 8762.97 (-1712.00)* 7050.97 Total Plot Area 59907.00 1350.00 61257.00 Note: *Proposed 9.9 MW coal fired power plant will be established in total area of 3062 m2 includes new additional plot of 1350 m2 land&1712 m2land from open area (8762.97 m2) of existing premises.
Project Pre-feasibility Report
37
Project: Amendment in EC for Change in Fuel for 9.9 MW Captive Power Generation
5.4 ASSESMENT OF INFRASTRUCTURE DEMAND (PHYSICAL & SOCIAL)
Not applicable as application for amendment in EC for existing polyester chips manufacturing
plant for change in fuel for 9.9 MW captive power generation.
5.5 AMENITIES/FACILITIES
Not applicable as application for amendment in EC for existing polyester chips manufacturing
plant for change in fuel for 9.9 MW captive power generation.
Project Pre-feasibility Report
38
Project: Amendment in EC for Change in Fuel for 9.9 MW Captive Power Generation
CHAPTER 6
PROPOSED INFRASTRUCTURE
6.1 INDUSTRIAL AREA The total area of the plot after obtaining lease of additional land will be 61,257 m2, out of which,
greenbelt area of the plant is 6562.74m2, which will be10.95% of the total area. Area
requirement for the proposed installations will be 3062 m2.
6.2 RESIDENTIAL AREA In the said proposal no Residential area has been proposed for workers and/or for staff.
6.3 GREENBELT 6562.74 m2 of total plot area is developed as greenbelt.
6.4 SOCIAL INFRASTUCURE Existing infrastructure will be sufficient to accommodate the existing load from the proposed
project which is very low.
6.5 CONNECTIVITY
The existing unit located at Plot No. 11, 12 & 215 to 231, GIDC Estate, Sarigam-396 155, and
District: Valsad & the proposed power plant will be installed at existing plots & additionally
acquired plot No. 7/12& 7/13. The Site is 1.10 km from Sarigam. The site is 4.2 km from
National Highway. The land and infrastructure is already available and the raw material is easily
available through the easy transport via road connectivity. The nearest Railway station is Bhilad
railway station which is 4 km and Surat airport is 91.90 km from the project site.
6.6 DRINKING WATER MANAGEMENT The source of drinking water is/ will be GIDC water supply.
Project Pre-feasibility Report
39
Project: Amendment in EC for Change in Fuel for 9.9 MW Captive Power Generation
6.7 SEWERAGE SYSTEM Domestic waste water generated from the existing operations @50 KLD is treated along with the
industrial effluent and discharged into GIDC U/G drain in compliance with the consent standards and is
finally discharged into Arebian sea through Marine diffusers No additional sewage will be generated.
6.8 INDUSTRIAL WASTE MANAGEMENT Industrial Effluent will be treated in the Effluent Treatment Plant at the site. Details are explained
in Chapter 03, Section 3.7.3.
6.9 SOLID WASTE MANAGEMENT Existing operations generate about 50 MT/day fly ash and is regularly disposed/utilised in
compliance with Fly ash rules. The proposed project amendment has the potential to generate
about 25 MT/day. This also will be utilized/disposed in compliance with Fly ash rules.
6.10 POWER REQUIREMENT & SOURCE OF SUPPLY In existing operations, the unit has a power requirement of 9.5MW. The total requirement is
fulfilled by DGVCL.
After proposed amendment project, total power requirement will be 10.4 MW power. Out of
which 9.5 MW for process plant will be met by proposed power& the auxiliary power
requirement @0.9 MW will be fed from DGVCL source.
Project Pre-feasibility Report
40
Project: Amendment in EC for Change in Fuel for 9.9 MW Captive Power Generation
5CHAPTER 7
REHABILITATION &RESETTLEMENT (R &R) PLAN 7.1 POLICY TO BE ADOPTED
Not applicable as application for amendment in EC for existing polyester chips manufacturing
plant for change in fuel for 9.9 MW captive power generation.
Project Pre-feasibility Report
41
Project: Amendment in EC for Change in Fuel for 9.9 MW Captive Power Generation
CHAPTER 8
PROJECT SCHEDULE & COST ESTIMATES 8.1 TIME SCHEDULE OF THE PROJECT The installation/ construction will be started after getting approval for Environmental Clearance and NOC from authorities. 8.2 ESTIMATED PROJECT COST The approx. capital cost for proposed project of amendment in EC for existing polyester chips
manufacturing plant for change in fuel for 9.9 MW captive power generation will be 3590 Lakhs.
The bifurcation is as below - Table 8.1: Total Capital Cost Projection
Sr. No.
Purpose Capital Cost (Lakhs)
1. Land (Lease Cost) 15.00 2. Building 100 3. Plant & Machinery 3000 4 Electrification and Administrative set-up 25 5. Environment Protection (including ETP, APCD etc.)
Project: Amendment in EC for Change in Fuel for 9.9 MW Captive Power Generation
CHAPTER 9
ANALYSIS OF PROPOSAL 9.1 FINANCIAL & SOCIAL BENEFITS The project benefits from amendment in existing EC conditions for existing polyester chips
manufacturing plant for change in fuel for 9.9 MW captive power generation are as below -
In existing operations, the unit has a power requirement of 9.5 MW. The total
requirement is fulfilled by DGVCL.
After proposed amendment project, total 10.4 MW power will be required. Out of which
9.5 MW for process plant will be met by proposed power plant & 0.9 will be fed from
DGVCL.
Thus electrical energy cost can be reduced in the range of Rs. 5.95 per unit after
considering interest and depreciation.
There will be reduction in the total load on the electricity department which is also
generating electricity by Coal.
A
Annexure 1(a): Copy of Existing EC with Amendments
1. EC for amendment for change in existing fuel i.e. Coal instead of Natural Gas by installing 4 Coal fired heater
Page 1
B
Page 2
C
2. Amendment in EC for installation of 1.2 MW dual fired power engine as a back-uparrangement
Page 3
D
Page 4
E
3. Existing EC for expansion of project by capacity enhancement of Polyester Chips (36000 TPM to 49500 TPM) & Captive Power Generation Capacity (4.5MW to 8.7MW)
Page 5
F
Page 6
G
Page 7
H
Page 8
I
Page 9
J
Annexure 1(b): Forwarding Letter for EC Compliance Report Submitted to RO Bhopal
Page 10
K
Annexure 2: Copy of Existing CC&A
Page 11
L
Page 12
M
Page 13
N
Page 14
O
Annexure 3: Technical Specifications of Coal Handling System
Page 15
P
Page 16
Q
Page 17
R
Annexure 4: Technical Specifications of Ash Handling System
Page 18
S
Annexure 5: MoU with Coal Supplier
Page 19
T
Page 20
Air Dispersion Modeling Report for Amendment in EC for Existing Polyester Plant for Change in Fuel for 9.9 MW CPP by M/s. JBF Industries Ltd., GIDC, Sarigam
Page | 1
Air Dispersion Modeling
For
Amendment in Existing EC for Existing PolyesterManufacturing Plant for Change in fuel for 9.9 MW Captive Power GenerationAtPlot Nos. 11, 12 & 215 to 231, GIDC, Sarigam
Client:JBF INDUSTRIES LTD. June 2016
Precitech Laboratories Pvt. Ltd.1st Floor, Bhanujyot Complex, Plot No. C5/27, Opp Oriental Ins. Co. Ltd., Nr. GIDC Char Rasta, Vapi 396195Telefax: (0260) 2425542, 2420995Email: [email protected]
Annexure 6
Air Dispersion Modeling Report for Amendment in Existing EC by installing Coal Fired 9.9 MW Power Plant by M/s. JBF Industries Ltd., GIDC, Sarigam
Page | 2
1.0 Precitech Laboratories Pvt. Ltd.
Precitech Laboratories Pvt. Ltd. is an Environmental Consultancy Firm engaged in the field of environmental engineering, testing/monitoring & consultancy services since 1991. Based at Vapi, it has its branch offices in Ankleshwar, Rajkot and Ahmedabad.
It holds the following Recognitions:
QCI-NABET accredited EIA Consultant Organization.Recognized Environmental Laboratory under EPA Act 1986 from MoEF.An ISO 9001: 2000 and OHSAS 8001: 2007 certified Laboratory.Recognized Environmental Auditors with GPCB.
.
2.0 Scope of Work
The detailed scope of work is as below:
2.1 Maximum GLC for a radius of 10 km will be predicted on the Gaussian plume model in ISC-AERMOD (by Lakes Environmental, Canada)
computer user-interface based on the ISCST3 model developed by USEPA.
2.2 The details of various stack emissions detail to be furnished by the client.
2.3 The output will be provided in form of a report with the results in tabular and contour forms.
Air Dispersion Modeling Report for Amendment in EC for Existing Polyester Plant for Change in Fuel for 9.9 MW CPP by M/s. JBF Industries Ltd., GIDC, Sarigam
Page | 3
3.0 Details required from the Client
The following details were requested from the client:
Stack emission details:
Stack height, Stack internal diameter at top, Exit gas velocity, Exit gas temperature, Characteristics of the fuels to be used and their consumption rates,Site layout with stack locations for assigning the coordinates.
4.0 The Dispersion Software -
The dispersion of pollutants in the atmosphere is a function of several meteorological parameters viz. wind speed, direction, stability class, etc. A number of models have been developed for the prediction of pollutant concentration at any point from an emitting source. The Industrial Source Complex Short Term (ISCST3) dispersion model is a steady-state Gaussian plume model. It is most widely accepted for its interpretability. It gives reasonably correct values because this obeys the equation of continuity and it also takes care of diffusion, which is a random process. It is also accepted by the Ministry of Environment & Forests, Govt. of India.
For the present study, the software-graphical user interface - , developed byLakes Environmental, Canada, using the ISCST3 model, was used for the prediction of maximum ground level concentration (GLC).
Air Dispersion Modeling Report for Amendment in EC for Existing Polyester Plant for Change in Fuel for 9.9 MW CPP by M/s. JBF Industries Ltd., GIDC, Sarigam
Page | 4
5.0 The Methodology
The dispersion modeling for prediction of GLC was carried out based on following considerations:
For the existing scenario, the model has been run for 3 nos. of stacks as below:
Stack-1: Common stack attached to 2 installations as below:oFO based Genset @2.2 MW - a stand-by facility, but considered for modeling for
worst case scenario during power failure.
oDual fired engine @1.2MW HSD considered as fuel for worst case scenario
during power failure.
Stack-2: Gas turbine with WHR system @4.5MW currently as standby facility due
to increase in NG rates, but considered for modeling for worst case scenario during
power failure.
Stack-3: Gas based Power Engine @2MW currently as standby facility due to
increase in NG rates, but considered for modeling for worst case scenario during
power failure.
Stack-4: Common stack attached to 2 nos. of Coal fired heaters of capacity 14 Lakh.kCal/hr.
Stack-5: Common stack attached to 2 nos. of Coal fired heaters of capacity 10 Lakh.kCal/hr. only 1 no. considered for modeling as 1 no. to act as a standby
facility.
For the proposed scenario, the model has been run for 5 nos. of stacks as below:
Stack-4: Common stack attached to 2 nos. of Coal fired heaters of capacity 14 Lakh.kCal/hr.
Stack-5: Common stack attached to 2 nos. of Coal fired heaters of capacity 10 Lakh.kCal/hr. only 1 no. considered for modeling as 1 no. to act as a standby
facility.
Stack-6: Steam Boiler @45 TPH to be attached to the turbine.The GLC have been predicted for 3 parameters, namely PM10 (Particulate Matter less than 10 Micron in size), NOx (Oxides of Nitrogen), SO2 (Sulphur Dioxide).
Air Dispersion Modeling Report for Amendment in EC for Existing Polyester Plant for Change in Fuel for 9.9 MW CPP by M/s. JBF Industries Ltd., GIDC, Sarigam
Page | 5
5.1 Input Parameters
The input parameters for the preparation of mathematical model consist of, baseline values, meteorological data and source emission details. The details are discussed below:
5.1.1 Baseline Values
The baseline status of the ambient air quality data generated during March 2015 to May 2015 in 5 km radius for same region has been utilized to predict the ambient air quality status after the proposed project. The parameters monitored for AAQM included Particulate Matter 10 (PM10 i.e. PM<10 μ), Particulate Matter 2.5 (PM2.5 i.e. PM < 2.5 μ), Sulphur Dioxide (SO2), Oxides of Nitrogen (NO2) & TVOC (Total Volatile Organic Compound) at 8 locations.
Table 1: Ambient Air Quality of the Study Area (March-
Air Dispersion Modeling Report for Amendment in EC for Existing Polyester Plant for Change in Fuel for 9.9 MW CPP by M/s. JBF Industries Ltd., GIDC, Sarigam
Micro-meteorological data recorded for a period from March 2015 to May 2015 have been utilized for modeling. The following parameters were recorded at hourly intervals from the surface weather station for preparing the meteorological file
Wind velocity & Wind direction, Temperature, Relative humidity, Rainfall.The mixing heights required for input in the model, were determined by referring to the maps
pre-monsoon from the IMD publication - Atlas of hourly mixing height and assimilative capacity of atmosphere in India. In order to conduct a refined air dispersion modeling using ISCST3 short-term air quality dispersion model, the hourly meteorological data were pre-processed using the U.S. EPA PCRAMMET program. The wind-rose diagram is given in figure 1 and the wind class and stability class distribution charts are given in figure 2.
Figure 1: Windrose diagram of the Processed file
Legend:
Details:Total Hours: 2208Calm Hours: 0Avg. wind speed: 1.87 m/s.Period: March 2015 to May 2015
Air Dispersion Modeling Report for Amendment in EC for Existing Polyester Plant for Change in Fuel for 9.9 MW CPP by M/s. JBF Industries Ltd., GIDC, Sarigam
Page | 7
Figure 2: Wind Class & Stability Class Distribution Charts
5.1.3 Source emission details
The input data for source emissions i.e. the emission rates have been derived from the data provided by the client as below:
Emission rates for Particulate matter have been calculated on the basis of following considerations:
An ash content of 0.1% is considered in FO fired installations
An ash content of 0.05% is considered in HSD fired installations
Emission rates for installations where NG is used as fuel have been computed from the emission factors taken from AP-42 (USEPA) based on consumption rates of fuel.
A mixture of fuels (Imported Coal & Indian Coal in a ratio of 70:30) has been considered for each of the Coal fired thermic fluid heaters.
Imported coal has been considered as fuel for proposed steam boiler of 45 TPH to be attached to the turbine.
Air Dispersion Modeling Report for Amendment in EC for Existing Polyester Plant for Change in Fuel for 9.9 MW CPP by M/s. JBF Industries Ltd., GIDC, Sarigam
Page | 8
An Ash content of 5% and 34.18% has been considered for Imported Coal and Indian Coal respectively, for estimating the emissions for particulate matter.
It has also been assumed that 20% of the ash is retained in bed and 80% is the fly ash.
Moreover, all the particulate matter is assumed as PM10.
Furthermore, the %efficiency of ESP is considered as 99.5%
Emission rates for Sulphur Dioxide have been calculated on the basis of following considerations:
A sulphur content of 2.5% is considered in FO fired installations
A sulphur content of 0.5% is considered in HSD fired installations
Emission rates for installations where NG is used as fuel, have been computed from the emission factors taken from AP-42 (USEPA) based on consumption rates of fuel.
A mixture of fuels (Imported Coal & Indian Coal in a ratio of 70:30) has been considered for each of the Coal fired heaters.
Imported coal has been considered as fuel for proposed steam boiler of 45 TPH to be attached to the turbine.
A Sulphur content of 0.5% and 0.26% has been considered for Imported Coal and Indian Coal respectively, for estimating the emissions for Sulphur Dioxide.
It has also been assumed that 95% of the Sulphur in the fuel is converted to Sulphur Dioxide.
Furthermore, efficiency of 85% has been considered for Sulphur capture system i.e. lime dosing/blending in the furnace.
Emission rates for Nitrogen Dioxide have been calculated based on the permissible norms of 50ppm.
The details of source of air emissions are given in Table 2.
Air D
isper
sion
Mod
elin
g Re
port
for A
men
dmen
t in
EC fo
r Exi
stin
g Po
lyes
ter P
lant
for
Cha
nge
in F
uel f
or 9
.9 M
W C
PP b
y M
/s. J
BF In
dust
ries
Ltd
., G
IDC,
Sar
igam
Page
| 9
Tabl
e 2:
The
Sou
rces
Em
issi
on D
etai
ls
Stac
kno
.St
ack a
ttach
ed to
Carte
sian
co-o
rdin
ates
Base
Elev
atio
n ab
ove M
SL
(m)
Ht. &
Dia.
of
Stac
k, (m
)Ex
it Ga
s Ve
locit
y (m
/s)
& Te
mp.
(°C)
Fuel
Para
-m
eter
Pollu
tant
relea
se ra
tes
(g/
s)
With
out A
PCD
With
APC
DEx
istin
gSc
enar
ioS-
1FO
fired
Gen
set -
2.2MW
+ 1.2
MW D
ual fi
red
engin
e
-54.7
7,10
3.26
30.71
H: 65
mD:
2.2 m
V: 17
m/s
T: 28
0 °C
FO @
650 k
g/Hr+
HSD
@25
0 ltr/
hrPM
0.210
0N.
A.
SO2
9.617
0N.
A.
NOx
6.550
0N.
A.
S-2
Gas T
urbin
e with
WHR
Sy
stem
-4.5
MW-2
4.33,
113.9
430
.06H:
30 m
D: 1.
5 mV:
16.5
m/s
T: 29
0 °C
Natur
al Ga
s @40
000
scm/
day
PM0.0
560
N. A
.SO
20.0
040
N. A
.NO
x0.7
350
N. A
.S-
3Ga
s bas
ed P
ower
En
gine -
2 MW
-64.4
9,11
1.030
.68H:
30 m
D: 0.
6 mV:
19 m
/sT:
290 °
CNa
tural
Gas @
1400
0sc
m/da
yPM
0.020
0N.
A.
SO2
0.002
0N.
A.
NOx
0.257
0N.
A.
S-4
TFH-
14 La
khKC
al/hr
(2
Nos
)-9
.13,
-244
.6230
.06H:
63m
D:2.2
mV:
13.5
m/s
T: 15
0 °C
Impo
rted C
oal @
2626
kg/H
r +
Indian
Coa
l @11
82 kg
/Hr
(for e
ach)
PM23
7.915
1.189
SO2
17.10
32.5
66NO
x1.9
70N.
A.
S-5
TFH-
10La
khKC
al/hr
(1
No)
19.76
,-2
40.12
29.84
H:63
mD:
2.2m
V: 7
m/s
T: 15
0 °C
Impo
rted C
oal @
1876
kg/H
r +
Indian
Coa
l @84
4 kg/H
rPM
84.95
10.4
25SO
26.1
091.8
33NO
x1.7
63N.
A.
Prop
osed
Scen
ario
S-4
TFH-
14 La
khKC
al/hr
(2
Nos
)-9
.13,
-244
.6230
.06H:
63m
D:2.2
mV:
13.5
m/s
T: 15
0 °C
Impo
rted C
oal @
2626
kg/H
r +
Indian
Coa
l @11
82 kg
/Hr
(for e
ach)
PM23
7.915
1.189
SO2
17.10
32.5
66NO
x1.9
70N.
A.
S-5
TFH-
10 La
khKC
al/hr
(1
No)
19.76
,-2
40.12
29.84
H:63
mD:
2.2m
V: 7
m/s
T: 15
0 °C
Impo
rted C
oal @
1876
kg/H
r +
Indian
Coa
l @84
4 kg/H
rPM
84.95
10.4
25SO
26.1
090.9
16NO
x1.7
63N.
A.
S-6
Stea
m Bo
iler
45 T
PH79
.9,-2
27.51
28.02
H: 63
mD:
2.2m
V: 12
.5 m/
sT:
110 °
CIm
porte
d Coa
l @54
00 kg
/Hr
PM60
.000
0.300
SO2
14.25
02.1
38NO
x3.4
74N.
A.
Air Dispersion Modeling Report for Amendment in EC for Existing Polyester Plant for Change in Fuel for 9.9 MW CPP by M/s. JBF Industries Ltd., GIDC, Sarigam
Page | 10
5.1.3 The receptor area and assigning local coordinate system to the study area
The receptor area is generally defined to predict the impact of the emissions due to the defined sources, by superimposing the predicted GLC on the existing ambient air quality status for each of the parameter to derive at a resultant air quality value.
The receptors have been identified as below:
A uniform Cartesian grid of receptors has been defined within as below:
There are two Cartesian grid of receptors UCART1 and UCART2 has been defined within as below.
UCART1 - Consisting of 1681 receptors each at a distance of 500 m,
UCART2 - Consisting of 441 receptors each at a distance of 100 m,
Moreover, each of the 8 nos. of AAQM stations that were used in the earlier EIA report carried out by the industry in March 2015 to May 2015, has been identified as specific Cartesian receptor.
Hence, a total of 2130 receptors have been considered for modeling the GLC.The approximate center of the plant (at 20°17'30.76"N, 72°51'13.56"E) was considered at (0, 0) co-ordinates of the Cartesian grid and corresponding values of Cartesian co-ordinates were assigned to the stack sources by overlaying the site layout plant on the Cartesian grid. Similarly, the receptors were assigned the Cartesian co-ordinates by overlaying a map of the 10km radial periphery on the cartesian co-ordinate system.
5.1.4 The terrain
The terrain of the domain boundary was considered as Complex + Simple terrain. The terrain elevations have been assigned to the sources and receptors in the study area by processing in AERMAP by utilization of SRTM3 (Shuttle Radar Topography Mission Global Coverage maps ~90m resolution) maps.
Air Dispersion Modeling Report for Amendment in EC for Existing Polyester Plant for Change in Fuel for 9.9 MW CPP by M/s. JBF Industries Ltd., GIDC, Sarigam
Page | 11
Figure 3: Terrain Contours within the radial periphery of 5km
The GLC were predicted for over a 24-hour period, for ease of comparison with the 24 hourly ambient air quality standards.The output values of GLC were selected to be calculated in μg/m3.
5.2 Output Parameters
The GLC were predicted for over a 24-hour period, for ease of comparison with the 24 hourly ambient air quality standards.The output values of GLC were selected to be calculated in μg/m3.
Air Dispersion Modeling Report for Amendment in EC for Existing Polyester Plant for Change in Fuel for 9.9 MW CPP by M/s. JBF Industries Ltd., GIDC, Sarigam
Page | 12
6.0 The Results
The contour plots of the 24 hourly average GLCs for each of the pollutant are illustrated in figures 4 to 9. The outcome of ISC-AERMOD View Model is tabulated in table 2 as Incremental GLC with other necessary details for maximum values of GLC as well as for selected discrete Cartesian receptors. The results of the maximum GLCs for prediction of ambient air quality due to the proposed flue gas stacks are presented at Table 3.
Air D
isper
sion
Mod
elin
g Re
port
for A
men
dmen
t in
EC fo
r Exi
stin
g Po
lyes
ter P
lant
for
Cha
nge
in F
uel f
or 9
.9 M
W C
PP b
y M
/s. J
BF In
dust
ries
Ltd
., G
IDC,
Sar
igam
Page
| 13
Tabl
e3:T
hepr
edict
ed 24
hou
rly G
LC o
f Air
Pollu
tant
s
Pollu
tant
/ Re
cept
orX-
Axis
(m)
Y-ax
is(m
)Ba
seEl
evat
ion
abov
e MSL
(m)
Aeria
l dist
. & d
irect
ion
from
Site
(km
Fo
r Exis
ting
Proj
ect
(μg/
m3 )
Afte
r Pro
pose
d Pr
ojec
t (μg
/m3 )
Pred
icted
Incr
emen
tal G
LC
valu
es D
ue to
Pro
pose
d Pr
ojec
t (μ
g/m
3 )W
ithou
t
APCD
With
APC
DW
ithou
t
APCD
With
APC
DW
ithou
t A
PCD
With
APC
D
PM10
1st M
ax.
1000
.0040
0.00
43.2
--36
1.00
--43
6.00
2.18
75.00
0.16
1000
.0020
00.00
76.5
----
2.02
----
A1-2
70.51
-802
.6832
.55--
153.1
10.9
018
4.85
0.92
31.74
0.01
A231
9.33
444.8
033
.8110
7.89
0.61
129.0
40.6
521
.140.0
3A3
1585
.82-1
696.0
442
.915
4.42
0.89
186.5
30.9
332
.110.0
4A4
-114
2.02
-214
4.49
30.81
116.2
60.6
413
9.64
0.70
23.38
0.06
A5-7
28.46
1402
.6241
.0421
1.69
1.19
245.7
61.2
334
.060.0
4A6
91.99
-382
0.45
27.06
86.25
0.50
102.0
70.5
115
.830.0
1A7
-256
5.80
-99.1
347
.0919
2.12
1.06
229.3
51.1
537
.220.0
9A8
331.6
824
33.34
35.72
116.7
80.6
714
2.95
0.71
26.17
0.04
SO2
1st M
ax.
-100
0.00
3000
.0013
4.40
----
12.10
----
13.40
-9.92
1000
.0040
0.00
43.20
----
----
2.18
1000
.0020
00.00
76.50
--30
.60--
44.00
--A1
-270
.51-8
02.68
32.55
--13
.634.8
419
.400.9
25.7
7-3
.92A2
319.3
344
4.80
33.81
NE)
9.35
3.99
12.78
0.65
3.43
-3.35
A315
85.82
-169
6.04
42.90
13.94
5.03
18.75
0.93
4.81
-4.09
A4-1
142.0
2-2
144.4
930
.819.8
13.0
913
.920.7
04.1
1-2
.40A5
-728
.4614
02.62
41.04
17.68
5.61
23.33
1.23
5.65
-4.38
A691
.99-3
820.4
527
.068.1
33.1
29.9
70.5
11.8
4-2
.62A7
-256
5.8-9
9.13
47.09
16.13
6.04
22.67
1.15
6.54
-4.89
Air D
isper
sion
Mod
elin
g Re
port
for A
men
dmen
t in
EC fo
r Exi
stin
g Po
lyes
ter P
lant
for
Cha
nge
in F
uel f
or 9
.9 M
W C
PP b
y M
/s. J
BF In
dust
ries
Ltd
., G
IDC,
Sar
igam
Page
| 14
Pollu
tant
/ Re
cept
orX-
Axis
(m)
Y-ax
is(m
)Ba
seEl
evat
ion
abov
e MSL
(m)
Aeria
l dist
. & d
irect
ion
from
Site
(km
Fo
r Exis
ting
Proj
ect
(μg/
m3 )
Afte
r Pro
pose
d Pr
ojec
t (μg
/m3 )
Pred
icted
Incr
emen
tal G
LC
valu
es D
ue to
Pro
pose
d Pr
ojec
t (μ
g/m
3 )W
ithou
t
APCD
With
APC
DW
ithou
t
APCD
With
APC
DW
ithou
t A
PCD
With
APC
D
A833
1.68
2433
.3435
.7210
.554.5
114
.630.7
14.0
7-3
.79NO
x1s
t Max
.-1
000.0
030
00.00
134.4
--10
.05--
----
-1.17
N. A
.10
00.00
400.0
043
.20--
----
8.88
--A1
-270
.51-8
02.68
32.55
--4.8
4N.
A.
4.10
N. A
.-0
.74N.
A.
A231
9.33
444.8
033
.814.1
5N.
A.
2.70
N. A
.-1
.45N.
A.
A315
85.82
-169
6.04
42.90
SE)
4.55
N. A
.3.7
4N.
A.
-0.80
N. A
.A4
-114
2.02
-214
4.49
30.81
2.77
N. A
.2.7
7N.
A.
0.00
N. A
.A5
-728
.4614
02.62
41.04
5.77
N. A
.4.6
4N.
A.
-1.13
N. A
.A6
91.99
-382
0.45
27.06
2.73
N. A
.1.9
4N.
A.
-0.79
N. A
.A7
-256
5.8-9
9.13
47.09
5.36
N. A
.4.4
6N.
A.
-0.90
N. A
.A8
331.6
824
33.34
35.72
4.18
N. A
.2.9
4N.
A.
-1.24
N. A
.
Air Dispersion Modeling Report for Amendment in EC for Existing Polyester Plant for Change in Fuel for 9.9 MW CPP by M/s. JBF Industries Ltd., GIDC, Sarigam
Page | 15
Figure 4: 24 Hourly Contour Plot for PM10 without APCD for Existing Scenario
- AAQM stationsWindrose diagram for modeling Project:
Air Dispersion modeling report for proposed amendment by installation of 9.9 MW coal fired CPP by M/s. JBF Industries Ltd.
Sources:
5
Receptors:
2130
Maximum Conc.:
361 µg/m^3
Coordinates:
(1000, 400)
Air Dispersion Modeling Report for Amendment in EC for Existing Polyester Plant for Change in Fuel for 9.9 MW CPP by M/s. JBF Industries Ltd., GIDC, Sarigam
Page | 16
Figure 5: 24 Hourly Contour Plot for PM10 with APCD for Existing Scenario
- AAQM stationsWindrose diagram for modeling Project:
Air Dispersion modeling report for proposed amendment by installation of 9.9 MW coal fired CPP by M/s. JBF Industries Ltd.
Sources:
5
Receptors:
2130
Maximum Conc.:
2.02 µg/m^3
Coordinates:
(1000, 2000)
Air Dispersion Modeling Report for Amendment in EC for Existing Polyester Plant for Change in Fuel for 9.9 MW CPP by M/s. JBF Industries Ltd., GIDC, Sarigam
Page | 17
Figure 6: 24 Hourly Contour Plot for PM10 without APCD for Proposed Scenario
- AAQM stationsWindrose diagram for modeling Project:
Air Dispersion modeling report for proposed amendment by installation of 9.9 MW coal fired CPP by M/s. JBF Industries Ltd.
Sources:
3
Receptors:
2130
Maximum Conc.:
436 µg/m^3
Coordinates:
(1000, 400)
Air Dispersion Modeling Report for Amendment in EC for Existing Polyester Plant for Change in Fuel for 9.9 MW CPP by M/s. JBF Industries Ltd., GIDC, Sarigam
Page | 18
Figure 7: 24 Hourly Contour Plot for PM10 with APCD for Proposed Scenario
- AAQM stationsWindrose diagram for modeling Project:
Air Dispersion modeling report for proposed amendment by installation of 9.9 MW coal fired CPP by M/s. JBF Industries Ltd.
Sources:
3
Receptors:
2130
Maximum Conc.:
2.18 µg/m^3
Coordinates:
(1000, 400)
Air Dispersion Modeling Report for Amendment in EC for Existing Polyester Plant for Change in Fuel for 9.9 MW CPP by M/s. JBF Industries Ltd., GIDC, Sarigam
Page | 19
Figure 8: 24 Hourly Contour Plot for SO2 without APCD for Existing Scenario
- AAQM stationsWindrose diagram for modeling Project:
Air Dispersion modeling report for proposed amendment by installationof 9.9 MW coal fired CPP by M/s. JBF Industries Ltd.
Sources:
5
Receptors:
2130
Maximum Conc.:
30.6 µg/m^3
Coordinates:
(1000, 2000)
Air Dispersion Modeling Report for Amendment in EC for Existing Polyester Plant for Change in Fuel for 9.9 MW CPP by M/s. JBF Industries Ltd., GIDC, Sarigam
Page | 20
Figure 9: 24 Hourly Contour Plot for SO2 with APCD for Existing Scenario
- AAQM stationsWindrose diagram for modeling Project:
Air Dispersion modeling report for proposed amendment by installation of 9.9 MW coal fired CPP by M/s. JBF Industries Ltd.
Sources:
5
Receptors:
2130
Maximum Conc.:
12.1 µg/m^3
Coordinates:
(-1000, 3000)
Air Dispersion Modeling Report for Amendment in EC for Existing Polyester Plant for Change in Fuel for 9.9 MW CPP by M/s. JBF Industries Ltd., GIDC, Sarigam
Page | 21
Figure 10: 24 Hourly Contour Plot for SO2 without APCD for Proposed Scenario
- AAQM stations
Windrose diagram for modeling Project:
Air Dispersion modeling report for proposed amendment by installation of 9.9 MW coal fired CPP by M/s. JBF Industries Ltd.
Sources:
3
Receptors:
2130
Maximum Conc.:
44.0 µg/m^3
Coordinates:
(1000, 2000)
Air Dispersion Modeling Report for Amendment in EC for Existing Polyester Plant for Change in Fuel for 9.9 MW CPP by M/s. JBF Industries Ltd., GIDC, Sarigam
Page | 22
Figure 11: 24 Hourly Contour Plot for SO2 with APCD for Proposed Scenario
- AAQM stations
Windrose diagram for modeling Project:
Air Dispersion modeling report for proposed amendment by installation of 9.9 MW coal fired CPP by M/s. JBF Industries Ltd.
Sources:
3
Receptors:
2130
Maximum Conc.:
2.18 µg/m^3
Coordinates:
(1000, 400)
Air Dispersion Modeling Report for Amendment in EC for Existing Polyester Plant for Change in Fuel for 9.9 MW CPP by M/s. JBF Industries Ltd., GIDC, Sarigam
Page | 23
Figure 12: 24 Hourly Contour Plot for NOx without APCD for Existing Scenario
- AAQM stations
Windrose diagram for modeling Project:
Air Dispersion modeling report for proposed amendment by installation of 9.9 MW coal fired CPP by M/s. JBF Industries Ltd.
Sources:
5
Receptors:
2130
Maximum Conc.:
10.05 µg/m^3
Coordinates:
(-1000, 3000)
Air Dispersion Modeling Report for Amendment in EC for Existing Polyester Plant for Change in Fuel for 9.9 MW CPP by M/s. JBF Industries Ltd., GIDC, Sarigam
Page | 24
Figure 13: 24 Hourly Contour Plot for NOx without APCD for Proposed Scenario
- AAQM stations
Windrose diagram for modeling Project:
Air Dispersion modeling report for proposed amendment by installationof 9.9 MW coal fired CPP by M/s. JBF Industries Ltd.
Sources:
3
Receptors:
2130
Maximum Conc.:
8.88 µg/m^3
Coordinates:
(1000, 400)
Air Dispersion Modeling Report for Amendment in EC for Existing Polyester Plant for Change in Fuel for 9.9 MW CPP by M/s. JBF Industries Ltd., GIDC, Sarigam
Page | 25
7.0 Discussion
An attempt has been made to predict the ambient air quality after the proposed project at the
AAQM results presented for the study carried out in March 2015 to May 2015. The same are compared with National Ambient Air Quality Monitoring Standards and presented at Table 4.
Table 4: Predicted Level of Pollutants at AAQM Stations after the Proposed Project
Stn.Code
Pollutant/ Receptor
Predicted Incremental GLC value Due to Proposed project
A2 Angam -1.45 N. A 32 30.55 N. AA3 Bhilad -0.80 N. A 30 29.20 N. AA4 Manda -0.01 N. A 29 28.99 N. AA5 Karanjgam -1.13 N. A 34 32.87 N. AA6 Daheli -0.79 N. A 32 31.21 N. AA7 Maroli -0.90 N. A 33 32.10 N. AA8 Kalgam -1.24 N. A 34 32.76 N. ANote: All values are in μg/m3,
N.A. = Not AvailableNAAQS = National ambient air quality as per CPCB notification (98% - 24 hourly values),
Air Dispersion Modeling Report for Amendment in EC for Existing Polyester Plant for Change in Fuel for 9.9 MW CPP by M/s. JBF Industries Ltd., GIDC, Sarigam
Page | 26
The result of dispersion modelling show, that the emission of PM10, SO2 and NOx from the plant will partially increase the level of air pollutants.
It is noteworthy that predicted GLC values of SO2 indicate decrease in the levels of SO2
in ambient air due to the proposed project. This is due to use of imported coal which has a lower Sulphur content, instead of furnace oil/ HSD. Furthermore, lime dosing is also carried out during use of imported coal.
Similarly, the predicted GLCs for NOx also indicate a decrease in levels of NOx in ambient air due to the decrease in the number of operational utilities after the installation of the turbine.
However, as shown at the Table 4 when superimposed over the baseline concentrations the resultant concentrations viz. the predicted level of conventional pollutants in the ambient air are well below the National Ambient Air Quality Standards.
Thus, the impacts of conventional pollutants would not be significant from the proposed project during normal operation phase.
U
Annexure 7: MoU with Brick Manufacturers for Fly Ash

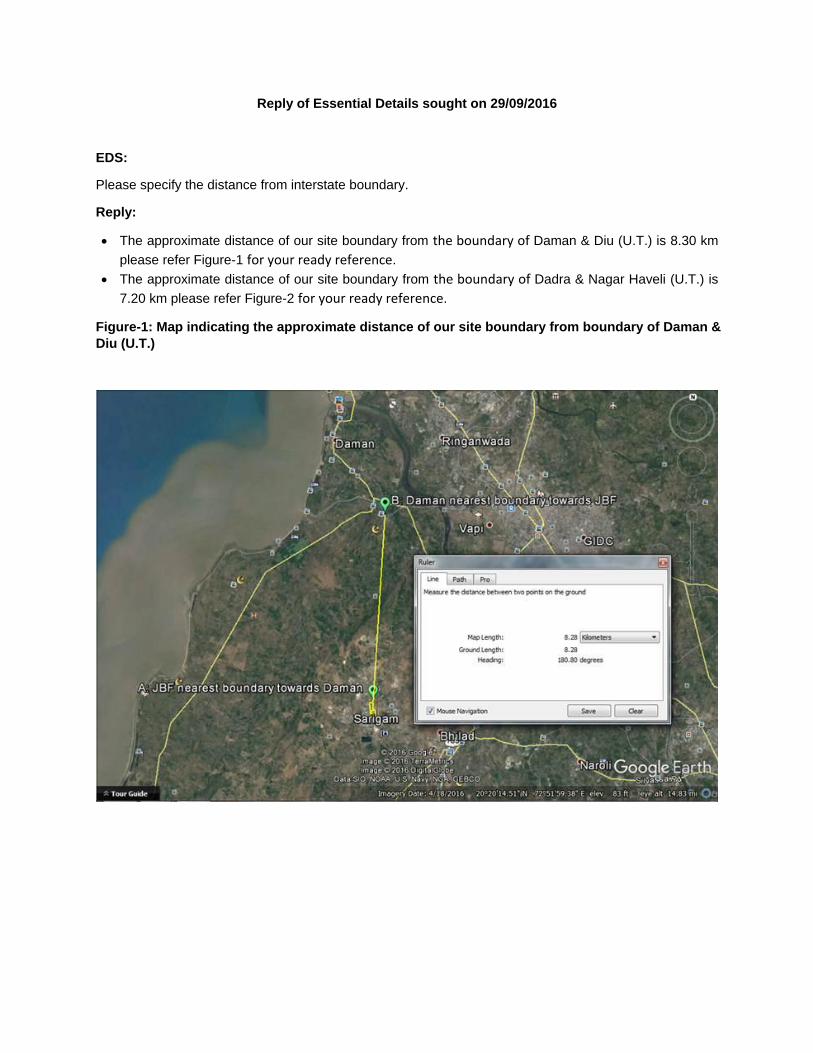


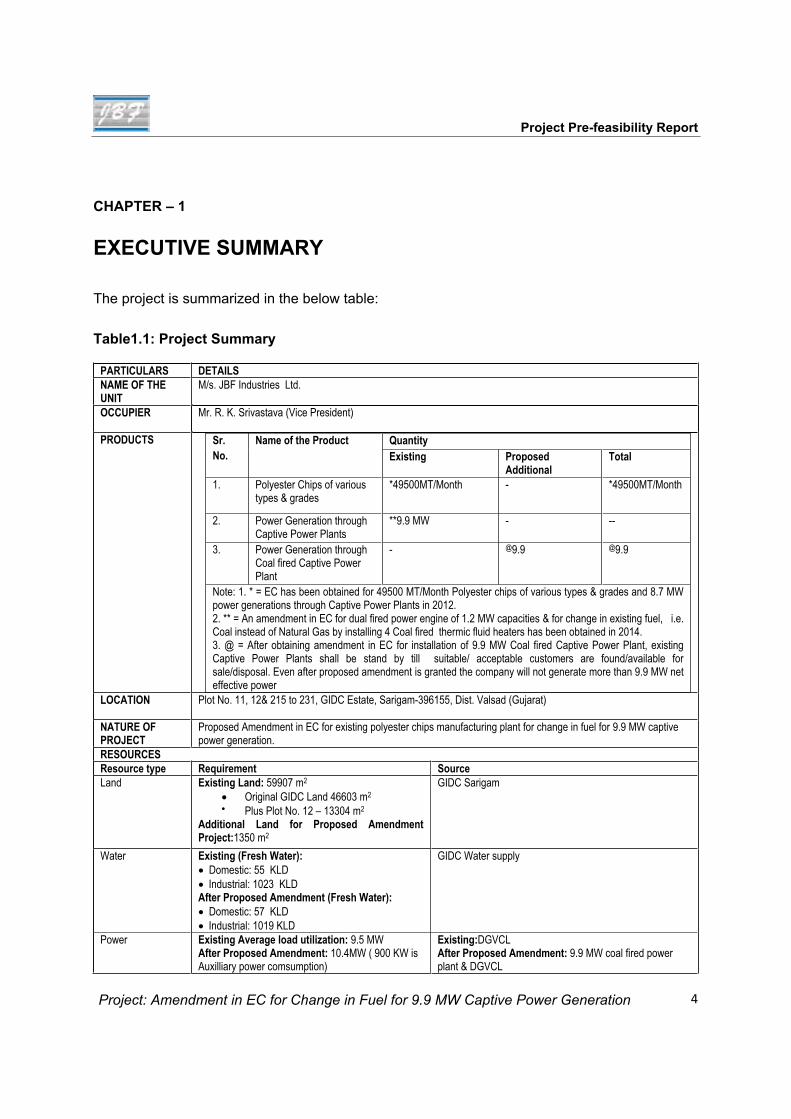
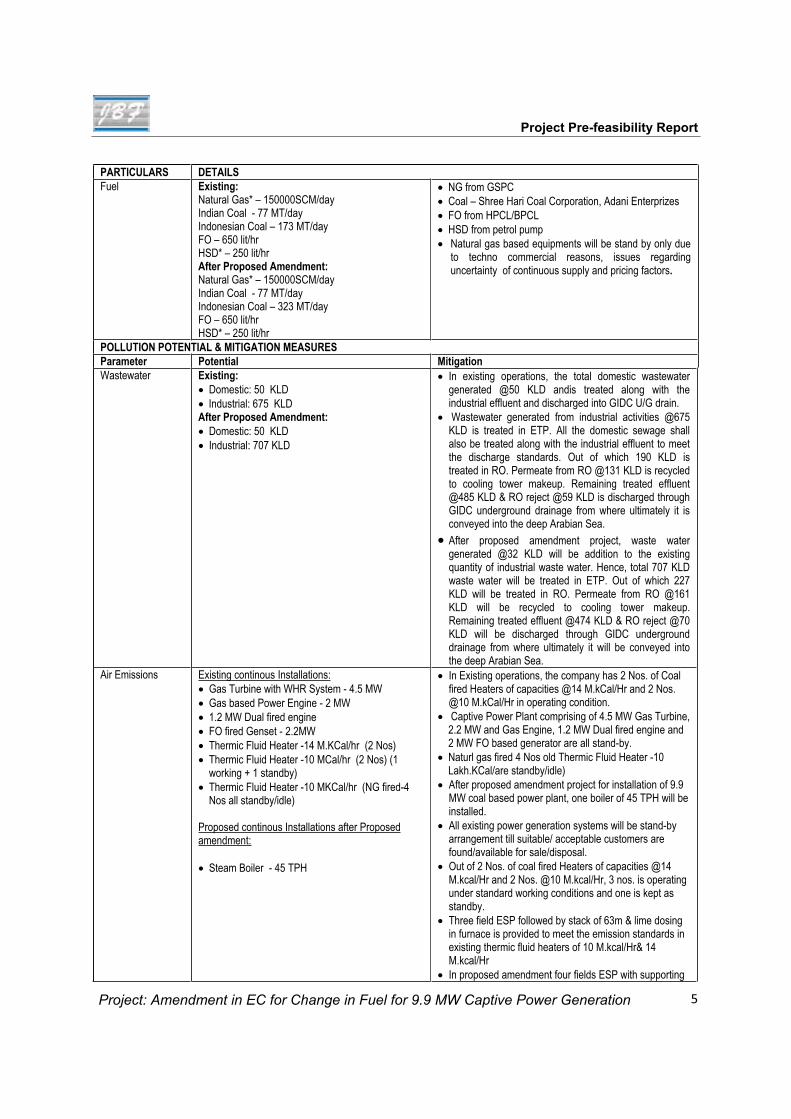


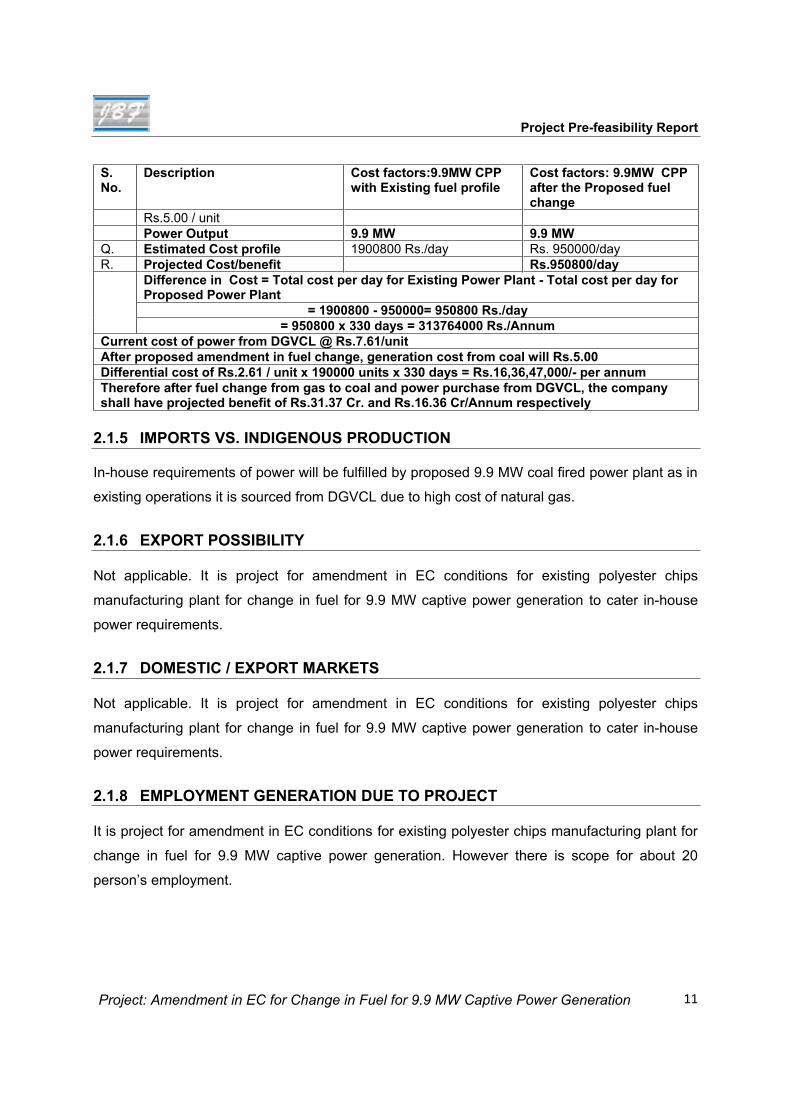


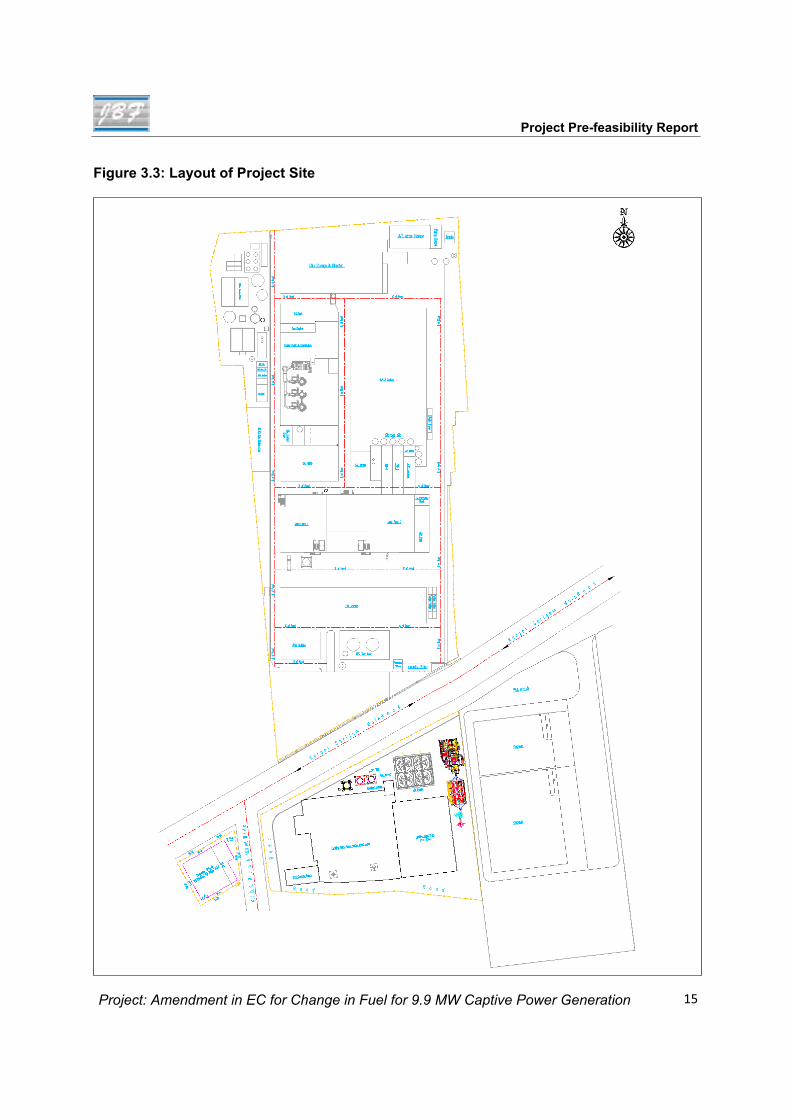


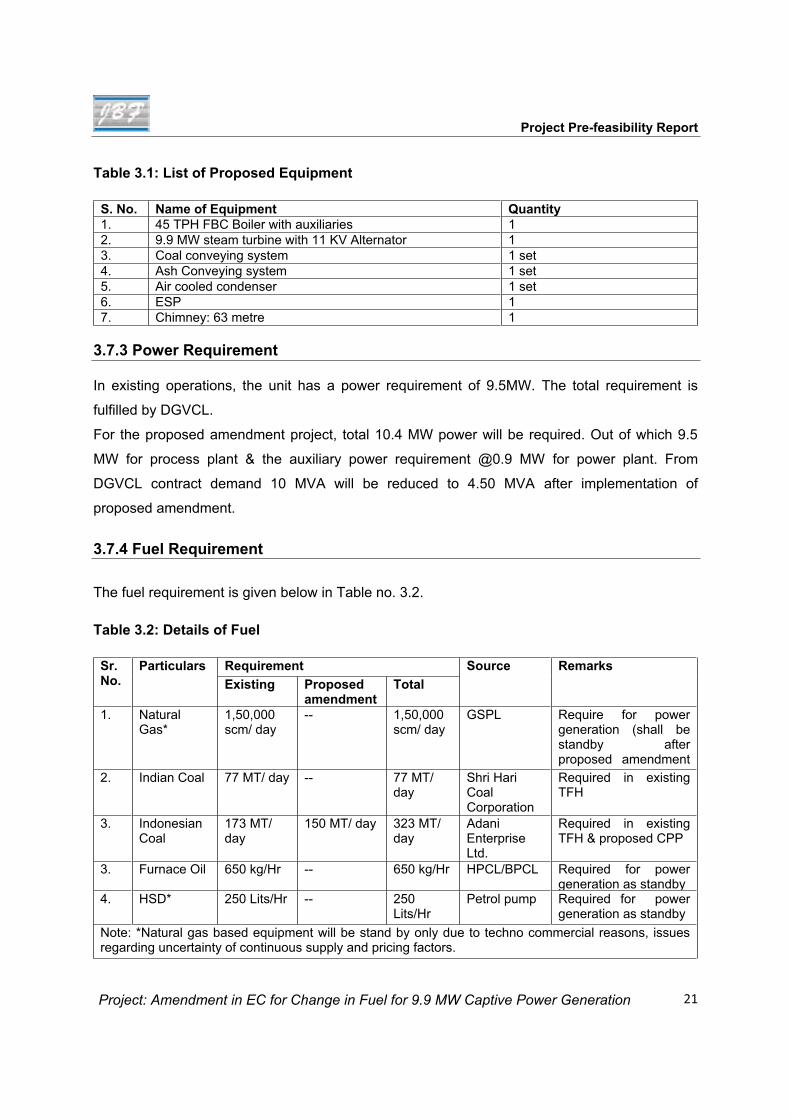
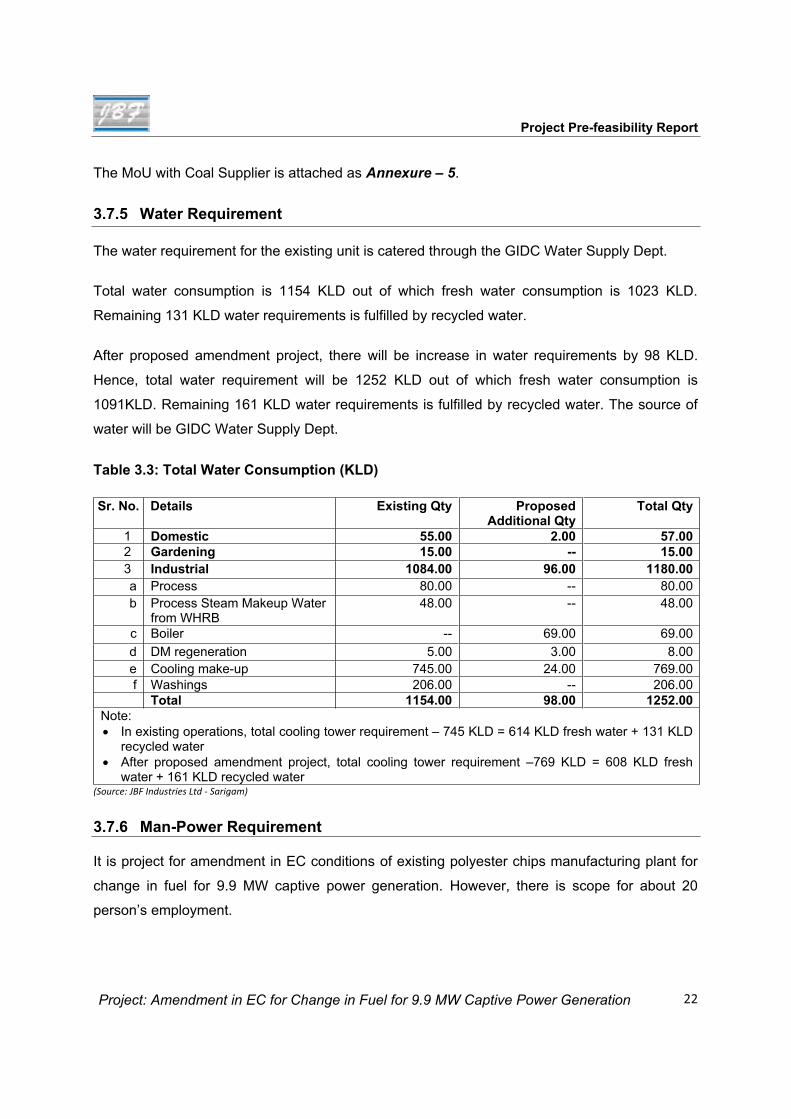


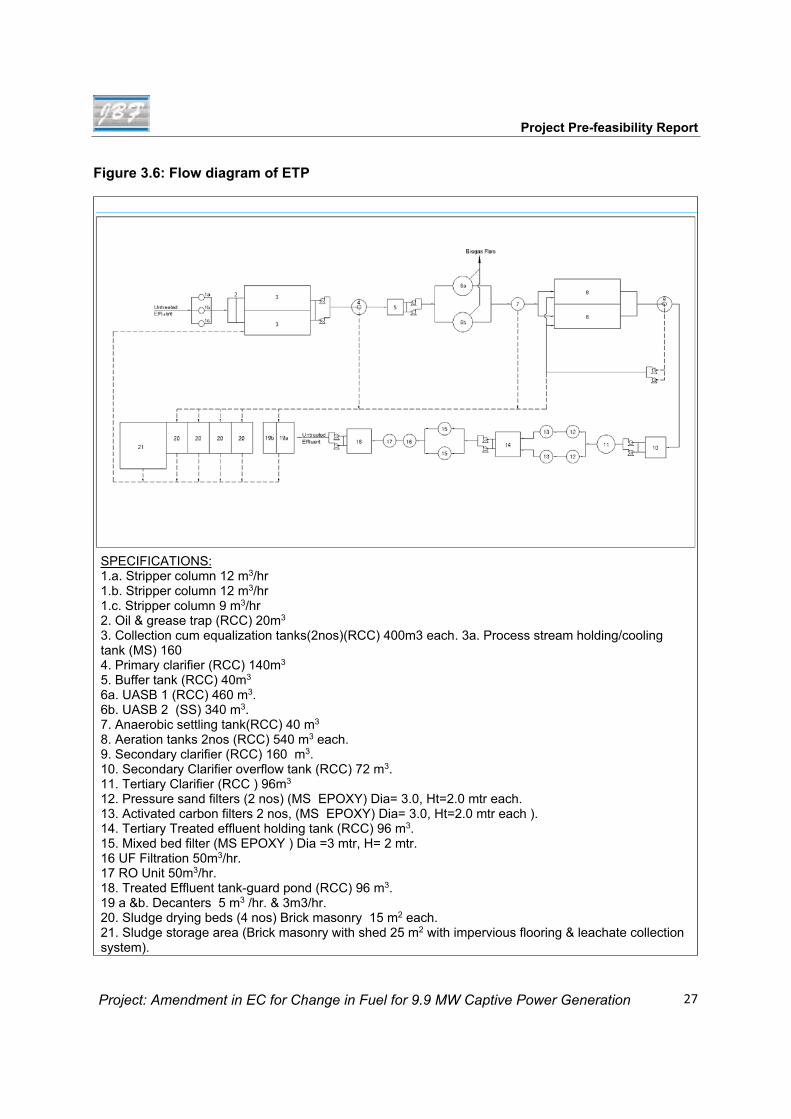


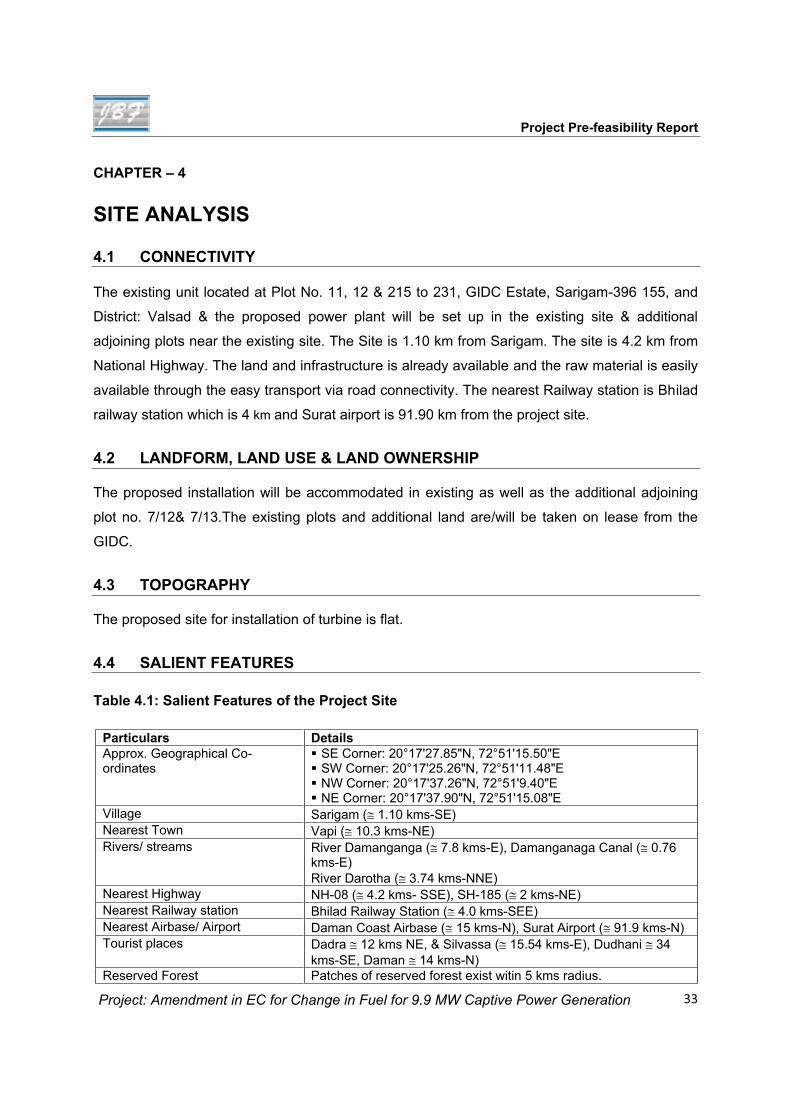


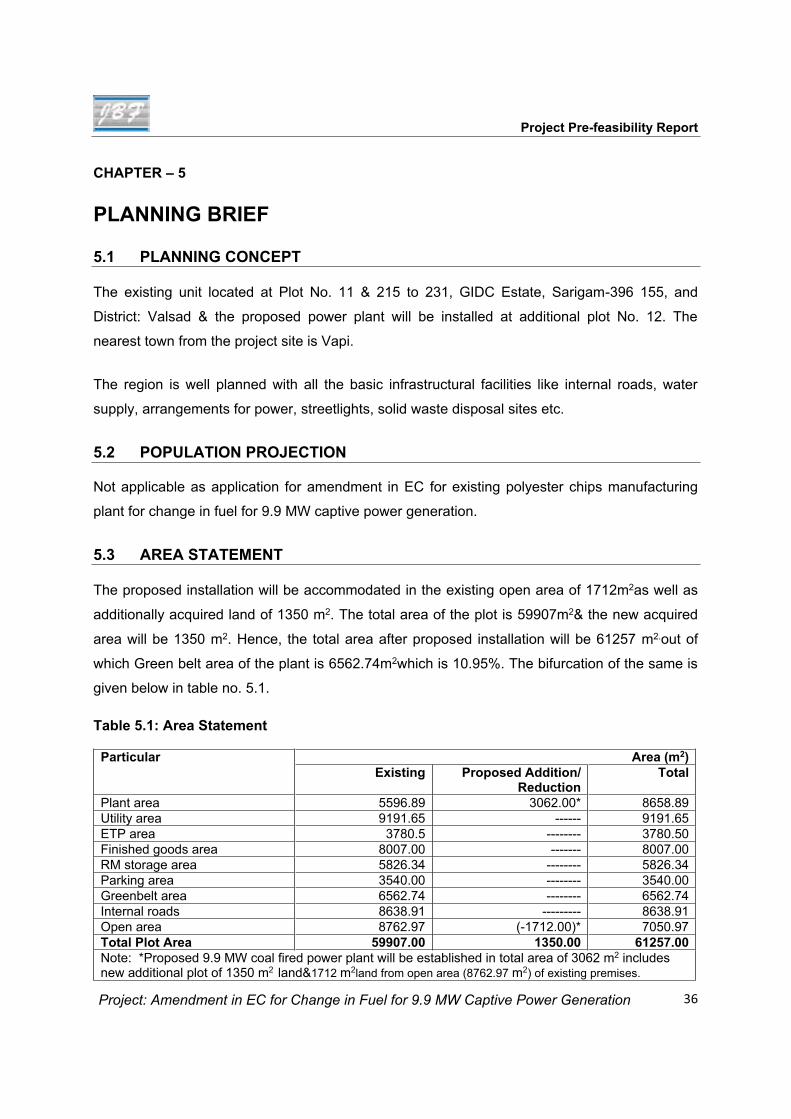


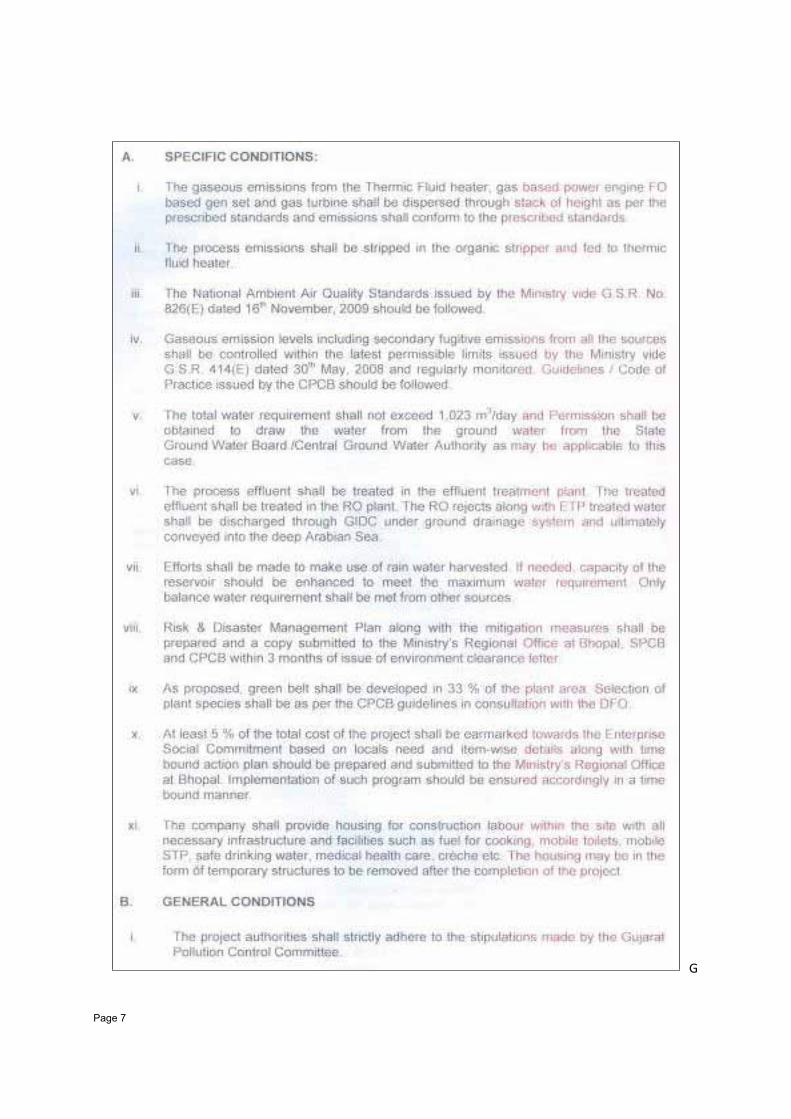
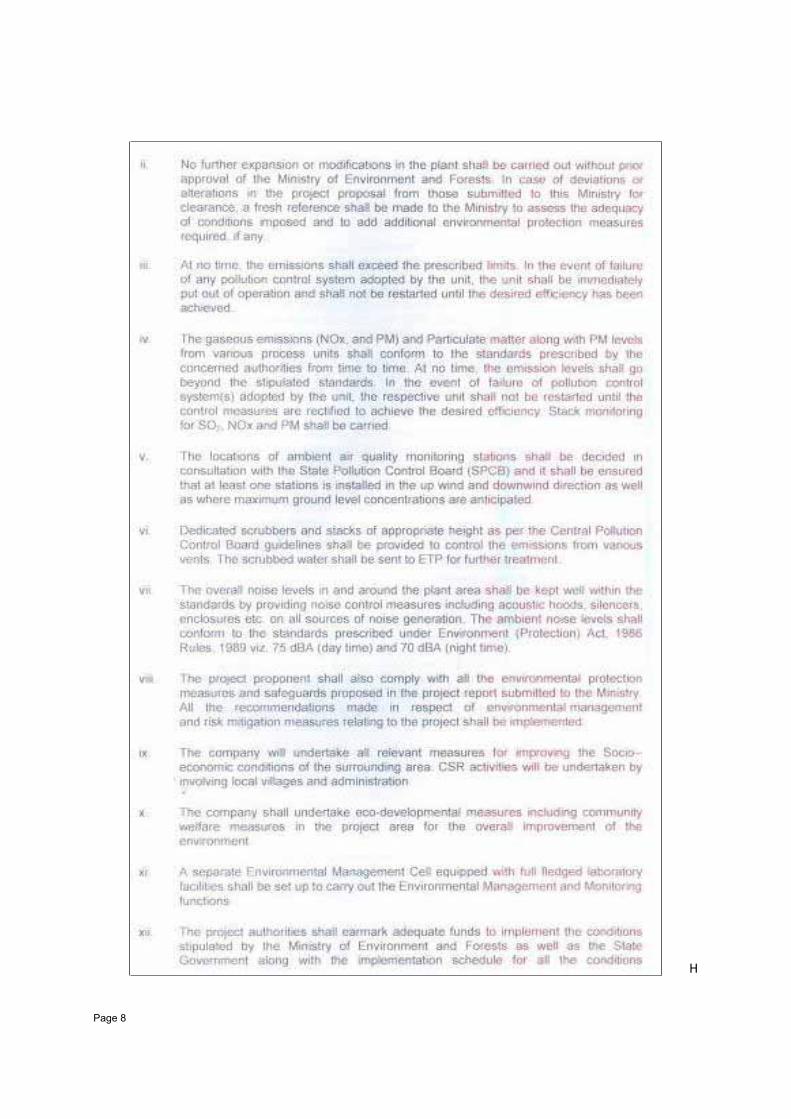
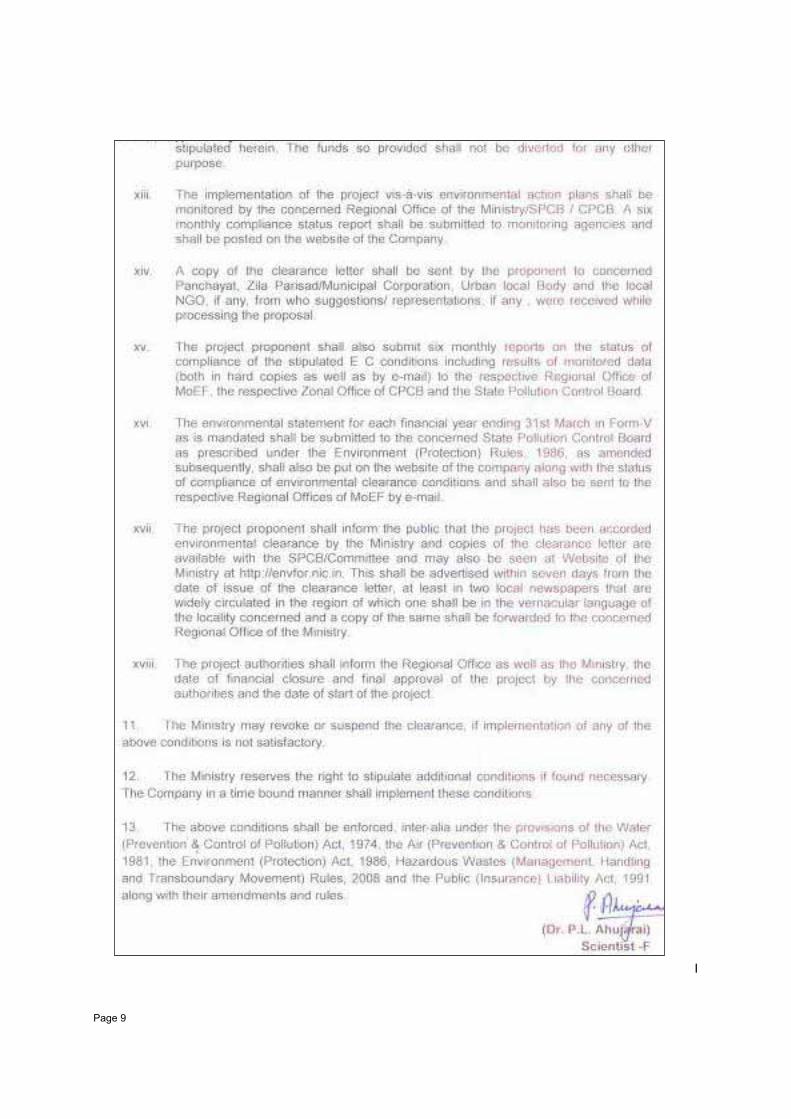
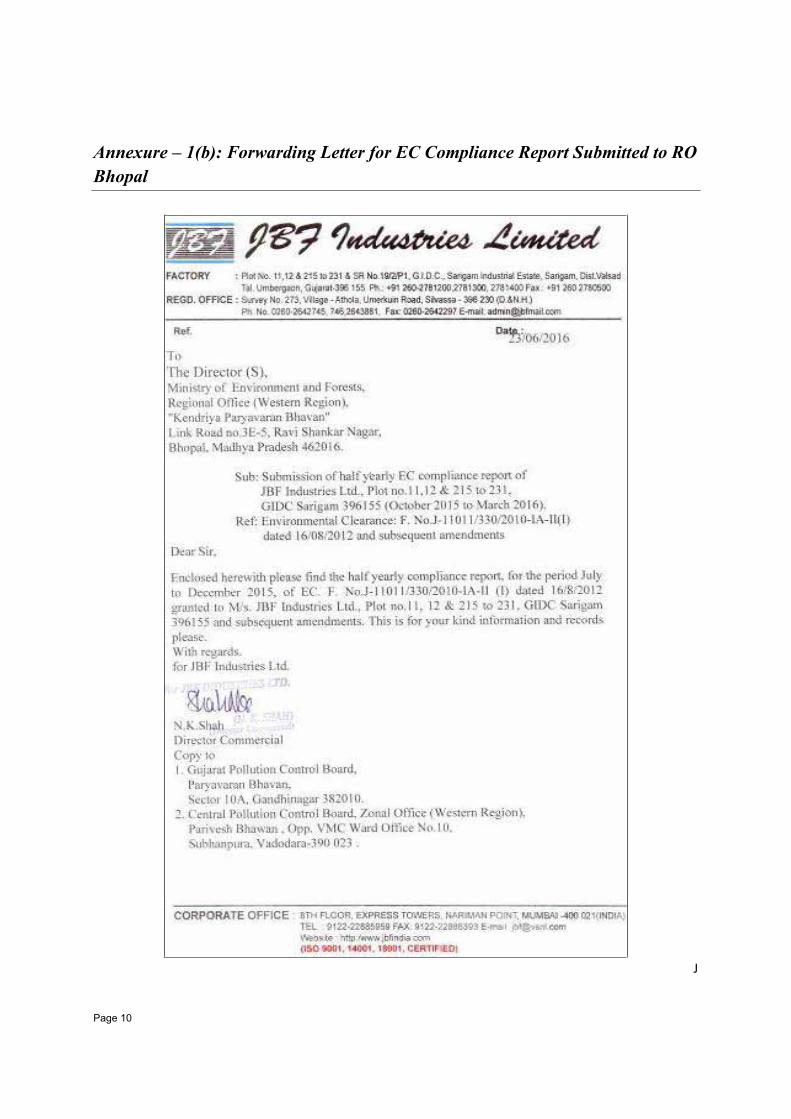

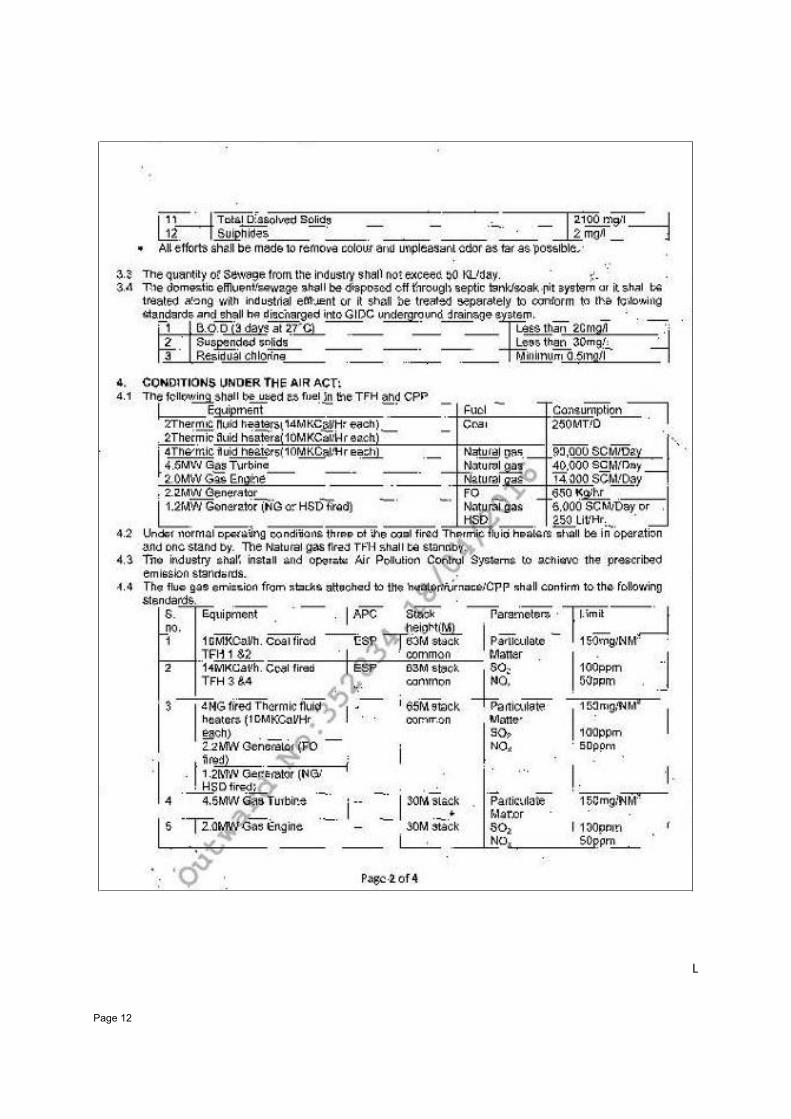

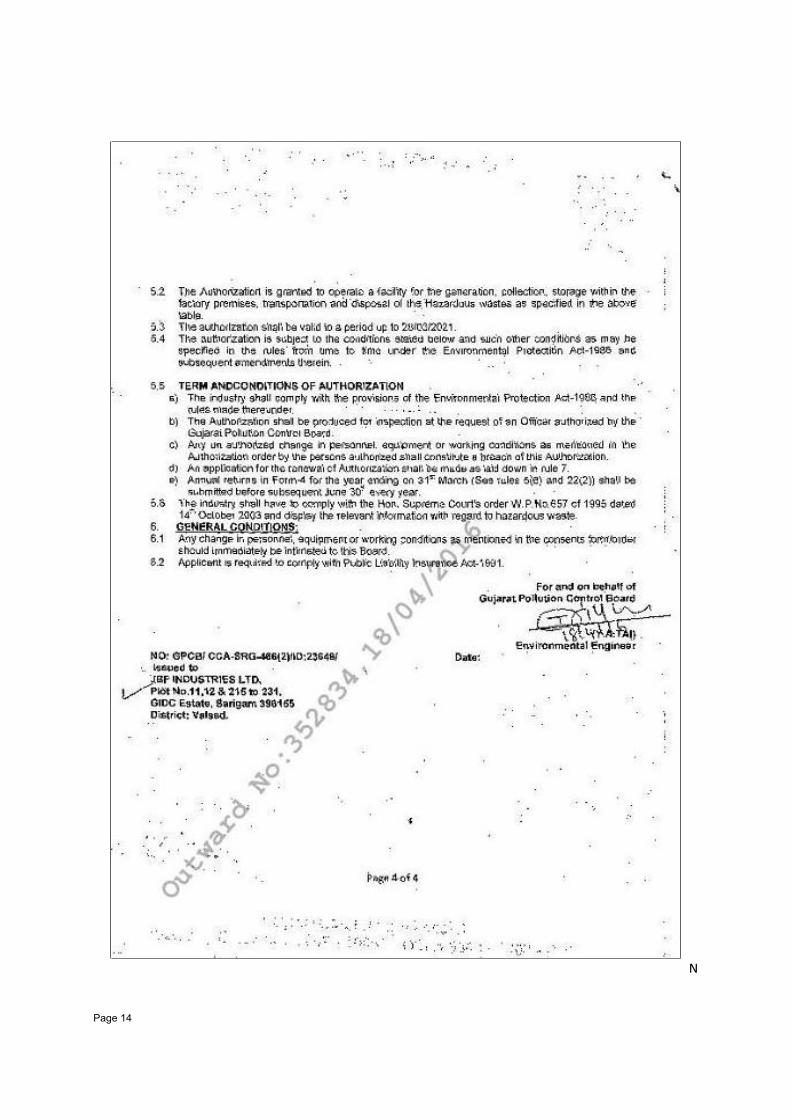

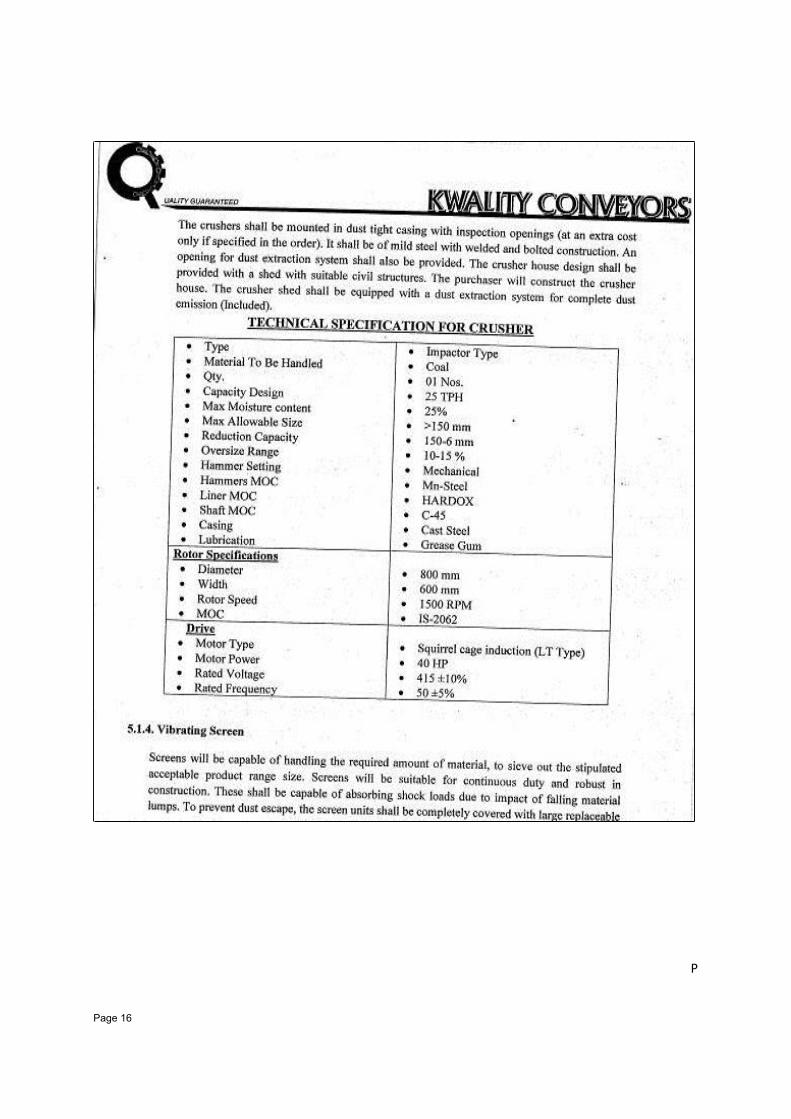


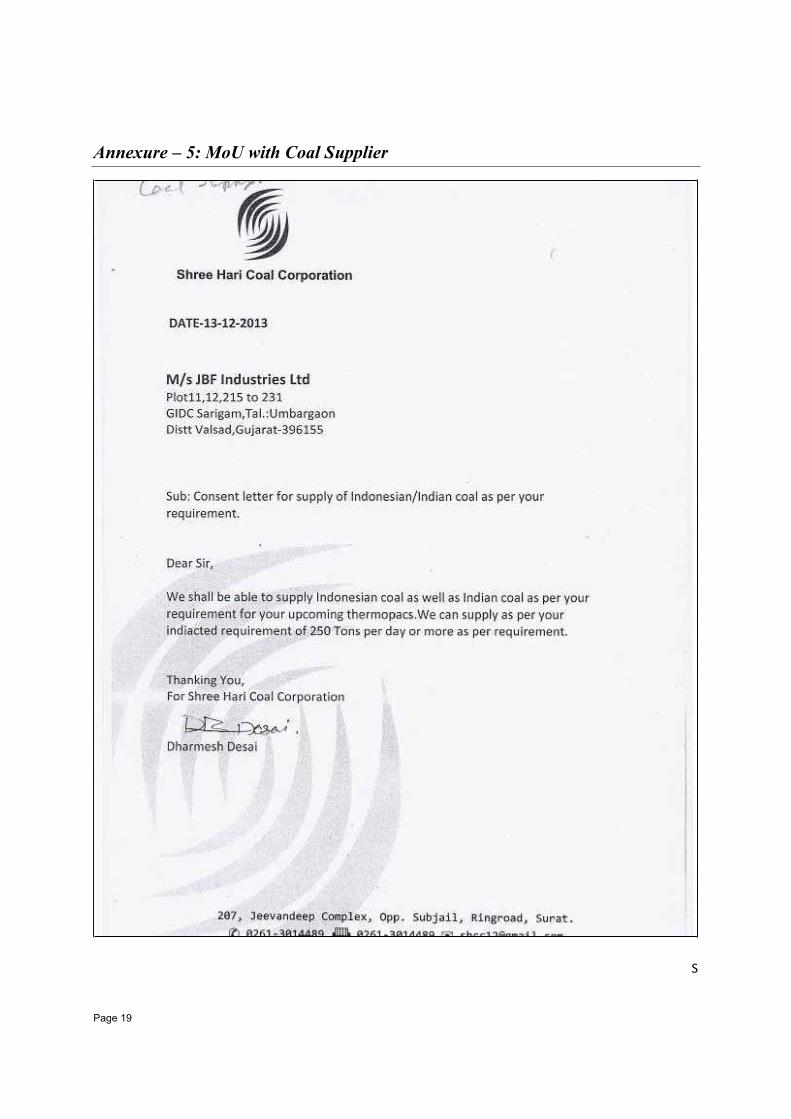


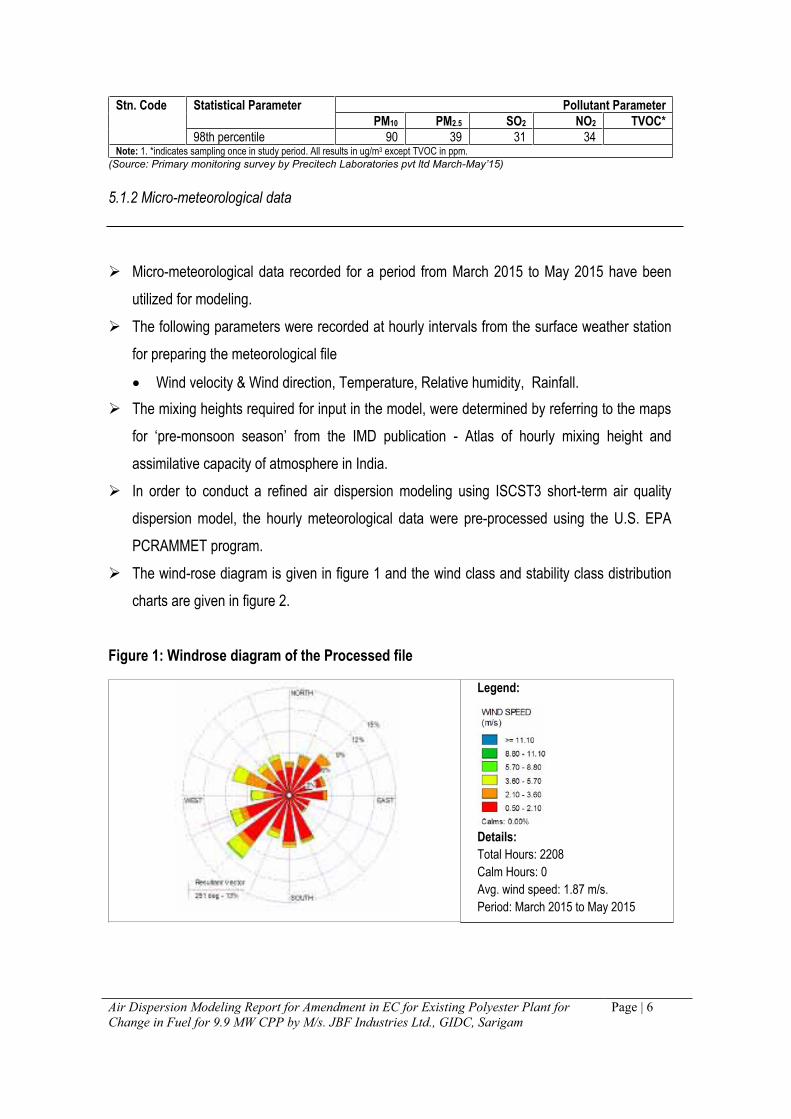

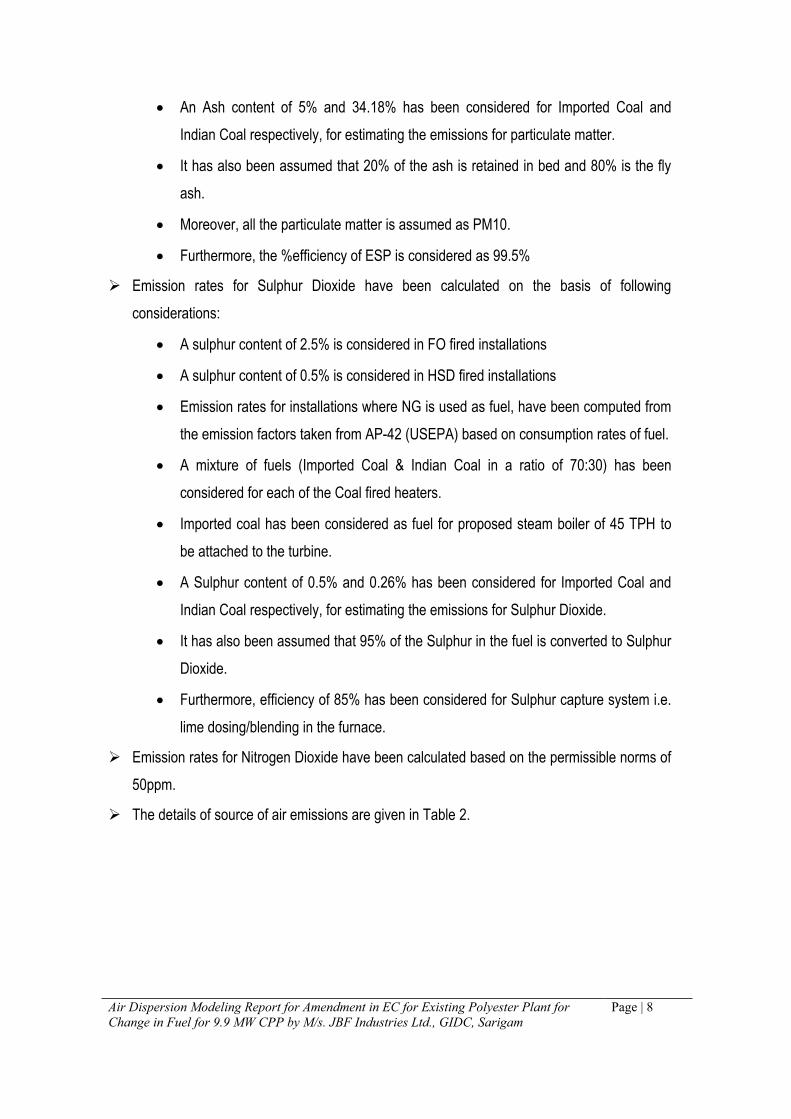

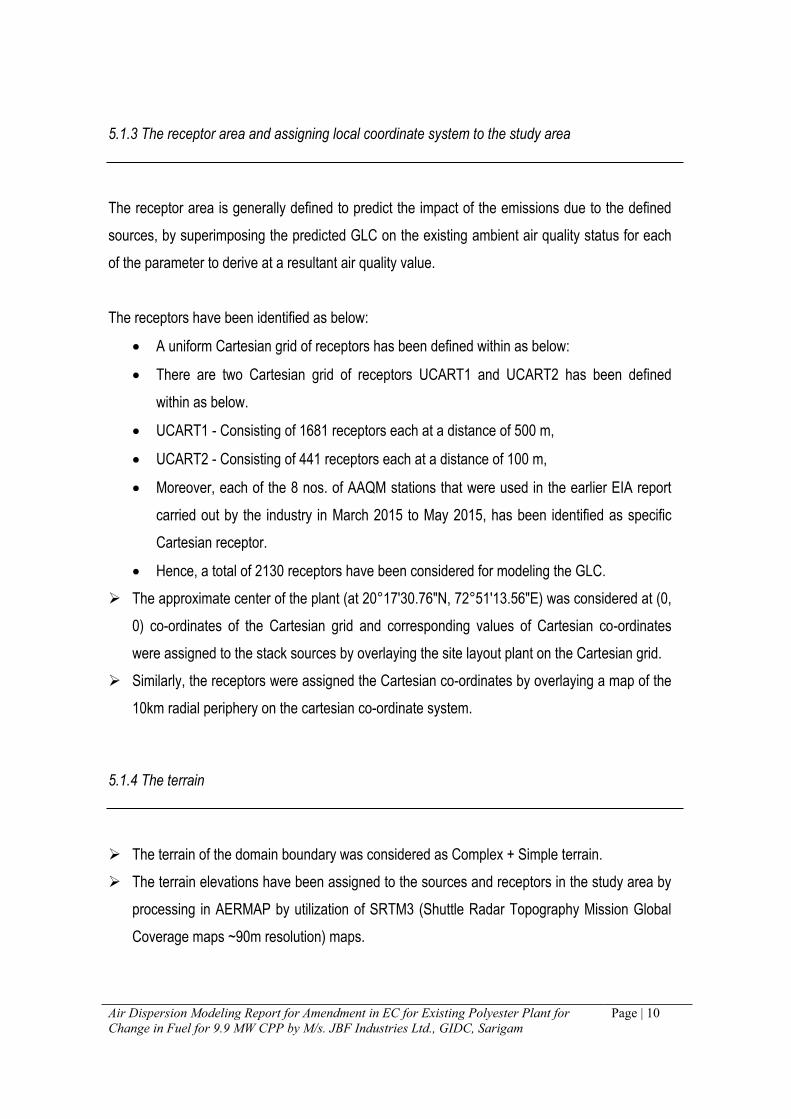
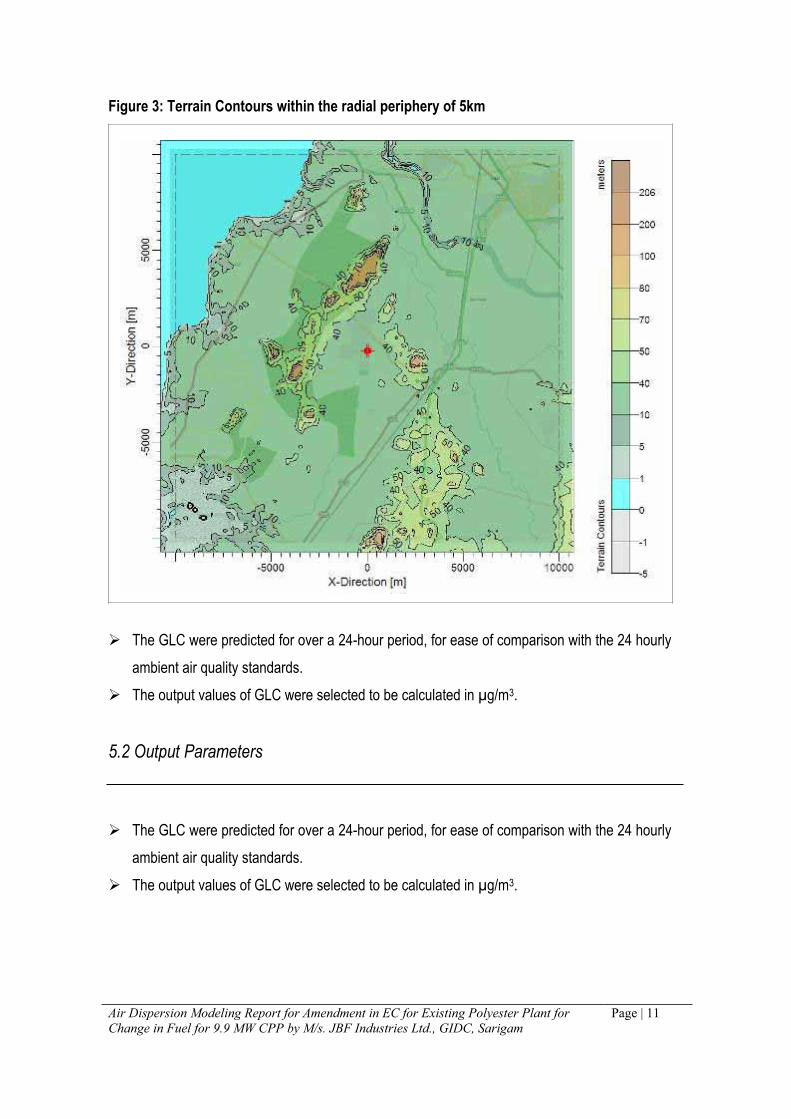


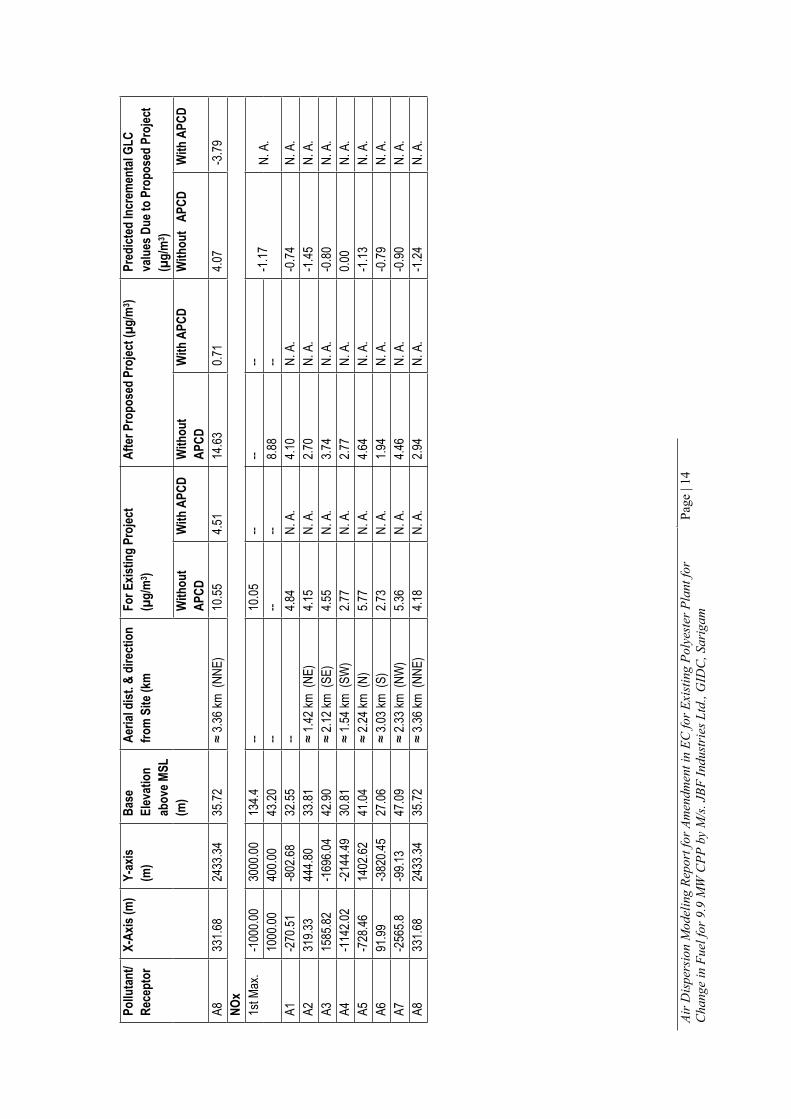
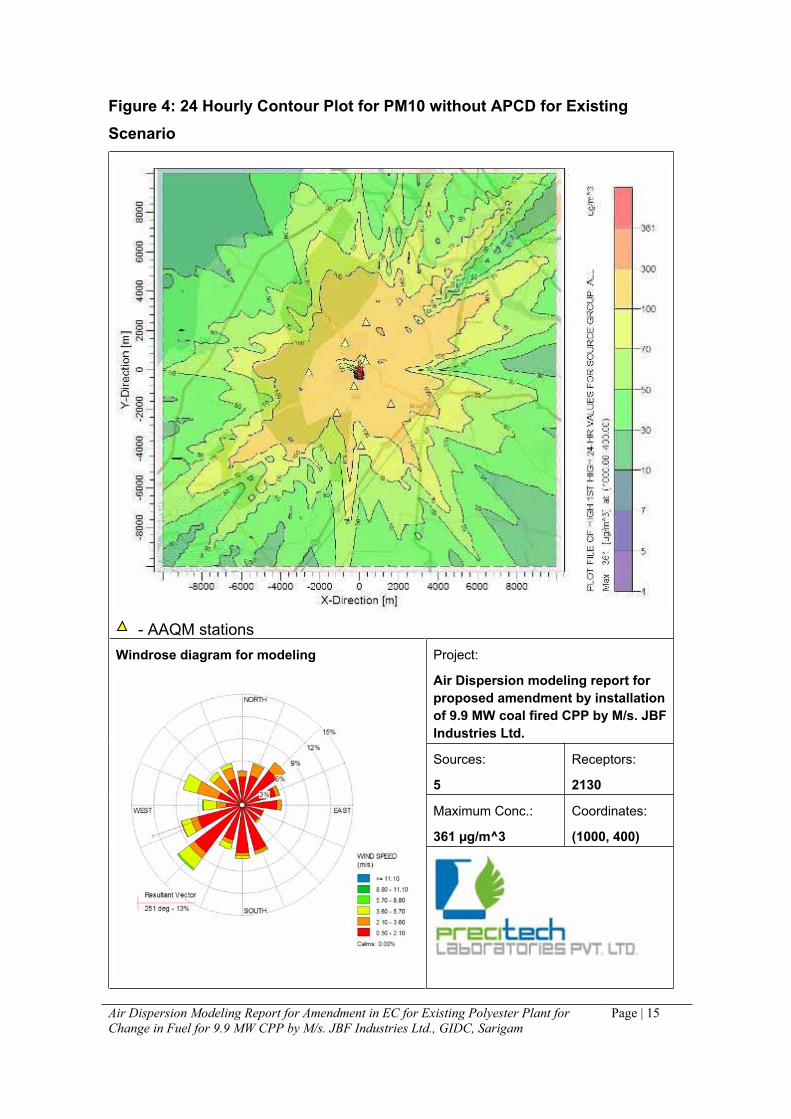

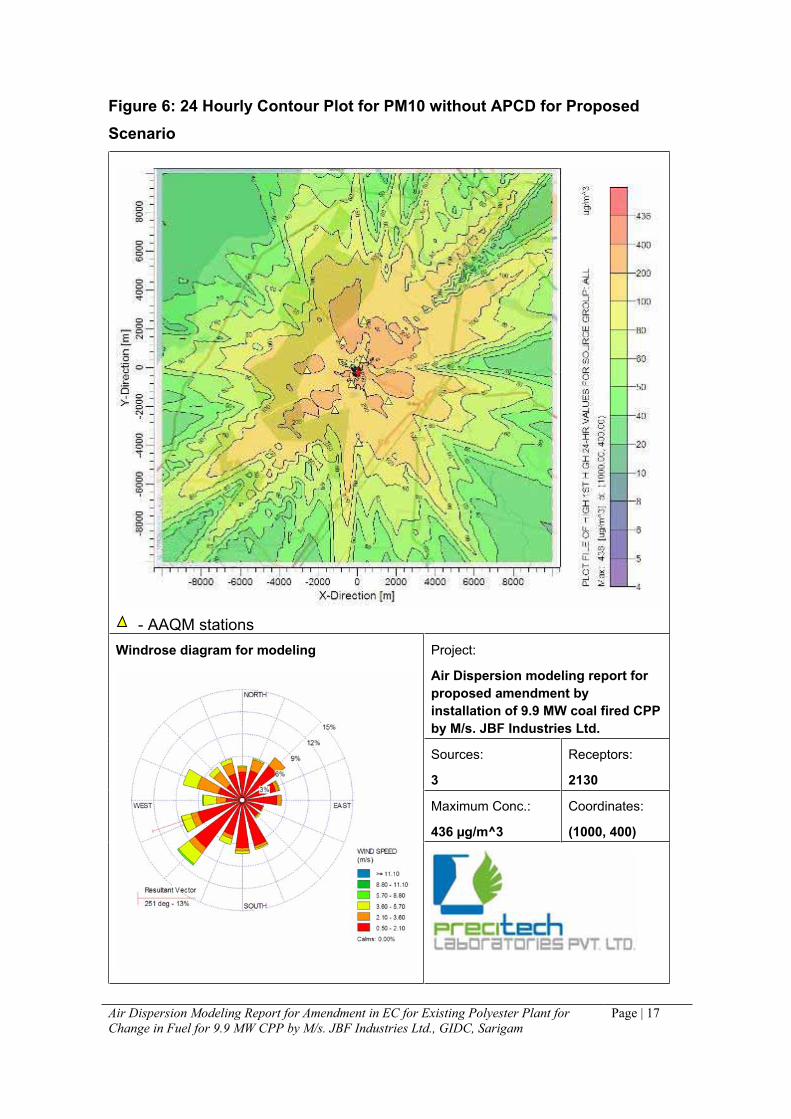


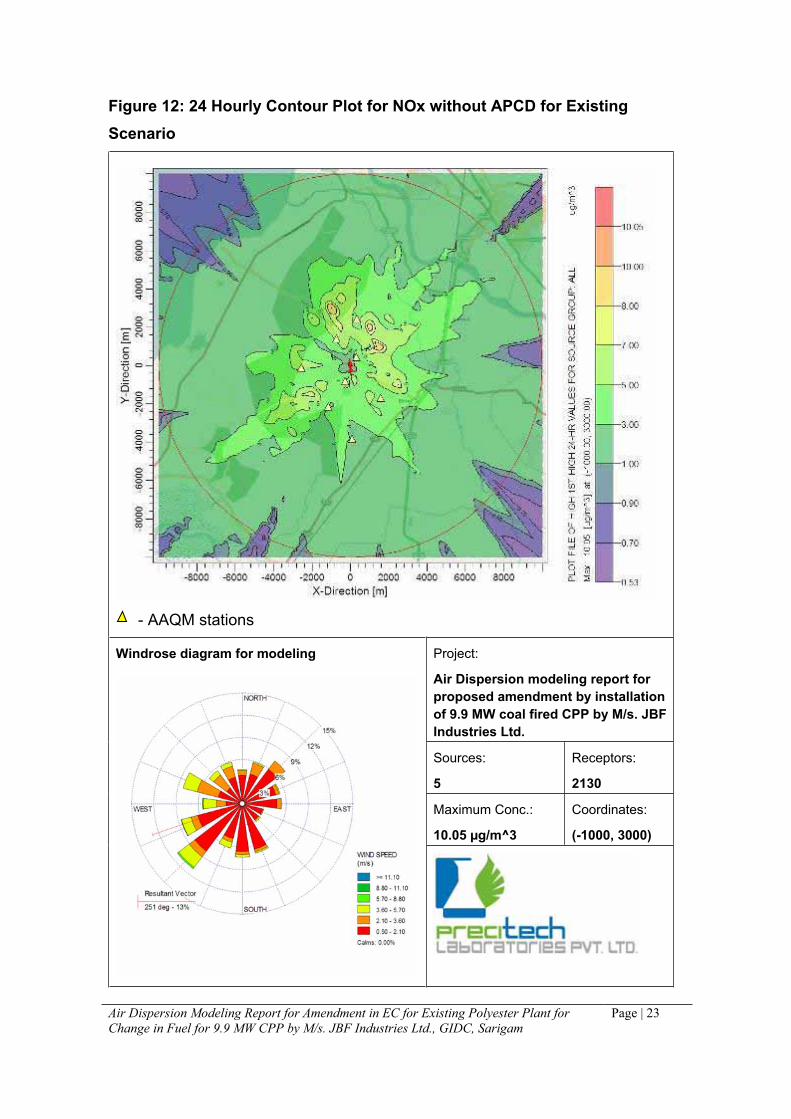
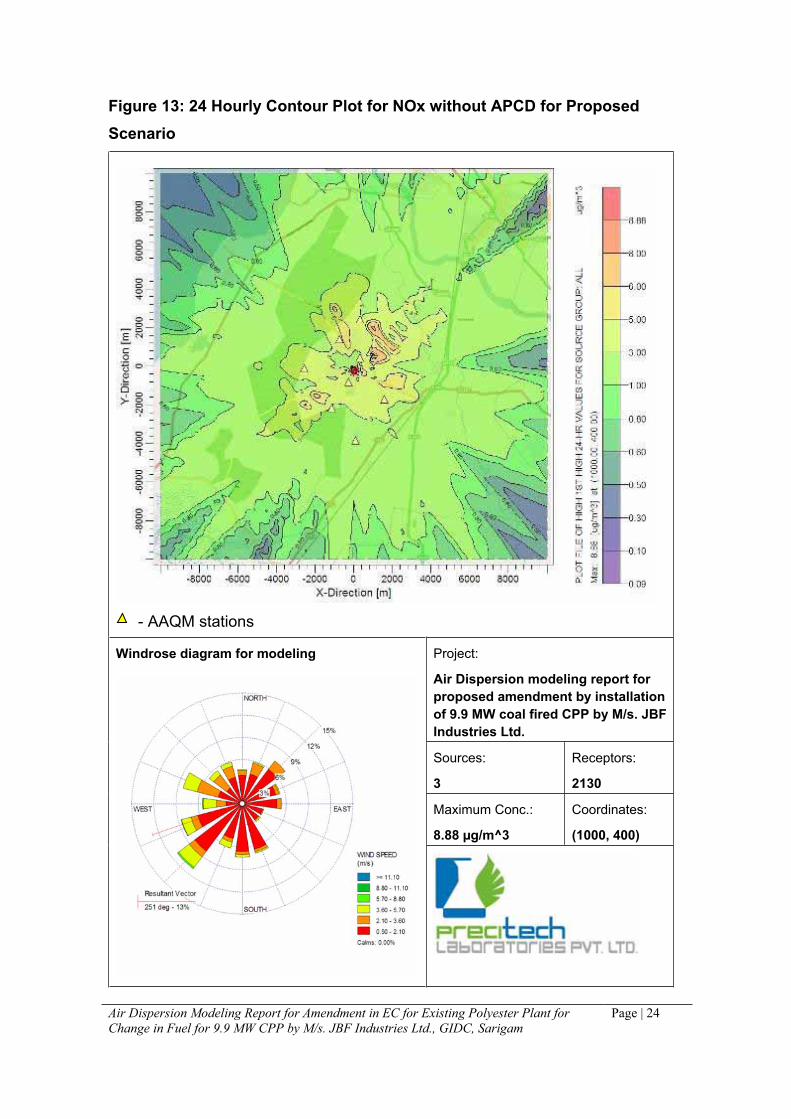
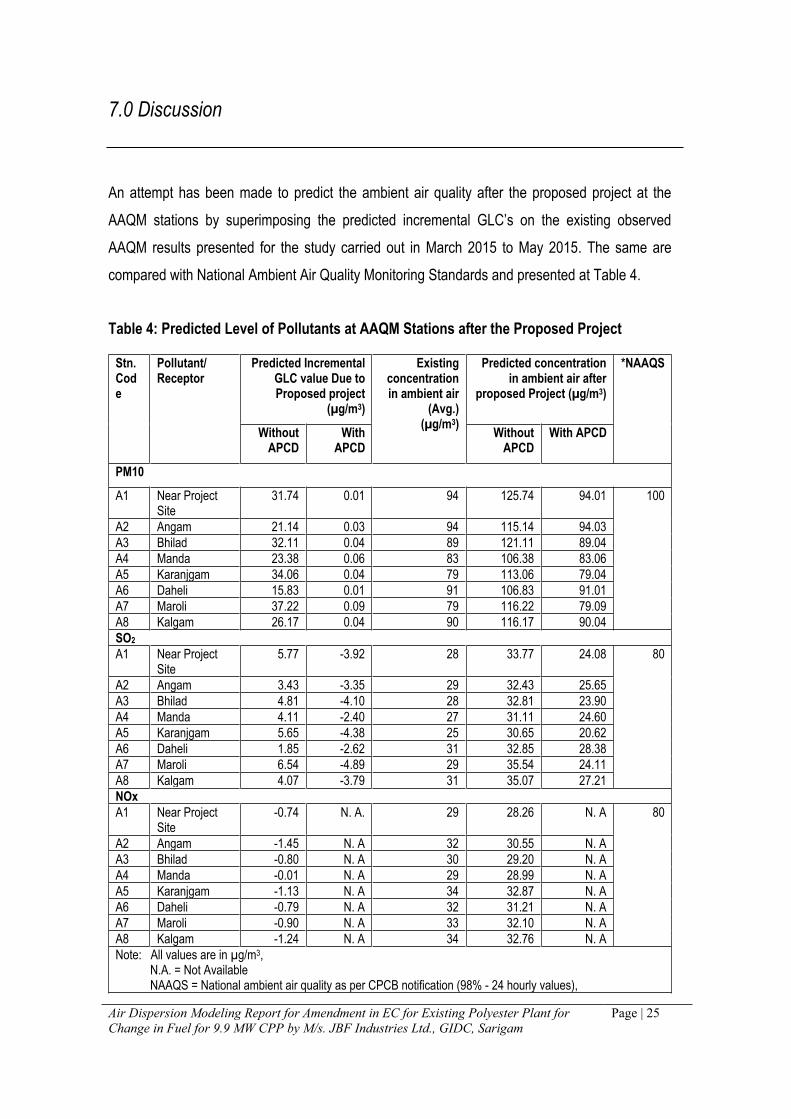

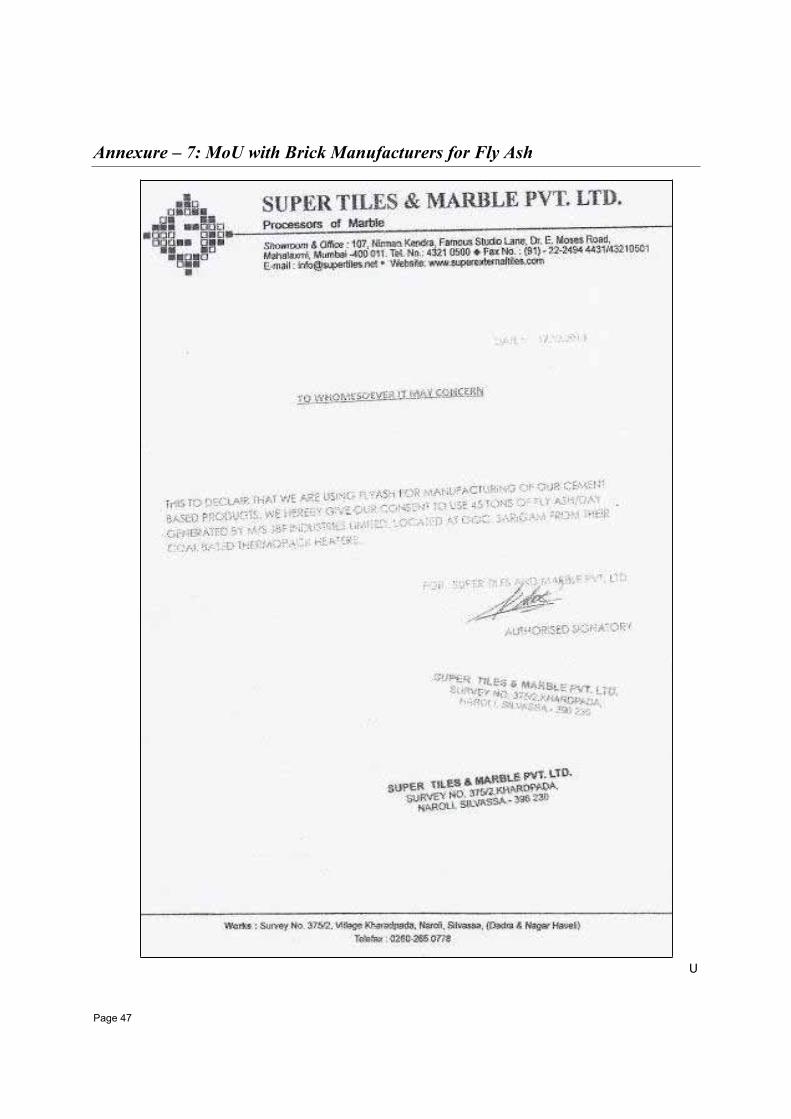

![ALSTOM India Ltd reply to clarification sought by the exchange [Company Update]](https://static.documents.pub/doc/80x56/577cb2221a28aba7118bed46/alstom-india-ltd-reply-to-clarification-sought-by-the-exchange-company-update.jpg)
![Binani Industries Ltd reply to clarification sought by the exchange [Company Update]](https://static.documents.pub/doc/80x56/577cb1fb1a28aba7118bea68/binani-industries-ltd-reply-to-clarification-sought-by-the-exchange-company.jpg)


