86
| Date post: | 29-May-2018 |
| Category: |
Documents |
| Upload: | truongcong |
| View: | 215 times |
| Download: | 0 times |

Bureau of Infrastructure, Transport and Regional Economics
Aircraft movements through capital city airports to 2029–30
Report 117
Department of Infrastructure, Transport, Regional Development and Local Government
Canberra, Australia

© Commonwealth of Australia, 2010
ISSN 1440-9569
IBSN 978-1-921260-38-4
April 2010 / INFRASTRUCTURE09100
This publication is available in hard copy or PDF format from the Bureau of Infrastructure, Transport and Regional Economics website at www.bitre.gov.au—if you require part or all of this publication in a different format, please contact BITRE.
An appropriate citation for this report is:Bureau of Infrastructure, Transport and Regional Economics (BITRE), 2010, Report 117: Airport movements through capital city airports to 2029–30, Canberra ACT.
Indemnity statementThe Bureau of Infrastructure, Transport and Regional Economics has taken due care in preparing the analyses contained in this report. However, noting that data used for the analyses have been provided by third parties, the Commonwealth gives no warranty to the accuracy, reliability, fitness for purpose, or otherwise of the information.
Published byBureau of Infrastructure, Transport and Regional Economics
GPO Box 501, Canberra ACT 2601, AustraliaTelephone (international) +61 2 6274 7210Fax +61 2 6274 6816Email: [email protected]: http://www.bitre.gov.au
Desktop publishing by Melinda Keane.
Printed by Bluestar Print Group.
• iii •
Foreword
This report presents forecasts of air passenger and aircraft movements through Australia’s eight capital city airports (Adelaide, Brisbane, Canberra, Darwin, Hobart, Melbourne, Perth and Sydney) to 2030. The forecasts of aircraft movements have been developed on the basis of the long-term forecasts of air passenger movements, aircraft size and seat utilisation rates. The air passenger forecasts that were presented in BITRE Working paper 72 have been updated by including the most recent information on economic growth and air passenger movements, and extending the forecast period from 2025–26 to 2029– 30. Hence, this report is directly linked to BITRE Working paper 72.
Dr Krishna Hamal was the principal researcher for this project, with assistance from Terry Johnson, Mano Manoranjan and Matt Li. Phil Potterton, Robert Stewart, Dr David Gargett and David Mitchell provided comments on the draft report.
Gary DolmanHead of Bureau of Infrastructure, Transport and Regional EconomicsCanberraApril 2010

• v •
At a glance
This report presents forecasts of air passenger and aircraft movements through Australia’s eight capital city airports (Adelaide, Brisbane, Canberra, Darwin, Hobart, Melbourne, Perth and Sydney) to 2030. The forecasts of aircraft movements have been developed on the basis of the long-term forecasts of air passenger movements, aircraft size and seat utilisation rates. The air passenger forecasts that were presented in BITRE Working paper 72 have been updated by including the most recent information on economic growth and air passenger movements and extending the forecast period from 2025–26 to 2029–30.
The updated air passenger forecasts suggest that the number of air passenger movements through the capital city airports is forecast to increase by 4.2 per cent a year over the next 21 years, from 98.3 million in 2008–09 to 235 million in 2029–30. The number of aircraft movements through capital city airports is expected to increase by 2.2 per cent a year over the next 21 years, from 1.1 million in 2008–09 to 1.7 million in 2029–30, an overall increase of around 60 per cent. The number of scheduled aircraft movements is expected to increase by 2.8 per cent a year over the forecast period. This includes 4 per cent growth in international movements, 2.7 per cent in intercapital movements and 2.2 per cent in regional movements. Non-scheduled aircraft movements are assumed to remain unchanged over the forecast period.

• vii •
Contents
Foreword ................................................................................................................................................... iii
At a glance ................................................................................................................................................... v
Executive summary ................................................................................................................................................... xiii
Introduction ........................................................................................................................ xiii
Forecasting method, data and assumptions ...................................................... xiii
Forecasts of aircraft movements ............................................................................. xiv
Chapter 1 Introduction ........................................................................................................................ 1
Objectives ............................................................................................................................ 2
Outline of the report .................................................................................................... 2
Chapter 2 Forecasting method ........................................................................................................ 3
Introduction ........................................................................................................................ 3
Air passenger movement forecasting model .................................................... 3
Aircraft movement forecasting model ................................................................. 4
Hourly aircraft movement forecasting model .................................................. 5
Chapter 3 Data and assumptions ................................................................................................... 7
Introduction ........................................................................................................................ 7
Aircraft size .......................................................................................................................... 8
Seat utilisation rate (Load factor) ........................................................................... 10
Chapter 4 Forecasts of air passenger and aircraft movements ..................................... 11
Introduction ........................................................................................................................ 11
Adelaide Airport .............................................................................................................. 11
Brisbane Airport ............................................................................................................... 16
Canberra Airport ............................................................................................................. 22
Darwin Airport ................................................................................................................. 25
Hobart Airport ................................................................................................................. 33
Melbourne Airport ......................................................................................................... 38
Perth Airport...................................................................................................................... 43

• viii •
Sydney Airport .................................................................................................................. 48
All capital city airports .................................................................................................. 53
References .................................................................................................................................................... 59
• ix •
Tables
TES1 Air passenger movements by capital city airport ................................................................. xv
TES2 Aircraft movements by capital city airport ............................................................................... xv
T2.1 Long-term annual average growth rates of air passenger movements on regional routes by airport ..................................................................................................................
4
T3.1 Economic growth rates (per cent)................................................................................................ 8
T3.2 Average aircraft size and seat utilisation rate by capital city airport and route ... 9
T4.1 Air passenger movements through Adelaide Airport ........................................................ 13
T4.2 Aircraft movements through Adelaide Airport ..................................................................... 15
T4.3 Air passenger movements through Brisbane Airport ....................................................... 19
T4.4 Aircraft movements through Brisbane Airport ...................................................................... 21
T4.5 Air passenger movements through Canberra Airport ...................................................... 24
T4.6 Aircraft movements through Canberra Airport ................................................................... 26
T4.7 Air passenger movements through Darwin Airport ........................................................... 29
T4.8 Aircraft movements through Darwin Airport ........................................................................ 31
T4.9 Air passenger movements through Hobart Airport ........................................................... 34
T4.10 Aircraft movements through Hobart Airport ........................................................................ 36
T4.11 Air passenger movements through Melbourne Airport ................................................... 39
T4.12 Aircraft movements through Melbourne Airport ................................................................ 41
T4.13 Air passenger movements through Perth Airport ............................................................... 44
T4.14 Aircraft movements through Perth Airport ............................................................................ 46
T4.15 Air passenger movements through Sydney Airport ........................................................... 49
T4.16 Aircraft movements through Sydney Airport ......................................................................... 51
T4.17 Air passenger movements through all capital city airports ............................................. 55
T4.18 Aircraft movements through all capital city airports .......................................................... 57

• xi •
Figures
F1.1 Air passenger and aircraft movements through all Australian airports .......... 1
F4.1 Air passenger movements through Adelaide Airport .............................................. 12
F4.2 Aircraft movements through Adelaide Airport ........................................................... 14
F4.3 Annual average hourly proportions of aircraft movements per day through Adelaide Airport in 2007–08 ................................................................................................. 16
F4.4 Average number of aircraft movements per hour through Adelaide Airport in 2008–09 and 2029–30 ...................................................................................... 17
F4.5 Air passenger movements through Brisbane Airport .............................................. 18
F4.6 Aircraft movements through Brisbane Airport ............................................................ 20
F4.7Annual average hourly proportion of aircraft movements per day through Brisbane Airport in 2007–08 ................................................................................................. 20
F4.8 Average number of aircraft movements per hour through Brisbane Airport in 2008–09 and 2029–30 ...................................................................................... 22
F4.9 Air passenger movements through Canberra Airport ............................................ 23
F4.10 Aircraft movements through Canberra Airport ......................................................... 25
F4.11 Annual average hourly proportion of aircraft movements per day through Canberra Airport in 2007–08 ............................................................................................... 27
F4.12 Average number of aircraft movements per hour through Canberra Airport in 2008–09 and 2029–30 ......................................................................................................... 27
F4.13 Air passenger movements through Darwin Airport ................................................. 28
F4.14 Aircraft movements through Darwin Airport .............................................................. 30
F4.15 Annual average hourly proportion of aircraft movements per day through Darwin Airport in 2006–07 .................................................................................................... 32
F4.16 Average number of aircraft movements per hour through Darwin Airport in 2007–08 and 2029–30 ......................................................................................................... 32
F4.17 Air passenger movements through Hobart Airport ................................................. 33
F4.18 Aircraft movements through Hobart Airport .............................................................. 35
F4.19 Annual average hourly proportion of aircraft movements per day through Hobart Airport in 2006–07 .................................................................................................... 37
F4.20 Average number of aircraft movements per hour through Hobart Airport in 2007–08 and 2029–30 ......................................................................................................... 37
F4.21 Air passenger movements through Melbourne Airport ......................................... 38

• xii •
BITRE • Report 117
F4.22 Aircraft movements through Melbourne Airport ...................................................... 40
F4.23 Annual average hourly proportion of aircraft movements per day through Melbourne Airport in 2007–08 ............................................................................................ 42
F4.24 Average number of aircraft movements per hour through Melbourne Airport in 2007–08 and 2029–30 ...................................................................................... 42
F4.25 Air passenger movements through Perth Airport ..................................................... 43
F4.26 Aircraft movements through Perth Airport .................................................................. 45
F4.27 Annual average hourly proportion of aircraft movements per day through Perth Airport in 2007–08 ........................................................................................................ 47
F4.28 Average number of aircraft movements per hour through Perth Airport in 2007–08 and 2029–30 ......................................................................................................... 47
F4.29 Air passenger movements through Sydney Airport ................................................. 48
F4.30 Aircraft movements through Sydney Airport ............................................................... 50
F4.31 Annual average hourly proportion of aircraft movements per day through Sydney Airport in 2007–08 .................................................................................................... 52
F4.32 Hourly aircraft movements through Sydney Airport during morning and evening peak hours: October–December 2008 ......................................................... 52
F4.33 Average number of aircraft movements per hour through Sydney Airport in 2008–09, 2014–15, 2018–19 and 2022–23 ............................................................. 53
F4.34 Air passenger movements through all capital city airports ................................... 54
F4.35 Aircraft movements through all capital city airports ................................................ 56
• xiii •
Executive summary
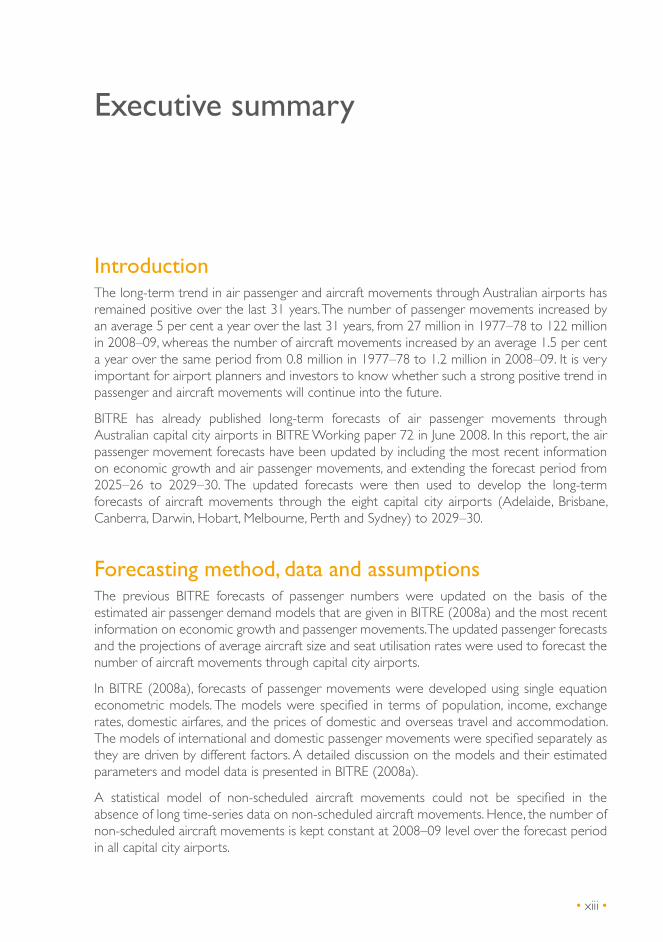
IntroductionThe long-term trend in air passenger and aircraft movements through Australian airports has remained positive over the last 31 years. The number of passenger movements increased by an average 5 per cent a year over the last 31 years, from 27 million in 1977–78 to 122 million in 2008–09, whereas the number of aircraft movements increased by an average 1.5 per cent a year over the same period from 0.8 million in 1977–78 to 1.2 million in 2008–09. It is very important for airport planners and investors to know whether such a strong positive trend in passenger and aircraft movements will continue into the future.
BITRE has already published long-term forecasts of air passenger movements through Australian capital city airports in BITRE Working paper 72 in June 2008. In this report, the air passenger movement forecasts have been updated by including the most recent information on economic growth and air passenger movements, and extending the forecast period from 2025–26 to 2029–30. The updated forecasts were then used to develop the long-term forecasts of aircraft movements through the eight capital city airports (Adelaide, Brisbane, Canberra, Darwin, Hobart, Melbourne, Perth and Sydney) to 2029–30.
Forecasting method, data and assumptionsThe previous BITRE forecasts of passenger numbers were updated on the basis of the estimated air passenger demand models that are given in BITRE (2008a) and the most recent information on economic growth and passenger movements. The updated passenger forecasts and the projections of average aircraft size and seat utilisation rates were used to forecast the number of aircraft movements through capital city airports.
In BITRE (2008a), forecasts of passenger movements were developed using single equation econometric models. The models were specified in terms of population, income, exchange rates, domestic airfares, and the prices of domestic and overseas travel and accommodation. The models of international and domestic passenger movements were specified separately as they are driven by different factors. A detailed discussion on the models and their estimated parameters and model data is presented in BITRE (2008a).
A statistical model of non-scheduled aircraft movements could not be specified in the absence of long time-series data on non-scheduled aircraft movements. Hence, the number of non-scheduled aircraft movements is kept constant at 2008–09 level over the forecast period in all capital city airports.

• xiv •
BITRE • Report 117
Further, the size of aircraft operating in Australia varies by route (international, intercapital and regional) and airport. Mostly, large aircraft are being used to transport passengers on international routes, medium-sized aircraft are used on intercapital routes and relatively smaller aircraft are used on regional routes. In the absence of long time series data on average aircraft size by route, a statistical model could not be estimated for use in forecasting the average size of aircraft operating through capital city airports. However, the average size of aircraft takes several years to change, as it involves a huge investment and there is also a lag in aircraft development. Hence, this study assumes that the average size of aircraft increases at the same rate as that observed in the past, by 2 per cent a year for the first five years of the forecast period and 1 per cent a year over the remaining of the forecast period. These growth rates are assumed to remain the same over all routes linking to capital city airports.
With regard to seat utilisation rates, BITRE assumes that the rates will remain constant at the 2008–09 level over the entire forecast period. This simple assumption is made because a long time series of data on seat utilisation rates by route is not available for model-based forecasting purposes.
In 2008–09, the average seat utilisation rate on intercapital routes was 80 per cent in Adelaide, Brisbane, Hobart, Melbourne and Sydney; 79 per cent in Darwin; 76 per cent in Perth and 65 per cent in Canberra. Similarly, on international routes, it was 77 per cent in Adelaide; 76 per cent in Melbourne; 75 per cent in Sydney; 74 per cent in Perth; 73 per cent in Brisbane and 67 per cent in Darwin. On regional routes, it was 72 per cent in Brisbane; 69 per cent in Sydney; 68 per cent in Melbourne and Darwin; 67 per cent in Adelaide; 61 per cent in Canberra; 53 per cent in Perth and 34 per cent in Hobart.
Forecasts of aircraft movementsThe number of air passenger movements through eight capital city airports declined by 7.9 per cent in 2001–02, largely due to the 9/11 terrorist attacks and the collapse of Ansett Australia Airlines. However, it bounced back the following year and recorded strong growth of 13.3 per cent in 2003–04, 9.1 per cent in 2004–05 and annually by 5.3 per cent over the last seventeen years, from 41 million in 1991–92 to 98.3 million in 2008–09.
Taking account of the expected slowing of growth in Australia and international economies as well as the maturation of the influence of low-cost carriers on passenger growth, the number of passenger movements through eight capital city airports is forecast to increase overall by 4.2 per cent a year over the forecast period to 235 million in 2029–30 (Table ES1). Forecast annual increases, by route type, are 5.3, 4 and 3.5 per cent on international, intercapital and regional routes, respectively.

• xv •
Executive summary
TES1 Air passenger movements by capital city airport
Number of movements Annual average growth rateAirport History
1991–92History
2008–09Forecast2029–30
History1991–92 to
2008–09
Forecast2008–09 to
2029–30
(millions) (per cent)Adelaide 3.0 6.8 14.1 4.9 3.5Brisbane 6.7 18.8 51.2 6.2 4.9Canberra 1.4 3.1 6.3 4.9 3.5Darwin 0.6 1.7 4.1 6.5 4.4Hobart 0.7 1.9 3.9 6.1 3.5Melbourne 10.4 24.5 57.7 5.2 4.2Perth 3.1 9.4 24.8 6.8 4.7Sydney 15.2 32.2 72.9 4.5 4.0Total* 41.0 98.3 235.0 5.3 4.2
* Eight capital city airports total.
The impact of the Global Financial Crisis (GFC) is expected to be much lower in 2009–10 and 2010–11 as the Australian and world economies are forecast to perform more strongly than previously expected. This stronger growth projection is reflected in the aircraft movement forecasts.
Over one million aircraft movements were recorded passing through eight capital city airports in 2008–09, including 837 300 scheduled and 256 000 non-scheduled aircraft movements. Intercapital, regional and international movements accounted for 5133 and 16 per cent of the total scheduled aircraft movements respectively. The number of aircraft movements through eight capital city airports is forecast to increase by 2.2 per cent a year over the forecast period to 1.7 million in 2029–30 (Table ES2). It is expected to increase annually by 4 per cent on international routes, 2.7 per cent on intercapital routes and by 2.2 per cent on regional routes. In 2029–30, around 309 900 aircraft movements will be on international routes, 746 100 aircraft on intercapital routes and 431 300 aircraft on regional routes. Non-scheduled aircraft movements are assumed to remain unchanged over the forecast period.
TES2 Aircraft movements by capital city airport
Number of movements (thousands) Annual average growth rate forecast (per cent)
Actual 2008–09 Forecast 2029–30 2008–09 to 2029–30Airport Scheduled
movementsTotal
movements*Scheduled
movementsTotal
movements*Scheduled
movementsTotal
movements* Adelaide 73.4 103.3 117.2 147.1 2.3 1.7Brisbane 154.1 183.7 316.4 346.1 3.5 3.1Canberra 44.1 84.8 70.5 111.1 2.3 1.3Darwin 22.2 87.0 39.0 103.8 2.7 0.8Hobart 14.3 29.0 22.8 37.5 2.2 1.2Melbourne 184.0 195.0 327.7 338.7 2.2 2.0Perth 77.8 119.0 143.9 185.1 3.0 2.1Sydney 267.4 291.5 449.8 473.9 2.5 2.3Total** 837.3 1 093.3 1 487.3 1 743.3 2.8 2.2
* Includes scheduled and non-scheduled aircraft movements.** Eight capital city airports total.
• xvi •
BITRE • Report 117
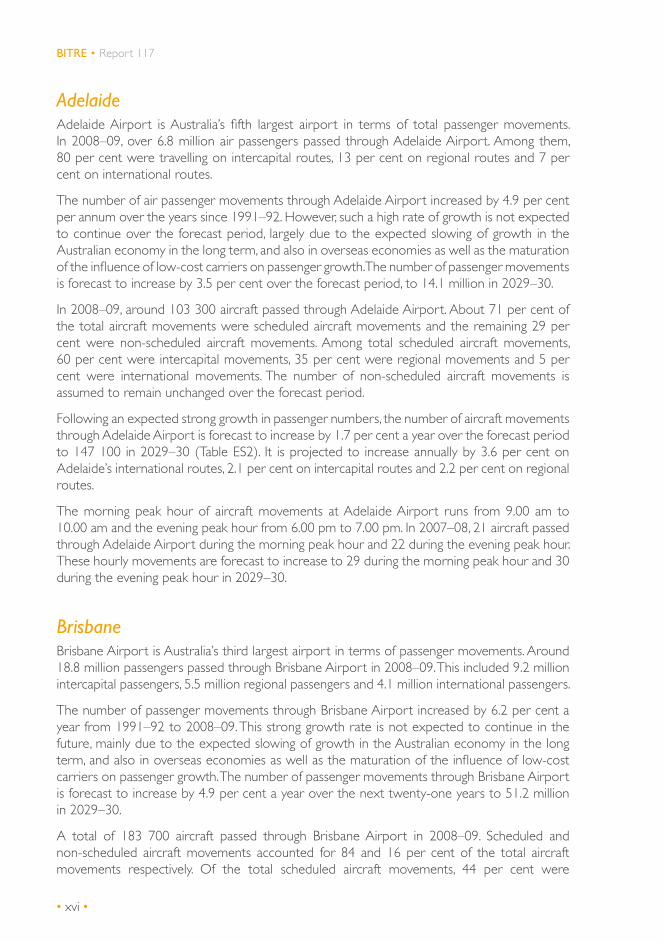
AdelaideAdelaide Airport is Australia’s fifth largest airport in terms of total passenger movements. In 2008–09, over 6.8 million air passengers passed through Adelaide Airport. Among them, 80 per cent were travelling on intercapital routes, 13 per cent on regional routes and 7 per cent on international routes.
The number of air passenger movements through Adelaide Airport increased by 4.9 per cent per annum over the years since 1991–92. However, such a high rate of growth is not expected to continue over the forecast period, largely due to the expected slowing of growth in the Australian economy in the long term, and also in overseas economies as well as the maturation of the influence of low-cost carriers on passenger growth. The number of passenger movements is forecast to increase by 3.5 per cent over the forecast period, to 14.1 million in 2029–30.
In 2008–09, around 103 300 aircraft passed through Adelaide Airport. About 71 per cent of the total aircraft movements were scheduled aircraft movements and the remaining 29 per cent were non-scheduled aircraft movements. Among total scheduled aircraft movements, 60 per cent were intercapital movements, 35 per cent were regional movements and 5 per cent were international movements. The number of non-scheduled aircraft movements is assumed to remain unchanged over the forecast period.
Following an expected strong growth in passenger numbers, the number of aircraft movements through Adelaide Airport is forecast to increase by 1.7 per cent a year over the forecast period to 147 100 in 2029–30 (Table ES2). It is projected to increase annually by 3.6 per cent on Adelaide’s international routes, 2.1 per cent on intercapital routes and 2.2 per cent on regional routes.
The morning peak hour of aircraft movements at Adelaide Airport runs from 9.00 am to 10.00 am and the evening peak hour from 6.00 pm to 7.00 pm. In 2007–08, 21 aircraft passed through Adelaide Airport during the morning peak hour and 22 during the evening peak hour. These hourly movements are forecast to increase to 29 during the morning peak hour and 30 during the evening peak hour in 2029–30.
BrisbaneBrisbane Airport is Australia’s third largest airport in terms of passenger movements. Around 18.8 million passengers passed through Brisbane Airport in 2008–09. This included 9.2 million intercapital passengers, 5.5 million regional passengers and 4.1 million international passengers.
The number of passenger movements through Brisbane Airport increased by 6.2 per cent a year from 1991–92 to 2008–09. This strong growth rate is not expected to continue in the future, mainly due to the expected slowing of growth in the Australian economy in the long term, and also in overseas economies as well as the maturation of the influence of low-cost carriers on passenger growth. The number of passenger movements through Brisbane Airport is forecast to increase by 4.9 per cent a year over the next twenty-one years to 51.2 million in 2029–30.
A total of 183 700 aircraft passed through Brisbane Airport in 2008–09. Scheduled and non-scheduled aircraft movements accounted for 84 and 16 per cent of the total aircraft movements respectively. Of the total scheduled aircraft movements, 44 per cent were

• xvii •
Executive summary
intercapital movements, 39 per cent were regional movements and 17 per cent were international movements.
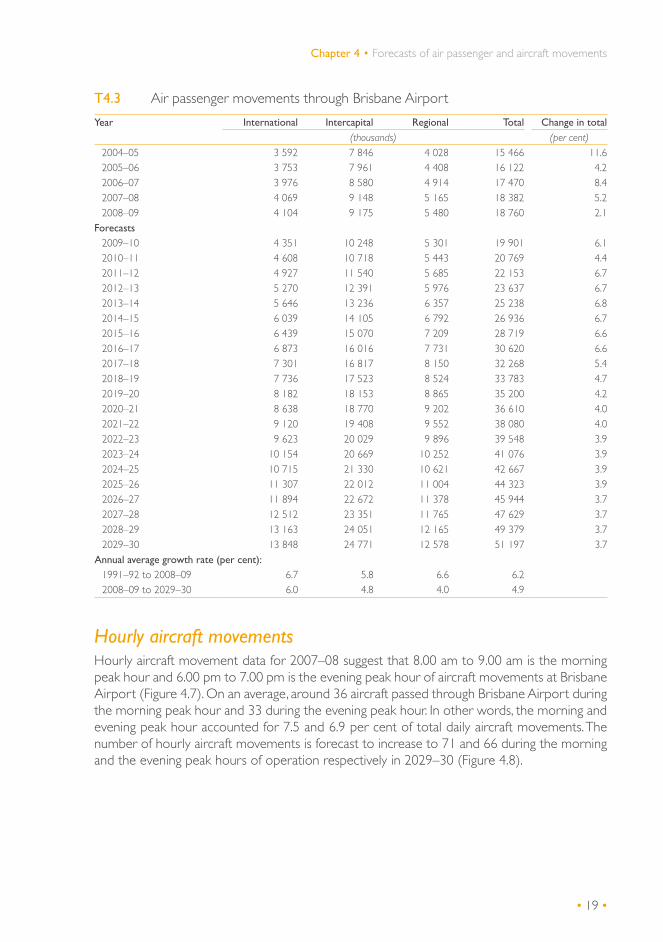
The number of aircraft movements through Brisbane Airport is forecast to increase by 3.1 per cent a year over the forecast period to 346 100 in 2029–30. It is expected to increase annually by 4.7 per cent on Brisbane’s international routes, 3.6 per cent on intercapital routes and 2.8 per cent on regional routes. Non-scheduled flights are assumed to remain constant over the forecast period.
Hourly aircraft movement data suggest that 8.00 am to 9.00 am is the morning peak hour and 6.00 pm to 7.00 pm is the evening peak hour for aircraft movements at Brisbane Airport. In 2007–08, around 36 aircraft passed through Brisbane Airport during the morning peak hour and 33 during the evening peak hour. These hourly movements are forecast to increase to 71 and 66 during the morning and the evening peak hours of operation respectively in 2029–30.
CanberraCanberra International Airport provides direct passenger services to major domestic destinations. At present, there are no scheduled international passenger services to and from Canberra Airport. Some international chartered and VIP flights do fly to and from Canberra.
The number of passenger movements through Canberra Airport increased by 4.9 per cent a year since 1991–92 to 3.1 million in 2008–09. Following the expected slowing of growth in the Australian economy in the long term, and also in overseas economies as well as the maturation of the influence of low-cost carriers on passenger growth, the number of passenger movements is forecast to increase by 3.5 per cent a year over the forecast period to 6.3 million in 2029–30.
In 2008–09, around 84,800 aircraft passed through Canberra Airport, including 44 100 scheduled and 40 600 non-scheduled aircraft movements. Intercapital and regional movements accounted for 93 and 7 per cent of the total scheduled aircraft movements respectively. The number of aircraft movements at Canberra Airport is forecast to increase by 1.3 per cent a year over the forecast period to 111 100 in 2029–30. It will increase annually by 2.2 per cent on Canberra’s intercapital routes and by 2.4 per cent on regional routes. The number of non-scheduled aircraft movements is assumed to remain unchanged over the forecast period.
According to hourly aircraft movement data, there are two distinctive peak hours at Canberra Airport: 9.00 am to 10.00 am in the morning and 5.00 pm to 6.00 pm in the evening. Around 16 aircraft passed through Canberra Airport during the morning peak hour and 21 during the evening peak hour. These hourly movement numbers are forecast to increase to 21 and 26 during the morning and the evening peak hours of operation respectively in 2029–30.
DarwinAround 1.7 million passengers passed through Darwin Airport in 2008–09. Among them, 19 per cent were international passengers, 72 per cent were intercapital passengers and 9 per cent were regional passengers.
The number of passenger movements through Darwin Airport has increased by 6.5 per cent a year since 1991–92. However, such a strong growth is not expected over the forecast period,
• xviii •
BITRE • Report 117
largely due to the expected slowing of growth in the Australian economy in the long term, and also in overseas economies as well as the maturation of the influence of low-cost carriers on passenger growth. The number of passenger movements is forecast to increase by 4.4 per cent a year in the next 21 years to 4.1 million in 2029–30.
In 2008–09, around 87 000 aircraft passed through Darwin Airport. Among them, 74 per cent were non-scheduled aircraft movements and only 26 per cent were scheduled movements. The use of the airport by the air force is the main reason for the high number of non-scheduled movements. Of the total scheduled aircraft movements, regional routes accounted for 41 per cent, intercapital routes 36 per cent and international routes 24 per cent.
Following an expected positive growth in passenger movement numbers, the number of aircraft movements through Darwin Airport is forecast to increase by 0.8 per cent a year over the forecast period to 103 800 in 2029–30. The number of scheduled aircraft movements is projected to increase by 2.7 per cent a year to 39,000 in 2029–30. It is expected to increase annually by 3.4 per cent on Darwin’s international routes, 3.2 per cent on intercapital routes and 1.8 per cent on regional routes. Non-scheduled aircraft movements are assumed to remain unchanged over the forecast period.
According to hourly aircraft movement data, there are four peak hours of aircraft operation at Darwin Airport. The first peak hour runs between 1.00 am and 2.00 am, the second between 6.00 am and 7.00 am, the third between 1.00 pm and 2.00 pm and the fourth between 6.00 pm and 7.00 pm. Around 17 aircraft passed during the first peak hour, 16 during the second peak hour, 25 during the third peak period and 13 during the fourth peak hour. These hourly movements are forecast to increase to 20 during the first peak hour, 19 during the second peak hour, 29 during the third peak period and 15 during the fourth peak hour in 2029–30.
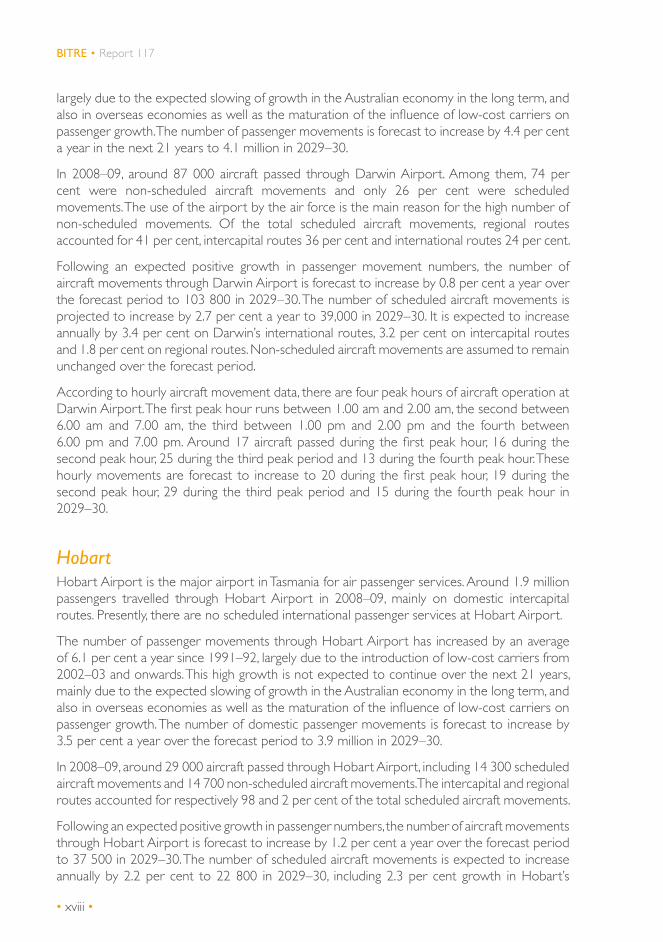
HobartHobart Airport is the major airport in Tasmania for air passenger services. Around 1.9 million passengers travelled through Hobart Airport in 2008–09, mainly on domestic intercapital routes. Presently, there are no scheduled international passenger services at Hobart Airport.
The number of passenger movements through Hobart Airport has increased by an average of 6.1 per cent a year since 1991–92, largely due to the introduction of low-cost carriers from 2002–03 and onwards. This high growth is not expected to continue over the next 21 years, mainly due to the expected slowing of growth in the Australian economy in the long term, and also in overseas economies as well as the maturation of the influence of low-cost carriers on passenger growth. The number of domestic passenger movements is forecast to increase by 3.5 per cent a year over the forecast period to 3.9 million in 2029–30.
In 2008–09, around 29 000 aircraft passed through Hobart Airport, including 14 300 scheduled aircraft movements and 14 700 non-scheduled aircraft movements. The intercapital and regional routes accounted for respectively 98 and 2 per cent of the total scheduled aircraft movements.
Following an expected positive growth in passenger numbers, the number of aircraft movements through Hobart Airport is forecast to increase by 1.2 per cent a year over the forecast period to 37 500 in 2029–30. The number of scheduled aircraft movements is expected to increase annually by 2.2 per cent to 22 800 in 2029–30, including 2.3 per cent growth in Hobart’s
• xix •
Executive summary
intercapital routes and 1.7 per cent on regional routes. Non-scheduled aircraft movements are assumed to remain unchanged over the forecast period.
Hourly aircraft movement data suggest that there are four distinctive peak hours of aircraft operation at Hobart Airport: the early morning peak hour (6.00 am to 7.00 am), the morning peak hour (10.00 am to 11.00 am), the afternoon peak hour (4.00 pm to 5.00 pm) and the evening peak hour (6.00 pm to 7.00 pm). In 2006–07, 8 aircraft moved during the early morning and morning peak hours, and 6 during the afternoon and evening peak hours. These hourly movements are forecast to increase to 10 during the early morning and morning peak hours and 7 during the afternoon and evening peak hours in 2029–30.
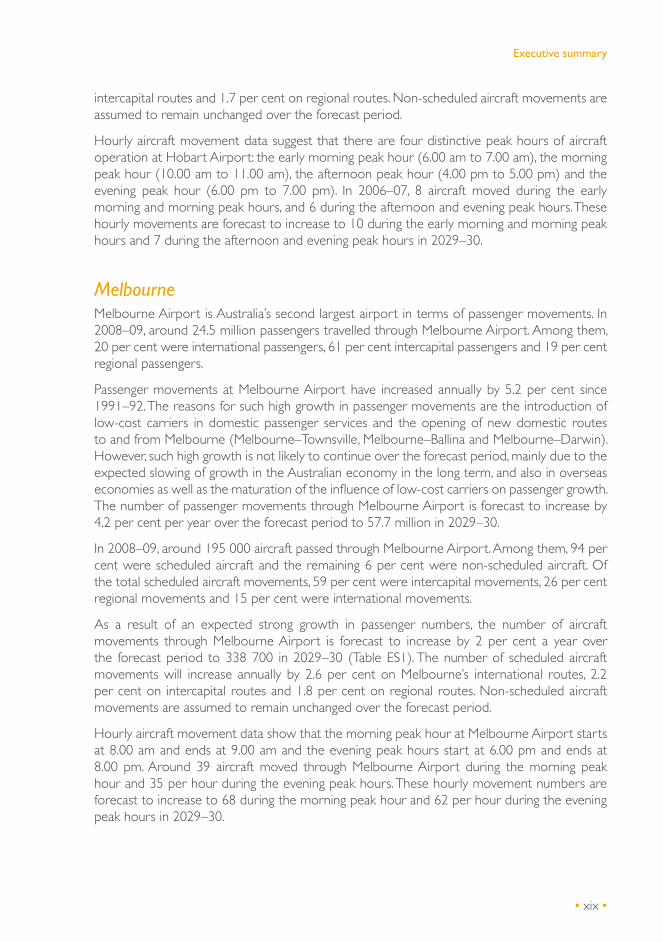
MelbourneMelbourne Airport is Australia’s second largest airport in terms of passenger movements. In 2008–09, around 24.5 million passengers travelled through Melbourne Airport. Among them, 20 per cent were international passengers, 61 per cent intercapital passengers and 19 per cent regional passengers.
Passenger movements at Melbourne Airport have increased annually by 5.2 per cent since 1991–92. The reasons for such high growth in passenger movements are the introduction of low-cost carriers in domestic passenger services and the opening of new domestic routes to and from Melbourne (Melbourne–Townsville, Melbourne–Ballina and Melbourne–Darwin). However, such high growth is not likely to continue over the forecast period, mainly due to the expected slowing of growth in the Australian economy in the long term, and also in overseas economies as well as the maturation of the influence of low-cost carriers on passenger growth. The number of passenger movements through Melbourne Airport is forecast to increase by 4.2 per cent per year over the forecast period to 57.7 million in 2029–30.
In 2008–09, around 195 000 aircraft passed through Melbourne Airport. Among them, 94 per cent were scheduled aircraft and the remaining 6 per cent were non-scheduled aircraft. Of the total scheduled aircraft movements, 59 per cent were intercapital movements, 26 per cent regional movements and 15 per cent were international movements.
As a result of an expected strong growth in passenger numbers, the number of aircraft movements through Melbourne Airport is forecast to increase by 2 per cent a year over the forecast period to 338 700 in 2029–30 (Table ES1). The number of scheduled aircraft movements will increase annually by 2.6 per cent on Melbourne’s international routes, 2.2 per cent on intercapital routes and 1.8 per cent on regional routes. Non-scheduled aircraft movements are assumed to remain unchanged over the forecast period.
Hourly aircraft movement data show that the morning peak hour at Melbourne Airport starts at 8.00 am and ends at 9.00 am and the evening peak hours start at 6.00 pm and ends at 8.00 pm. Around 39 aircraft moved through Melbourne Airport during the morning peak hour and 35 per hour during the evening peak hours. These hourly movement numbers are forecast to increase to 68 during the morning peak hour and 62 per hour during the evening peak hours in 2029–30.
• xx •
BITRE • Report 117
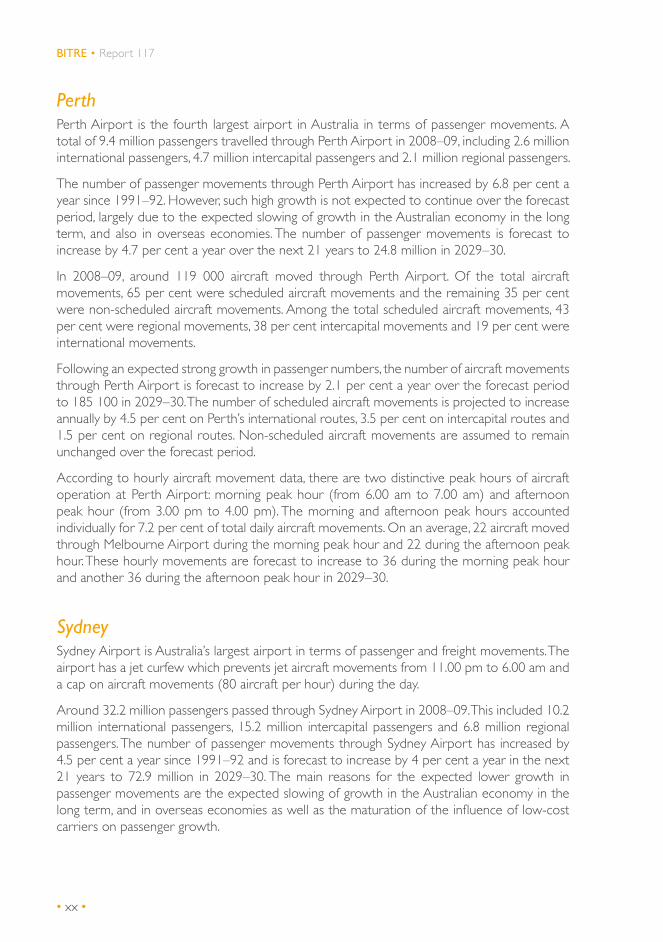
PerthPerth Airport is the fourth largest airport in Australia in terms of passenger movements. A total of 9.4 million passengers travelled through Perth Airport in 2008–09, including 2.6 million international passengers, 4.7 million intercapital passengers and 2.1 million regional passengers.
The number of passenger movements through Perth Airport has increased by 6.8 per cent a year since 1991–92. However, such high growth is not expected to continue over the forecast period, largely due to the expected slowing of growth in the Australian economy in the long term, and also in overseas economies. The number of passenger movements is forecast to increase by 4.7 per cent a year over the next 21 years to 24.8 million in 2029–30.
In 2008–09, around 119 000 aircraft moved through Perth Airport. Of the total aircraft movements, 65 per cent were scheduled aircraft movements and the remaining 35 per cent were non-scheduled aircraft movements. Among the total scheduled aircraft movements, 43 per cent were regional movements, 38 per cent intercapital movements and 19 per cent were international movements.
Following an expected strong growth in passenger numbers, the number of aircraft movements through Perth Airport is forecast to increase by 2.1 per cent a year over the forecast period to 185 100 in 2029–30. The number of scheduled aircraft movements is projected to increase annually by 4.5 per cent on Perth’s international routes, 3.5 per cent on intercapital routes and 1.5 per cent on regional routes. Non-scheduled aircraft movements are assumed to remain unchanged over the forecast period.
According to hourly aircraft movement data, there are two distinctive peak hours of aircraft operation at Perth Airport: morning peak hour (from 6.00 am to 7.00 am) and afternoon peak hour (from 3.00 pm to 4.00 pm). The morning and afternoon peak hours accounted individually for 7.2 per cent of total daily aircraft movements. On an average, 22 aircraft moved through Melbourne Airport during the morning peak hour and 22 during the afternoon peak hour. These hourly movements are forecast to increase to 36 during the morning peak hour and another 36 during the afternoon peak hour in 2029–30.
SydneySydney Airport is Australia’s largest airport in terms of passenger and freight movements. The airport has a jet curfew which prevents jet aircraft movements from 11.00 pm to 6.00 am and a cap on aircraft movements (80 aircraft per hour) during the day.
Around 32.2 million passengers passed through Sydney Airport in 2008–09. This included 10.2 million international passengers, 15.2 million intercapital passengers and 6.8 million regional passengers. The number of passenger movements through Sydney Airport has increased by 4.5 per cent a year since 1991–92 and is forecast to increase by 4 per cent a year in the next 21 years to 72.9 million in 2029–30. The main reasons for the expected lower growth in passenger movements are the expected slowing of growth in the Australian economy in the long term, and in overseas economies as well as the maturation of the influence of low-cost carriers on passenger growth.

• xxi •
Executive summary
Over 291 500 aircraft passed through Sydney Airport in 2008–09, including 267 400 scheduled aircraft and 24 100 non-scheduled aircraft. Intercapital, regional and international routes accounted for respectively 43, 35 and 22 per cent of the total scheduled aircraft movements.
Following an expected strong growth in passenger numbers, the number of aircraft movements through Sydney Airport is forecast to increase by 2.3 per cent a year over the forecast period to 473 900 in 2029–30. The number of scheduled aircraft movements will increase annually by 2.5 per cent over the forecast period, including 3.4 per cent on the international routes, 2.5 per cent on the intercapital routes and 1.8 per cent on the regional routes. Non-scheduled aircraft movements are assumed to remain unchanged over the forecast period.
Hourly aircraft movement data show two distinctive peak hours of aircraft movements through Sydney Airport: one in the morning, from 8.00 am to 9.00 am and another in the evening, from 6.00 pm to 7.00 pm. In 2008, the number of hourly aircraft movements was observed to be over 60 during most morning and evening peak hours and sometimes very close to the existing hourly cap of 80 movements. Assuming that the current morning and evening peaks do not spread over the forecast period, the number of hourly aircraft movements is expected to reach 70 during the morning peak hour in 2014–15, 80 during the morning peak hour in 2018–19 and would reach 80 during both morning and evening peak hours by 2022–23.

• 1 •
CHAPTER 1
Introduction
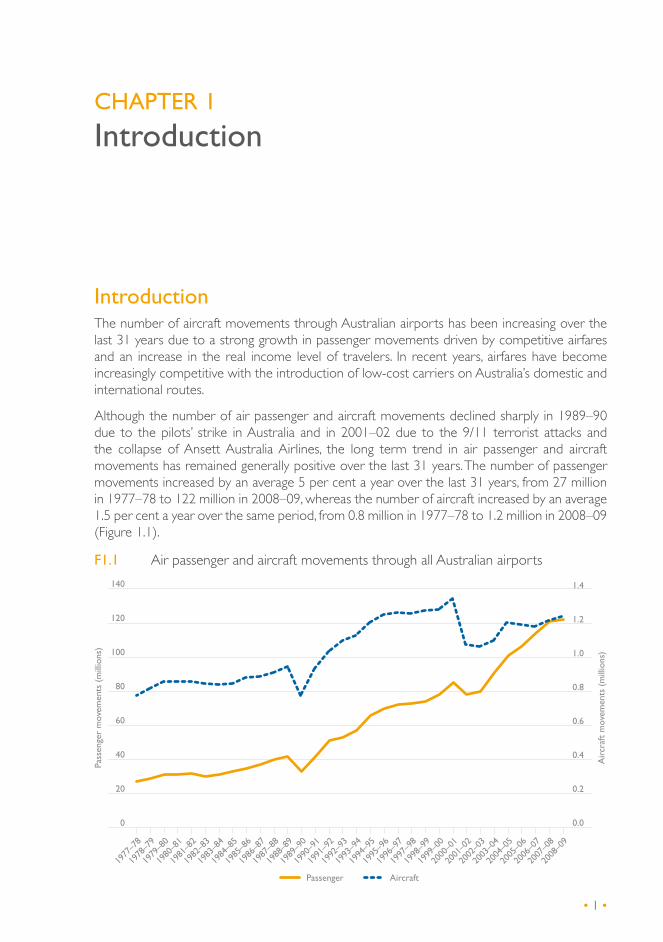
IntroductionThe number of aircraft movements through Australian airports has been increasing over the last 31 years due to a strong growth in passenger movements driven by competitive airfares and an increase in the real income level of travelers. In recent years, airfares have become increasingly competitive with the introduction of low-cost carriers on Australia’s domestic and international routes.
Although the number of air passenger and aircraft movements declined sharply in 1989–90 due to the pilots’ strike in Australia and in 2001–02 due to the 9/11 terrorist attacks and the collapse of Ansett Australia Airlines, the long term trend in air passenger and aircraft movements has remained generally positive over the last 31 years. The number of passenger movements increased by an average 5 per cent a year over the last 31 years, from 27 million in 1977–78 to 122 million in 2008–09, whereas the number of aircraft increased by an average 1.5 per cent a year over the same period, from 0.8 million in 1977–78 to 1.2 million in 2008–09 (Figure 1.1).
F1.1 Air passenger and aircraft movements through all Australian airports
0
20
40
60
80
100
120
140
2008
–09
2007
–08
2006
–07
2005
–06
2004
–05
2003
–04
2002
–03
2001
–02
2000
–01
1999
–00
1998
–99
1997
–98
1996
–97
1995
–96
1994
–95
1993
–94
1992
–93
1991
–92
1990
–91
1989
–90
1988
–89
1987
–88
1986
–87
1985
–86
1984
–85
1983
–84
1982
–83
1981
–82
1980
–81
1979
–80
1978
–79
1977
–78
Pass
enge
r m
ovem
ents
(m
illio
ns)
Air
craf
t m
ovem
ents
(m
illio
ns)
0.0
0.2
0.4
0.6
0.8
1.0
1.2
1.4
Passenger Aircraft

• 2 •
BITRE • Report 117
The number of passenger movements increased annually by 6.8 and 4.7 per cent on Australia’s international and domestic routes respectively; whereas the number of aircraft movements on Australia’s international and domestic routes increased by respectively 6 and 1.2 per cent a year over the same period.
ObjectivesThe following are the main objectives of this study:
• to forecast the number of aircraft movements through Australia’s capital city airports to 2029–30
• to forecast the number of aircraft movements by type of movements (that is, international, intercapital and regional movements)
• to determine current peak hours of aircraft movements at capital city airports
• to forecast the number of aircraft movements by hour through capital city airports to 2029–30.
Outline of the reportThe models that were used to forecast air passenger and aircraft numbers are discussed in Chapter 2. In Chapter 3, a detailed discussion on data and their sources and macroeconomic and population assumptions is given, to allow readers to understand the underlying assumptions behind forecasts derived in this report.
Chapter 4 includes forecasts of passenger and aircraft movements by capital city airports. It also shows forecasts of hourly movements of aircraft at each capital city airport.
• 3 •
CHAPTER 2
Forecasting method
IntroductionIn this study, forecasts of aircraft movements through Australia’s eight capital city airports are developed on the basis of forecasts of passenger movements, aircraft size and seat utilisation rates. Forecasts of passenger movements reported in BITRE Working paper 72 (BITRE 2008a) are updated by including the most recent information on economic growth and air passenger movements, and extending the forecasts for four more years to 2029–30. The updated forecasts were then used to develop the long-term forecasts of aircraft movements through the eight capital city airports (Adelaide, Brisbane, Canberra, Darwin, Hobart, Melbourne, Perth and Sydney) to 2029–30.
Forecasts of aircraft movements on international, intercapital and regional routes are separately developed, as air passenger travel demands on these routes are driven by different factors. For example, the real income level of Australians largely influences the international and domestic movements of Australian residents, whereas the real income level of overseas visitors drives the international movements of overseas visitors to Australia. In this study, ‘regional routes’ is defined as all domestic routes except for intercapital city routes.
The models that were used to forecast air passenger and aircraft numbers are discussed in the next sections.
Air passenger movement forecasting modelIn a previous BITRE publication (BITRE 2008a), forecasts of air passenger movements through Australia’s eight capital city airports and other airports were developed using single equation econometric models in a double-logarithmic linear functional form. The models are chosen because they can accommodate several explanatory variables to analyse their influence on passenger movements, they are easy to estimate, provide superior fit, and the estimated parameters can be directly interpreted as elasticities. Such models have been widely used in many tourism and transport demand-forecasting studies.
The models, which are specified in terms of population, income, exchange rates, domestic airfare and the prices of domestic and overseas travel and accommodation, were empirically estimated using historical annual data (from 1984–85 to 2005–06 in the case of domestic passenger movements and from 1991–92 to 2005–06 in the case of international passenger movements).
• 4 •
BITRE • Report 117
Domestic passenger movement forecasts given in BITRE (2008a) are disaggregated into intercapital city and regional passenger movement forecasts. Growth rate forecasts that are presented in BITRE Report 115 (BITRE 2008b) were updated to account for the GFC influences and used as the basis to develop forecasts of regional air passenger movements through capital city airports and these regional movement forecasts were subtracted from domestic movement forecasts of BITRE (2008a) in order to derive forecasts of intercapital city movements. The updated long-term annual average growth rates of air passenger movements on the regional routes are presented in Table 2.1.
T2.1 Long-term annual average growth rates of air passenger movements on regional routes by airport
Airport Forecast 2008–09 to 2029–30 (per cent)Adelaide 3.5Brisbane 4.0Canberra 3.6Darwin 3.1Hobart 3.0Melbourne 3.8Perth 2.8Sydney 3.1
Aircraft movement forecasting modelForecasts of scheduled aircraft movements are developed using Equation 2.1 which states that the number of aircraft movements is a derivative of air passenger numbers, aircraft size and seat utilisation rate.
(2.1) Aijt = Pijt/(Sijt*Lijt)
Where:
Aijt is the number of aircraft movements on the ith route of the jth capital city airport in period t
Pijt is the number of air passengers movements on the ith route of the jth capital city airport in period t
Sijt is the average size of passenger aircraft operating on the ith route of the jth capital city airport in period t
Lijt is the average seat utilisation rate of passenger aircraft operating on the ith route of the jth capital city airport in period t
i = 1,2 and 3 (1 = International route, 2 = Intercapital city route and 3 = Regional route)
j = 1, 2, …, 8 (1=Adelaide, 2 = Brisbane, 3 = Canberra, 4 = Darwin, 5 = Hobart, 6 = Melbourne, 7 = Perth and 8 = Sydney).
• 5 •
Chapter 2 • Forecasting method
A statistical model of non-scheduled aircraft movements could not be specified in the absence of a long time-series data on non-scheduled aircraft movements. Hence, the number of non-scheduled aircraft movements is kept constant at 2007–08 level over the forecast period in all capital city airports.
Hourly aircraft movement forecasting modelIn this report, forecasts of hourly aircraft movements have been prepared and presented in order to examine whether the existing airport facilities are likely to be sufficient to meet demand for aircraft movements during peak hours over the forecast period. The forecasts were developed on the basis of the hourly proportions of aircraft movements and total aircraft movements through capital city airports. The current hourly proportions which were estimated using Airservices Australia data on hourly movements of aircraft are assumed to remain constant throughout the forecast period. This assumption was made as it would be highly problematic to forecast hourly proportions in the absence of data on factors that are likely to influence hourly aircraft movements.
The current hourly proportions and forecasts of hourly movements of aircraft by capital city airport are presented and discussed in detail in Chapter 4.


• 7 •
CHAPTER 3
Data and assumptions
IntroductionAs mentioned in earlier chapters, forecasts of aircraft movements are developed on the basis of forecasts of air passenger numbers, average aircraft size and seat utilisation rates. The forecasts of passenger numbers to 2025–26 are taken from BITRE (2008a) and updated to include the most recent information on economic growth and air passenger movements. The economic growth assumptions forecasts were extended to 2029–30 on the basis of the estimated parameters of air passenger demand models that are given in BITRE (2008a), assuming that the macroeconomic and population growth rate assumptions for 2026–27 to 2029–30 will remain the same as those in the year 2025–26.
A detailed discussion of the models, historical model data and assumptions (other than economic growth rate assumptions) that were used to forecast air passenger movements is presented in BITRE (2008a). The most recent economic growth rate forecasts that account for the Global Financial Crisis were used in this study to update the air passenger forecasts and are presented in Table 3.1. The growth rate forecasts for the next eight years, from 2009–10 to 2016–17, were obtained from Treasury (2009a, 2009b and 2009c), for the next three years after 2016–17 from Access Economics (2009) and for the remainder of the forecast period from the MMRF Model of Monash University (2008). The forecasts of the Monash University reflect the projections published by Treasury in its intergenerational report.
The economic growth rate forecasts suggest that the Global Financial Crisis will continue to have some adverse impact on the Australian and the world economies in 2009–10. These economies are expected to recover from the GFC from 2010–11 onwards. The Australian economy is forecast to perform strongly from 2011–12 to 2016–17. This will have a significant positive impact on air passenger and aircraft movements through the capital city airports.

• 8 •
BITRE • Report 117
T3.1 Economic growth rates (per cent)
Year Real GDP Australia Real GDP World2007–08 3.6 4.82008–09 0.6 1.9
Forecasts2009–10 1.5 1.92010–11 2.8 1.22011–12 4.0 3.62012–13 4.0 3.72013–14 4.0 3.62014–15 4.0 3.62015–16 4.0 3.62016–17 4.0 3.62017–18 3.3 3.62018–19 2.9 3.62019–20 2.6 2.62020–21 to 2021–22 2.5 3.52022–23 to 2025–26 2.4 3.52026–27 to 2029–30 2.3 3.5
Sources: Treasury (2009a, 2009b & 2009c), Access Economics (2009) and Monash University (2008)
Aircraft sizeThe size of aircraft operating in Australia varies by route (international, intercapital and regional) and airport. Mostly, large aircraft are being used to transport passengers on international routes, medium-sized aircraft are used on intercapital routes and relatively smaller aircraft are used on regional routes. In 2008–09, the average size of aircraft operating on Perth’s international routes is observed to have had 246 seats, followed by 236 in Melbourne Airport, 230 in Sydney Airport, 215 in Brisbane Airport, 190 in Adelaide Airport and 91 in Darwin Airport (Table 3.2). Similarly, on intercapital routes, it was 208 in Perth, 191 in Darwin, 173 in Melbourne, 170 in Brisbane, 167 in Hobart and Sydney, 155 in Adelaide and 113 in Canberra. On regional routes, it was 138 in Melbourne, 128 in Brisbane, 116 in Perth, 105 in Sydney, 50 in Adelaide, 40 in Canberra, 25 in Darwin and 8 in Hobart.
The average size of aircraft operating on individual routes takes several years to change as it involves a huge investment and there is a lag in aircraft development. Lacking a long time series of data on average aircraft size by route, long- term growth in average size could not be modelled on historical data for aircraft operating through capital city airports.

• 9 •
Chapter 3 • Data and assumptions
T3.2 Average aircraft size and seat utilisation rate by capital city airport and route
Aircraft size (Passenger capacity per aircraft) Seat utilisation rate (per cent)Airport/route History 2008–09 Forecast 2029–30 History 2008–09 Forecast 2029–30Adelaide
International 190 245 77 77Intercapital 155 201 80 80Regional 50 65 67 67
BrisbaneInternational 215 278 73 73Intercapital 170 220 80 80Regional 128 165 72 72
Canberra*Intercapital 113 146 65 65Regional 40 52 61 61
DarwinInternational 91 118 67 67Intercapital 191 247 79 79Regional 25 32 68 68
Hobart*Intercapital 167 216 80 80Regional 9 12 34 34
MelbourneInternational 236 305 76 76Intercapital 173 224 80 80Regional 138 179 68 68
PerthInternational 246 319 74 74Intercapital 208 269 76 76Regional 116 150 53 53
SydneyInternational 230 298 75 75Intercapital 167 216 80 80Regional 105 136 69 69
* No scheduled international passenger services from Canberra or Hobart.
In this study, the average passenger capacity of aircraft is assumed to increase at the same rate as that in the past, by 2 per cent a year for the first five years of the forecast period and one per cent a year over the remaining of the forecast period. These growth rates will remain the same over all routes: international, intercapital and regional routes.
Following these assumptions, the average number of seats per aircraft operating on international routes from Perth is projected to increase to 319 in 2029–30, to 305 from Melbourne, 298 from Sydney, 278 from Brisbane, 245 from Adelaide and 118 from Darwin (Table 3.2). On intercapital routes, average seat capacity per aircraft is expected to increase to: 269 in Perth; 247 in Darwin; 224 in Melbourne; 220 in Brisbane; 216 in Hobart and Sydney; 201 in Adelaide and 146 in Canberra in 2029–30. On regional routes, it will increase to: 179 in Melbourne; 165 in Brisbane; 150 in Perth; 136 in Sydney; 65 in Adelaide; 52 in Canberra; 32 in Darwin and 12 in Hobart in 2029–30.
• 10 •
BITRE • Report 117
Seat utilisation rate (Load factor)The seat utilisation rate of aircraft passing through capital city airports varies by route (international, intercapital and regional) and airport. The rate is relatively higher on intercapital routes than those on international and regional routes.
In 2008–09, the average seat utilisation rate on intercapital routes was 80 per cent in Adelaide, Brisbane, Hobart, Melbourne and Sydney; 79 per cent in Darwin; 76 per cent in Perth and 65 per cent in Canberra (Table 3.2). Similarly, on international routes, it was 77 per cent in Adelaide; 76 per cent in Melbourne; 75 per cent in Sydney; 74 per cent in Perth; 73 per cent in Brisbane and 67 per cent in Darwin. On regional routes, it was 72 per cent in Brisbane; 69 per cent in Sydney; 68 per cent in Darwin and Melbourne; 67 per cent in Adelaide; 65 per cent in Canberra; 53 per cent in Perth and 34 per cent in Hobart.
In this study, the seat utilisation rates for 2008–09 are assumed to remain unchanged over the entire forecast period. This simple assumption is made due to the fact that long time series of data on seat utilisation rates by route are not available for model-based forecasting purposes.

• 11 •
CHAPTER 4
Forecasts of air passenger and aircraft movements
IntroductionIn this study, forecasts of aircraft movements are developed on the basis of forecasts of passenger movements, aircraft size and seat utilisation rates. Passenger movement forecasts are taken from BITRE Working paper 72 and are updated by including the most recent information on economic growth and air passenger movements, and extending the forecast period from 2025–26 to 2029–30.
As mentioned in BITRE Working paper 72, the passenger movement forecasts are solely driven by demandside parameters. They do not include the influence of supplyside parameters, mainly due to difficulty in estimating them in the absence of long time series data on supplyside variables that influence passenger movements. Hence, the forecasts presented in this study are unconstrained forecasts.
Further, passenger and aircraft movements are expected to be influenced by measures to reduce carbon dioxide emissions. However, given current uncertainty regarding such measures they have not been included in passenger and aircraft movement forecasts.
The passenger and aircraft movement forecasts for the eight capital city airports and their total are presented and discussed in the following sections. The discussion on passenger movements is kept short in this report, as it is discussed in detail in BITRE Working paper 72.
Adelaide Airport
Passenger movementsAdelaide Airport is Australia’s fifth largest airport in terms of total passenger movements. It is located approximately six kilometres west of the Adelaide central business district, and is operated by Adelaide Airport Limited (AAL).
In 2008–09, around 6.8 million air passengers passed through Adelaide Airport. Among them, 80 per cent were travelling on intercapital routes, 13 per cent on regional routes and 7 per cent on international routes. Adelaide–Melbourne, Adelaide–Sydney, Adelaide–Brisbane and Adelaide–Perth are Adelaide’s first, second, third and fourth largest intercapital city routes in terms of passenger movements.
• 12 •
BITRE • Report 117
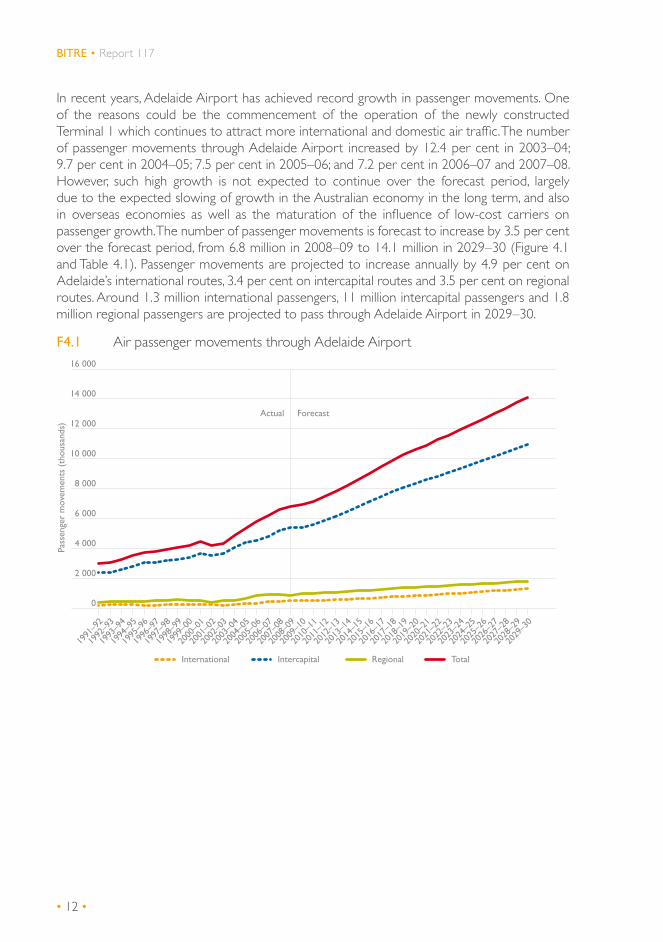
In recent years, Adelaide Airport has achieved record growth in passenger movements. One of the reasons could be the commencement of the operation of the newly constructed Terminal 1 which continues to attract more international and domestic air traffic. The number of passenger movements through Adelaide Airport increased by 12.4 per cent in 2003–04; 9.7 per cent in 2004–05; 7.5 per cent in 2005–06; and 7.2 per cent in 2006–07 and 2007–08. However, such high growth is not expected to continue over the forecast period, largely due to the expected slowing of growth in the Australian economy in the long term, and also in overseas economies as well as the maturation of the influence of low-cost carriers on passenger growth. The number of passenger movements is forecast to increase by 3.5 per cent over the forecast period, from 6.8 million in 2008–09 to 14.1 million in 2029–30 (Figure 4.1 and Table 4.1). Passenger movements are projected to increase annually by 4.9 per cent on Adelaide’s international routes, 3.4 per cent on intercapital routes and 3.5 per cent on regional routes. Around 1.3 million international passengers, 11 million intercapital passengers and 1.8 million regional passengers are projected to pass through Adelaide Airport in 2029–30.
F4.1 Air passenger movements through Adelaide Airport
0
2 000
4 000
6 000
8 000
10 000
12 000
14 000
16 000
2029
–30
2028
–29
2027
–28
2026
–27
2025
–26
2024
–25
2023
–24
2022
–23
2021
–22
2020
–21
2019
–20
2018
–19
2017
–18
2016
–17
2015
–16
2014
–15
2013
–14
2012
–13
2011
–12
2010
–11
2009
–10
2008
–09
2007
–08
2006
–07
2005
–06
2004
–05
2003
–04
2002
–03
2001
–02
2000
–01
1998
–99
1999
–00
1997
–98
1996
–97
1995
–96
1994
–95
1993
–94
1992
–93
1991
–92
International Intercapital Regional Total
Pass
enge
r m
ovem
ents
(th
ousa
nds)
Actual Forecast
• 13 •
Chapter 4 • Forecasts of air passenger and aircraft movements
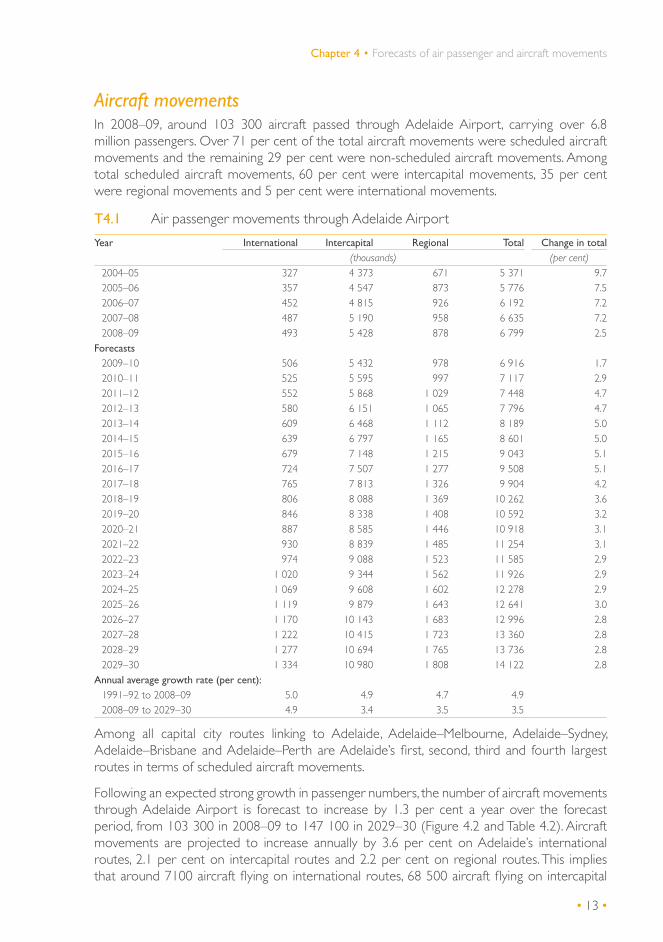
Aircraft movementsIn 2008–09, around 103 300 aircraft passed through Adelaide Airport, carrying over 6.8 million passengers. Over 71 per cent of the total aircraft movements were scheduled aircraft movements and the remaining 29 per cent were non-scheduled aircraft movements. Among total scheduled aircraft movements, 60 per cent were intercapital movements, 35 per cent were regional movements and 5 per cent were international movements.
T4.1 Air passenger movements through Adelaide Airport
Year International Intercapital Regional Total Change in total(thousands) (per cent)
2004–05 327 4 373 671 5 371 9.72005–06 357 4 547 873 5 776 7.52006–07 452 4 815 926 6 192 7.22007–08 487 5 190 958 6 635 7.22008–09 493 5 428 878 6 799 2.5
Forecasts2009–10 506 5 432 978 6 916 1.72010–11 525 5 595 997 7 117 2.92011–12 552 5 868 1 029 7 448 4.72012–13 580 6 151 1 065 7 796 4.72013–14 609 6 468 1 112 8 189 5.02014–15 639 6 797 1 165 8 601 5.02015–16 679 7 148 1 215 9 043 5.12016–17 724 7 507 1 277 9 508 5.12017–18 765 7 813 1 326 9 904 4.22018–19 806 8 088 1 369 10 262 3.62019–20 846 8 338 1 408 10 592 3.22020–21 887 8 585 1 446 10 918 3.12021–22 930 8 839 1 485 11 254 3.12022–23 974 9 088 1 523 11 585 2.92023–24 1 020 9 344 1 562 11 926 2.92024–25 1 069 9 608 1 602 12 278 2.92025–26 1 119 9 879 1 643 12 641 3.02026–27 1 170 10 143 1 683 12 996 2.82027–28 1 222 10 415 1 723 13 360 2.82028–29 1 277 10 694 1 765 13 736 2.82029–30 1 334 10 980 1 808 14 122 2.8
Annual average growth rate (per cent):1991–92 to 2008–09 5.0 4.9 4.7 4.92008–09 to 2029–30 4.9 3.4 3.5 3.5
Among all capital city routes linking to Adelaide, Adelaide–Melbourne, Adelaide–Sydney, Adelaide–Brisbane and Adelaide–Perth are Adelaide’s first, second, third and fourth largest routes in terms of scheduled aircraft movements.
Following an expected strong growth in passenger numbers, the number of aircraft movements through Adelaide Airport is forecast to increase by 1.3 per cent a year over the forecast period, from 103 300 in 2008–09 to 147 100 in 2029–30 (Figure 4.2 and Table 4.2). Aircraft movements are projected to increase annually by 3.6 per cent on Adelaide’s international routes, 2.1 per cent on intercapital routes and 2.2 per cent on regional routes. This implies that around 7100 aircraft flying on international routes, 68 500 aircraft flying on intercapital

• 14 •
BITRE • Report 117
routes and 41 600 aircraft flying on regional routes will pass through Adelaide Airport in 2029–30. Non-scheduled aircraft movements are assumed to remain unchanged over the forecast period.
F4.2 Aircraft movements through Adelaide Airport
Hourly aircraft movementsIn this study, an analysis of hourly aircraft movements at each capital city airport has been carried out, to find out peak hours of movements, as well as the proportion of total daily aircraft movements occurring each hour. The analysis is based on Air Services data on hourly movements of aircraft.
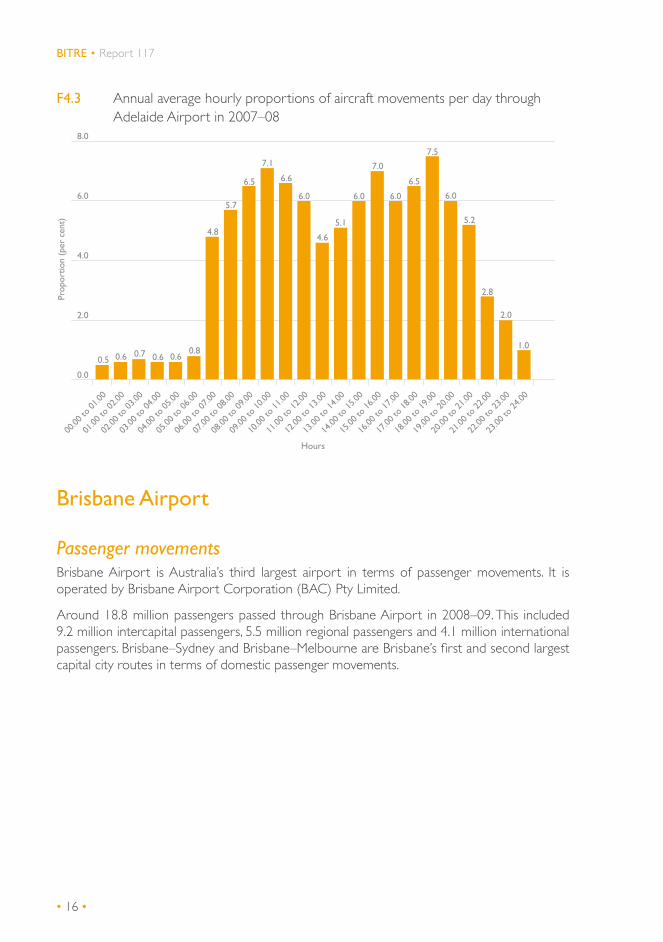
According to the results of the hourly movement analysis, 9.00 am to 10.00 am was the morning peak hour and 6.00 pm to 7.00 pm was the evening peak hour of aircraft movements through Adelaide Airport in 2007–08 (Figure 4.3). On an average day in 2007–08, around 21 aircraft passed through Adelaide airport during the morning peak hour and 22 during the evening peak hour. This implies that the morning and evening peak hour accounted for 7.1 and 7.5 per cent of total daily aircraft movements.
0
20
40
60
80
100
120
140
160
2029
–30
2028
–29
2027
–28
2026
–27
2025
–26
2024
–25
2023
–24
2022
–23
2021
–22
2020
–21
2019
–20
2018
–19
2017
–18
2016
–17
2015
–16
2014
–15
2013
–14
2012
–13
2011
–12
2010
–11
2009
–10
2008
–09
2007
–08
2006
–07
2005
–06
2004
–05
Air
craf
t m
ovem
ents
(th
ousa
nds)
Scheduled international
Scheduled intercapitalScheduled regional
Non-scheduled
Total
Actual Forecast
• 15 •
Chapter 4 • Forecasts of air passenger and aircraft movements
T4.2 Aircraft movements through Adelaide Airport
ScheduledYear International Intercapital Regional Total Non-scheduled Total
(thousands)2004–05 2.2 37.9 30.7 70.8 36.2 107.02005–06 2.5 38.1 29.2 69.7 32.5 102.22006–07 3.0 38.7 29.6 71.3 31.8 103.02007–08 3.2 41.1 29.4 73.7 32.2 105.92008–09 3.4 43.9 26.1 73.4 29.9 103.3
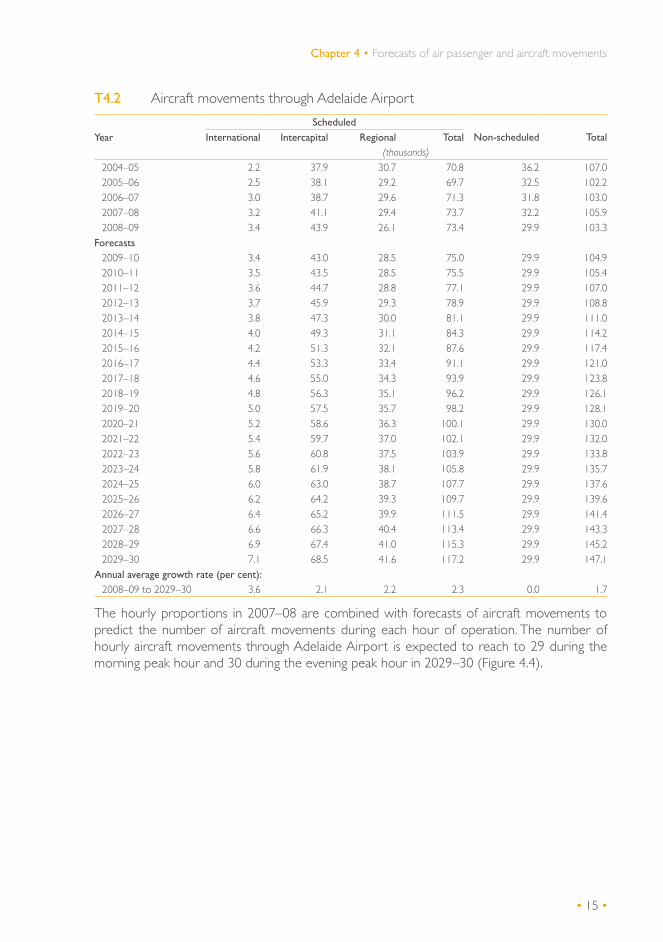
Forecasts2009–10 3.4 43.0 28.5 75.0 29.9 104.92010–11 3.5 43.5 28.5 75.5 29.9 105.42011–12 3.6 44.7 28.8 77.1 29.9 107.02012–13 3.7 45.9 29.3 78.9 29.9 108.82013–14 3.8 47.3 30.0 81.1 29.9 111.02014–15 4.0 49.3 31.1 84.3 29.9 114.22015–16 4.2 51.3 32.1 87.6 29.9 117.42016–17 4.4 53.3 33.4 91.1 29.9 121.02017–18 4.6 55.0 34.3 93.9 29.9 123.82018–19 4.8 56.3 35.1 96.2 29.9 126.12019–20 5.0 57.5 35.7 98.2 29.9 128.12020–21 5.2 58.6 36.3 100.1 29.9 130.02021–22 5.4 59.7 37.0 102.1 29.9 132.02022–23 5.6 60.8 37.5 103.9 29.9 133.82023–24 5.8 61.9 38.1 105.8 29.9 135.72024–25 6.0 63.0 38.7 107.7 29.9 137.62025–26 6.2 64.2 39.3 109.7 29.9 139.62026–27 6.4 65.2 39.9 111.5 29.9 141.42027–28 6.6 66.3 40.4 113.4 29.9 143.32028–29 6.9 67.4 41.0 115.3 29.9 145.22029–30 7.1 68.5 41.6 117.2 29.9 147.1
Annual average growth rate (per cent):2008–09 to 2029–30 3.6 2.1 2.2 2.3 0.0 1.7
The hourly proportions in 2007–08 are combined with forecasts of aircraft movements to predict the number of aircraft movements during each hour of operation. The number of hourly aircraft movements through Adelaide Airport is expected to reach to 29 during the morning peak hour and 30 during the evening peak hour in 2029–30 (Figure 4.4).
• 16 •
BITRE • Report 117
F4.3 Annual average hourly proportions of aircraft movements per day through Adelaide Airport in 2007–08
Brisbane Airport
Passenger movementsBrisbane Airport is Australia’s third largest airport in terms of passenger movements. It is operated by Brisbane Airport Corporation (BAC) Pty Limited.
Around 18.8 million passengers passed through Brisbane Airport in 2008–09. This included 9.2 million intercapital passengers, 5.5 million regional passengers and 4.1 million international passengers. Brisbane–Sydney and Brisbane–Melbourne are Brisbane’s first and second largest capital city routes in terms of domestic passenger movements.
0.0
2.0
4.0
6.0
8.0
23.00
to 24
.00
22.00
to 23
.00
21.00
to 22
.00
20.00
to 21
.00
19.00
to 20
.00
18.00
to 19
.00
17.00
to 18
.00
16.00
to 17
.00
15.00
to 16
.00
14.00
to 15
.00
13.00
to 14
.00
12.00
to 13
.00
11.00
to 12
.00
10.00
to 11
.00
09.00
to 10
.00
08.00
to 09
.00
07.00
to 08
.00
06.00
to 07
.00
05.00
to 06
.00
04.00
to 05
.00
03.00
to 04
.00
02.00
to 03
.00
01.00
to 02
.00
00.00
to 01
.00
0.5 0.6 0.7 0.6 0.60.8
4.8
5.7
6.5
7.1
6.6
6.0
4.6
5.1
6.0
7.0
6.0
6.5
7.5
6.0
5.2
2.8
2.0
1.0
Prop
ortio
n (p
er c
ent)
Hours

• 17 •
Chapter 4 • Forecasts of air passenger and aircraft movements
F4.4 Average number of aircraft movements per hour through Adelaide Airport in 2008–09 and 2029–30
The number of passenger movements through Brisbane Airport has increased by 6.2 per cent a year since 1991–92. This strong growth rate is not expected to continue in the future, mainly due to the expected slowing of growth in the Australian economy in the long term, and also in overseas economies as well as the maturation of the influence of low-cost carriers on passenger growth. The number of passenger movements through Brisbane Airport is forecast to increase by 4.9 per cent a year over the next twenty one years, from 18.8 million in 2008–09 to 51.2 million in 2029–30 (Figure 4.5 and Table 4.3). The number of passenger movements is expected to increase annually by 6 per cent on Brisbane’s international routes, 4.8 per cent on intercapital routes and 4 per cent on regional routes. Around 13.8 million international passengers, 24.8 million intercapital passengers and 12.6 million regional passengers are forecast to pass through Brisbane Airport in 2029–30.
0
5
10
15
20
25
30
35
23.00
to 24
.00
22.00
to 23
.00
21.00
to 22
.00
20.00
to 21
.00
19.00
to 20
.00
18.00
to 19
.00
17.00
to 18
.00
16.00
to 17
.00
15.00
to 16
.00
14.00
to 15
.00
13.00
to 14
.00
12.00
to 13
.00
11.00
to 12
.00
10.00
to 11
.00
09.00
to 10
.00
08.00
to 09
.00
07.00
to 08
.00
06.00
to 07
.00
05.00
to 06
.00
04.00
to 05
.00
03.00
to 04
.00
02.00
to 03
.00
01.00
to 02
.00
00.00
to 01
.00
Hours
2008–09 2029–30
Num
ber
of m
ovem
ents

• 18 •
BITRE • Report 117
F4.5 Air passenger movements through Brisbane Airport
Aircraft movementsA total of 183 700 aircraft passed through Brisbane Airport in 2008–09. Scheduled and non-scheduled aircraft movements accounted for 84 and 16 per cent of the total aircraft movements respectively. Of the total scheduled aircraft movements, 44 per cent were intercapital movements, 39 per cent were regional movements and 17 per cent were international movements.
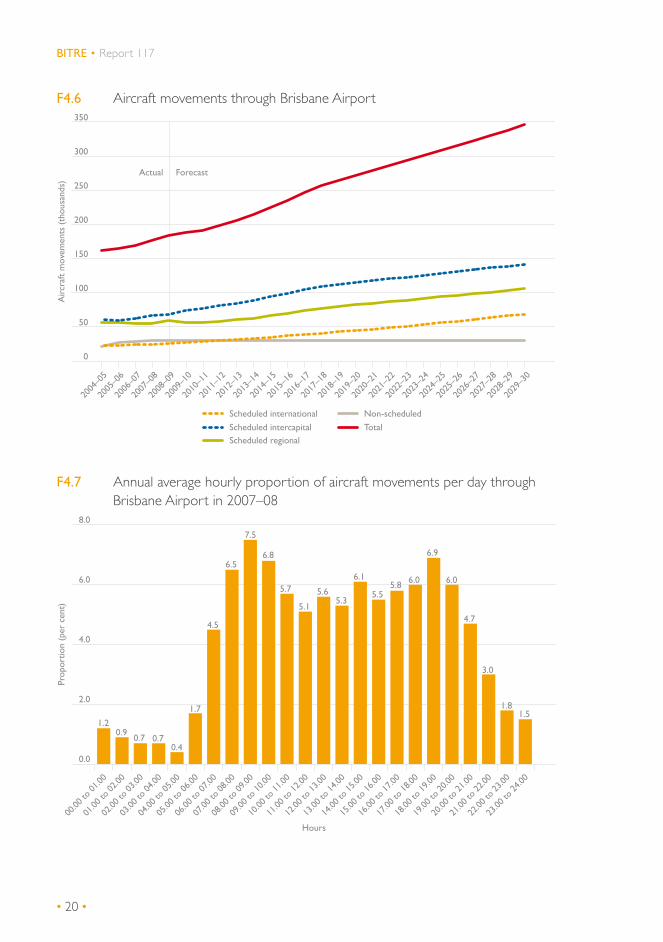
As a result of an expected strong growth in passenger numbers, the number of aircraft movements through Brisbane Airport is forecast to increase by 3.1 per cent a year over the forecast period to 346 100 in 2029–30 (Figure 4.6 and Table 4.4). It is expected to increase annually by 4.7 per cent on Brisbane’s international routes, 3.6 per cent on intercapital routes and 2.8 per cent on regional routes. In 2029–30, around 68 800 aircraft movements will be on international routes, 141 800 on intercapital routes and 105 800 aircraft on regional routes. Non-scheduled aircraft movements are assumed to remain unchanged over the forecast period.
2029
–30
2028
–29
2027
–28
2026
–27
2025
–26
2024
–25
2023
–24
2022
–23
2021
–22
2020
–21
2019
–20
2018
–19
2017
–18
2016
–17
2015
–16
2014
–15
2013
–14
2012
–13
2011
–12
2010
–11
2009
–10
2008
–09
2007
–08
2006
–07
2005
–06
2004
–05
2003
–04
2002
–03
2001
–02
2000
–01
1998
–99
1999
–00
1997
–98
1996
–97
1995
–96
1994
–95
1993
–94
1992
–93
1991
–92
International Intercapital Regional Total
Pass
enge
r m
ovem
ents
(th
ousa
nds) Actual Forecast
0
10 000
20 000
30 000
40 000
50 000
60 000
• 19 •
Chapter 4 • Forecasts of air passenger and aircraft movements
T4.3 Air passenger movements through Brisbane Airport
Year International Intercapital Regional Total Change in total(thousands) (per cent)
2004–05 3 592 7 846 4 028 15 466 11.62005–06 3 753 7 961 4 408 16 122 4.22006–07 3 976 8 580 4 914 17 470 8.42007–08 4 069 9 148 5 165 18 382 5.22008–09 4 104 9 175 5 480 18 760 2.1
Forecasts2009–10 4 351 10 248 5 301 19 901 6.12010–11 4 608 10 718 5 443 20 769 4.42011–12 4 927 11 540 5 685 22 153 6.72012–13 5 270 12 391 5 976 23 637 6.72013–14 5 646 13 236 6 357 25 238 6.82014–15 6 039 14 105 6 792 26 936 6.72015–16 6 439 15 070 7 209 28 719 6.62016–17 6 873 16 016 7 731 30 620 6.62017–18 7 301 16 817 8 150 32 268 5.42018–19 7 736 17 523 8 524 33 783 4.72019–20 8 182 18 153 8 865 35 200 4.22020–21 8 638 18 770 9 202 36 610 4.02021–22 9 120 19 408 9 552 38 080 4.02022–23 9 623 20 029 9 896 39 548 3.92023–24 10 154 20 669 10 252 41 076 3.92024–25 10 715 21 330 10 621 42 667 3.92025–26 11 307 22 012 11 004 44 323 3.92026–27 11 894 22 672 11 378 45 944 3.72027–28 12 512 23 351 11 765 47 629 3.72028–29 13 163 24 051 12 165 49 379 3.72029–30 13 848 24 771 12 578 51 197 3.7
Annual average growth rate (per cent): 1991–92 to 2008–09 6.7 5.8 6.6 6.22008–09 to 2029–30 6.0 4.8 4.0 4.9
Hourly aircraft movementsHourly aircraft movement data for 2007–08 suggest that 8.00 am to 9.00 am is the morning peak hour and 6.00 pm to 7.00 pm is the evening peak hour of aircraft movements at Brisbane Airport (Figure 4.7). On an average, around 36 aircraft passed through Brisbane Airport during the morning peak hour and 33 during the evening peak hour. In other words, the morning and evening peak hour accounted for 7.5 and 6.9 per cent of total daily aircraft movements. The number of hourly aircraft movements is forecast to increase to 71 and 66 during the morning and the evening peak hours of operation respectively in 2029–30 (Figure 4.8).
• 20 •
BITRE • Report 117
F4.6 Aircraft movements through Brisbane Airport
F4.7 Annual average hourly proportion of aircraft movements per day through Brisbane Airport in 2007–08
2029
–30
2028
–29
2027
–28
2026
–27
2025
–26
2024
–25
2023
–24
2022
–23
2021
–22
2020
–21
2019
–20
2018
–19
2017
–18
2016
–17
2015
–16
2014
–15
2013
–14
2012
–13
2011
–12
2010
–11
2009
–10
2008
–09
2007
–08
2006
–07
2005
–06
2004
–05
Air
craf
t m
ovem
ents
(th
ousa
nds)
Scheduled international
Scheduled intercapitalScheduled regional
Non-scheduled
Total
Actual Forecast
0
50
100
150
200
250
300
350
0.0
2.0
4.0
6.0
8.0
23.00
to 24
.00
22.00
to 23
.00
21.00
to 22
.00
20.00
to 21
.00
19.00
to 20
.00
18.00
to 19
.00
17.00
to 18
.00
16.00
to 17
.00
15.00
to 16
.00
14.00
to 15
.00
13.00
to 14
.00
12.00
to 13
.00
11.00
to 12
.00
10.00
to 11
.00
09.00
to 10
.00
08.00
to 09
.00
07.00
to 08
.00
06.00
to 07
.00
05.00
to 06
.00
04.00
to 05
.00
03.00
to 04
.00
02.00
to 03
.00
01.00
to 02
.00
00.00
to 01
.00
Prop
ortio
n (p
er c
ent)
1.20.9
0.7 0.70.4
1.7
4.5
6.5
7.5
6.8
5.7
5.1
5.65.3
6.1
5.55.8 6.0
6.9
6.0
4.7
3.0
1.81.5
Hours
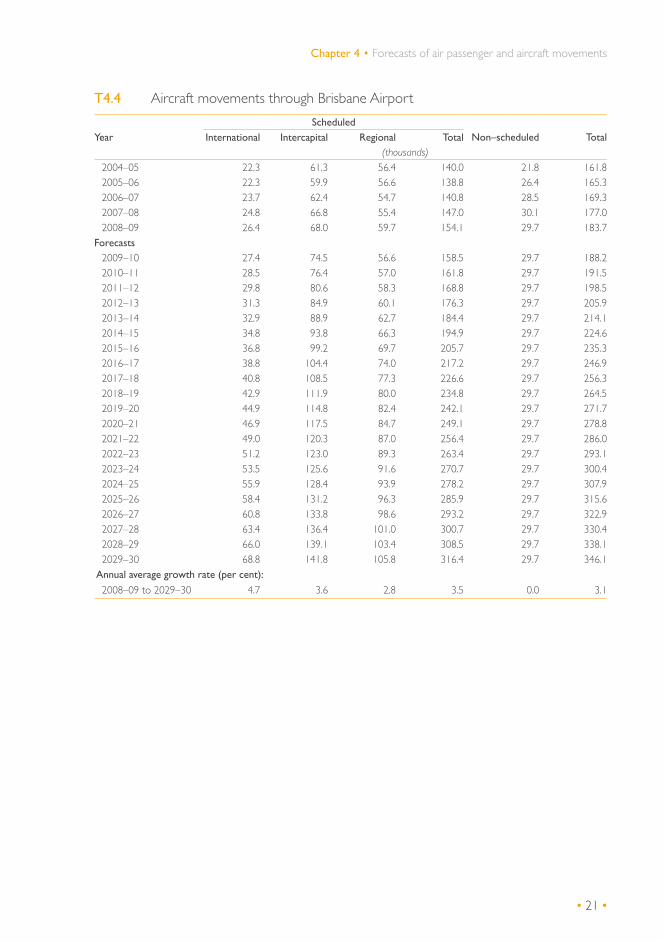
• 21 •
Chapter 4 • Forecasts of air passenger and aircraft movements
T4.4 Aircraft movements through Brisbane Airport
ScheduledYear International Intercapital Regional Total Non–scheduled Total
(thousands)2004–05 22.3 61.3 56.4 140.0 21.8 161.82005–06 22.3 59.9 56.6 138.8 26.4 165.32006–07 23.7 62.4 54.7 140.8 28.5 169.32007–08 24.8 66.8 55.4 147.0 30.1 177.02008–09 26.4 68.0 59.7 154.1 29.7 183.7
Forecasts2009–10 27.4 74.5 56.6 158.5 29.7 188.22010–11 28.5 76.4 57.0 161.8 29.7 191.52011–12 29.8 80.6 58.3 168.8 29.7 198.52012–13 31.3 84.9 60.1 176.3 29.7 205.92013–14 32.9 88.9 62.7 184.4 29.7 214.12014–15 34.8 93.8 66.3 194.9 29.7 224.62015–16 36.8 99.2 69.7 205.7 29.7 235.32016–17 38.8 104.4 74.0 217.2 29.7 246.92017–18 40.8 108.5 77.3 226.6 29.7 256.32018–19 42.9 111.9 80.0 234.8 29.7 264.52019–20 44.9 114.8 82.4 242.1 29.7 271.72020–21 46.9 117.5 84.7 249.1 29.7 278.82021–22 49.0 120.3 87.0 256.4 29.7 286.02022–23 51.2 123.0 89.3 263.4 29.7 293.12023–24 53.5 125.6 91.6 270.7 29.7 300.42024–25 55.9 128.4 93.9 278.2 29.7 307.92025–26 58.4 131.2 96.3 285.9 29.7 315.62026–27 60.8 133.8 98.6 293.2 29.7 322.92027–28 63.4 136.4 101.0 300.7 29.7 330.42028–29 66.0 139.1 103.4 308.5 29.7 338.12029–30 68.8 141.8 105.8 316.4 29.7 346.1
Annual average growth rate (per cent):
2008–09 to 2029–30 4.7 3.6 2.8 3.5 0.0 3.1
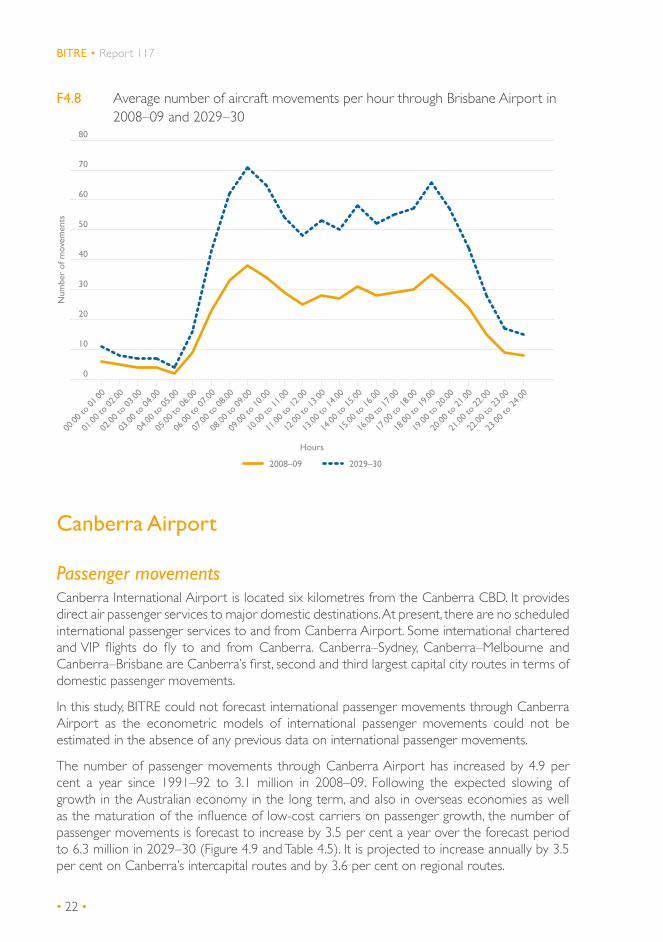
• 22 •
BITRE • Report 117
F4.8 Average number of aircraft movements per hour through Brisbane Airport in 2008–09 and 2029–30
Canberra Airport
Passenger movementsCanberra International Airport is located six kilometres from the Canberra CBD. It provides direct air passenger services to major domestic destinations. At present, there are no scheduled international passenger services to and from Canberra Airport. Some international chartered and VIP flights do fly to and from Canberra. Canberra–Sydney, Canberra–Melbourne and Canberra–Brisbane are Canberra’s first, second and third largest capital city routes in terms of domestic passenger movements.
In this study, BITRE could not forecast international passenger movements through Canberra Airport as the econometric models of international passenger movements could not be estimated in the absence of any previous data on international passenger movements.
The number of passenger movements through Canberra Airport has increased by 4.9 per cent a year since 1991–92 to 3.1 million in 2008–09. Following the expected slowing of growth in the Australian economy in the long term, and also in overseas economies as well as the maturation of the influence of low-cost carriers on passenger growth, the number of passenger movements is forecast to increase by 3.5 per cent a year over the forecast period to 6.3 million in 2029–30 (Figure 4.9 and Table 4.5). It is projected to increase annually by 3.5 per cent on Canberra’s intercapital routes and by 3.6 per cent on regional routes.
0
10
20
30
40
50
60
70
80
23.00
to 24
.00
22.00
to 23
.00
21.00
to 22
.00
20.00
to 21
.00
19.00
to 20
.00
18.00
to 19
.00
17.00
to 18
.00
16.00
to 17
.00
15.00
to 16
.00
14.00
to 15
.00
13.00
to 14
.00
12.00
to 13
.00
11.00
to 12
.00
10.00
to 11
.00
09.00
to 10
.00
08.00
to 09
.00
07.00
to 08
.00
06.00
to 07
.00
05.00
to 06
.00
04.00
to 05
.00
03.00
to 04
.00
02.00
to 03
.00
01.00
to 02
.00
00.00
to 01
.00
Hours
2008–09 2029–30
Num
ber
of m
ovem
ents
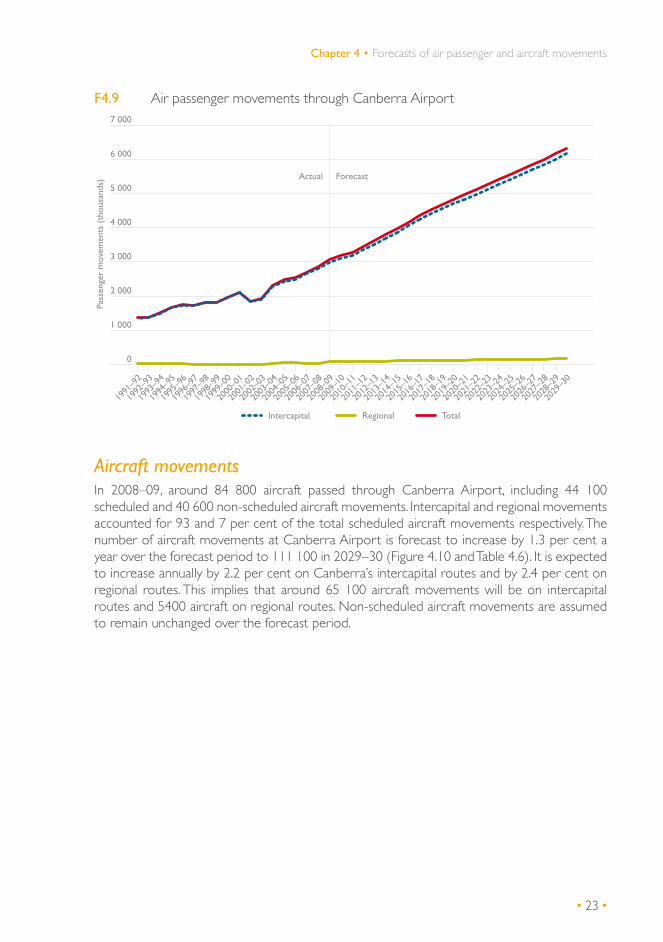
• 23 •
Chapter 4 • Forecasts of air passenger and aircraft movements
F4.9 Air passenger movements through Canberra Airport
Aircraft movementsIn 2008–09, around 84 800 aircraft passed through Canberra Airport, including 44 100 scheduled and 40 600 non-scheduled aircraft movements. Intercapital and regional movements accounted for 93 and 7 per cent of the total scheduled aircraft movements respectively. The number of aircraft movements at Canberra Airport is forecast to increase by 1.3 per cent a year over the forecast period to 111 100 in 2029–30 (Figure 4.10 and Table 4.6). It is expected to increase annually by 2.2 per cent on Canberra’s intercapital routes and by 2.4 per cent on regional routes. This implies that around 65 100 aircraft movements will be on intercapital routes and 5400 aircraft on regional routes. Non-scheduled aircraft movements are assumed to remain unchanged over the forecast period.
2029
–30
2028
–29
2027
–28
2026
–27
2025
–26
2024
–25
2023
–24
2022
–23
2021
–22
2020
–21
2019
–20
2018
–19
2017
–18
2016
–17
2015
–16
2014
–15
2013
–14
2012
–13
2011
–12
2010
–11
2009
–10
2008
–09
2007
–08
2006
–07
2005
–06
2004
–05
2003
–04
2002
–03
2001
–02
2000
–01
1998
–99
1999
–00
1997
–98
1996
–97
1995
–96
1994
–95
1993
–94
1992
–93
1991
–92
Intercapital Regional Total
Pass
enge
r m
ovem
ents
(th
ousa
nds)
Actual Forecast
0
1 000
2 000
3 000
4 000
5 000
6 000
7 000

• 24 •
BITRE • Report 117
T4.5 Air passenger movements through Canberra Airport
Year International Intercapital Regional Total Change in total(thousands) (per cent)
2004–05 2 421 56 2 479 7.62005–06 2 496 54 2 551 2.92006–07 2 661 27 2 688 5.42007–08 2 811 43 2 854 6.22008–09 2 982 80 3 063 7.3
Forecasts2009–10 3 100 87 3 188 4.12010–11 3 199 89 3 289 3.22011–12 3 354 92 3 447 4.82012–13 3 516 96 3 613 4.82013–14 3 687 100 3 787 4.82014–15 3 865 105 3 971 4.82015–16 4 052 110 4 163 4.82016–17 4 248 115 4 364 4.82017–18 4 414 120 4 535 3.92018–19 4 564 124 4 689 3.42019–20 4 702 128 4 830 3.02020–21 4 837 132 4 970 2.92021–22 4 977 136 5 113 2.92022–23 5 114 140 5 254 2.82023–24 5 255 144 5 399 2.82024–25 5 399 148 5 548 2.82025–26 5 548 152 5 701 2.82026–27 5 694 157 5 851 2.62027–28 5 843 161 6 004 2.62028–29 5 996 165 6 162 2.62029–30 6 154 170 6 324 2.6
Annual average growth rate (per cent): 1991–92 to 2008–09 4.8 10.1 4.92008–09 to 2029–30 3.5 3.6 3.5

• 25 •
Chapter 4 • Forecasts of air passenger and aircraft movements
F4.10 Aircraft movements through Canberra Airport
Hourly aircraft movementsAccording to hourly aircraft movement data for 2007–08, there are two distinctive peak hours at Canberra Airport: 9.00 am to 10.00 am in the morning and 5.00 pm to 6.00 pm in the evening (Figure 4.11). The morning and evening peak hours accounted for 6.8 and 8.7 per cent of total daily aircraft movements. Around 16 aircraft passed through Canberra Airport during the morning peak hour and 21 during the evening peak hour. These hourly movement numbers are forecast to increase to 21 and 26 during the morning and the evening peak hours of operation respectively in 2029–30 (Figure 4.12).
Darwin Airport
Passenger movementsDarwin International Airport is located 13 kilometres from the Darwin CBD and provides facilities for airlines to move international, domestic and regional passengers and freight.
Around 1.7 million passengers passed through Darwin Airport in 2008–09. Among them, 19 per cent were international passengers, 72 per cent were intercapital passengers and 9 per cent were regional passengers. Darwin–Brisbane, Darwin–Adelaide and Darwin–Melbourne are Darwin’s first, second and third largest capital city routes in terms of domestic passenger movements.
0
20
40
60
80
100
120
2029
–30
2028
–29
2027
–28
2026
–27
2025
–26
2024
–25
2023
–24
2022
–23
2021
–22
2020
–21
2019
–20
2018
–19
2017
–18
2016
–17
2015
–16
2014
–15
2013
–14
2012
–13
2011
–12
2010
–11
2009
–10
2008
–09
2007
–08
2006
–07
2005
–06
2004
–05
Scheduled intercapitalScheduled regional
Non-scheduled
Total
Air
craf
t m
ovem
ents
(th
ousa
nds)
Actual Forecast

• 26 •
BITRE • Report 117
T4.6 Aircraft movements through Canberra Airport
ScheduledYear Intercapital Regional Total Non–scheduled Total
(thousands)2004–05 35.8 2.7 38.5 37.9 76.52005–06 33.9 3.1 37.0 44.7 81.72006–07 34.1 2.8 36.9 41.6 78.52007–08 36.6 3.0 39.6 48.9 88.62008–09 40.8 3.3 44.1 40.6 84.8
Forecasts2009–10 41.6 3.5 45.1 40.6 85.82010–11 42.1 3.5 45.6 40.6 86.32011–12 43.3 3.6 46.8 40.6 87.52012–13 44.5 3.6 48.1 40.6 88.72013–14 45.7 3.7 49.5 40.6 90.12014–15 47.5 3.9 51.3 40.6 92.02015–16 49.3 4.0 53.3 40.6 93.92016–17 51.1 4.2 55.3 40.6 95.92017–18 52.6 4.3 56.9 40.6 97.52018–19 53.9 4.4 58.3 40.6 98.92019–20 54.9 4.5 59.4 40.6 100.12020–21 56.0 4.6 60.5 40.6 101.22021–22 57.0 4.7 61.7 40.6 102.32022–23 58.0 4.8 62.7 40.6 103.42023–24 59.0 4.8 63.8 40.6 104.52024–25 60.0 4.9 65.0 40.6 105.62025–26 61.1 5.0 66.1 40.6 106.72026–27 62.1 5.1 67.2 40.6 107.82027–28 63.1 5.2 68.2 40.6 108.92028–29 64.1 5.3 69.4 40.6 110.02029–30 65.1 5.4 70.5 40.6 111.1
Annual average growth rate (per cent): 2008–09 to 2029–30 2.2 2.4 2.3 0.0 1.3

• 27 •
Chapter 4 • Forecasts of air passenger and aircraft movements
F4.11 Annual average hourly proportion of aircraft movements per day through Canberra Airport in 2007–08
F4.12 Average number of aircraft movements per hour through Canberra Airport in 2008–09 and 2029–30
23.00
to 24
.00
22.00
to 23
.00
21.00
to 22
.00
20.00
to 21
.00
19.00
to 20
.00
18.00
to 19
.00
17.00
to 18
.00
16.00
to 17
.00
15.00
to 16
.00
14.00
to 15
.00
13.00
to 14
.00
12.00
to 13
.00
11.00
to 12
.00
10.00
to 11
.00
09.00
to 10
.00
08.00
to 09
.00
07.00
to 08
.00
06.00
to 07
.00
05.00
to 06
.00
04.00
to 05
.00
03.00
to 04
.00
02.00
to 03
.00
01.00
to 02
.00
00.00
to 01
.00
Prop
ortio
n (p
er c
ent)
Hours
0.0
2.0
4.0
6.0
8.0
10.0
0.7 0.9
0.3 0.1 0.2 0.3
4.2 4.2
6.0
6.86.5
6.16.4
5.45.8
6.6
7.5
8.7
7.3
5.6
4.5
3.6
1.6
0.9
23.00
to 24
.00
22.00
to 23
.00
21.00
to 22
.00
20.00
to 21
.00
19.00
to 20
.00
18.00
to 19
.00
17.00
to 18
.00
16.00
to 17
.00
15.00
to 16
.00
14.00
to 15
.00
13.00
to 14
.00
12.00
to 13
.00
11.00
to 12
.00
10.00
to 11
.00
09.00
to 10
.00
08.00
to 09
.00
07.00
to 08
.00
06.00
to 07
.00
05.00
to 06
.00
04.00
to 05
.00
03.00
to 04
.00
02.00
to 03
.00
01.00
to 02
.00
00.00
to 01
.00
Hours
2008–09 2029–30
Num
ber
of m
ovem
ents
0
5
10
15
20
25
30
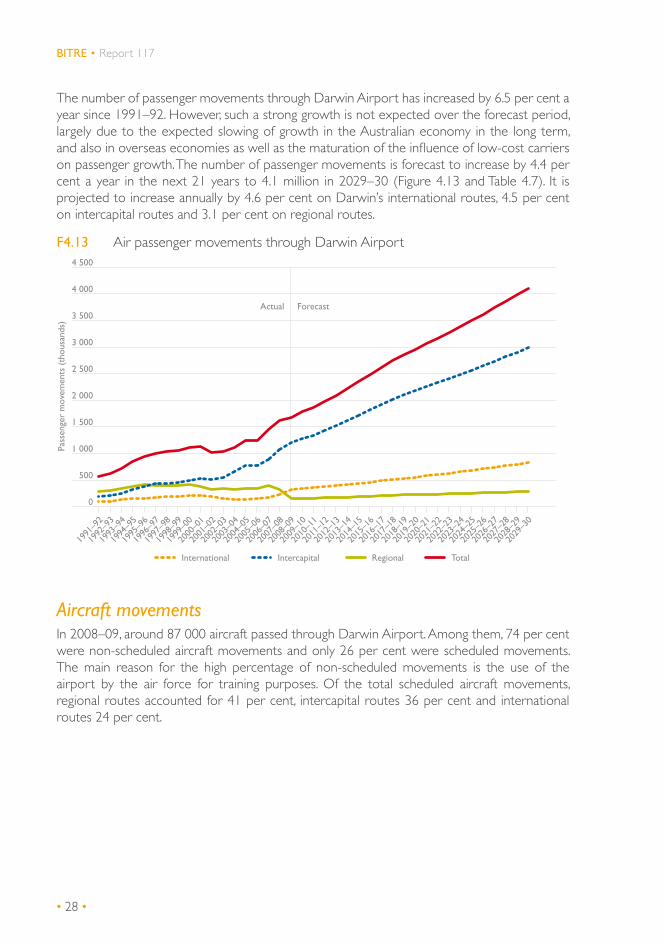
• 28 •
BITRE • Report 117
The number of passenger movements through Darwin Airport has increased by 6.5 per cent a year since 1991–92. However, such a strong growth is not expected over the forecast period, largely due to the expected slowing of growth in the Australian economy in the long term, and also in overseas economies as well as the maturation of the influence of low-cost carriers on passenger growth. The number of passenger movements is forecast to increase by 4.4 per cent a year in the next 21 years to 4.1 million in 2029–30 (Figure 4.13 and Table 4.7). It is projected to increase annually by 4.6 per cent on Darwin’s international routes, 4.5 per cent on intercapital routes and 3.1 per cent on regional routes.
F4.13 Air passenger movements through Darwin Airport
Aircraft movementsIn 2008–09, around 87 000 aircraft passed through Darwin Airport. Among them, 74 per cent were non-scheduled aircraft movements and only 26 per cent were scheduled movements. The main reason for the high percentage of non-scheduled movements is the use of the airport by the air force for training purposes. Of the total scheduled aircraft movements, regional routes accounted for 41 per cent, intercapital routes 36 per cent and international routes 24 per cent.
2029
–30
2028
–29
2027
–28
2026
–27
2025
–26
2024
–25
2023
–24
2022
–23
2021
–22
2020
–21
2019
–20
2018
–19
2017
–18
2016
–17
2015
–16
2014
–15
2013
–14
2012
–13
2011
–12
2010
–11
2009
–10
2008
–09
2007
–08
2006
–07
2005
–06
2004
–05
2003
–04
2002
–03
2001
–02
2000
–01
1998
–99
1999
–00
1997
–98
1996
–97
1995
–96
1994
–95
1993
–94
1992
–93
1991
–92
International Intercapital Regional Total
Pass
enge
r m
ovem
ents
(th
ousa
nds)
Actual Forecast
0
500
1 000
1 500
2 000
2 500
3 000
3 500
4 000
4 500

• 29 •
Chapter 4 • Forecasts of air passenger and aircraft movements
T4.7 Air passenger movements through Darwin Airport
Year International Intercapital Regional Total Change in total(thousands) (per cent)
2004–05 142 765 343 1 249 11.82005–06 144 764 339 1 247 –0.22006–07 173 881 388 1 443 15.72007–08 227 1 068 321 1 616 12.02008–09 320 1 200 151 1 671 3.4
Forecasts2009–10 349 1 284 155 1 788 7.02010–11 365 1 339 158 1 862 4.12011–12 382 1 428 163 1 973 6.02012–13 400 1 523 169 2 092 6.02013–14 420 1 619 176 2 215 5.92014–15 440 1 718 185 2 344 5.82015–16 463 1 823 194 2 480 5.82016–17 487 1 929 204 2 620 5.72017–18 509 2 021 212 2 742 4.62018–19 532 2 104 219 2 854 4.12019–20 554 2 179 225 2 959 3.72020–21 578 2 254 231 3 063 3.52021–22 602 2 332 237 3 170 3.52022–23 627 2 408 242 3 277 3.42023–24 653 2 486 248 3 388 3.42024–25 681 2 568 254 3 503 3.42025–26 709 2 651 261 3 621 3.42026–27 737 2 734 267 3 738 3.22027–28 767 2 818 273 3 858 3.22028–29 798 2 905 279 3 982 3.22029–30 830 2 995 285 4 110 3.2
Annual average growth rate (per cent): 1991–92 to 2008–09 7.3 11.5 –3.7 6.52008–09 to 2029–30 4.6 4.5 3.1 4.4
Following an expected positive growth in passenger movement numbers, the number of aircraft movements through Darwin Airport is forecast to increase by 0.8 per cent a year over the forecast period to 103 800 in 2029–30, including 39 000 scheduled movements and 64 800 non-scheduled movements (Figure 4.14 and Table 4.8). The number of scheduled aircraft movements is projected to increase by 2.7 per cent a year to 39 000 in 2029–30. It will increase annually by 3.4 per cent on Darwin’s international routes, 3.2 per cent on intercapital routes and 1.8 per cent on regional routes. Non-scheduled aircraft movements are assumed to remain unchanged over the forecast period.

• 30 •
BITRE • Report 117
F4.14 Aircraft movements through Darwin Airport
Hourly aircraft movementsAccording to hourly aircraft movement data, there are four peak hours of aircraft operation at Darwin Airport. The first peak hour is between 1.00 am to 2.00 am, the second between 6.00 am to 7.00 am, the third between 1.00 pm to 2.00 pm and the fourth between 6.00 pm to 7.00 pm (Figure 4.15). In 2006–07, the first, second, third and fourth peak hours accounted for 7.1, 6.6, 10.2 and 5.4 per cent of the total daily aircraft movements. Around 17 aircraft passed during the first peak hour, 16 during the second peak hour, 25 during the third peak period and 13 during the fourth peak hour. These hourly aircraft movements are forecast to increase to 20 during the first peak hour, 19 during the second peak hour, 29 during the third peak period and 15 during the fourth peak hour in 2029–30 (Figure 4.16).
2029
–30
2028
–29
2027
–28
2026
–27
2025
–26
2024
–25
2023
–24
2022
–23
2021
–22
2020
–21
2019
–20
2018
–19
2017
–18
2016
–17
2015
–16
2014
–15
2013
–14
2012
–13
2011
–12
2010
–11
2009
–10
2008
–09
2007
–08
2006
–07
2005
–06
2004
–05
Air
craf
t m
ovem
ents
(th
ousa
nds)
Scheduled international
Scheduled intercapitalScheduled regional
Non-scheduled
Total
Actual Forecast
0
20
40
60
80
100
120

• 31 •
Chapter 4 • Forecasts of air passenger and aircraft movements
T4.8 Aircraft movements through Darwin Airport
ScheduledYear International Intercapital Regional Total Non–scheduled Total
(thousands)2004–05 2.0 6.1 8.4 16.5 62.3 78.82005–06 2.3 5.3 8.2 15.9 63.4 79.32006–07 3.0 5.8 8.4 17.1 70.5 87.62007–08 3.4 6.9 8.0 18.4 71.4 89.82008–09 5.2 8.0 9.0 22.2 64.8 87.0
Forecasts2009–10 5.6 8.4 9.1 23.0 64.8 87.92010–11 5.7 8.6 9.1 23.3 64.8 88.22011–12 5.9 9.0 9.2 24.0 64.8 88.82012–13 6.0 9.4 9.3 24.7 64.8 89.52013–14 6.2 9.8 9.5 25.5 64.8 90.32014–15 6.4 10.3 9.9 26.6 64.8 91.52015–16 6.7 10.8 10.3 27.7 64.8 92.62016–17 7.0 11.3 10.7 29.0 64.8 93.82017–18 7.2 11.7 11.0 30.0 64.8 94.82018–19 7.5 12.1 11.3 30.8 64.8 95.62019–20 7.7 12.4 11.5 31.6 64.8 96.42020–21 8.0 12.7 11.6 32.3 64.8 97.12021–22 8.2 13.0 11.8 33.0 64.8 97.92022–23 8.5 13.3 12.0 33.7 64.8 98.62023–24 8.7 13.6 12.2 34.5 64.8 99.32024–25 9.0 13.9 12.3 35.2 64.8 100.12025–26 9.3 14.2 12.5 36.0 64.8 100.82026–27 9.6 14.5 12.7 36.7 64.8 101.62027–28 9.9 14.8 12.8 37.5 64.8 102.32028–29 10.1 15.1 13.0 38.2 64.8 103.12029–30 10.4 15.4 13.2 39.0 64.8 103.8
Annual average growth rate (per cent):2008–09 to 2029–30 3.4 3.2 1.8 2.7 0.0 0.8

• 32 •
BITRE • Report 117
F4.15 Annual average hourly proportion of aircraft movements per day through Darwin Airport in 2006–07
F4.16 Average number of aircraft movements per hour through Darwin Airport in 2007–08 and 2029–30
23.00
to 24
.00
22.00
to 23
.00
21.00
to 22
.00
20.00
to 21
.00
19.00
to 20
.00
18.00
to 19
.00
17.00
to 18
.00
16.00
to 17
.00
15.00
to 16
.00
14.00
to 15
.00
13.00
to 14
.00
12.00
to 13
.00
11.00
to 12
.00
10.00
to 11
.00
09.00
to 10
.00
08.00
to 09
.00
07.00
to 08
.00
06.00
to 07
.00
05.00
to 06
.00
04.00
to 05
.00
03.00
to 04
.00
02.00
to 03
.00
01.00
to 02
.00
00.00
to 01
.00
Prop
ortio
n (p
er c
ent)
Hours
0.0
2.0
4.0
6.0
8.0
10.0
12.0
6.9
5.5
6.6
2.72.1
0.60.9
7.1
1.3
4.9
2.1
3.6
7.5
10.2
6.2
4.7
3.1 3.0
5.4
3.7
1.5
3.43.9
3.3
23.00
to 24
.00
22.00
to 23
.00
21.00
to 22
.00
20.00
to 21
.00
19.00
to 20
.00
18.00
to 19
.00
17.00
to 18
.00
16.00
to 17
.00
15.00
to 16
.00
14.00
to 15
.00
13.00
to 14
.00
12.00
to 13
.00
11.00
to 12
.00
10.00
to 11
.00
09.00
to 10
.00
08.00
to 09
.00
07.00
to 08
.00
06.00
to 07
.00
05.00
to 06
.00
04.00
to 05
.00
03.00
to 04
.00
02.00
to 03
.00
01.00
to 02
.00
00.00
to 01
.00
Hours
2008–09 2029–30
Num
ber
of m
ovem
ents
0
5
10
15
20
25
30
35

• 33 •
Chapter 4 • Forecasts of air passenger and aircraft movements
Hobart Airport
Passenger movementsHobart Airport is located 17 kilometres from Hobart city. It is the major airport in Tasmania for air passenger services. Around 1.9 million passengers travelled through Hobart Airport in 2008–09, mainly on domestic intercapital routes which currently account for 99.9 per cent of total passenger movements through Hobart Airport. Presently, there are no scheduled international passenger services at Hobart Airport. The Hobart–Melbourne and Hobart–Sydney routes are the first and second largest routes of Hobart in terms of passenger movements.
The number of passenger movements through Hobart Airport has increased by an average of 6.1 per cent a year since 1991–92, largely due to the introduction of low-cost carriers in 2002–03. This high growth is not expected to continue over the next 21 years, mainly due to the expected slowing of growth in the Australian economy in the long term, and also in overseas economies as well as the maturation of the influence of low-cost carriers on passenger growth. The number of domestic passenger movements is forecast to increase by 3.5 per cent a year over the forecast period to 3.9 million in 2029–30 (Figure 4.17 and Table 4.9).
F4.17 Air passenger movements through Hobart Airport
2029
–30
2028
–29
2027
–28
2026
–27
2025
–26
2024
–25
2023
–24
2022
–23
2021
–22
2020
–21
2019
–20
2018
–19
2017
–18
2016
–17
2015
–16
2014
–15
2013
–14
2012
–13
2011
–12
2010
–11
2009
–10
2008
–09
2007
–08
2006
–07
2005
–06
2004
–05
2003
–04
2002
–03
2001
–02
2000
–01
1998
–99
1999
–00
1997
–98
1996
–97
1995
–96
1994
–95
1993
–94
1992
–93
1991
–92
Intercapital Regional Total
Pass
enge
r m
ovem
ents
(th
ousa
nds)
Actual Forecast
0
500
1 000
1 500
2 000
2 500
3 000
3 500
4 000
4 500

• 34 •
BITRE • Report 117
T4.9 Air passenger movements through Hobart Airport
Year International Intercapital Regional Total Change in total(thousands) (per cent)
2004–05 1 521 2 1 523 24.12005–06 1 604 2 1 606 5.52006–07 1 628 1 1 630 1.52007–08 1 757 2 1 758 7.92008–09 1 868 1 1 869 6.3
Forecasts2009–10 1 909 1 1 911 2.22010–11 1 971 1 1 972 3.22011–12 2 067 1 2 068 4.92012–13 2 168 1 2 169 4.92013–14 2 274 1 2 275 4.92014–15 2 385 1 2 386 4.92015–16 2 501 1 2 502 4.92016–17 2 626 1 2 627 5.02017–18 2 732 1 2 733 4.12018–19 2 828 1 2 830 3.52019–20 2 917 1 2 919 3.12020–21 3 005 1 3 006 3.02021–22 3 095 1 3 097 3.02022–23 3 184 1 3 186 2.92023–24 3 276 1 3 277 2.92024–25 3 370 2 3 371 2.92025–26 3 466 2 3 468 2.92026–27 3 562 2 3 563 2.72027–28 3 659 2 3 661 2.72028–29 3 760 2 3 761 2.72029–30 3 863 2 3 865 2.7
Annual average growth rate (per cent): 1991–92 to 2008–09 6.4 –17.3 6.12008–09 to 2029–30 3.5 3.0 3.5
Aircraft movementsIn 2008–09, around 29 000 aircraft passed through Hobart Airport, including 14 300 scheduled aircraft movements and 14 700 non-scheduled aircraft movements. The intercapital and regional routes accounted for 98 and 2 per cent of the total scheduled aircraft movements respectively.
Following an expected positive growth in passenger numbers, the number of aircraft movements through Hobart Airport is forecast to increase by 1.2 per cent a year over the forecast period to 37,500 in 2029–30 (Figure 4.18 and Table 4.10). The number of scheduled aircraft movements is expected to increase annually by 2.2 per cent to 22 800 in 2029–30, including 2.3 per cent growth in intercapital aircraft movements and 1.7 per cent on regional aircraft movements. This implies that around 22 400 aircraft movements will be on intercapital routes and 400 aircraft on regional routes in 2029–30. Non-scheduled aircraft movements are assumed to remain unchanged over the forecast period.

• 35 •
Chapter 4 • Forecasts of air passenger and aircraft movements
F4.18 Aircraft movements through Hobart Airport
Hourly aircraft movementsHourly aircraft movement data for 2006–07 suggest that there are four distinctive peak hours of aircraft operation at Hobart Airport: the early morning peak hour (6.00 am to 7.00 am), the morning peak hour (10.00 am to 11.00 am), the afternoon peak hour (4.00 am to 5.00 am) and the evening peak hour (6.00 pm to 7.00 pm) (Figure 4.19). The early morning, morning, afternoon and evening peak hours accounted for 9.8, 10.2, 7.1 and 6.9 per cent of total daily aircraft movements. On an average, 8 aircraft passed through Hobart Airport during the early morning and morning peak hours, and 6 during the afternoon and evening peak hours. These hourly movements are forecast to increase to 10 during the early morning and morning peak hours and 7 during the afternoon and evening peak hours in 2029–30 (Figure 4.20).
2029
–30
2028
–29
2027
–28
2026
–27
2025
–26
2024
–25
2023
–24
2022
–23
2021
–22
2020
–21
2019
–20
2018
–19
2017
–18
2016
–17
2015
–16
2014
–15
2013
–14
2012
–13
2011
–12
2010
–11
2009
–10
2008
–09
2007
–08
2006
–07
2005
–06
2004
–05
Scheduled intercapitalScheduled regional
Non-scheduled
Total
Air
craf
t m
ovem
ents
(th
ousa
nds)
0
5
10
15
20
25
30
35
40
Actual Forecast

• 36 •
BITRE • Report 117
T4.10 Aircraft movements through Hobart Airport
ScheduledYear Intercapital Regional Total Non–scheduled Total
(thousands)2004–05 15.1 0.8 15.9 14.5 30.42005–06 13.2 0.6 13.8 16.5 30.22006–07 12.3 0.4 12.8 17.2 30.02007–08 13.3 0.5 13.8 17.8 31.62008–09 14.0 0.3 14.3 14.7 29.0
Forecasts2009–10 14.0 0.3 14.3 14.7 29.02010–11 14.2 0.3 14.5 14.7 29.22011–12 14.6 0.3 14.9 14.7 29.62012–13 15.0 0.3 15.3 14.7 30.02013–14 15.4 0.3 15.7 14.7 30.42014–15 16.0 0.3 16.3 14.7 31.02015–16 16.6 0.3 17.0 14.7 31.72016–17 17.3 0.3 17.6 14.7 32.32017–18 17.8 0.4 18.2 14.7 32.92018–19 18.3 0.4 18.6 14.7 33.32019–20 18.6 0.4 19.0 14.7 33.72020–21 19.0 0.4 19.4 14.7 34.12021–22 19.4 0.4 19.8 14.7 34.52022–23 19.8 0.4 20.1 14.7 34.82023–24 20.1 0.4 20.5 14.7 35.22024–25 20.5 0.4 20.9 14.7 35.62025–26 20.9 0.4 21.3 14.7 36.02026–27 21.2 0.4 21.6 14.7 36.32027–28 21.6 0.4 22.0 14.7 36.72028–29 22.0 0.4 22.4 14.7 37.12029–30 22.4 0.4 22.8 14.7 37.5
Annual average growth rate (per cent): 2008–09 to 2029–30 2.3 1.7 2.2 0.0 1.2
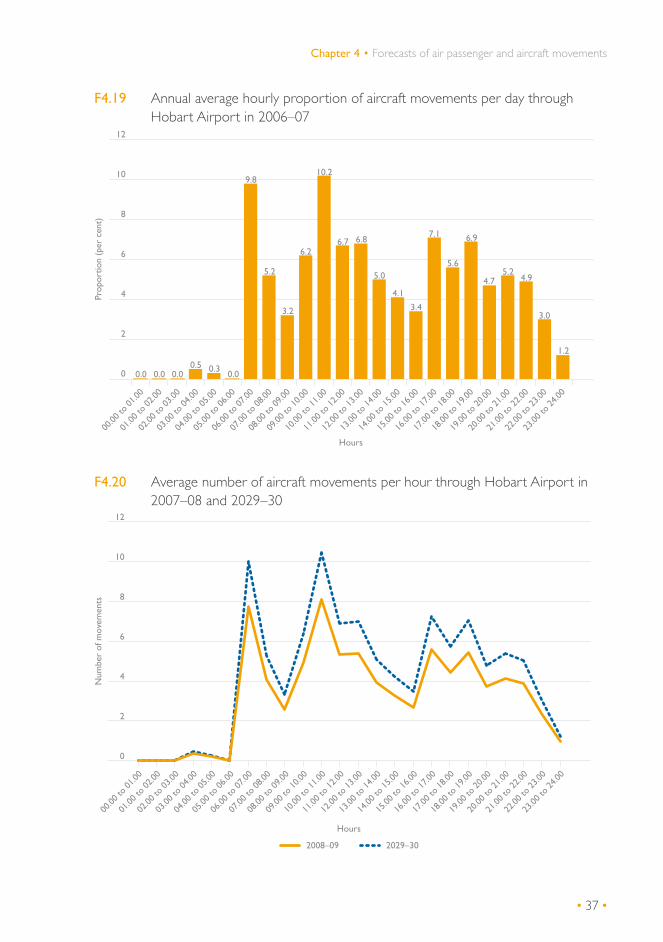
• 37 •
Chapter 4 • Forecasts of air passenger and aircraft movements
F4.19 Annual average hourly proportion of aircraft movements per day through Hobart Airport in 2006–07
F4.20 Average number of aircraft movements per hour through Hobart Airport in 2007–08 and 2029–30
23.00
to 24
.00
22.00
to 23
.00
21.00
to 22
.00
20.00
to 21
.00
19.00
to 20
.00
18.00
to 19
.00
17.00
to 18
.00
16.00
to 17
.00
15.00
to 16
.00
14.00
to 15
.00
13.00
to 14
.00
12.00
to 13
.00
11.00
to 12
.00
10.00
to 11
.00
09.00
to 10
.00
08.00
to 09
.00
07.00
to 08
.00
06.00
to 07
.00
05.00
to 06
.00
04.00
to 05
.00
03.00
to 04
.00
02.00
to 03
.00
01.00
to 02
.00
00.00
to 01
.00
Prop
ortio
n (p
er c
ent)
Hours
0
2
4
6
8
10
12
0.0 0.0 0.00.5 0.3 0.0
9.8
5.2
3.2
6.2
10.2
6.7 6.8
5.0
4.1
3.4
7.1
5.6
3.0
4.95.2
4.7
6.9
1.2
23.00
to 24
.00
22.00
to 23
.00
21.00
to 22
.00
20.00
to 21
.00
19.00
to 20
.00
18.00
to 19
.00
17.00
to 18
.00
16.00
to 17
.00
15.00
to 16
.00
14.00
to 15
.00
13.00
to 14
.00
12.00
to 13
.00
11.00
to 12
.00
10.00
to 11
.00
09.00
to 10
.00
08.00
to 09
.00
07.00
to 08
.00
06.00
to 07
.00
05.00
to 06
.00
04.00
to 05
.00
03.00
to 04
.00
02.00
to 03
.00
01.00
to 02
.00
00.00
to 01
.00
Hours
2008–09 2029–30
Num
ber
of m
ovem
ents
0
2
4
6
8
10
12
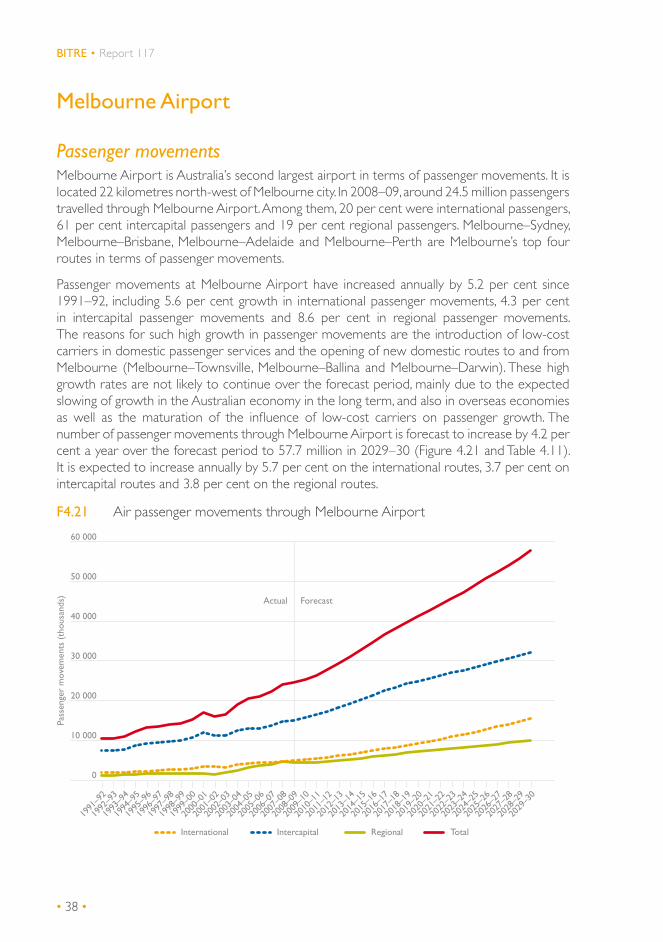
• 38 •
BITRE • Report 117
Melbourne Airport
Passenger movementsMelbourne Airport is Australia’s second largest airport in terms of passenger movements. It is located 22 kilometres north-west of Melbourne city. In 2008–09, around 24.5 million passengers travelled through Melbourne Airport. Among them, 20 per cent were international passengers, 61 per cent intercapital passengers and 19 per cent regional passengers. Melbourne–Sydney, Melbourne–Brisbane, Melbourne–Adelaide and Melbourne–Perth are Melbourne’s top four routes in terms of passenger movements.
Passenger movements at Melbourne Airport have increased annually by 5.2 per cent since 1991–92, including 5.6 per cent growth in international passenger movements, 4.3 per cent in intercapital passenger movements and 8.6 per cent in regional passenger movements. The reasons for such high growth in passenger movements are the introduction of low-cost carriers in domestic passenger services and the opening of new domestic routes to and from Melbourne (Melbourne–Townsville, Melbourne–Ballina and Melbourne–Darwin). These high growth rates are not likely to continue over the forecast period, mainly due to the expected slowing of growth in the Australian economy in the long term, and also in overseas economies as well as the maturation of the influence of low-cost carriers on passenger growth. The number of passenger movements through Melbourne Airport is forecast to increase by 4.2 per cent a year over the forecast period to 57.7 million in 2029–30 (Figure 4.21 and Table 4.11). It is expected to increase annually by 5.7 per cent on the international routes, 3.7 per cent on intercapital routes and 3.8 per cent on the regional routes.
F4.21 Air passenger movements through Melbourne Airport
2029
–30
2028
–29
2027
–28
2026
–27
2025
–26
2024
–25
2023
–24
2022
–23
2021
–22
2020
–21
2019
–20
2018
–19
2017
–18
2016
–17
2015
–16
2014
–15
2013
–14
2012
–13
2011
–12
2010
–11
2009
–10
2008
–09
2007
–08
2006
–07
2005
–06
2004
–05
2003
–04
2002
–03
2001
–02
2000
–01
1998
–99
1999
–00
1997
–98
1996
–97
1995
–96
1994
–95
1993
–94
1992
–93
1991
–92
International Intercapital Regional Total
Pass
enge
r m
ovem
ents
(th
ousa
nds) Actual Forecast
0
10 000
20 000
30 000
40 000
50 000
60 000
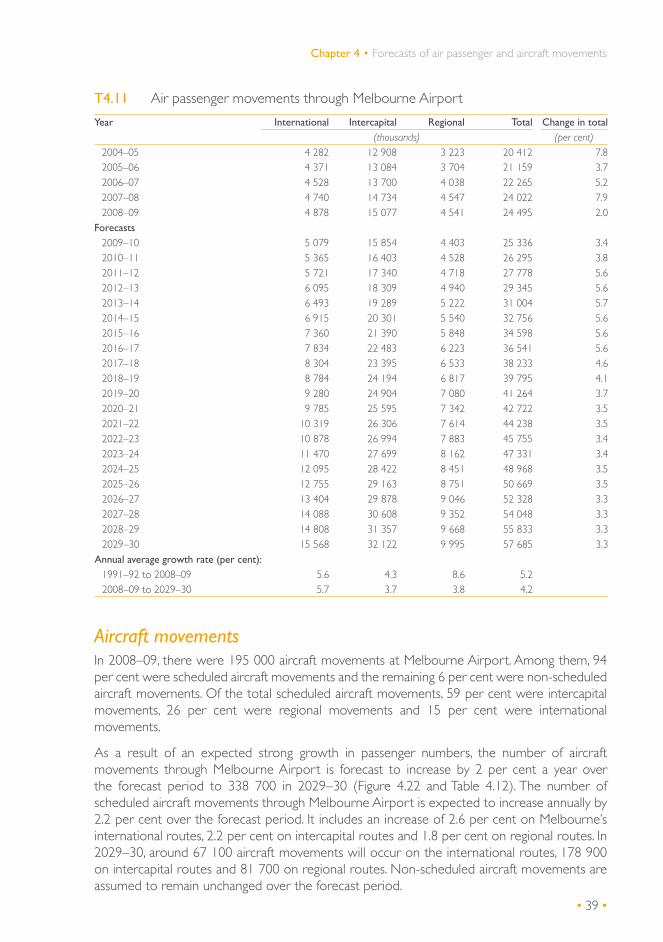
• 39 •
Chapter 4 • Forecasts of air passenger and aircraft movements
T4.11 Air passenger movements through Melbourne Airport
Year International Intercapital Regional Total Change in total(thousands) (per cent)
2004–05 4 282 12 908 3 223 20 412 7.82005–06 4 371 13 084 3 704 21 159 3.72006–07 4 528 13 700 4 038 22 265 5.22007–08 4 740 14 734 4 547 24 022 7.92008–09 4 878 15 077 4 541 24 495 2.0
Forecasts2009–10 5 079 15 854 4 403 25 336 3.42010–11 5 365 16 403 4 528 26 295 3.82011–12 5 721 17 340 4 718 27 778 5.62012–13 6 095 18 309 4 940 29 345 5.62013–14 6 493 19 289 5 222 31 004 5.72014–15 6 915 20 301 5 540 32 756 5.62015–16 7 360 21 390 5 848 34 598 5.62016–17 7 834 22 483 6 223 36 541 5.62017–18 8 304 23 395 6 533 38 233 4.62018–19 8 784 24 194 6 817 39 795 4.12019–20 9 280 24 904 7 080 41 264 3.72020–21 9 785 25 595 7 342 42 722 3.52021–22 10 319 26 306 7 614 44 238 3.52022–23 10 878 26 994 7 883 45 755 3.42023–24 11 470 27 699 8 162 47 331 3.42024–25 12 095 28 422 8 451 48 968 3.52025–26 12 755 29 163 8 751 50 669 3.52026–27 13 404 29 878 9 046 52 328 3.32027–28 14 088 30 608 9 352 54 048 3.32028–29 14 808 31 357 9 668 55 833 3.32029–30 15 568 32 122 9 995 57 685 3.3
Annual average growth rate (per cent): 1991–92 to 2008–09 5.6 4.3 8.6 5.22008–09 to 2029–30 5.7 3.7 3.8 4.2
Aircraft movementsIn 2008–09, there were 195 000 aircraft movements at Melbourne Airport. Among them, 94 per cent were scheduled aircraft movements and the remaining 6 per cent were non-scheduled aircraft movements. Of the total scheduled aircraft movements, 59 per cent were intercapital movements, 26 per cent were regional movements and 15 per cent were international movements.
As a result of an expected strong growth in passenger numbers, the number of aircraft movements through Melbourne Airport is forecast to increase by 2 per cent a year over the forecast period to 338 700 in 2029–30 (Figure 4.22 and Table 4.12). The number of scheduled aircraft movements through Melbourne Airport is expected to increase annually by 2.2 per cent over the forecast period. It includes an increase of 2.6 per cent on Melbourne’s international routes, 2.2 per cent on intercapital routes and 1.8 per cent on regional routes. In 2029–30, around 67 100 aircraft movements will occur on the international routes, 178 900 on intercapital routes and 81 700 on regional routes. Non-scheduled aircraft movements are assumed to remain unchanged over the forecast period.

• 40 •
BITRE • Report 117
F4.22 Aircraft movements through Melbourne Airport
Hourly aircraft movementsHourly aircraft movement data for 2007–08 show that the morning peak hour at Melbourne Airport starts at 8.00 am and ends at 9.00 am and the evening peak hours start at 6.00 pm and ends at 8.00 pm (Figure 4.23). The morning and evening peak hours accounted for 7.3 and 6.6 per cent of total daily aircraft movements respectively. On an average, 39 aircraft moved through Melbourne Airport during the morning peak hour and 35 per hour during the evening peak hours. These hourly movement numbers are forecast to increase to 68 during the morning peak hour and 62 per hour during the evening peak hour in 2029–30 (Figure 4.24).
2029
–30
2028
–29
2027
–28
2026
–27
2025
–26
2024
–25
2023
–24
2022
–23
2021
–22
2020
–21
2019
–20
2018
–19
2017
–18
2016
–17
2015
–16
2014
–15
2013
–14
2012
–13
2011
–12
2010
–11
2009
–10
2008
–09
2007
–08
2006
–07
2005
–06
2004
–05
Air
craf
t m
ovem
ents
(th
ousa
nds)
Scheduled international
Scheduled intercapitalScheduled regional
Non-scheduled
Total
Actual Forecast
0
50
100
150
200
250
300
350
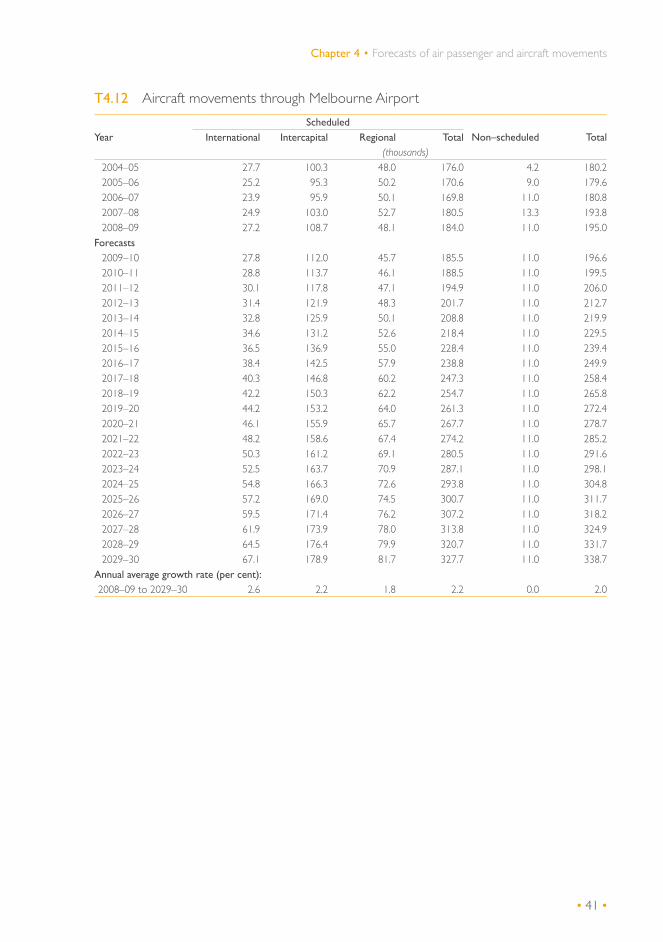
• 41 •
Chapter 4 • Forecasts of air passenger and aircraft movements
T4.12 Aircraft movements through Melbourne Airport
ScheduledYear International Intercapital Regional Total Non–scheduled Total
(thousands)2004–05 27.7 100.3 48.0 176.0 4.2 180.22005–06 25.2 95.3 50.2 170.6 9.0 179.62006–07 23.9 95.9 50.1 169.8 11.0 180.82007–08 24.9 103.0 52.7 180.5 13.3 193.82008–09 27.2 108.7 48.1 184.0 11.0 195.0
Forecasts2009–10 27.8 112.0 45.7 185.5 11.0 196.62010–11 28.8 113.7 46.1 188.5 11.0 199.52011–12 30.1 117.8 47.1 194.9 11.0 206.02012–13 31.4 121.9 48.3 201.7 11.0 212.72013–14 32.8 125.9 50.1 208.8 11.0 219.92014–15 34.6 131.2 52.6 218.4 11.0 229.52015–16 36.5 136.9 55.0 228.4 11.0 239.42016–17 38.4 142.5 57.9 238.8 11.0 249.92017–18 40.3 146.8 60.2 247.3 11.0 258.42018–19 42.2 150.3 62.2 254.7 11.0 265.82019–20 44.2 153.2 64.0 261.3 11.0 272.42020–21 46.1 155.9 65.7 267.7 11.0 278.72021–22 48.2 158.6 67.4 274.2 11.0 285.22022–23 50.3 161.2 69.1 280.5 11.0 291.62023–24 52.5 163.7 70.9 287.1 11.0 298.12024–25 54.8 166.3 72.6 293.8 11.0 304.82025–26 57.2 169.0 74.5 300.7 11.0 311.72026–27 59.5 171.4 76.2 307.2 11.0 318.22027–28 61.9 173.9 78.0 313.8 11.0 324.92028–29 64.5 176.4 79.9 320.7 11.0 331.72029–30 67.1 178.9 81.7 327.7 11.0 338.7
Annual average growth rate (per cent): 2008–09 to 2029–30 2.6 2.2 1.8 2.2 0.0 2.0

• 42 •
BITRE • Report 117
F4.23 Annual average hourly proportion of aircraft movements per day through Melbourne Airport in 2007–08
F4.24 Average number of aircraft movements per hour through Melbourne Airport in 2007–08 and 2029–30
23.00
to 24
.00
22.00
to 23
.00
21.00
to 22
.00
20.00
to 21
.00
19.00
to 20
.00
18.00
to 19
.00
17.00
to 18
.00
16.00
to 17
.00
15.00
to 16
.00
14.00
to 15
.00
13.00
to 14
.00
12.00
to 13
.00
11.00
to 12
.00
10.00
to 11
.00
09.00
to 10
.00
08.00
to 09
.00
07.00
to 08
.00
06.00
to 07
.00
05.00
to 06
.00
04.00
to 05
.00
03.00
to 04
.00
02.00
to 03
.00
01.00
to 02
.00
00.00
to 01
.00
Prop
ortio
n (p
er c
ent)
Hours
0.0
2.0
4.0
6.0
8.0
1.91.5
1.0
0.5 0.50.8
3.1
6.4
7.3
6.4
5.0
6.05.7
4.3
4.9
6.1
5.3
6.6
5.8
6.6
5.5
4.0
2.72.3
23.00
to 24
.00
22.00
to 23
.00
21.00
to 22
.00
20.00
to 21
.00
19.00
to 20
.00
18.00
to 19
.00
17.00
to 18
.00
16.00
to 17
.00
15.00
to 16
.00
14.00
to 15
.00
13.00
to 14
.00
12.00
to 13
.00
11.00
to 12
.00
10.00
to 11
.00
09.00
to 10
.00
08.00
to 09
.00
07.00
to 08
.00
06.00
to 07
.00
05.00
to 06
.00
04.00
to 05
.00
03.00
to 04
.00
02.00
to 03
.00
01.00
to 02
.00
00.00
to 01
.00
Hours
2008–09 2029–30
Num
ber
of m
ovem
ents
0
10
20
30
40
50
60
70
80
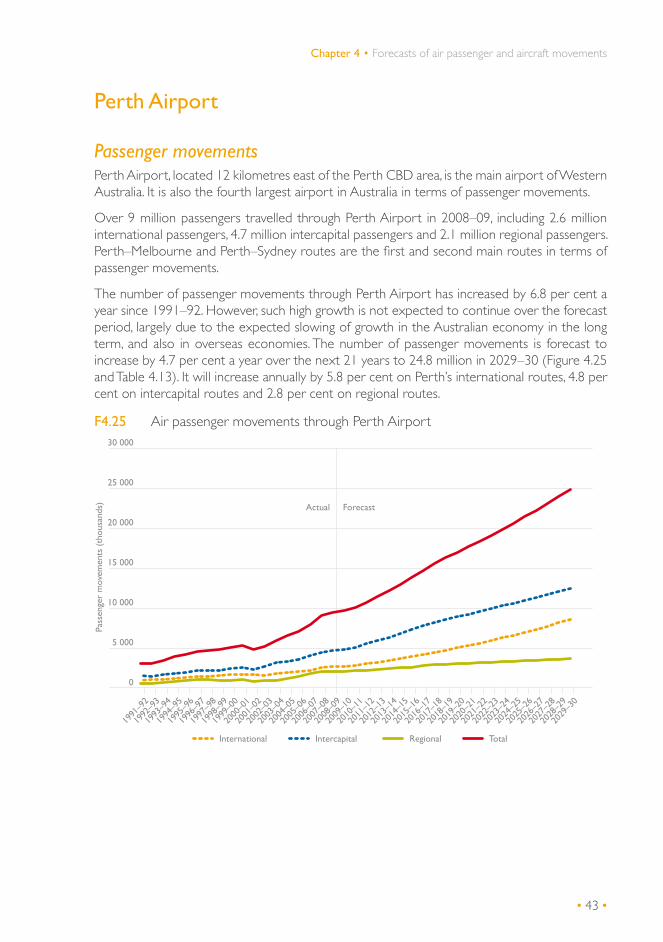
• 43 •
Chapter 4 • Forecasts of air passenger and aircraft movements
Perth Airport
Passenger movementsPerth Airport, located 12 kilometres east of the Perth CBD area, is the main airport of Western Australia. It is also the fourth largest airport in Australia in terms of passenger movements.
Over 9 million passengers travelled through Perth Airport in 2008–09, including 2.6 million international passengers, 4.7 million intercapital passengers and 2.1 million regional passengers. Perth–Melbourne and Perth–Sydney routes are the first and second main routes in terms of passenger movements.
The number of passenger movements through Perth Airport has increased by 6.8 per cent a year since 1991–92. However, such high growth is not expected to continue over the forecast period, largely due to the expected slowing of growth in the Australian economy in the long term, and also in overseas economies. The number of passenger movements is forecast to increase by 4.7 per cent a year over the next 21 years to 24.8 million in 2029–30 (Figure 4.25 and Table 4.13). It will increase annually by 5.8 per cent on Perth’s international routes, 4.8 per cent on intercapital routes and 2.8 per cent on regional routes.
F4.25 Air passenger movements through Perth Airport
2029
–30
2028
–29
2027
–28
2026
–27
2025
–26
2024
–25
2023
–24
2022
–23
2021
–22
2020
–21
2019
–20
2018
–19
2017
–18
2016
–17
2015
–16
2014
–15
2013
–14
2012
–13
2011
–12
2010
–11
2009
–10
2008
–09
2007
–08
2006
–07
2005
–06
2004
–05
2003
–04
2002
–03
2001
–02
2000
–01
1998
–99
1999
–00
1997
–98
1996
–97
1995
–96
1994
–95
1993
–94
1992
–93
1991
–92
International Intercapital Regional Total
Pass
enge
r m
ovem
ents
(th
ousa
nds) Actual Forecast
0
5 000
10 000
15 000
20 000
25 000
30 000
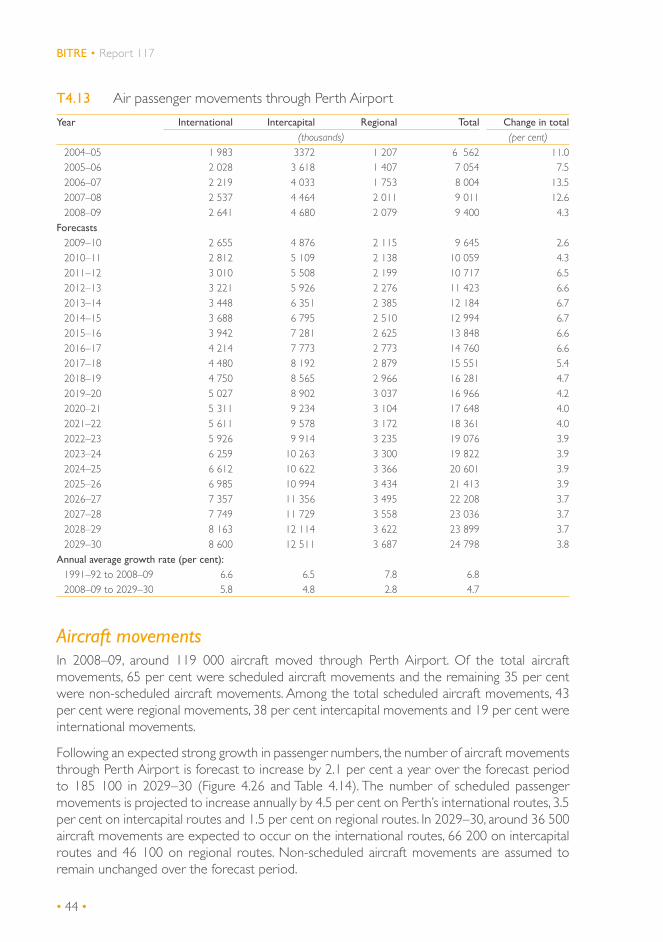
• 44 •
BITRE • Report 117
T4.13 Air passenger movements through Perth Airport
Year International Intercapital Regional Total Change in total(thousands) (per cent)
2004–05 1 983 3372 1 207 6 562 11.02005–06 2 028 3 618 1 407 7 054 7.52006–07 2 219 4 033 1 753 8 004 13.52007–08 2 537 4 464 2 011 9 011 12.62008–09 2 641 4 680 2 079 9 400 4.3
Forecasts2009–10 2 655 4 876 2 115 9 645 2.62010–11 2 812 5 109 2 138 10 059 4.32011–12 3 010 5 508 2 199 10 717 6.52012–13 3 221 5 926 2 276 11 423 6.62013–14 3 448 6 351 2 385 12 184 6.72014–15 3 688 6 795 2 510 12 994 6.72015–16 3 942 7 281 2 625 13 848 6.62016–17 4 214 7 773 2 773 14 760 6.62017–18 4 480 8 192 2 879 15 551 5.42018–19 4 750 8 565 2 966 16 281 4.72019–20 5 027 8 902 3 037 16 966 4.22020–21 5 311 9 234 3 104 17 648 4.02021–22 5 611 9 578 3 172 18 361 4.02022–23 5 926 9 914 3 235 19 076 3.92023–24 6 259 10 263 3 300 19 822 3.92024–25 6 612 10 622 3 366 20 601 3.92025–26 6 985 10 994 3 434 21 413 3.92026–27 7 357 11 356 3 495 22 208 3.72027–28 7 749 11 729 3 558 23 036 3.72028–29 8 163 12 114 3 622 23 899 3.72029–30 8 600 12 511 3 687 24 798 3.8
Annual average growth rate (per cent): 1991–92 to 2008–09 6.6 6.5 7.8 6.82008–09 to 2029–30 5.8 4.8 2.8 4.7
Aircraft movementsIn 2008–09, around 119 000 aircraft moved through Perth Airport. Of the total aircraft movements, 65 per cent were scheduled aircraft movements and the remaining 35 per cent were non-scheduled aircraft movements. Among the total scheduled aircraft movements, 43 per cent were regional movements, 38 per cent intercapital movements and 19 per cent were international movements.
Following an expected strong growth in passenger numbers, the number of aircraft movements through Perth Airport is forecast to increase by 2.1 per cent a year over the forecast period to 185 100 in 2029–30 (Figure 4.26 and Table 4.14). The number of scheduled passenger movements is projected to increase annually by 4.5 per cent on Perth’s international routes, 3.5 per cent on intercapital routes and 1.5 per cent on regional routes. In 2029–30, around 36 500 aircraft movements are expected to occur on the international routes, 66 200 on intercapital routes and 46 100 on regional routes. Non-scheduled aircraft movements are assumed to remain unchanged over the forecast period.

• 45 •
Chapter 4 • Forecasts of air passenger and aircraft movements
F4.26 Aircraft movements through Perth Airport
Hourly aircraft movementsHourly aircraft movement data for 2007–08 suggest that there are two distinctive peak hours of aircraft operation at Perth Airport: morning peak hour (from 6.00 am to 7.00 am) and afternoon peak hour (from 3.00 pm to 4.00 pm) (Figure 4.27). The morning and afternoon peak hours accounted individually for 7.2 per cent of total daily aircraft movements respectively. On an average, 22 aircraft moved through Perth Airport during the morning peak hour and another 22 during the afternoon peak hour. These hourly movements are forecast to increase to 36 during the morning peak hour and another 36 during the afternoon peak hour in 2029–30 (Figure 4.28).
2029
–30
2028
–29
2027
–28
2026
–27
2025
–26
2024
–25
2023
–24
2022
–23
2021
–22
2020
–21
2019
–20
2018
–19
2017
–18
2016
–17
2015
–16
2014
–15
2013
–14
2012
–13
2011
–12
2010
–11
2009
–10
2008
–09
2007
–08
2006
–07
2005
–06
2004
–05
Air
craf
t m
ovem
ents
(th
ousa
nds)
Scheduled international
Scheduled intercapitalScheduled regional
Non-scheduled
Total
Actual Forecast
0
40
80
120
160
200
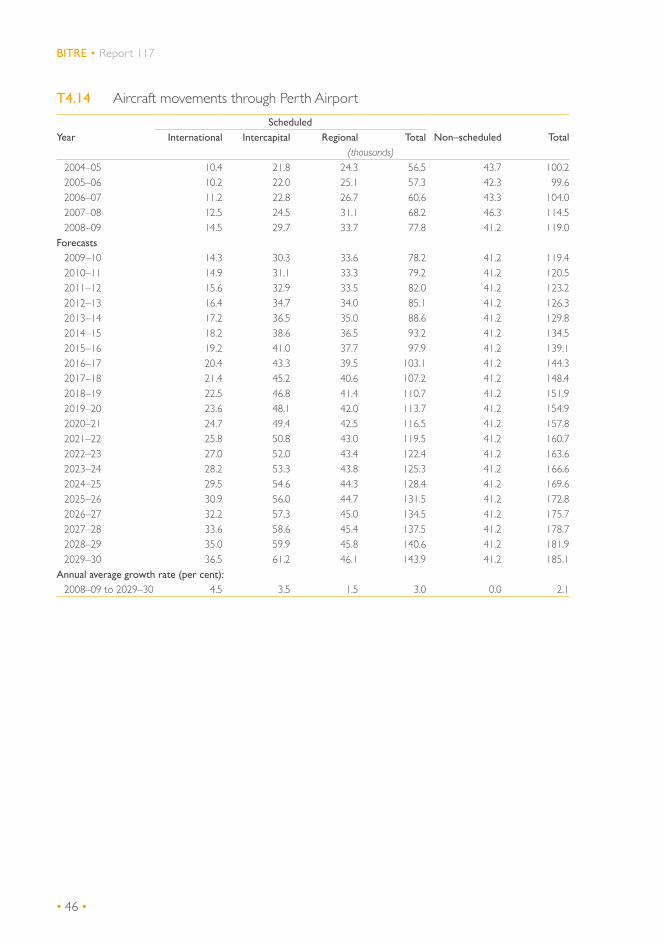
• 46 •
BITRE • Report 117
T4.14 Aircraft movements through Perth Airport
ScheduledYear International Intercapital Regional Total Non–scheduled Total
(thousands)2004–05 10.4 21.8 24.3 56.5 43.7 100.22005–06 10.2 22.0 25.1 57.3 42.3 99.62006–07 11.2 22.8 26.7 60.6 43.3 104.02007–08 12.5 24.5 31.1 68.2 46.3 114.52008–09 14.5 29.7 33.7 77.8 41.2 119.0
Forecasts2009–10 14.3 30.3 33.6 78.2 41.2 119.42010–11 14.9 31.1 33.3 79.2 41.2 120.52011–12 15.6 32.9 33.5 82.0 41.2 123.22012–13 16.4 34.7 34.0 85.1 41.2 126.32013–14 17.2 36.5 35.0 88.6 41.2 129.82014–15 18.2 38.6 36.5 93.2 41.2 134.52015–16 19.2 41.0 37.7 97.9 41.2 139.12016–17 20.4 43.3 39.5 103.1 41.2 144.32017–18 21.4 45.2 40.6 107.2 41.2 148.42018–19 22.5 46.8 41.4 110.7 41.2 151.92019–20 23.6 48.1 42.0 113.7 41.2 154.92020–21 24.7 49.4 42.5 116.5 41.2 157.82021–22 25.8 50.8 43.0 119.5 41.2 160.72022–23 27.0 52.0 43.4 122.4 41.2 163.62023–24 28.2 53.3 43.8 125.3 41.2 166.62024–25 29.5 54.6 44.3 128.4 41.2 169.62025–26 30.9 56.0 44.7 131.5 41.2 172.82026–27 32.2 57.3 45.0 134.5 41.2 175.72027–28 33.6 58.6 45.4 137.5 41.2 178.72028–29 35.0 59.9 45.8 140.6 41.2 181.92029–30 36.5 61.2 46.1 143.9 41.2 185.1
Annual average growth rate (per cent):2008–09 to 2029–30 4.5 3.5 1.5 3.0 0.0 2.1
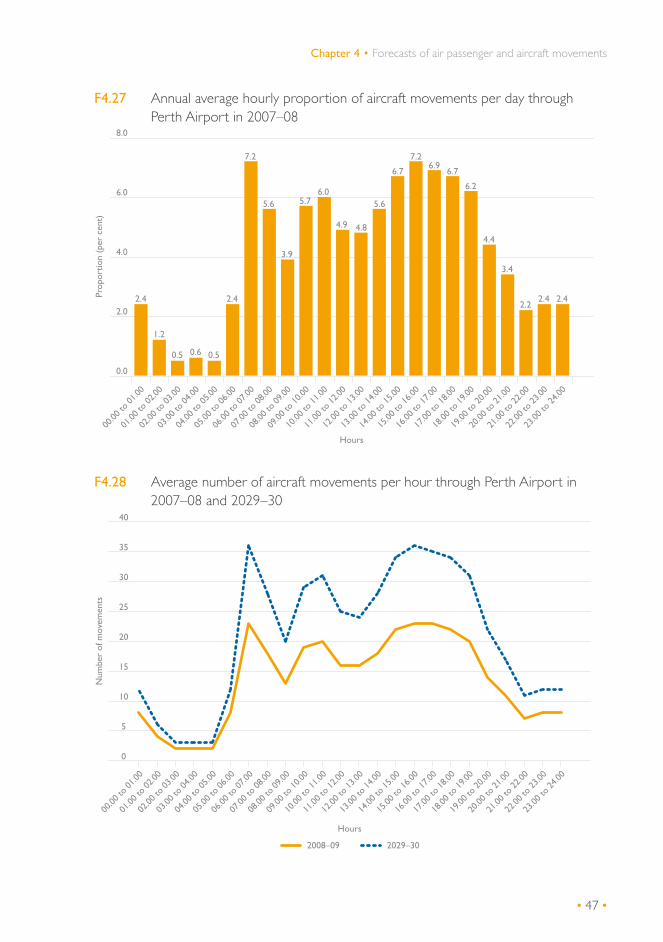
• 47 •
Chapter 4 • Forecasts of air passenger and aircraft movements
F4.27 Annual average hourly proportion of aircraft movements per day through Perth Airport in 2007–08
F4.28 Average number of aircraft movements per hour through Perth Airport in 2007–08 and 2029–30
23.00
to 24
.00
22.00
to 23
.00
21.00
to 22
.00
20.00
to 21
.00
19.00
to 20
.00
18.00
to 19
.00
17.00
to 18
.00
16.00
to 17
.00
15.00
to 16
.00
14.00
to 15
.00
13.00
to 14
.00
12.00
to 13
.00
11.00
to 12
.00
10.00
to 11
.00
09.00
to 10
.00
08.00
to 09
.00
07.00
to 08
.00
06.00
to 07
.00
05.00
to 06
.00
04.00
to 05
.00
03.00
to 04
.00
02.00
to 03
.00
01.00
to 02
.00
00.00
to 01
.00
Prop
ortio
n (p
er c
ent)
Hours
0.0
2.0
4.0
6.0
8.0
2.4
1.2
0.5 0.6 0.5
2.4
7.2
5.6
3.9
5.76.0
4.9 4.8
5.6
6.7
7.26.9
6.7
6.2
4.4
3.4
2.22.4 2.4
23.00
to 24
.00
22.00
to 23
.00
21.00
to 22
.00
20.00
to 21
.00
19.00
to 20
.00
18.00
to 19
.00
17.00
to 18
.00
16.00
to 17
.00
15.00
to 16
.00
14.00
to 15
.00
13.00
to 14
.00
12.00
to 13
.00
11.00
to 12
.00
10.00
to 11
.00
09.00
to 10
.00
08.00
to 09
.00
07.00
to 08
.00
06.00
to 07
.00
05.00
to 06
.00
04.00
to 05
.00
03.00
to 04
.00
02.00
to 03
.00
01.00
to 02
.00
00.00
to 01
.00
Hours
2008–09 2029–30
Num
ber
of m
ovem
ents
0
5
10
15
20
25
30
35
40

• 48 •
BITRE • Report 117
Sydney Airport
Passenger movementsSydney Airport is located eight kilometres south of the Sydney CBD and is Australia’s largest airport in terms of passenger and freight movements. The airport has a jet curfew which largely prohibits jet aircraft movements from 11.00 pm to 6.00 am and a cap on aircraft movements of 80 aircraft per hour.
Around 32.2 million passengers passed through Sydney Airport in 2008–09. This included 10.2 million international passengers, 15.2 million intercapital passengers and 6.8 million regional passengers. Sydney–Melbourne, Sydney–Brisbane, Sydney–Canberra, Sydney–Adelaide and Sydney–Perth are the first five main routes in terms of domestic passenger movements.
The number of passenger movements through Sydney Airport has increased by 4.5 per cent a year since 1991–92 and is forecast to increase by 4 per cent a year in the next 21 years to 72.9 million in 2029–30 (Figure 4.29 and Table 4.15). The main reasons for the expected lower growth in passenger movements are the expected slowing of growth in the Australian economy in the long term, and also in overseas economies as well as the maturation of the influence of low-cost carriers on passenger growth.
The number of international, intercapital and regional passenger movements is projected to increase annually by 4.7, 3.8 and 3.1 per cent over the forecast period respectively. Around 26.7 million international passenger, 33.4 million intercapital passenger and 12.8 million regional passengers are expected to travel through Sydney Airport in 2029–30.
F4.29 Air passenger movements through Sydney Airport
2029
–30
2028
–29
2027
–28
2026
–27
2025
–26
2024
–25
2023
–24
2022
–23
2021
–22
2020
–21
2019
–20
2018
–19
2017
–18
2016
–17
2015
–16
2014
–15
2013
–14
2012
–13
2011
–12
2010
–11
2009
–10
2008
–09
2007
–08
2006
–07
2005
–06
2004
–05
2003
–04
2002
–03
2001
–02
2000
–01
1998
–99
1999
–00
1997
–98
1996
–97
1995
–96
1994
–95
1993
–94
1992
–93
1991
–92
International Intercapital Regional Total
Pass
enge
r m
ovem
ents
(th
ousa
nds)
Actual Forecast
0
10 000
20 000
30 000
40 000
50 000
60 000
70 000
80 000

• 49 •
Chapter 4 • Forecasts of air passenger and aircraft movements
T4.15 Air passenger movements through Sydney Airport
Year International Intercapital Regional Total Change in total(thousands) (per cent)
2004–05 9 238 13 183 5 496 27 917 7.42005–06 9 511 13 257 6 072 28 840 3.32006–07 9 933 14 097 6 795 30 825 6.92007–08 10 429 15 185 6 955 32 569 5.72008–09 10 202 15 197 6 810 32 209 –1.1
Forecasts2009–10 10 580 16 089 7 175 33 844 5.12010–11 11 071 16 693 7 298 35 062 3.62011–12 11 684 17 677 7 513 36 875 5.22012–13 12 364 18 684 7 770 38 818 5.32013–14 13 110 19 680 8 105 40 895 5.42014–15 13 883 20 701 8 481 43 066 5.32015–16 14 660 21 810 8 836 45 306 5.22016–17 15 503 22 906 9 274 47 684 5.22017–18 16 277 23 845 9 614 49 736 4.32018–19 17 041 24 681 9 910 51 633 3.82019–20 17 804 25 439 10 172 53 416 3.52020–21 18 571 26 182 10 427 55 181 3.32021–22 19 371 26 948 10 687 57 007 3.32022–23 20 193 27 697 10 939 58 828 3.22023–24 21 049 28 466 11 197 60 712 3.22024–25 21 942 29 256 11 461 62 659 3.22025–26 22 874 30 068 11 730 64 673 3.22026–27 23 779 30 859 11 990 66 628 3.02027–28 24 721 31 670 12 255 68 646 3.02028–29 25 701 32 503 12 525 70 729 3.02029–30 26 720 33 357 12 802 72 879 3.0
Annual average growth rate (per cent):1991–92 to 2008–09 4.8 3.8 5.7 4.52008–09 to 2029–30 4.7 3.8 3.1 4.0
Aircraft movementsOver 291 500 aircraft passed through Sydney Airport in 2008–09, including 267 400 scheduled aircraft and 24 100 non-scheduled aircraft. Intercapital, regional and international routes accounted for 43 35 and 22 per cent of the total scheduled aircraft movements respectively.
Following an expected strong growth in passenger numbers, the number of aircraft movements through Sydney Airport is forecast to increase by 2.3 per cent a year over the forecast period to 473 900 in 2029–30 (Figure 4.30 and Table 4.16). The number of scheduled aircraft movements is expected to increase annually by 2.5 per cent over the forecast period, including 3.4 per cent on the international routes, 2.5 per cent on the intercapital routes and 1.8 per cent on the regional routes. In 2029–30, over 120 100 aircraft will be flying on Sydney’s international routes, 192 700 aircraft flying on intercapital routes and 137 100 aircraft flying on regional routes. Non-scheduled aircraft movements are assumed to remain unchanged over the forecast period.

• 50 •
BITRE • Report 117
F4.30 Aircraft movements through Sydney Airport
Hourly aircraft movementsAs mentioned in the beginning of this chapter, an analysis of hourly aircraft movements through Sydney Airport has been carried out to determine the year in which the peak hour movements is likely to hit the existing hourly cap of 80 movements at Sydney Airport.
Hourly aircraft movement data from Airservices Australia for 2007–08 show two distinctive peak hours of aircraft movements through Sydney Airport: one in the morning, from 8.00 am to 9.00 am and another in the evening, from 6.00 pm to 7.00 pm, (Figure 4.31). The morning and evening peak hours accounted for 7.6 and 6.9 per cent of total daily aircraft movements at Sydney Airport respectively. On average, 62 aircraft passed through Sydney airport during the morning peak hour and 57 during the evening peak hour. In 2008, the number of hourly aircraft movements was observed to be over 60, a rate at which movement pressures increase, during most morning and evening peak hours. The movement numbers are shown in Figure 4.32 for the last quarter of 2008 only. Longer time series data would have overcrowded the representation in Figure 4.32. However, the selected period provides a good representation of longer term peak movements. The movement data suggest that the hourly movement numbers were sometimes very close to the existing hourly cap of 80 movements. During the morning peak hour, 77 aircraft movements were recorded on 12 February 2007, 3 March 2007 and 22 March of 2008 and 79 aircraft movements on 22 October 2007.
2029
–30
2028
–29
2027
–28
2026
–27
2025
–26
2024
–25
2023
–24
2022
–23
2021
–22
2020
–21
2019
–20
2018
–19
2017
–18
2016
–17
2015
–16
2014
–15
2013
–14
2012
–13
2011
–12
2010
–11
2009
–10
2008
–09
2007
–08
2006
–07
2005
–06
2004
–05
Air
craf
t m
ovem
ents
(th
ousa
nds)
Scheduled international
Scheduled intercapitalScheduled regional
Non-scheduled
Total
Actual Forecast
0
100
200
300
400
500

• 51 •
Chapter 4 • Forecasts of air passenger and aircraft movements
T4.16 Aircraft movements through Sydney Airport
ScheduledYear International Intercapital Regional Total Non–scheduled Total
(thousands)2004–05 57.9 105.1 94.6 257.6 23.8 281.42005–06 58.6 100.7 96.1 255.4 26.0 281.42006–07 57.9 102.8 99.6 260.3 26.0 286.32007–08 59.8 110.1 101.2 271.0 27.3 298.32008–09 59.3 113.7 94.4 267.4 24.1 291.5
Forecasts2009–10 60.3 118.0 97.6 275.8 24.1 299.92010–11 61.9 120.0 97.3 279.2 24.1 303.22011–12 64.0 124.6 98.2 286.8 24.1 310.82012–13 66.4 129.1 99.6 295.1 24.1 319.12013–14 69.0 133.3 101.8 304.2 24.1 328.22014–15 72.4 138.9 105.5 316.7 24.1 340.82015–16 75.7 144.8 108.8 329.3 24.1 353.42016–17 79.2 150.6 113.1 342.9 24.1 367.02017–18 82.4 155.2 116.1 353.7 24.1 377.72018–19 85.4 159.1 118.4 362.9 24.1 387.02019–20 88.3 162.4 120.4 371.0 24.1 395.12020–21 91.2 165.4 122.2 378.8 24.1 402.92021–22 94.2 168.6 124.0 386.8 24.1 410.82022–23 97.2 171.6 125.6 394.4 24.1 418.52023–24 100.3 174.6 127.3 402.2 24.1 426.32024–25 103.6 177.7 129.0 410.2 24.1 434.32025–26 106.9 180.8 130.8 418.4 24.1 442.52026–27 110.0 183.7 132.3 426.0 24.1 450.12027–28 113.2 186.7 133.9 433.8 24.1 457.92028–29 116.6 189.7 135.5 441.7 24.1 465.82029–30 120.0 192.7 137.1 449.8 24.1 473.9
Annual average growth rate (per cent):2008–09 to 2029–30 3.4 2.5 1.8 2.5 0.0 2.3
The hourly proportions and forecasts of aircraft movements are used to predict the number of aircraft movements during each hour of operation. Assuming that the current morning and evening peaks do not spread over the forecast period, the number of hourly aircraft movements is expected to reach 70 during the morning peak hour in 2014–15, 80 during the morning peak hour in 2018–19 and would reach 80 during both morning and evening peak hours by 2022–23 (Figure 4.33).
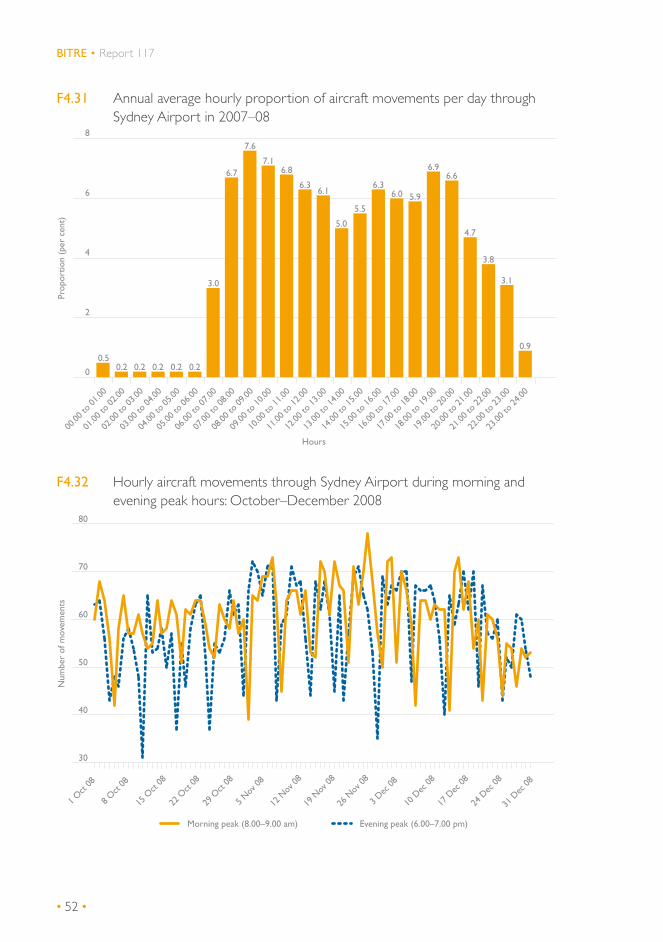
• 52 •
BITRE • Report 117
F4.31 Annual average hourly proportion of aircraft movements per day through Sydney Airport in 2007–08
F4.32 Hourly aircraft movements through Sydney Airport during morning and evening peak hours: October–December 2008
23.00
to 24
.00
22.00
to 23
.00
21.00
to 22
.00
20.00
to 21
.00
19.00
to 20
.00
18.00
to 19
.00
17.00
to 18
.00
16.00
to 17
.00
15.00
to 16
.00
14.00
to 15
.00
13.00
to 14
.00
12.00
to 13
.00
11.00
to 12
.00
10.00
to 11
.00
09.00
to 10
.00
08.00
to 09
.00
07.00
to 08
.00
06.00
to 07
.00
05.00
to 06
.00
04.00
to 05
.00
03.00
to 04
.00
02.00
to 03
.00
01.00
to 02
.00
00.00
to 01
.00
Prop
ortio
n (p
er c
ent)
Hours
0
2
4
6
8
0.50.2 0.2 0.2 0.2 0.2
3.0
6.7
7.6
7.16.8
6.36.1
5.0
5.5
6.36.0 5.9
6.96.6
4.7
3.8
3.1
0.9
30
40
50
60
70
80
31 D
ec 08
24 D
ec 08
17 D
ec 08
10 D
ec 08
3 Dec
08
26 N
ov 08
19 N
ov 08
12 N
ov 08
5 Nov
08
29 O
ct 08
22 O
ct 08
15 O
ct 08
8 Oct
08
1 Oct
08
Morning peak (8.00–9.00 am) Evening peak (6.00–7.00 pm)
Num
ber
of m
ovem
ents
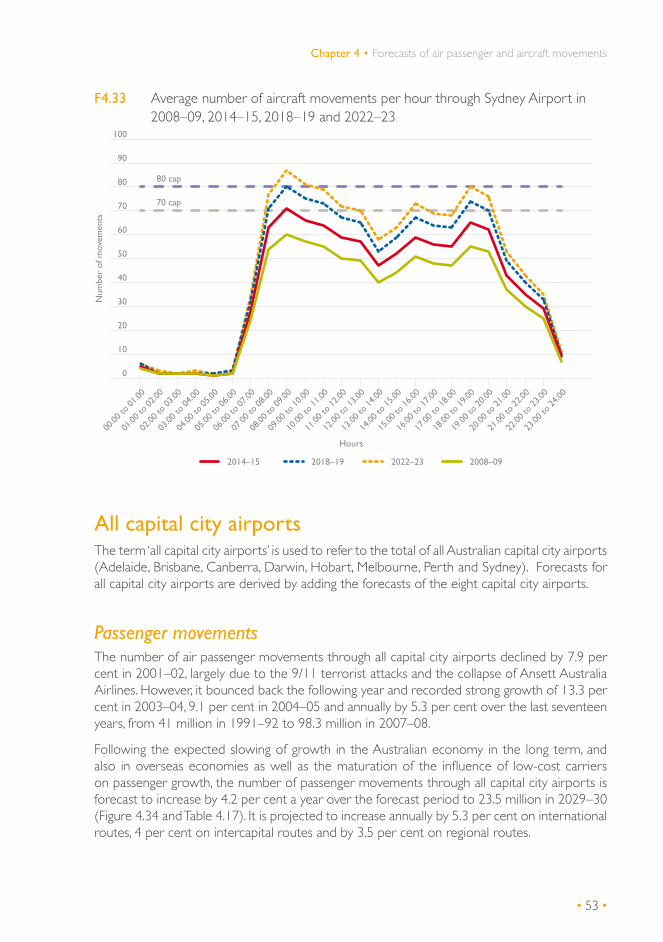
• 53 •
Chapter 4 • Forecasts of air passenger and aircraft movements
F4.33 Average number of aircraft movements per hour through Sydney Airport in 2008–09, 2014–15, 2018–19 and 2022–23
All capital city airportsThe term ‘all capital city airports’ is used to refer to the total of all Australian capital city airports (Adelaide, Brisbane, Canberra, Darwin, Hobart, Melbourne, Perth and Sydney). Forecasts for all capital city airports are derived by adding the forecasts of the eight capital city airports.
Passenger movementsThe number of air passenger movements through all capital city airports declined by 7.9 per cent in 2001–02, largely due to the 9/11 terrorist attacks and the collapse of Ansett Australia Airlines. However, it bounced back the following year and recorded strong growth of 13.3 per cent in 2003–04, 9.1 per cent in 2004–05 and annually by 5.3 per cent over the last seventeen years, from 41 million in 1991–92 to 98.3 million in 2007–08.
Following the expected slowing of growth in the Australian economy in the long term, and also in overseas economies as well as the maturation of the influence of low-cost carriers on passenger growth, the number of passenger movements through all capital city airports is forecast to increase by 4.2 per cent a year over the forecast period to 23.5 million in 2029–30 (Figure 4.34 and Table 4.17). It is projected to increase annually by 5.3 per cent on international routes, 4 per cent on intercapital routes and by 3.5 per cent on regional routes.
0
10
20
30
40
50
60
70
80
90
100
23.00
to 24
.00
22.00
to 23
.00
21.00
to 22
.00
20.00
to 21
.00
19.00
to 20
.00
18.00
to 19
.00
17.00
to 18
.00
16.00
to 17
.00
15.00
to 16
.00
14.00
to 15
.00
13.00
to 14
.00
12.00
to 13
.00
11.00
to 12
.00
10.00
to 11
.00
09.00
to 10
.00
08.00
to 09
.00
07.00
to 08
.00
06.00
to 07
.00
05.00
to 06
.00
04.00
to 05
.00
03.00
to 04
.00
02.00
to 03
.00
01.00
to 02
.00
00.00
to 01
.00
Hours
Num
ber
of m
ovem
ents
2014–15 2018–19 2022–23 2008–09
80 cap
70 cap
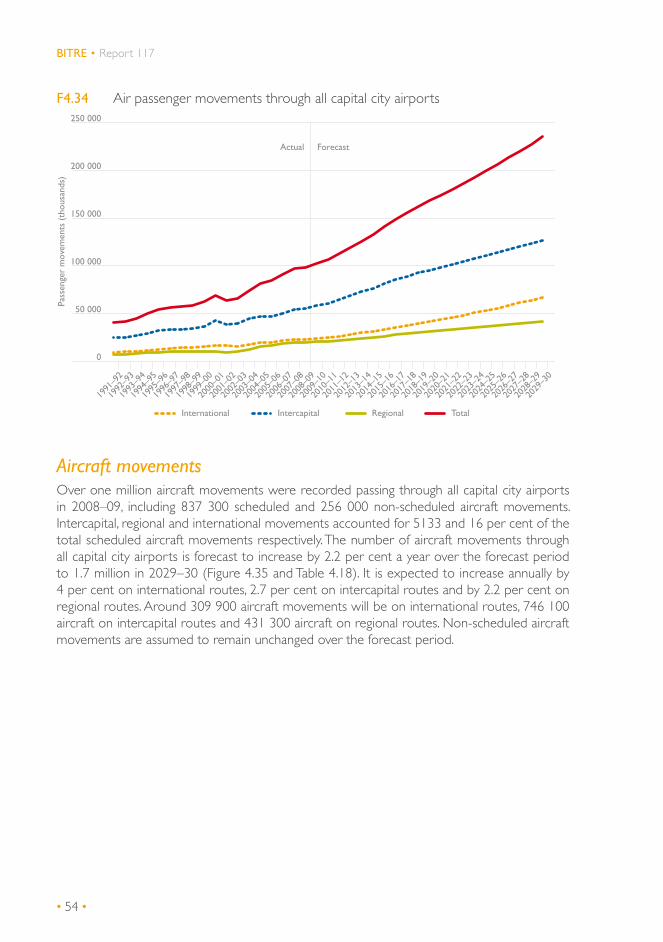
• 54 •
BITRE • Report 117
F4.34 Air passenger movements through all capital city airports
Aircraft movementsOver one million aircraft movements were recorded passing through all capital city airports in 2008–09, including 837 300 scheduled and 256 000 non-scheduled aircraft movements. Intercapital, regional and international movements accounted for 5133 and 16 per cent of the total scheduled aircraft movements respectively. The number of aircraft movements through all capital city airports is forecast to increase by 2.2 per cent a year over the forecast period to 1.7 million in 2029–30 (Figure 4.35 and Table 4.18). It is expected to increase annually by 4 per cent on international routes, 2.7 per cent on intercapital routes and by 2.2 per cent on regional routes. Around 309 900 aircraft movements will be on international routes, 746 100 aircraft on intercapital routes and 431 300 aircraft on regional routes. Non-scheduled aircraft movements are assumed to remain unchanged over the forecast period.
2029
–30
2028
–29
2027
–28
2026
–27
2025
–26
2024
–25
2023
–24
2022
–23
2021
–22
2020
–21
2019
–20
2018
–19
2017
–18
2016
–17
2015
–16
2014
–15
2013
–14
2012
–13
2011
–12
2010
–11
2009
–10
2008
–09
2007
–08
2006
–07
2005
–06
2004
–05
2003
–04
2002
–03
2001
–02
2000
–01
1998
–99
1999
–00
1997
–98
1996
–97
1995
–96
1994
–95
1993
–94
1992
–93
1991
–92
International Intercapital Regional Total
Pass
enge
r m
ovem
ents
(th
ousa
nds)
Actual Forecast
0
50 000
100 000
150 000
200 000
250 000
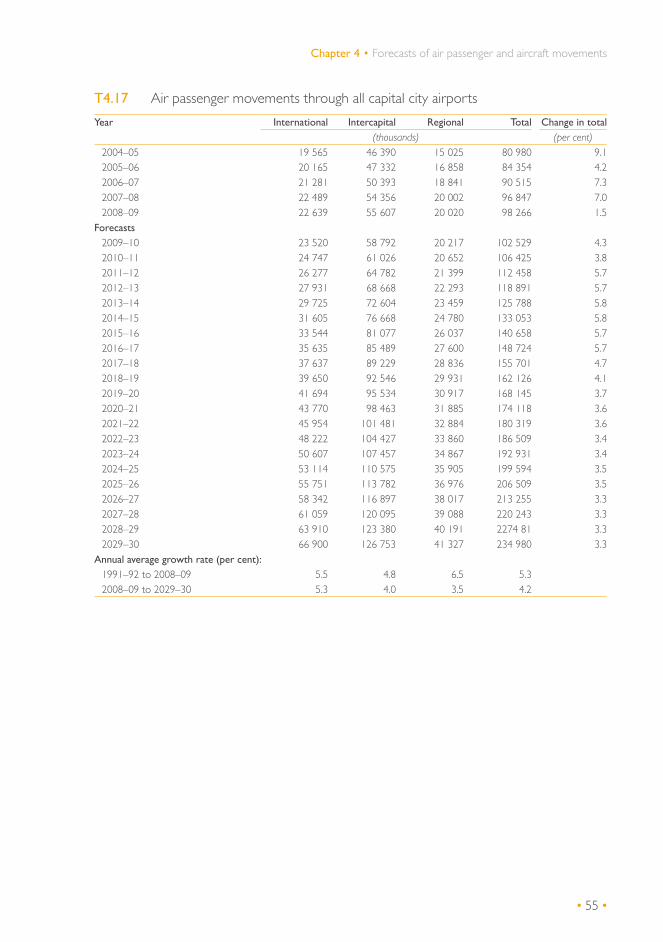
• 55 •
Chapter 4 • Forecasts of air passenger and aircraft movements
T4.17 Air passenger movements through all capital city airports
Year International Intercapital Regional Total Change in total(thousands) (per cent)
2004–05 19 565 46 390 15 025 80 980 9.12005–06 20 165 47 332 16 858 84 354 4.22006–07 21 281 50 393 18 841 90 515 7.32007–08 22 489 54 356 20 002 96 847 7.02008–09 22 639 55 607 20 020 98 266 1.5
Forecasts2009–10 23 520 58 792 20 217 102 529 4.32010–11 24 747 61 026 20 652 106 425 3.82011–12 26 277 64 782 21 399 112 458 5.72012–13 27 931 68 668 22 293 118 891 5.72013–14 29 725 72 604 23 459 125 788 5.82014–15 31 605 76 668 24 780 133 053 5.82015–16 33 544 81 077 26 037 140 658 5.72016–17 35 635 85 489 27 600 148 724 5.72017–18 37 637 89 229 28 836 155 701 4.72018–19 39 650 92 546 29 931 162 126 4.12019–20 41 694 95 534 30 917 168 145 3.72020–21 43 770 98 463 31 885 174 118 3.62021–22 45 954 101 481 32 884 180 319 3.62022–23 48 222 104 427 33 860 186 509 3.42023–24 50 607 107 457 34 867 192 931 3.42024–25 53 114 110 575 35 905 199 594 3.52025–26 55 751 113 782 36 976 206 509 3.52026–27 58 342 116 897 38 017 213 255 3.32027–28 61 059 120 095 39 088 220 243 3.32028–29 63 910 123 380 40 191 2274 81 3.32029–30 66 900 126 753 41 327 234 980 3.3
Annual average growth rate (per cent): 1991–92 to 2008–09 5.5 4.8 6.5 5.32008–09 to 2029–30 5.3 4.0 3.5 4.2
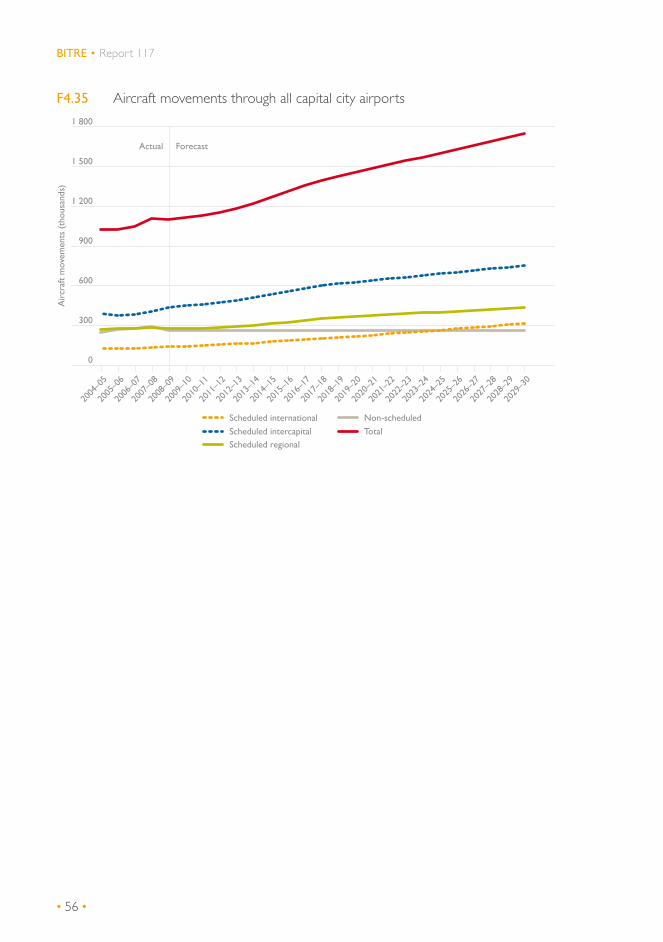
• 56 •
BITRE • Report 117
F4.35 Aircraft movements through all capital city airports
2029
–30
2028
–29
2027
–28
2026
–27
2025
–26
2024
–25
2023
–24
2022
–23
2021
–22
2020
–21
2019
–20
2018
–19
2017
–18
2016
–17
2015
–16
2014
–15
2013
–14
2012
–13
2011
–12
2010
–11
2009
–10
2008
–09
2007
–08
2006
–07
2005
–06
2004
–05
Air
craf
t m
ovem
ents
(th
ousa
nds)
Scheduled international
Scheduled intercapitalScheduled regional
Non-scheduled
Total
Actual Forecast
0
300
600
900
1 200
1 500
1 800
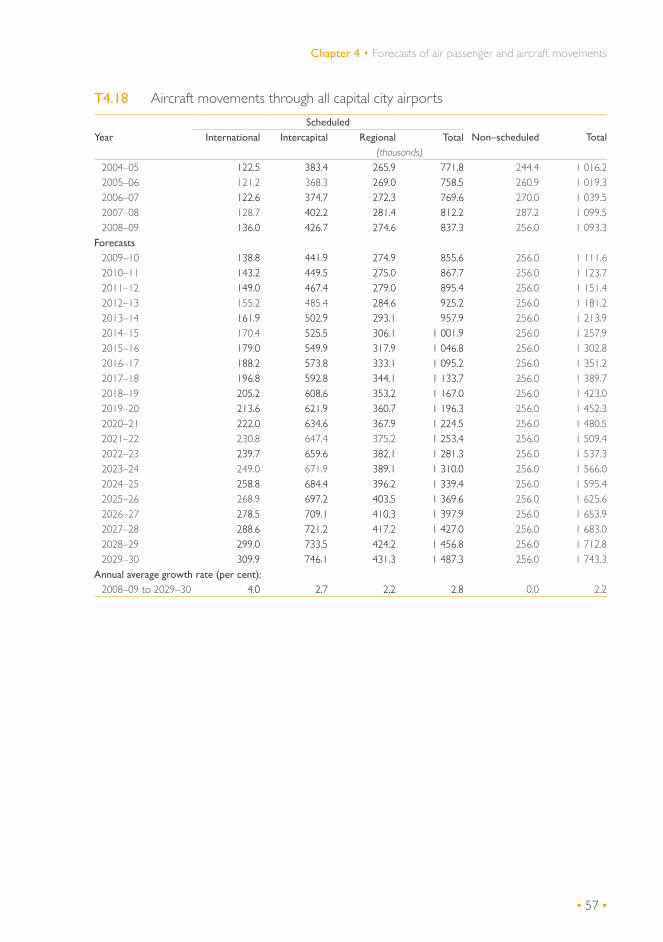
• 57 •
Chapter 4 • Forecasts of air passenger and aircraft movements
T4.18 Aircraft movements through all capital city airports
ScheduledYear International Intercapital Regional Total Non–scheduled Total
(thousands)2004–05 122.5 383.4 265.9 771.8 244.4 1 016.22005–06 121.2 368.3 269.0 758.5 260.9 1 019.32006–07 122.6 374.7 272.3 769.6 270.0 1 039.52007–08 128.7 402.2 281.4 812.2 287.2 1 099.52008–09 136.0 426.7 274.6 837.3 256.0 1 093.3
Forecasts2009–10 138.8 441.9 274.9 855.6 256.0 1 111.62010–11 143.2 449.5 275.0 867.7 256.0 1 123.72011–12 149.0 467.4 279.0 895.4 256.0 1 151.42012–13 155.2 485.4 284.6 925.2 256.0 1 181.22013–14 161.9 502.9 293.1 957.9 256.0 1 213.92014–15 170.4 525.5 306.1 1 001.9 256.0 1 257.92015–16 179.0 549.9 317.9 1 046.8 256.0 1 302.82016–17 188.2 573.8 333.1 1 095.2 256.0 1 351.22017–18 196.8 592.8 344.1 1 133.7 256.0 1 389.72018–19 205.2 608.6 353.2 1 167.0 256.0 1 423.02019–20 213.6 621.9 360.7 1 196.3 256.0 1 452.32020–21 222.0 634.6 367.9 1 224.5 256.0 1 480.52021–22 230.8 647.4 375.2 1 253.4 256.0 1 509.42022–23 239.7 659.6 382.1 1 281.3 256.0 1 537.32023–24 249.0 671.9 389.1 1 310.0 256.0 1 566.02024–25 258.8 684.4 396.2 1 339.4 256.0 1 595.42025–26 268.9 697.2 403.5 1 369.6 256.0 1 625.62026–27 278.5 709.1 410.3 1 397.9 256.0 1 653.92027–28 288.6 721.2 417.2 1 427.0 256.0 1 683.02028–29 299.0 733.5 424.2 1 456.8 256.0 1 712.82029–30 309.9 746.1 431.3 1 487.3 256.0 1 743.3
Annual average growth rate (per cent):2008–09 to 2029–30 4.0 2.7 2.2 2.8 0.0 2.2


• 59 •
References
Access Economics (2009), Business Outlook, September issue, Access Economics, Canberra.
BITRE 2008a, Air passenger movements through capital city airports to 2025–26, Working paper 72, Bureau of Infrastructure, Transport and Regional Economics, Canberra.
BITRE 2008b, Air transport services in regional Australia: trends and access, Report 115, Bureau of Infrastructure, Transport and Regional Economics, Canberra.
Monash University (2008), MMRF Model, Centre for Policy Studies and IMPACT Project, Monash University, Melbourne.
Treasury 2008, Australia’s Low Pollution Future: The Economics of Climate Change Mitigation, Commonwealth of Australia, Canberra.
Treasury 2009a, Budget 2009, Commonwealth of Australia, Canberra.
Treasury 2009b, Economic growth projections, as reported by Australian news paper, Australian Commonwealth of Australia, Canberra.
Treasury 2009c, Mid-Year Economic and Fiscal outlook 2009–10, Commonwealth of Australia, Canberra.


![[XLS]groupemail.nitrkl.ac.ingroupemail.nitrkl.ac.in/Files/InternetRegistration.xlsx · Web viewROHAN SARTAPE 415PH2105 MANORANJAN MANDAL 415PH2093 SARTHAK DASH 412CY5084 KOLLIPARA](https://static.documents.pub/doc/80x56/5ab56f197f8b9a156d8cd509/xls-viewrohan-sartape-415ph2105-manoranjan-mandal-415ph2093-sarthak-dash-412cy5084.jpg)


