Page 1
53
Report 3: Appendices
Appendix 1: Defining the Dry Zone
Available data for the Dry Zone is reported using a range of different extents for the Dry Zone; and in
some cases, national data are only available at the level of District or Region. Reference is made to
the following four different combinations of administrative areas, as shown in the figure below:
• Dry Zone (DZ) refers to the region as defined by MIMU (spatial data for extent downloaded
from www.themimu.info/ with 54 townships, including most of Nya Pyi Taw, Pyawbee and
Yamethin. This is the definition used in this study.
• Dry Zone (DZJ) refers to the region used in the JICA 2010 study, which includes 51 township
(excluding Pyabwe, Yamethin and Nya Pyi Taw).
• Dry Zone Divisions (DZD) refers to the 13 divisions of MMS, which incorporates some
additional townships in Shwebo, Monywa, Minbu and Kyaukse, plus all of Nay Pyi Taw. The
FAO Atlas (2005) reported mainly at Division level, but did not include Nay Pyi Taw.
• MMS refers to the three regions / states of Mandalay, Magwe and Sagaing. This is a
considerably larger area, including northern Sagaing and eastern and western areas of
Mandalay and Magwe respectively.
Page 2
54
Appendix 2: Agroecosystems mapping using MODIS and Landsat
Agro-ecosystems for the DZ were mapped at regional scale by IWMI (Rajah Ameer) using multi-
temporal satellite imagery. The method developed by IWMI for mapping irrigated areas, uses
multi-temporal MODIS data (250 m pixel) to identify cropping patterns based on vegetation
greening and senescence, represented using NDVI; and Landsat data (30 m pixel) to provide better
spatial definition.
• A time-series of 16-day MODIS composites (MOD13Q1) for 2 years (2009 – 10)– a total of 46
images.
• Landsat single date imagery: 11 scenes were needed to cover the area; to get cloud free
coverage, dates ranged from Jan 2009 to Oct 2010
The combined images were classified on the basis of seasonal greening patterns, to distinguish
between cropped areas and natural vegetation; single cropping and double cropping; and cropping
in different seasons. Stacked images were classified using ISO clustering unsupervised classification;
classes were grouped and labelled using NDVI time series, and validated against Google earth
imagery (see Figure 1). For agricultural classes, the following hierarchy was used:
The maps were compared with observed patterns of landcover in the DZ during field work in March
2013. In broad terms there appeared to be reasonable correspondence, although some areas of dry
season agriculture were not picked up in the mapping (for example, river-bed cropping in Mandalay
region).
The map should be considered as an exploratory product, which requires further validation.
More details of the methods being used by IWMI to map irrigated agriculture in Asia is given at
http://ccafs.cgiar.org/node/1751 and http://www.slideshare.net/spareeth/irrigated-area-mapping-
south-asia
Page 3
55
Figure A2.1: method used in deriving agro-ecosystems map
Page 4
56
Figure A2.2: final classified image with 11 classes.
Page 5
57
Appendix 3: Case studies of groundwater irrigation typologies
1. Monywa Groundwater Irrigation Project (Type 1)
The project was funded by UNDP and IDA and built upon pilot studies supported by the World Bank
from 1983-92 in Monywa, Chaung U and Budalin Townships of Sagaing Division. The primary aim of
the project was to increase crop production and farm incomes by expanding the irrigated area from
810 ha in the early 1980s to about 8,100 ha at project completion through the development of
groundwater resources. A secondary aim was to strengthen the capability and inter-agency
coordination of the institutions involved (World Bank, 1994).
The project area was selected from a larger area encompassing 5 Divisions on the basis of the
rainfall, agricultural production, groundwater conditions, water demand, soil type, flood risk and
accessibility (World Bank, 1983). Since 1995 WRUD has taken control of the scheme discharging
responsibility from DOI. The system as a whole is managed by WRUD with delegation of the running
of local pump operations to local farmers who have been given relevant training. Major
maintenance and repairs matters are handled by WRUD.
According to WRUD hydrogeologist, Mr U Tin Maung, the scheme currently comprises of 141 deep
tube wells and corresponding power supply infrastructure, pumping, water distribution and drainage
systems are fully functional and irrigating 6,360 ha (Figure A3.1), or around 45 ha per well on
average. The scheme is partitioned according to energy transfer as four electric circles (or rings),
whereby each ring is served by a specific transformer that services the transmission lines for a
particular ring.
The total cost of the project was estimated to be USD 21M. A large proportion of this went into
investments into transmission lines, transformers substation and load dispatching between the main
grids. Cost recovery was largely achieved by an indirect agricultural taxation through procurement of
'controlled' crops such as cotton, wheat and mung beans at below the crop export or import prices.
Since groundwater development has a low capital investment per unit area overall, but relatively
high O&M costs, the key economic issue is how to ensure that there are sufficient funds available to
sustain the project works. Water charges have been introduced to cover the O&M costs associate
with power, routine maintenance and repairs (World Bank, 1994). Nowadays, farmers across the
scheme universally pay a fee for irrigation water of 9000 Kyat per acre for wet paddy and 6000 Kyat
per acre for dry paddy. For other crops for all seasons the charge is 3000 Kyat per acre through a
Water User Group (WUG). Production from the scheme in terms of total area planted over the
period from 1995 to 2013 is 28% wet season paddy, 1% summer paddy and 71% non-paddy crops
(Water Resources Utilization Department, Monywa, unpublished data).
Local WRUD representatives quote the cost of single tube well to be 5M Kyat. The cost of the turbine
pump and electrical control system is 15M Kyat. Cost of the distribution system is 30M Kyat.
Electrical consumption from the turbine pump is 18.5 kW per hour to supply 2400 m3d
-1. The system
is designed for pumping of around 14 hours per day but currently pumps can be operated for longer
to meet water demands. Regular power shortages and poor reliability due to overloads on the grid
system create significant problems with delivery across the command areas.
Page 6
58
The irrigation well visited on electric circle 4 (no. 4/1) commands an area of 30 ha although around
25 ha is effectively under command (type 2 irrigation supplies the remaining command) (Figure
A3.2). The system comprises a 46m deep well with 10-inch casing with screen over two productive
intervals, pump delivering water to a main channel running along the upstream boundary which
drains into 13 laterals which are traversed by 8 minor canals; the 13x8 grid arrangement supports
104 individual plots. The target aquifers are at depths of around 12-18 and 37-40m. The well yield is
around 2400m3d
-1. An aquifer pump test was first conducted to assess the long term yield and to size
the command area. The double cropping system comprises of paddy for the wet season crop
followed by wheat, chickpea or onion for the second crop. The estimated crop water demand is
1200mm for paddy and 600 mm for other crops.
The aquifers targeted include an upper layer at 12-18m of unconsolidated brown/yellow sands
(Alluvial formation) overlying a lower layer of unconsolidated ‘blue sands’ of the Irrawaydian
formation at 37-40m. Both aquifers are under pressure. A superficial low productivity aquifer is also
present but is not targeted for commercial operations. The detailed project report by WRUD, (2005)
indicates that the quality of the pumped water at the time of construction was fresh (120 µScm-1
) –
other irrigation wells are more brackish at around 800 to 2400 µScm-1
. When classified for irrigation,
the groundwater presents a moderate salinity hazard and a low sodium hazard but considered
generally suitable for irrigation. However, the high salinity of water necessitated the provision of
drainage works under the project.
All of the famers who use the scheme are smallholders with holding ranging in size from <0.2 ha or
less through to >2 ha. Irrigation plans are developed through a committee comprising the famers
WUG and government representatives taking into account the projected water and energy
availability. At the tail-end of the command visited two private wells were in operation due to local
supply shortfalls.
When the project started there were 157 wells constructed and over time 16 wells (10%) have been
abandoned because the formation in these areas was unstable and extraction of fine sediments with
extraction caused collapse of the screen. Since implementation, around 15 Italian (FIMNET)
manufactured turbine pumps have been replaced with Indian (KSB) submersible pumps.
Sustainability reacted concerns were considered in the design of the scheme, and whilst accurate
estimates of water balance for the project area were not available crude estimates of sustainable
well-field capacity of 0.18 m was derived from hydrogeological investigations, which included the
natural discharge of groundwater to the Chindwin River situated around 3km to the downstream.
Monitoring well water level data from 16 wells suggest no deterioration although the duration of
monitoring up until reporting was limited to only 2 years (GDC, 1984). The visit to irrigation wells
suggested no major signs of over-exploitation, with the water levels in the shallow private wells that
tap only the upper aquifer, visible at the soil surface whilst the pumps were active. Water level
monitoring of the scheme had taken place in the past but has since been abandoned following the
breakdown of equipment. Operational performance is gauged independently. WRUD would value
the revival of the monitoring system for longer term planning that could address concerns about
climate change and advanced warning about land subsidence.
Page 7
59
Figure A3.1. Current layout of irrigation wells for the Monywa groundwater irrigation scheme
covering Monywa, Chaung U and Budalin Townships (Source: MOAI)
Figure A3.2. Pumphouse for community irrigation well 4/1 (the stilling tank before distribution is
evident to the left of the image)
Page 8
60
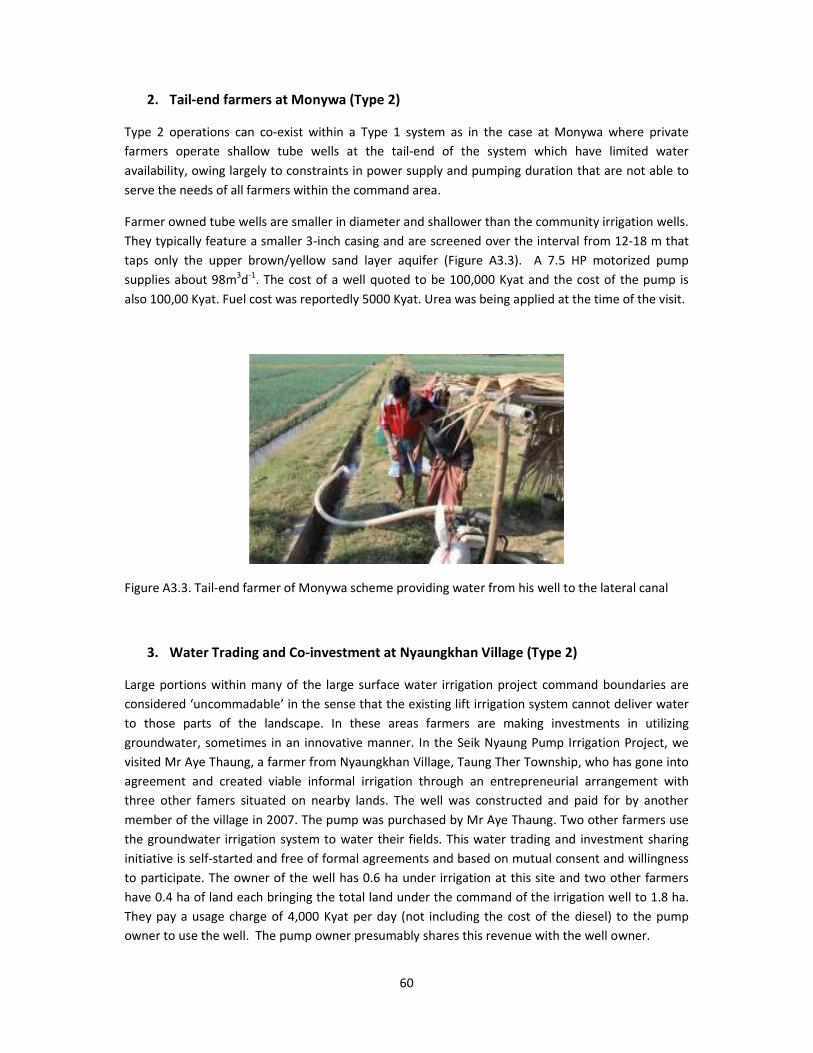
2. Tail-end farmers at Monywa (Type 2)
Type 2 operations can co-exist within a Type 1 system as in the case at Monywa where private
farmers operate shallow tube wells at the tail-end of the system which have limited water
availability, owing largely to constraints in power supply and pumping duration that are not able to
serve the needs of all farmers within the command area.
Farmer owned tube wells are smaller in diameter and shallower than the community irrigation wells.
They typically feature a smaller 3-inch casing and are screened over the interval from 12-18 m that
taps only the upper brown/yellow sand layer aquifer (Figure A3.3). A 7.5 HP motorized pump
supplies about 98m3d
-1. The cost of a well quoted to be 100,000 Kyat and the cost of the pump is
also 100,00 Kyat. Fuel cost was reportedly 5000 Kyat. Urea was being applied at the time of the visit.
Figure A3.3. Tail-end farmer of Monywa scheme providing water from his well to the lateral canal
3. Water Trading and Co-investment at Nyaungkhan Village (Type 2)
Large portions within many of the large surface water irrigation project command boundaries are
considered ‘uncommadable’ in the sense that the existing lift irrigation system cannot deliver water
to those parts of the landscape. In these areas farmers are making investments in utilizing
groundwater, sometimes in an innovative manner. In the Seik Nyaung Pump Irrigation Project, we
visited Mr Aye Thaung, a farmer from Nyaungkhan Village, Taung Ther Township, who has gone into
agreement and created viable informal irrigation through an entrepreneurial arrangement with
three other famers situated on nearby lands. The well was constructed and paid for by another
member of the village in 2007. The pump was purchased by Mr Aye Thaung. Two other farmers use
the groundwater irrigation system to water their fields. This water trading and investment sharing
initiative is self-started and free of formal agreements and based on mutual consent and willingness
to participate. The owner of the well has 0.6 ha under irrigation at this site and two other farmers
have 0.4 ha of land each bringing the total land under the command of the irrigation well to 1.8 ha.
They pay a usage charge of 4,000 Kyat per day (not including the cost of the diesel) to the pump
owner to use the well. The pump owner presumably shares this revenue with the well owner.
Page 9
61
The irrigation well is 30m deep and was drilled by manual percussion methods (Figure A3.4). It cost
400,000 Kyat at the time. The 18 HP diesel pump used was bought 4 years ago for 450,000 kyat. The
cost of a diesel gallon is 3,500 Kyat. On Mr Aye Thaung’s land, family labour is used. He grows 0.4 ha
of onions fringed with corn. The total input cost for this crop was 500,000 Kyat that covers costs of
fertilizer (Inorganic fertilizer and cow dung are applied), pesticides and fuel. He will irrigate according
to the plant water conditions as fuel is expensive. The crop requires 7 waterings over the life of the
crop and each watering takes 11 hours. Eleven litres of fuel are used in the process. The discharge
rate of the pump is 540 m3d
-1.
The quality of water is slightly brackish and the sodium content is sufficiently high. This creates
slaking of fine textured soil on the surface and problems with soil aeration, requiring seasonal
rotation to allow the soil to remediate naturally. In the monsoon tobacco is grown. Whist onions
fetch a higher price than tobacco, in recent times the price has become more unstable than tobacco.
Growing an easily perishable crop and also because of lack of savings, most of the time Mr. Thaung
similar to other typical farmers, is unable to wait for a good selling price. Mr Thaung owns 22.8 ha of
land in total, including 0.8 ha for paddy within the commadable area which he irrigates with surface
water.
Figure A3.4. Pumping into the distribution channel of the farmer who owns the pump set
Page 10
62
4. New private well owner at Tanpinkan Village, Taungtha Township (Type 2)
Mr Shwe Myaing constructed a new well four months before our visit, after years of working
with rainfed agriculture. He recently received a family inheritance, which he invested in
improving the water management of his farm. A deep well was needed, because of the upland
location of his farm, with a large diameter well to 6m and tube well to 55 m. The top few meters
of the well are in limestone, but the most productive layer is the ‘brown sands’ found at depth.
The total cost was 1.1 M kyat: 300,000 kyat for mechanical drilling of the well; 350,000 kyat for
the down-hole pump; and 350,000 kyat for a large diesel engine, purchased second hand.
The well irrigates a field of 0.5 ha (Figure A3.5). For the first irrigated crop, onions were planted;
when we visited, the crop was 1 month old. Land preparation took 1 month and cost 100,000
kyat. The soils are calcareous sands with low fertility, so cow dung and urea were applied. The
expected yield from this harvest is 3000 Viss (4890kg). The selling price at present is 300-400
kyat per Viss.
Mr Shwe Myaing previously produced sesame and some mung beans under rainfed conditions;
when the rains were good he was able to harvest 10 baskets (about 370kg) at most, but often
the crop failed. Access to irrigation means that it would be possible to produce watermelon for
export to China, with much higher potential returns. However, he chose to plant onions, like
many other farmers in the area, citing lack of experience and high risk as the main constraints.
Figure A3.5. The newly constructed deep well pumping water that is manually spread across the
first crop of onions
Page 11
63
5. Recession farming Sin Te Wa River (Type 4)
Recession farming on the dry riverbed of the Sin Te Wa River is practiced during the pre-monsoon
each year. Prior to the start of the dry season the concerned village committee distribute the
available land and each farmer receives an allocation of 0.2 ha. Temporary holes are dug in the sand
to a depth of a few tens of centimetres deep and sufficiently wide to accommodate direct access of
the irrigator to fill containers and the sand walls of the hole are supported by bamboo reinforcing
(Figure A3.6). Wells are quickly constructed within the matter if a few hours and are dug in grid-wise
distribution to minimize the energy expended in water distribution. The water table is within close
proximity to the surface and the irrigator typically uses dual watering cans to spread water to water
a few square meters of crop per application. A minimal number of famers use small motorized
pumps. The crop water demand in this treeless environment is high and the soil water storing
capacity is low making frequent waterings a necessity. Irrigation commences in the cool of the early
morning and by the middle of the day little activity is observed. The dominant crop is onions for the
local market, although groundnut can also be observed in the fringe areas where the water table
depth is sufficiently higher. The quality of water would appear to be good as onion is poor tolerance
to salinity. White precipitates evident on the surface of the drainage canals would appear to be urea
which as washed off from the plots and redeposited in concentrated form.
The farming practice is highly risky if the monsoon season begins earlier than normal (say in April or
before), then the crop will be destroyed and the farmers will lose everything. In the most recent
decade or so this has occurred in about one year in three.
Mr Shwe Myaing, the practicing Type 2 farmer described above, was until recently practicing Type 3
irrigation but came to be in a financial position to be able to invest in groundwater pumping
infrastructure to undertake dry season irrigation of his upland site and primarily chose to do so
because of the more assured harvest.
Figure A3.6. The entire Sin Te Wa River river bed is planted to onions during the dry season with
regular grid of seasonal dug wells also evident
Page 12
64
References
Groundwater Development Consultants (International) (GDC), 1984. Burma Umbrella Project:
Groundwater exploration and pilot development sub-project. Final Report. 3 Vols., Cambridge, UK
(Unpublished Report).
World Bank, 1983. Burma Groundwater Irrigation Project I - Staff Appraisal Report, Report No. 4323-
BA, South Asia Projects Department, Irrigation I Division.
World Bank, 1994. Burma Groundwater Irrigation Project I - Project Completion Report, Report No.
12891, Agriculture and Natural Resources Operations Division, Country Department I, East Asia and
Pacific Regional Office.
Page 13
65
Appendix 4: Current and past investments in water in the Dry Zone
Domestic and community water supply
Provision of safe water for communities is an important priority for both the Government of
Myanmar and international donors and NGOs. Nationally, ESCAP et al (2011) reported that 71% of
Myanmar’s population had access to an improved water source in 2008, up from 57% in 1990. The
IHLCA survey 2009-2010 estimated the proportion of the population with access to safe water
(defined as being within 1 km of a private tap water, public tap or stand pipe, tube well, bore hole,
protected hand dug well, protected spring / pond / rainwater) nationally as 69.4%: figures for the
Dry Zone states, shown in Table A4.1, indicate that the Dry Zone has made significant improvements
since 2005, so that only Magwe lags behind the national average. Shortages in the dry season are
widespread: in a study of 630 households in the Dry Zone by WFP (2011), a total of 24% experienced
shortages in the dry season.
Table A4.1 – access to safe drinking water (IHCLA 2010)
2010 2005
% of
population Poor
Non-
poor Urban Rural Total Total
Magwe 64.4 61.9 85.3 60.2 62.6 56.8
Mandalay 67.7 79.4 88.2 71.5 76.3 75.5
Sagaing 64.9 74.2 78.6 71.8 72.8 59.9
Myanmar 62.2 71.9 81.4 65.2 69.4 62.6
Rural water supply programs draw on a mixture of sources including shallow and deep tube wells,
gravity flow systems, tapping dam systems, piped water supply systems, improved dug-wells,
improved ponds and rain water collection tanks. The MICS 2010 survey (Table A4.2) indicates that in
rural areas, about a third of people draw their drinking water from protected wells, and another
third from tube wells, with only a small proportion (6.8%) using surface water sources. In many
villages, multiple sources are used seasonally: while drinking water is primarily from wells, water for
stock and washing is drawn from open ponds (in the wet season) or shallow wells (in the dry
season). Village ponds often dry out in the early stages of the dry season and villagers will then
revert to subsurface supplies that are more perennial in nature but may be quite remotely situated,
so water must be carted in tanks for up to 3-4 km.
Responsibility for rural water supplies is shared between the Department of Development Affairs
(DDA) in the Ministry of Progress of Border Areas, National Races and Development Affairs; the
Environmental Sanitation Department under Ministry of Health; and the Water Resource Utilization
Department (WRUD) of the Ministry for Agriculture and Irrigation (NCEA 2005). From 2000 – 2010,
DDA has implemented a 10 year Project for Rural Water Supply by Development Committees of
Sagaing, Magwe and Mandalay Divisions. JICA has provided assistance to this program under the
project of Rural Water Supply Technology in the Central Dry Zone (JICA 2007), which aimed to
construct and rehabilitate village tube wells, while strengthening the capacity of DDA in water supply
technologies. In parallel with this initiative Bridge Asia Japan completed construction and
rehabilitation of water facilities in 166 villages in Magwe and Mandalay in 2012.
Page 14
66
Table A4.2 MICS survey 2010
WRUD also has responsibility for construction and operation of infrastructure for water supply in
rural areas, and in 2013 reports 13,804 completed projects in Magwe – Mandalay – Sagaing (MMS)
providing water for 6.86 million people (http://wrud.moai.gov.mm/)). This includes provision of
piped and gravity-fed community water supplies, but the main focus is construction of groundwater
wells for village use, with more than 13,700 wells, both deep and shallow, constructed to provide
water for 6.65 million people.
Page 15
67
UN agencies (including UNICEF, UNDP, UN-Habitat and WHO) have worked with the government on
provision of water and sanitation in the Dry Zone since the 1970s, when a program was instituted to
construct 3100 tube wells in MMS. Currently, the UN is supporting provision of water supplies to
over 1700 villages in the Dry Zone, under the UNDP Human Development Initiative Integrated
Community Development Program and the UN Human Settlements Program “Shae Tot” (MIMU
WWW database, Nov 2012).
Non-government organisations, both local and international, are active in the water supply sector.
MIMU WWW database lists 12 organisations (excluding UN agencies) active in the areas of safe
water supply and construction and rehabilitation of water facilities in the Dry Zone in 2012, working
in more than 465 villages. Projects cover a range of approaches to water provision, including deep
tubewells for drinking water (eg JICA, Bridge Asia Japan); construction and renovation of multi-use
village ponds (ADRA, Proximity, ActionAid and others); piped village water supplies and rainwater
collection tanks (ADRA); affordable pumping technologies (Proximity).
Outcomes / lessons learnt
While recent progress has been impressive, the fact remains that more than 1 in 4 people in the Dry
Zone do not have access to a secure source of safe water. Lessons from past programs :
• JICA (2010) found that many existing rural water supply tube wells were in poor condition or not
functioning. They attribute this in part to poor siting and construction, and in part to lack of
trained engineers for operation and maintenance.
• Because hydrogeology of the area is not well characterised, siting of wells in large part
exploratory; yield and water quality cannot be assured before drilling
• The high cost of wells can drive communities to seek alternative lower cost supplies. JICA, (2010)
give the example of Mingan village, where villagers opted for the construction of a primary
school with roof rainwater collection facility instead of a deep tube well.
• Maintenance and desilting of ponds at least every 2-3 is critical to maintain viable volumes.
NGOs working in the Dry Zone have reported that regular maintenance is often neglected, which
means that more expensive and difficult renovation is then needed.
• Improving access to water (as well as availability) through piped systems, improved access points
and pumping for ponds (Proximity, ActionAid).
A critical lesson from current programs is the importance of embedding water into broader village
livelihood strategies, taking account of the full range of needs and users. ActionAid and ADRA have
developed participatory methods for working with communities to ensure that water interventions
are closely linked into village development plans, with clear delineation of responsibilities for
construction, operation and maintenance.
Water for agriculture
Responsibility for agricultural water supply lies with the Ministry of Agriculture and Irrigation
(MOIA), split between the Irrigation Department, responsible for surface water storages (dams and
weirs) and large canal command gravity fed irrigation schemes; and the Water Resources Utilisation
Department (WRUD), with responsibility for pumped irrigation projects (PIP), groundwater irrigation
and spate irrigation systems.
Page 16
68
The Government of Myanmar has prioritized irrigation development since the 1980s, with a major
program of construction and irrigation development. In 2000, the government set a national target
to make irrigation available for 25% of agricultural land (MOAI 2010), with an emphasis on provision
of irrigation for summer paddy. MOAI identified five priorities for irrigation development:
construction of new reservoirs and dams; renovation of existing reservoirs for raising storage
capacity and efficient delivery of irrigation water; diversion of water from streams and rivulets
during high water levels into adjacent ponds or depressions and for storage with sluice gates; lifting
of water from rivers and streams through pump irrigation; and the efficient utilization of ground
water (http://www.moai.gov.mm/). Estimates of total irrigated area in the Dry Zone (and nationally)
vary very widely. Table A4.1 summarizes estimates from different sources.
Irrigation Department – canal / storage irrigation
The Irrigation Department reports 89 irrigation schemes in MMS based on storage in dams or weirs,
with a total command area of about 344,257 ha (ID data, provided to IWMI 2013). These schemes
are mostly gravity fed, from a network of canals and include major schemes (>10,000 ha) at
Natmauk, Kyiohn-kyiwa, Mann Caung and Salin in Magwe; Kinde and Sinthe in Mandalay; and Ye-U
in Sagaing, downstream of the Thaphanseik dam. The Irrigation Department works include storage
dams, weirs, barrages, sluice gates, and canals for both irrigation and drainage, as well as flood
protection works in some areas (MOAI 2010).
WRUD - Pumped Irrigation Schemes
WRUD is responsible for irrigation schemes without formal storage, including pumped irrigation
projects (PIP) drawing on rivers; spate irrigation and small-scale water harvesting. Over 1000 small
scale irrigation works were completed in the Dry Zone during the 1980s; a review in January 2013
indicated that rehabilitation work is required in many of these for them to function effectively. Since
2000, there has been a focus on developing large pump irrigation projects (PIPs) with command
areas over 1000 acres (400ha), using high discharge pumps. WRUD has implemented 18 “Special
Project” schemes totalling over 71,000 ha in MMS; another 7 projects with total command area of
almost 50,000 ha are planned or under construction. Aside from the large “Special Projects”, WRUD
lists at total of 165 smaller schemes with an irrigable area of 67,000 ha completed; and 9 (5800 ha)
planned or under construction. Six spate irrigation projects were implemented in the Dry Zone as
part of UNDP HDI ICDP in 2003-7, irrigating around 300 ha.
WRUD – groundwater for irrigation
The widespread use of groundwater for irrigation in Myanmar began in 1989, with pilot trials funded
by UNDP and IDA at Monywa. The success of these trials resulted in development of large
groundwater projects at Monywa (141 wells serving 8094 ha) and the 99 Ponds project Yinmabin,
Sagaing (440 wells irrigating 3300 ha), which draws from artesian wells. Since 2008, WRUD in
collaboration with FAO has conducted a program to supply 800 tube wells for over 4450 ha in
Meiktila - Tharzi zone of Mandalay Region; and is conducting on-going drilling programs in artesian
aquifers in Sagaing and Mandalay regions. WRUD currently reports 6167 tube wells in MMS,
irrigating an area of almost 33,000 ha (http://wrud.moai.gov.mm/). The WRUD 30 year Master Plan
for the Dry Zone proposes installation of 1181 wells to provide irrigation for an additional 65,900
Page 17
69
acres (28125 ha). Private drilling and pumping from aquifers also occurs, though usually on a small
scale. The extent of private groundwater development is not known.
Non-government sector – agricultural water
Prior to 2010, NGO involvement in agricultural water was very limited, with most effort going to
village and community supplies (see above). The MIMU Who-What-Where (WWW) database lists no
projects in the sub-sector “Agricultural water” for 2009, but by 2012, there were 5 separate projects
under Agricultural Water. The majority (533) of the 599 villages targeted are under the UNDP HDI
project. In general, agricultural water supply is approached by NGO and donors as a component of
broadly based livelihood programs. HDI-IV Integrated Community Development Project (ICDP) and
the Community Development for Remote Townships Project (CDRT) both follow an integrated
approach, where water supply is one component of multi-sectoral community development.
Similarly, the CSEVI Shae Thot program is providing assistance and resources to communities to
contract local providers to build water infrastructure, as part of a broadly based program on health
and food security. Swanyee and MHDO (working with the Consortium of Dutch NGOs) are local
NGOs working on livelihoods, including water supply.
Lessons learnt
The performance of formal irrigation schemes has generally been sub-optimal. The actual area
irrigated is much lower than nominal command area. A government report released by the Auditor
General’s Office in 2012, found that “Sixty-seven river water pumping stations have achieved 16.3%
of their target, providing water to 48,833 acres out of the 299,895 acres originally planned”1, and
that some reservoirs and diversion dams could not supply water at all. The report recommended
that inefficient schemes be abandoned.
Anderson Consulting for LIFT (2011, 2012) conducted a comprehensive review of the efficiency and
effectiveness of PIPs in the Dry Zone and identified a large range of issues affecting performance,
including system design, operation and maintenance issues, availability of power for pumping, and
inappropriate siting and soils. Many of these problems, particularly relating to O&M, are common to
gravity-fed systems as well. In addition to technical problems, profitability is hampered by a lack of
flexibility (most systems are designed to grow rice under flood conditions, with little attention to
drainage, and are insufficiently flexible for other crops); and lack of extension of agronomic advice,
to assist farmers to make best use of irrigation.
These issues are compounded by inadequate funding and technical capacity for O&M. The
problems with O&M are illustrated by the rather startling statistic on the WRUD website
(http://wrud.moai.gov.mm/) , that of a total of 6436 positions allocated to WRUD nationally, only
2074 have been appointed; with the forlorn note that” 723 daily wage labourers are being employed
because of insufficient staff strength”. Village surveys and reports from other projects indicate the
generally poor performance of Water User Groups in water allocation and operation of schemes.
Although groundwater supplies only a small proportion of Irrigation (around 5%), use is increasing
more rapidly than for other sources. Much of this development is small-scale private investment,
1 http://www.mmtimes.com/index.php/national-news/1055-committee-urges-action-on-failing-irrigation-
projects.html
Page 18
70
observed, for example, during field visits in Monywa. The extent of private groundwater
development is not known.
Table A4.1: Irrigation schemes (storage / weir) estimated by different sources
Region District Irrigation Department FAO (2005) IWMI (2013) JICA (2010)
No. of
schemes ha ha ha ha
Magwe Magwe 13 35,561 36,360 10,861 20,358
Minbu 4 71,640 74,668 44,759 55,053
Thayet 5 12,570 3,571 5,873 20
Pakokku 15 13,569 5,969 12,168 793
Mandalay Kyaukse 4 85,655 96,594 6,321 46,237
Myingyan 15 15,500 10,346 29,007 6,016
Nyaung-U 1 81 41 6,833 0
Yamethin 9 24,996 72,751 3,493 -
Meiktila 5 5,775 71,216 10,763 34,854
Sagaing Sagaing 2 1,417 15,418 34,089 7,187
Shwebo 4 53,825 274,964 94,566 192,124
Monywa 14 23,668 23,348 8,608 19,467
TOTAL 91 344,257 685,246 267,342 382,110
Table A4.2: WRUD pumped irrigation schemes in MMS (http://wrud.moai.gov.mm/)
Special Project Electric Diesel Total
No of
sites
Irrigable
area (ha)
No of
sites
Irrigable
area (ha)
No of
sites
Irrigable
area (ha)
No of
sites
Irrigable
area (ha)
Sagaing Completed 5 30,958 11 10,530 40 14,016 56 55,505
Under
construction 3 26,305 1 223 2 1,489 6 28,016
Magwe Completed 4 13,355 24 18,335 23 3,157 51 34,846
Under
construction 2 5,261 2 647
- 4 5,908
Mandalay Completed 9 27,195 23 12,436 44 8,693 76 48,324
Under
construction 2 18,211 3 2,732 1 728 6 21,671
Total 25 121,284 64 44,902 110 28,084 199 194,270
Table A4.3: groundwater for irrigation in MMS (WRUD http://wrud.moai.gov.mm/)
Deep
Tube wells
Shallow tube
wells
Irrigable area
(ha)
Sagaing 880 1968 20999
Magwe 1298 - 4271
Mandalay 1346 675 7696
Total 3524 2643 32966
6167
Page 19
71
Watershed management / land and water degradation
Watershed management programs in the Dry Zone have been initiated in three different (but
related) contexts:
• Soil and water conservation programs at field scales to prevent erosion and loss of top soil,
with related declines in soil fertility, water-holding capacity and crop yields (eg Kahan 1997)
• Soil conservation and tree planting projects in small catchments to protect village water
supply dams and ponds from siltation and improve water quality
• Large scale catchment reforestation programs to protect infrastructure from impacts of
sedimentation, including siltation of reservoirs and clogging of irrigation canals by sand
The main causes of land degradation in the Dry Zone include deforestation (due to agricultural
expansion, commercial and illicit logging, and excessive cutting for charcoal and fuel wood), poor
agricultural practices, overgrazing, and shifting cultivation, all of which are exacerbated by
demographic pressures. Shifting cultivation is often cited as a major cause of deforestation; in 2002
the Forestry Department estimated that 22.8% of forested area in Myanmar was affected by shifting
cultivation (MoF 2005). However, evidence both from Myanmar and elsewhere (eg Lao PDR, see
Valentin et al 2008) indicates that it is shortening the period of fallow (usually due to population
pressure) that causes problems, rather than shifting cultivation per se. Traditional Taungya
methods, with sufficiently long rotations, can support the conservation of natural forest ecosystems
and biodiversity much more effectively than plantation monocultures (Khin Htun 2003, BEWC 2011).
Myanmar has one of the highest rates of deforestation in the world, estimated at 0.45 – 1 million ha
per year during the 1990s (BEWG 2011). Presently, less than 20% of the Dry Zone is under closed
forest and deforestation is continuing at a rapid rate. It is estimated that annual deforestation rate is
4.07% in Magwe Division, 1.48% in Mandalay Division and 0.68% in Sagaing Division respectively
(UNCCD 2005). Dry forests around the periphery of the Dry Zone are particularly under threat, with a
high proportion of degraded forests (Leimgruber et al 2005; NFI 2007). This is due in large part to
agricultural encroachment and intensification of shifting cultivation.
The problems of land degradation in the Dry Zone of Myanmar were recognized as early as the
1950s, when a Dry Zone rehabilitation project was initiated by the Agriculture and Rural
Development Corporation (ARDC) in collaboration with the FD. This comprise tree planting in
degraded lands. Watershed management activities are carried out primarily under the Forestry
Department (FD). Under the UNDP HDI program, watershed management programs were instituted
in the 1990s (Community Multi-purpose Fuelwood Woodlots; and Watershed Management for
Three Critical Areas) to attempt to reduce the rate of deforestation and related erosion and
degradation of land and water resources (Cools 1995). In 1995, Myanmar set a Forest Policy
objective to increase the area of Reserved Forest (RF) & Protected Public Forest (PPF) to 30% of total
land area by 2010. In 1994, the FD implemented a special "Greening Project" for the Nine Districts
of the Arid Zone and in 1997 the Dry Zone Greening Department (DZGD) was instituted to establish
forest plantations on degraded land, conserve the remaining natural forests, promote the use of
fuelwood substitutes and develop water resources (UNCCD 2005). DZGD proposed an integrated
plan for 30 years 2001-2031 covering land utilization, soil conservation, water resource
management, formation of forest plantation, natural forest management, training, research and
Page 20
72
extension, utilization of fuelwood substitutes, institutions and infrastructure development, policy
and legislation. In 2002, the FD began implementation of a Watershed Management Plan to protect
the catchment areas of 52 newly constructed dams, including those in the Dry Zone. The program
covers about two million hectares, of which 75% are already degraded and 50% are in a critical
condition.
Other agencies active in watershed management include the National Commission for
Environmental Affairs (NCEA) under the Ministry of Forestry, which in 2002-5 compiled a National
Action Plan to Combat Desertification under the UNCCD (MOF 2005). The Ministry of Agriculture
and Irrigation and the Department for Progress of Border Area and National Race are involved in
programs to decrease the incidence of shifting cultivation, through implementation of community
based NRM activities.
The UN has been active in watershed management programs, through the UNDP HDI program; and
the FAO programs on agricultural development and environmental management in the Dry Zone
during the 1990s (Cools 1995; Carucci 1999) and local and international NGOs. Cools (1995)
reported the use of a range of traditional SWC practices in the DZ (overflow bunds, gully plugging
with rocks or crop residues, strip cropping, agroforestry techniques); other promising approaches
include deep tillage, reduced tillage, zero tillage, mulching, planting basins and the use of crops with
low water requirement. Kahan (1999) provides a detailed manual of SWC techniques specifically
targeted for the DZ. Currently, FAO does not support programs in land and water management in
Myanmar (FAO Field Programme Activities database online http://bit.ly/12hsA4v).
Forest Resource Environmental Development and Conservation Association (FREDA), Japan Overseas
Forestry Consultants Association (JOFCA) and (JIFPRO) are cooperating with DZGD and FD in
restoring degraded forest lands. Renewable Energy Association Myanmar (REAM) is working on
renewable energy related services for rural development and environmental conservation in the
areas of fuelwood substitution and biogas utilization.
Lessons learnt
Cools (1995) demonstrated the positive economic returns from SWC measures in the Dry Zone at
farm level. He noted that farmers in the region have traditionally invested in a range of SWC
measures, but as farm sizes have decreased, low incomes and lack of savings have meant that for
many farmers, funds are not available for SWC. He concluded that external financial resources are
needed to implement SWC works on any significant scale. Landless and poor farmers could benefit
from employment in such schemes.
A review of Community Forest Programs in Myanmar found that their performance was adequate
but sub-optimal in terms of both forest regeneration and improving livelihoods; and that
sustainability, particularly in the case studies in Mandalay Region, was problematic (Kway Tint et al
2011).
Dry forests around periphery of the Dry Zone are particularly under threat from deforestation and
agricultural encroachment. Karin Luke (WHH) observed that in upland areas of Pauk, degradation is
at critical levels, with widespread gullying, loss of topsoil and changes in river morphology due to
large volumes of sand, which also clog irrigation canals, making them unusable. She concluded that
Page 21
73
community forest conservation and agroforestry projects had had a measure of success, but these
are at small scale, and there is an urgent need to scale up to regional or national level, since
degradation is beyond the level where it can be tackled by small projects.
Despite some major programs in watershed management, and a proposed DGDZ integrated plan for
30 years 2001-2031 covering forest conservation and land management, it is not clear either that
the programs have been effectively implemented, or that there has been a significant change in
rates of degradation.
Figure A4.1 Land use map of the Dry Zone based on satellite data from 1997 (from NFI 2007)
Page 22
74
References
BEWG (Burma Environmental Working Group) 2011. Burma's Environment: People, Problems,
Policies. Wanida Press, Chiang Mai. ISBN: 978-974-350-515-7
Cools, J.W.F. 1995. Agricultural development and environmental rehabilitation in the Dry Zone.
Farming Systems in the Dry ZOneFinal Mission Report. FAO MYA/93/004. FAO,Sleeuwijk, The
Netherlands.
FAO 2007. Brief on the National Forest Inventory, Myanmar. Forest Resources Development
Services. MAR-SFM Working Paper 23/ 2007. FAO Rome.
IHCLA-II (Integrated Household Living Conditions Assessment Project Technical Unit) 2011.
Integrated Household Living Conditions Survey in Myanmar 2009- 2010.
http://www.mm.undp.org/IHLCA/index.html
JICA 2007. The Project of Rural Water Supply Technology in the Central Dry Zone in the Union of
Myanamar. Inception Report. Kokusai Kogyo Co Ltd & Bridge Asia Japan.
JIC, 2010. The development study on sustainable agricultural and rural development for poverty
reduction programme inthe central dry zone of the Union of Myanmar. Report No. RDJR10-502,
Japan International Cooperation Agency.
Kahan, D. 2001. Dry Zone Farming Systems Study. FAO MYA/99/006 FAO,Yangon.
Khin Htun 2009. Myanmar Forestry Outlook Study. Asia Pacifif Forestry Sector Outlook Study II
Working Paper Series. Working Paper No. APFSOS II/WP/2009/07. FAO Bangkok.
Kyaw Tint, Springate-Baginsk, O. and Gyi, K.K.M. 2011. Community Forestry in Myanmar: Progress &
Potentials. Accessed online
http://www.burmalibrary.org/docs13/Community+Forestry+in+Myanmar-op75-red.pdf
Leimgruber, P., Kelly, D.S., Steinnger, M.K., Brunner, J., Muller, T., and Songer, M. 2005. Forest cover
change patterns in Myanmar (Burma) 1990–2000. Environmental Conservation, 32, pp 356-364.
doi:10.1017/S0376892905002493.
Ministry of National Planning and Economic Development and Ministry of Health, Myanmar, 2011.
Myanmar Multiple Indicator Cluster Survey 2009 - 2010 Final Report. Nay Pyi Taw, Myanmar.
Ministry of National Planning
MOAI (Ministry of Agriculture and Irrigation). 2010. Myanmar agriculture, water resources, statistics.
Available at: http://www.myanmar.gov.mm/ministry/agri/waterresources.htm
MoF (Ministry of Forestry) 2005. National Action Programme of Myanmar to combat desertification
in the context of the United Nations Convention to Combat Desertification. Ministry of Forestry,
Yangon.
NCEA. 2005. Myanmar National Environmental Performance Assessment, National Performance
Assessment and Subregional Strategic Environment Framework for the Greater Mekong Subregion
ADB T.A. No 6069- REG.
Page 23
75
Valentin, C., Agus F., Alamban, R., Boosaner A., Bricquet, J.P., Chaplot V., de Guzman, T., de Rouw,
A., Janeau J.L., Orange, D., Phachomphonh K., Phai Do, Podwojewski P., Ribolzi. O., Silvera, N.,
Subagyono K, Thiébaux J., Toan T., Vadari, T., 2008b. Runoff and sediment losses from 27 upland
catchments in Southeast Asia: Impact of rapid land use changes and conservation practices.
Agriculture, Ecosystems and Environment, 128: 225-238.
WFP (World Food Program) 2011. Food security assessment in the dry zone Myanmar. World Food
Program, Food and Agricultural Research Organisation
Page 24
76
Appendix 5: Piloting the ‘Golongan system’ in the Dry Zone
Water delivery schedule is defined by taking into account the relationship between water
availability, total irrigated area, and different stages of crop growth. At present, water delivery
schedule in irrigated area is defined primarily based on water availability linked to the total amount
of irrigated area (and to a certain extent electricity supply for pumping). Technically, if water is
available, total irrigation water discharge corresponds to the total irrigated area. In time of water
scarcity, however, total available discharge might not be able to irrigate the entire command area
with the required amounts of water. In irrigation management literature, scholars and practitioners
have introduced various ways to rotate water supply (in terms of irrigation turns and duration) to
cope with water scarcity issue. Nevertheless, effective rotation depends on existing technical
infrastructure as well as local institutions’ (WUAs, or other form of local institutions) ability to
implement and enforce the defined water distribution rules. As illustrated in our case study, unequal
water distribution in time of water scarcity often results in crop failures, conflicts among farmers in
general, and between head and tail-end farmers in particular. Lacking any clear and transparent
institutional arrangements, the water management committee and WRUD were unable to regulate
and coordinate farmer’s water taking activities.
Linking water delivery schedule with cropping calendar (cropping pattern), we can then divide
farmers’ fields into different groups so-called ‘golongan’. ‘Golongan system’ (Gruyter, 1933;
Pasandaran, 2010) as a rotation method was developed by Dutch engineers in Indonesia, as early as
in 1933 and is still effectively applied in modern day Indonesian irrigation during drought
management. Golongan system has two functions: 1) as a cropping system plan, aiming at
continuous provision of land for certain types of crops, therefore ensuring the level of crops
production; and 2) as a water distribution plan, aiming for efficient and fair distribution of water.
Golongan system refers to the staggering of planting dates successively among sections of irrigation
systems, early in the planting season. As part of the arrangements, each group of farmers’ fields
(grouped by irrigation canal) will start their cultivation in a specified period, with 2 weeks time
duration between the first and the second, and between the second and the third group. In this
way, we do not only reduce the irrigation peak water and labour demands, but we also reduce
institutional requirements to control and monitor the rotation schedule. As farmers would only take
water when their crops need it, farmers who started their cultivation later would not take water
before other farmers who started their cultivation earlier. In addition, the application of golongan
system would also reduce operation losses, in terms of acquiring minimum level of water storage in
irrigation canals, and reducing pumping frequency.
Page 25
77
Figure A5.1: Water allocation over time in golongan system
Source: van Maanen (1931)
Figure A5.1 gives an illustration of how the golongan system was visualized as a water distribution
plan. Here, water was allocated successively among sections of irrigation system to meet relative
demand of area irrigated of each section. The shades in this figure indicate water allocation to the
different golongan. In the beginning of the season water is given only to the first golongan, then to
the first and the second golongan, and later after the water is sufficient, it is given to all four
golongan. While the group composition/distinction of farmers fields fall within one golongan remain
the same, the first turn for irrigation water supply was rotated between the groups on annual basis.
Applying golongan system does not necessarily mean locking farmers to grow a certain type of crops
for the entire cropping seasons. The system is rigid in terms of seasonal arrangement, meaning that
once a group of farmers decided to grow a certain type of crops in the start of the planting season,
they have to stick to this decision, at least for that particular season. For the next planting season,
they can decide to grow another crop (i.e. rice, cassava) as long as they can come to common
agreement with each other. Technically, farmers in different golongan can also grow different crops.
In Indonesia, some farmers grow paddy and others sugarcane within one irrigation scheme. This
requires a lot of technical fine-tuning, but technically it is possible.
While this approach sounds like a straightforward one, it is based on several assumptions. First, it
can only be applied if farmers are cultivating the same crops (i.e. paddy) as each farmer fields group
has to have similar crop water requirement. Second, farmers in the same golongan have to stick to
the same cropping calendar. In practice, the application of golongan system also requires a lot of
technical information on the technical characteristics of the irrigation systems, and how this affect
the overall calculation in water delivery as to decide when to start with rotation schedule (i.e. at
which level does an irrigation system switch from continuous to rotational water supply; what is the
relevant ratio between supply and demand); the appropriate scale the rotation schedule can be
Page 26
78
applied (i.e. the total area of tertiary unit as both technical and organizational unit); and the link
between farmers’ fields and main system management.
To conclude, while golongan system provides an interesting entry point to improve water
management practices in the Dry Zone of Myanmar, a lot more of empirical studies (both technical
and institutional) need to be conducted before we can decide on the system’s applicability in
particular irrigation systems.