24
| Date post: | 10-Jan-2017 |
| Category: |
Documents |
| Upload: | jack-kiraly |
| View: | 27 times |
| Download: | 0 times |


Page intentionally left blank
!Introduction & Background
Climate Change is considered by many to be a complex, cross cutting issue that poses risks to
many environmental and economic system- including agriculture, infrastructure, ecosystems, and human
health- and presents a significant financial risk to the federal government. EPA has compiled g list of
potential impacts climate change can have on Superfund sites. Climate change, according to EPA, creates
a whole new set of vulnerabilities for Superfund sites. These vulnerabilities are exacerbated by increased
intensity of natural disasters, increased flooding, sustained changes to average temperatures, and sea level
rise. For the scope of this project, we will be looking at the potential impact of sea level rise on Superfund
sites. According to the U.S . Global Change Research Program's National Climate Assessment (NCA),
global sea level has risen by about 8 inches since reliable record keeping began in 1880, and is projected
to rise another 1 to 4 feet by 2100. The NCA also indicates that an "extreme" case for sea level rise could
include up to a 6.6 foot rise. Furthermore, according to the NCA, in the next several decades, storm surges
and high tides in the U.S. could combine with sea level rise and land subsidence to further increase
flooding in many coastal regions. The Environmental Protection Agency's (EPA) Superfund program,
authorized by the Comprehensive Environmental Response, Compensation, and Liability Act, is the
federal government's principal program to clean up hazardous waste sites. According to EPA, remedies at
contaminated sites may be vulnerable to the impacts of climate change.
Sites affected by sea level rise are not all active sites. Following the guidance of experts in the
field, sites taken off the list, those that have gone through EPA' s mitigation process, can still cause
problems for human and environmental health if inundated with seawater. The thought process behind
this is that although the sites' environmental and human health effects have been addressed, the mitigation
tools used at these sites might not be able to contain the contaminants if inundated with seawater. Erosion
can also cause an issue as it can release contaminants normally contained in soil or sediment. The release
of these contaminants can cause groundwater contamination where none existed before.
!Toxicology Background
Beginning this research project, the expectation ofthe team was that there is a clear rank order of
contaminants by the hazards they cause to human health. But through research and conversations with the
EPA, it is apparent that this is not the case. Each Superfund site is, and should be considered, unique. The
needs of one site can be vastly different from another, even if the mitigation efforts or source of
contamination are similar. Overall trends exist among Superfund sites; notably that sites close to
waterways tend to be industrial sites. But even amongst these sites, there is variation. It is the opinion of
the research team that due to the contextual nature of risk posed at each site, there cannot be one
standardized approach by the Federal government that will solve the needs at potentially impacted sites.
Varying levels of contamination, topographic information, types of contaminants, types of media where
the contaminants are found, and amount/type of mitigation efforts that have been pursued can all affect
the variable toxicology risks associated with each site.
Even though each site's level of risk is contextual, the EPA and other agencies have put together
resources for public use that focus on contamination levels. The first resource is the Regional Screening
1

Levels (RSLs) tables. The information found here is used by the EPA to determine the level of toxicity found in water supplies. Consulting Federal, state, and local water regulations can help determine the
level of risk associated with each site. The second resource is the Agency for Toxic Substances & Disease
Registry (A TSDR) toxicological profiles. This resource, maintained by the CDC, provides detailed
analysis of every contaminant identified at Hazardous Waste Sites. The linked documents range in detail,
with the larger, more abundant/dangerous contaminants being multiple hundreds of pages long. Finally,
the EPA provides documents associated with each Superfund site on the site's corresponding web
profiles. These profiles can be found through the EPA's advanced search function . Through each site's
profile, there are documents from Federal, state, local, and private contractors that detail the history of
each site, contaminants found at the site, and any and all mitigation efforts in place. These documents
provide in depth detail about the intricacies of each site. Using the above resources can help provide a fuller understanding of the toxicological risks associated with each site.
!Methodology
The charts featured in the appendix were crafted through Excel, and were calculated based on affected sites identified through ArcGIS analysis. The process of identifying sites through ArcGIS started
by downloading a elevation model and coastal elevation model through the United States Geological
Survey. Superfund Sites were then placed over this model, and sea levels were raised and finally a query
search was used to ID sites. These sites are only located along coastlines, and our process did not take into
account hydrological activity such as storm surges, rising rivers etc. Sites were then divided into three categories; currently on final NPL list, deleted from NPL list, and proposed for NPL list. Sites were
further broken down based on Category, followed by State and Category based on a 1 meter and 2 meter
rise in sea levels. The number of sites located within 1 mile and 5 miles of the coastline were also
included to show how many sites are within that range.
IThe Data
Preliminary research has indicated that there are 1782 sites on the National Priorities List (NPL),
with 1337 being labeled as active as of February 2014. Sea level rise will only affect sites on or near salt
water, therefore, we narrowed the number of sites in our dataset to just those in states on either the Atlantic, Pacific, or Gulf Coast. This gave us a new total of 984 potentially impacted sites. See Figure I
for a further breakdown of the sites by state. This rough estimate was further refined by narrowing down
the sites to just those within a "potentially affected range" of 5 miles from the coast. See Maps I & 2 in
the appendix for a visualization of all the sites within these buffer zones.
Each of the sites has an associated web page provided by EPA. The sites can be queried based on
location, contaminants, media, jurisdiction, and other information through the EPA's Superfund site
advanced search function. Using this tool, one can access information on each site. On each site's
individual web page, there is a breakdown of the site's status, as well as information (when available)
about contaminants and media present. Further analysis of the risks associated with specific sites will
involve narrowing down sites based on these contaminants and media. From our conversations with EPA,
there seems to be varying public health risks associated with each contaminants, based on its chemical compositions, the media it is present in, and how inundated the site will be with sea water.
2
!Scope of the Problem
Due to the limitations of data, and recommendations from experts in the fields of toxicology,
climate change, and Superfund site management, we deviated in our methodology from using feet-based measurements, to using meter-based measurements. The defining barrier has been in the data we have
access to. Using ArcGIS through American University, we have been able to download and manipulate
NPL data on Digital Elevation Models (DEMs) of the US. NPL data and models from various sources use
meters as the primary unit of measurement, which is reflected in the data that is publically available. See
Map 3 for a map of all the sites affected by a two meter rise in sea level, to see what a "worst case scenario" might look like
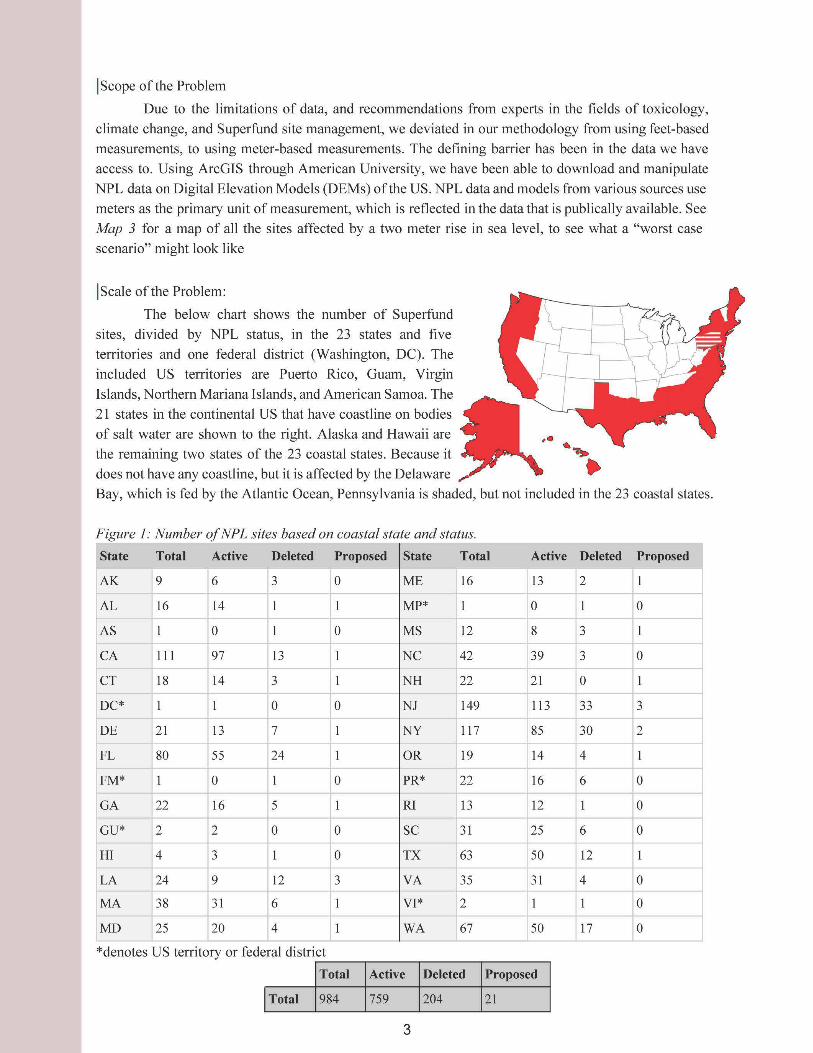
!Scale of the Problem:
The below chart shows the number of Superfund
sites, divided by NPL status, in the 23 states and five
territories and one federal district (Washington, DC). The
included US territories are Puerto Rico, Guam, Virgin
Islands, Northern Mariana Islands, and American Samoa. The
21 states in the continental US that have coastline on bodies of salt water are shown to the right. Alaska and Hawaii are
the remaining two states of the 23 coastal states. Because it
does not have any coastline, but it is affected by the Delaware
•• ·~ •
Bay, which is fed by the Atlantic Ocean, Pennsylvania is shaded, but not included in the 23 coastal states.
Figure 1: Number ofNPL sites based on coastal state and status.
State Total Active Deleted Proposed State Total Active Deleted Proposed
AK 9 6 3 0 ME 16 13 2
AL 16 14 r MP* 0 0
AS 0 0 MS 12 8 3 1
CA Ill 97 13 NC 42 39 3 0
CT 18 14 3 I I NH 22 21 0
DC* 0 0 NJ 149 113 33 3
DE 21 13 7 I: NY 117 85 30 2
FL 80 55 24 OR 19 14 4
FM* 0 1 0 PR* 22 16 6 0
GA 22 16 5 RI 13 12 0
GU* 2 2 0 0 sc 31 25 6 0
HI 4 3 0 TX 63 50 12
LA 24 9 12 3 VA 35 31 4 0
MA 38 31 6 VI* 2 0
MD 25 20 4 WA 67 50 17 0
*denotes US territory or federal district
Total Active Deleted Proposed
I Total 984 759 204 21
3

As seen here, there are a myriad of sites, all across the US and its territories. In total, 759 sites are
still active, meaning mitigation efforts have not been implemented, and EPA still recognizes the sites as having risks to human health and the environment. Of the 984 sites nationwide, 204 have been deleted from the NPL, meaning that mitigation efforts have been implemented and the site is contained. EPA
recognizes these sites as having met the mitigation criteria set at the beginning of the Superfund process. These sites are in no way "clean" of their contaminants, however. Mitigation means the effects have been greatly reduced. These sites should not be written off as being safe or resilient to the effects of seawater rise. Finally, there are 21 sites that have been proposed to the NPL, but EPA and state governments have
not completed environmental assessments as to put them on the NPL.
All of these 984 sites have different issues, dependent on the contaminants present and what
media those contaminants inhabit. The EPA categorizes each site based on the human health and groundwater risks present. Figure 2 below details how many sites are fully under control (including those
without groundwater contamination), are mixed (meaning either groundwater or human health risk are not under control), are not under control, or there is insufficient data.
Figure 2: Number of sites by status of health and environmental risks.
Under Control Mixed Control Not Under Control Insufficient Data
I #of Sites 705 91 27 161
Note: There are 76 ''Under Control" sites and 6 ''Not Under Control" sites that have no Groundwater
contamination. This does not mean they are not susceptible to seawater inundation.
It's reasonable to assume that not all Superfund sites are found on the coast. Coastal states are
large, diverse regions, and many Superfund sites are found outside of coastal areas. However, many Superfund sites can be found within five miles ofthe coast. Due to the need of some industrial facilities to
be near bodies of water, there are a number of Superfund sites within a 1 and 5 mile buffer of the coastline. The choice of 1 and 5 is arbitrary, and is only meant to give a simple gauge for how many sites are close to the coastline. Figure 3 provides an overview of the number of sites in each coastal state,
within a one mile and a five mile buffer zone. This list does not include territories, because of the assumption that because all are islands, all sites will be affected by the cross-cutting effects of climate change.
4
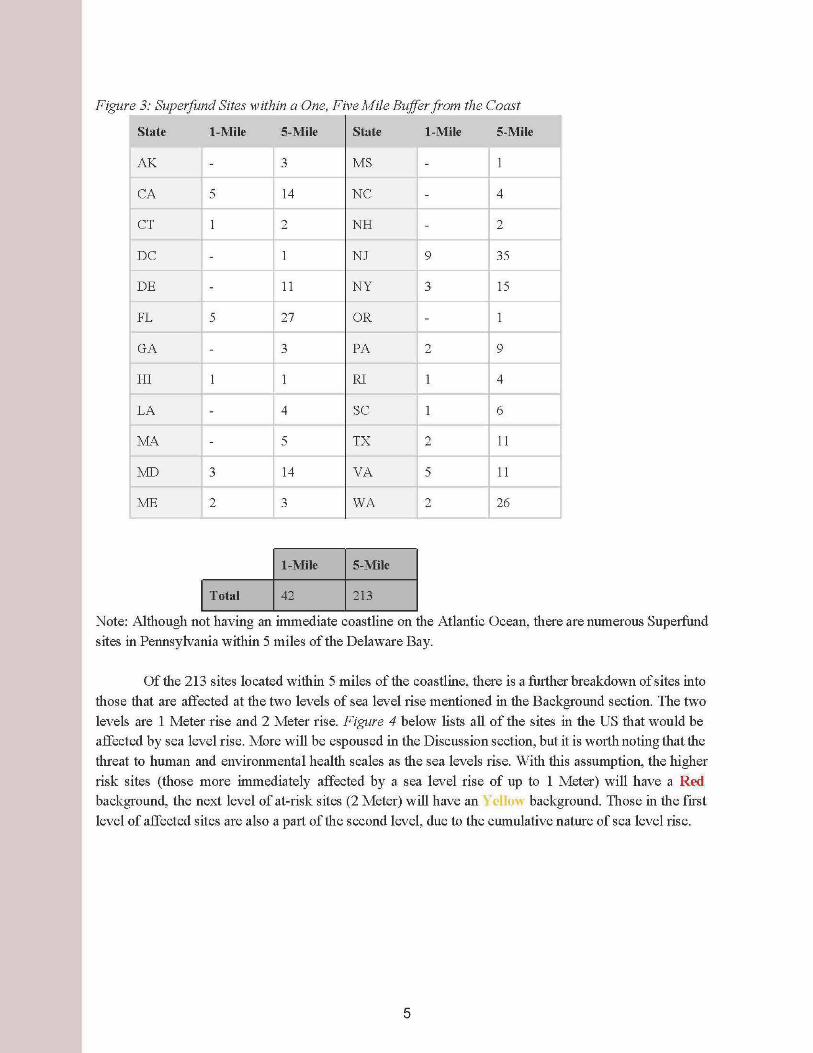
Figure 3: Superfund Sites within a One, Five Mile Buffer from the Coast
State 1-Mile 5-Mile State 1-Mile
AK I - 3 MS
t= CA 5 14 NC 4
CT 2 NH 2
DC
f : NJ 9 35
DE 11 NY 3 15
FL 5 27 OR
GA 3 PA 2 9
HI RI 4
LA 4 sc 6
MA 5 IX 2 11
MD 3 14 VA 5 11
ME 2 3 WA 2 26
1-Mile 5-Mile
I Total 42 213
Note: Although not having an immediate coastline on the Atlantic Ocean, there are numerous Superfund
sites in Pennsylvania within 5 miles of the Delaware Bay.
Of the 213 sites located within 5 miles of the coastline, there is a further breakdown of sites into
those that are affected at the two levels of sea level rise mentioned in the Background section. The two
levels are 1 Meter rise and 2 Meter rise. Figure 4 below lists all of the sites in the US that would be
affected by sea level rise. More will be espoused in the Discussion section, but it is worth noting that the
threat to human and environmental health scales as the sea levels rise. With this assumption, the higher
risk sites (those more immediately affected by a sea level rise of up to 1 Meter) will have a Red background, the next level of at-risk sites (2 Meter) will have an , background. Those in the first
level of affected sites are also a part of the second level, due to the cumulative nature of sea level rise.
5


Page intentionally left blank

!Case Study
Site name:
Location:
Latitude:
Longitude:
Date added to NPL:
NPL Status:
Background
LCP Chemicals, Inc.
Linden, Union County, New Jersey
40°36'29.90"N
74°12'41.90"W
February 25, 2014
Final
The following description of the LCP
Chemicals, Inc. site (hereby referred to as "the Site") is
the official background provided by the EPA:
''The LCP Chemicals, Inc. (LCP) site is located in Linden, New Jersey. The property was
originally a portion of a larger industrial complex with chemical manufacturing
operations. In 1955, GAF Corporation constructed and began operating a chlor-alkali
(chlorine manufacturing) plant on the property. Operations continued through the
mid-1980s. Sampling of soil, surface water, sediment and groundwater found elevated
levels of mercury and other contaminants. Site investigations and a feasibility study were completed in 2013. In February 2014 EPA selected a remedy for the site."
According to the Record of Decision for the Site, the main source of contamination is found in a
300,000 cubic yard area of anthropogenic fill. The thickness of the fill ranges from 0.7 feet to 17 feet,
with an average thickness of about 9 feet. The fill contains a mix of soil, ash, and debris from the
industrial site. Beneath the fill is a tidal marsh, created from the deposition of materials from the
surrounding bodies of water. Groundwater is found under these tidal marsh deposits.
Investigation into the human health and ecological hazards associated with the Site began in
November 1985. Following nearly 30 years of studies and mediation efforts, the Site was added to the
NPL on February 25,2014, after review by the EPA. The Site is listed on the Final NPL list, meaning it is
still an active site, with remedial efforts underway. According to the Site profile provided by the EPA, the human health risks associated with the Site are Under Control. The groundwater contamination, however,
is Not Under Control.
Contaminants After viewing Site documents provided by the EPA under the site profile, there are a number of
contaminants found at the Site. The main contaminant is mercury, in the form of mercuric sulfide. Over
the 26 acre site, mercury is found at a level of over 650 milligrams/kilogram of soil (mg/kg). In the local
9

11
Appendix of Charts and Maps

12Appendix
Superfund Sites 1 Mile From Mainland Coastline
Map 1: Of the 984 Superfund Sites in coastal States, there are 82 sites that fall within 1 mile from the coastline.

13Appendix
w ~ I-' (/)
Superfund Sites 1 Mile from Coastline
MA ME
Rl -NJ
NY DE MD PA
VA FL sc TX CA
HI -AK . WA GA .
0 4 8
Number of Sites
- STATE
12 16
Graph 1: This breakdown shows that Washington and New Jersey have the most Superfund Sites one
mile from the coastline.
14Appendix
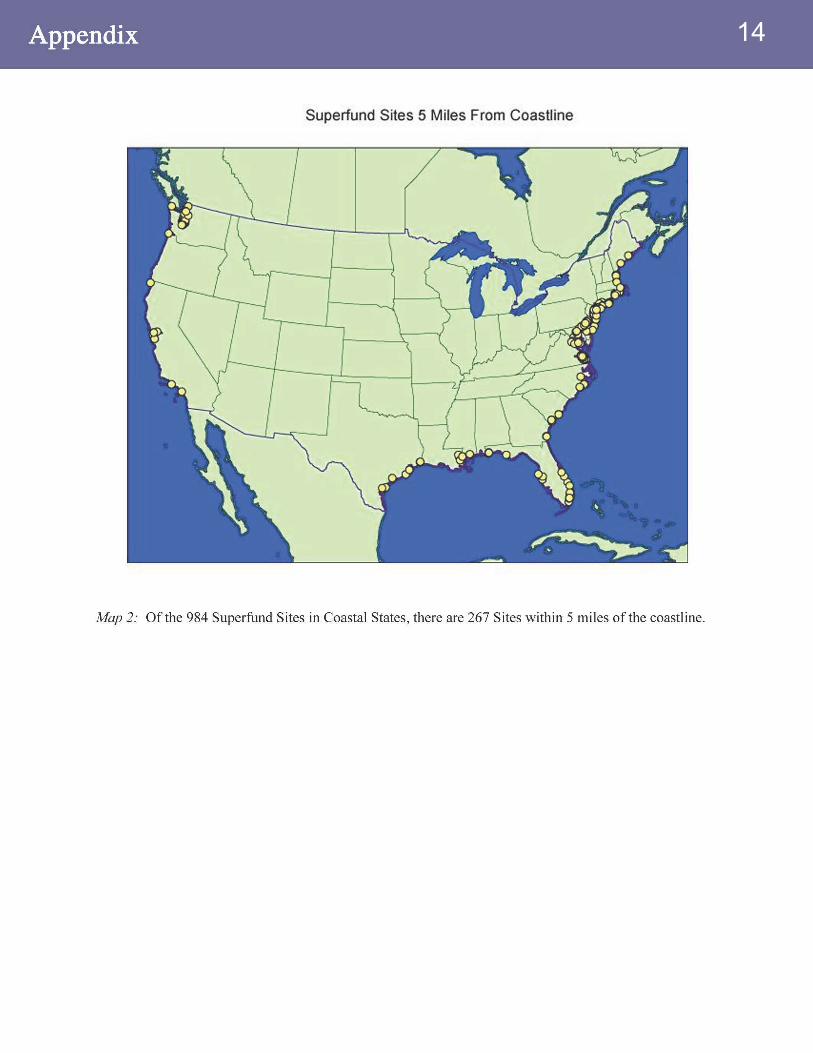
Superfund Sites 5 Miles From Coastline
Map 2: Of the 984 Superfund Sites in Coastal States, there are 267 Sites within 5 miles ofthe coastline.
15Appendix
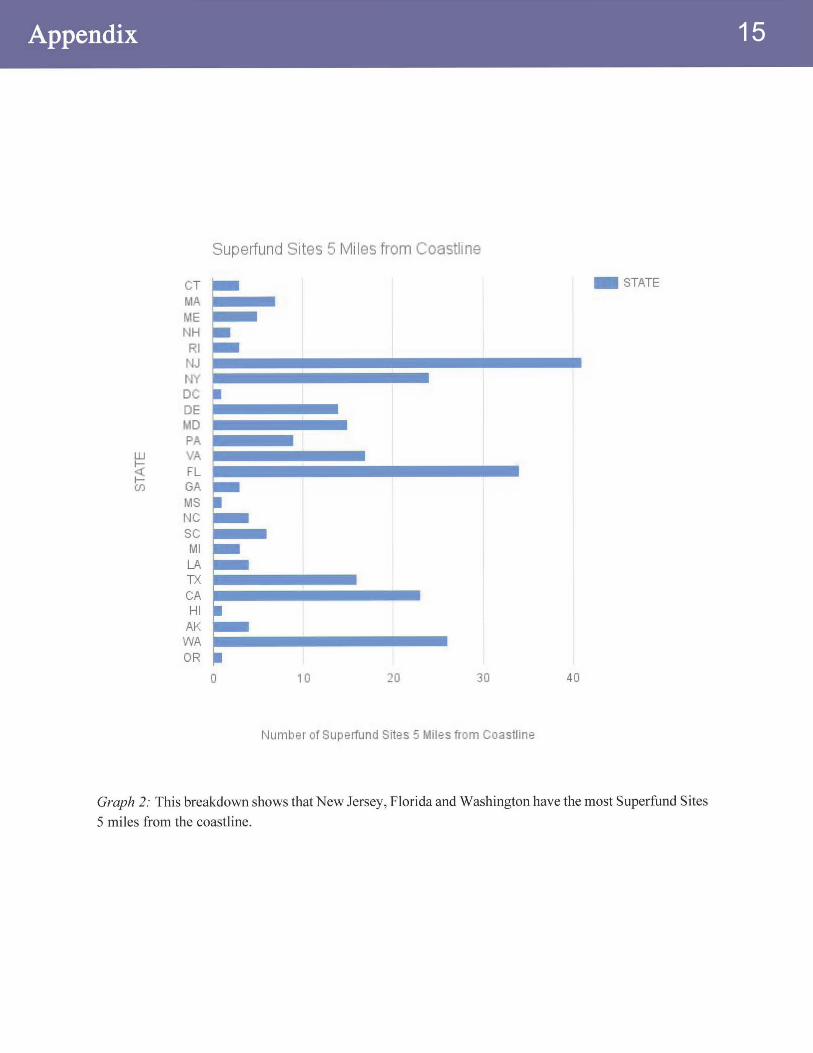
Superfund Sites 5 Miles from Coastline
CT - STATE MA ME NH Rl NJ NY DC DE MD PA
w VA ~ FL 1- GA (/)
MS NC sc Ml LA TX CA HI
AK WA OR
0 10 20 30 40
Number of Superfund Sites 5 Miles frorn Coastline
Graph 2: This breakdown shows that New Jersey, Florida and Washington have the most Superfund Sites
5 miles from the coastline.

16Appendix
Affected Superfund Sites from a 2 Meter Rise in Sea Levels
Map 3: In total , there are 68 affected sites that would be affected by a 2 meter rise in sea levels, most of
those sites (51) are currently on the final NPL list. Sixteen sites have been deleted from the final NPL list,
and one site proposed for the NPL list would be affected by a 2 meter rise in sea levels.
17Appendix
~ Q)
-.J
"' Q) (/)
.s Q)
- ~ '-Q)
~ C'\J
60
45
30
15
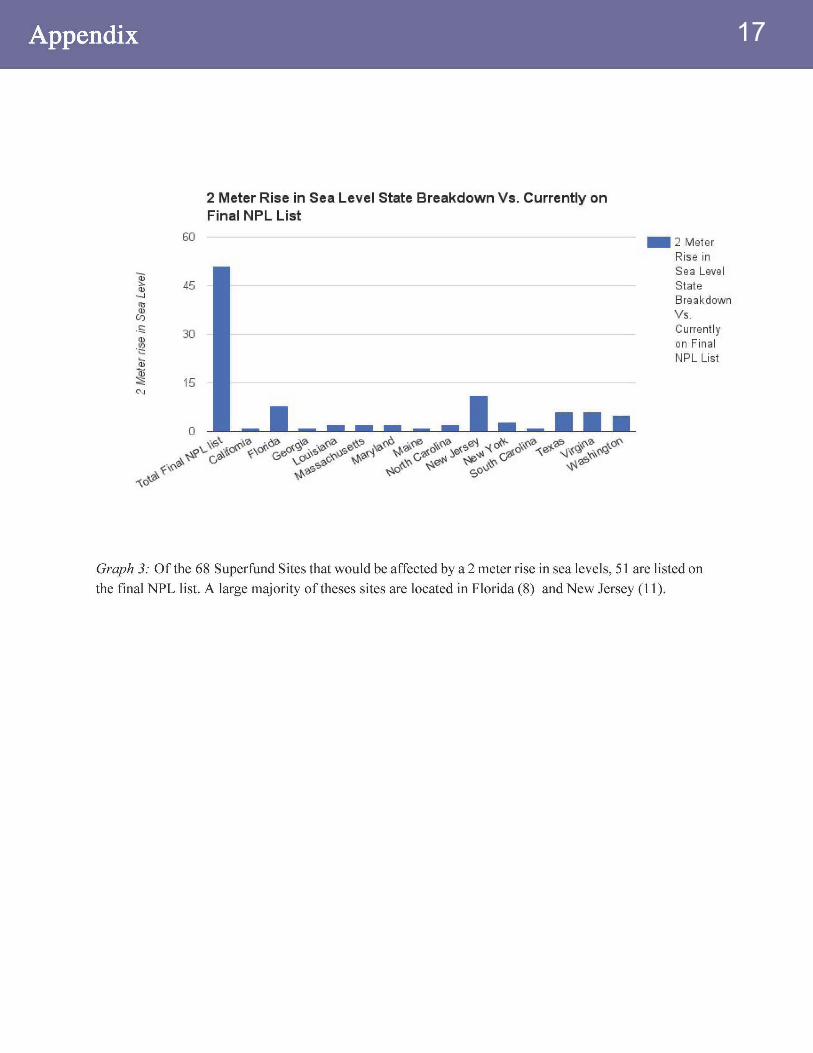
2 Meter Rise in Sea Level State Breakdown Vs. Currently on Final NPL List
- 2 Meter Rise in Sea Level State Breakdown V s. Currently on Final NPL Li st
Graph 3: Of the 68 Superfund Sites that would be affected by a 2 meter rise in sea levels, 51 are listed on
the final NPL list. A large majority of theses sites are located in Florida (8) and New Jersey (11 ).

18Appendix
20
2 Meter Rise in Sea Level State Breakdown Vs. Currently Deleted from NPL List
- 2 Meter Rise in Sea Level State Breakdo ...
Graph 4: The above charts list the number of deleted NPL sites that would be affected by a 2 meter rise in
sea level. Depending on the type of contaminant, these sites could sti II pose a risk to human health and the
environment. Of all the 2 meter rise sites identified, Georgia has the only proposed superfund site that
would be affected by a 2 meter rise in sea levels.

19Appendix
Affected Superfund Sites from a 1 Meter Rise in Sea Levels
Map 4: The map above shows superfund sites that would be affected by a 1 meter rise in sea levels. See
below for site breakdown.

20Appendix
24
18
12
6
a
1 Meter Rise in Sea Level
Currently on Final NPL list
Deleted from the Final NPL
li st
Proposed for NPL li st
Total Sites Affected
- 1 Meter Rise in Sea Level
Graph 5: This graph shows the number of total affected sites resulting in a one meter rise in sea level
across the United States. The graph is broken down based on cleanup status of affected sites, which are described as followed. A site that is currently on the final National Priorities List is determined to pose a
real or potential threat to human health and the environment after completion of hazard ranking system screening and public solicitation of comments about the proposed site. A site that is deleted from the
National Priorities List occurs when site cleanup goals have been met and no further response is necessary
at the site. Any site deleted from the NPL remains eligible for Fund-financed remedial actions in the unlikely event that conditions at the site warrant such action" (EPA). A site proposed for the NPL is done
so due to contamination by hazardous waste and identified by the Environmental Protection Agency (EPA) as a candidate for cleanup because it poses a risk to human health and/or the environment.
In total, there are 22 affected sites identified in this analysis, most of those sites (17) are currently on the
final NPL list. Four sites have been deleted from the final NPL list, and one site proposed for the NPL list
would be affected by a 1 meter rise in sea levels. The figure below further breaks down these identified
sites by State.

21Appendix
Hawaii
- Alaska ~
0: Massachusetts ::;::
New Jersey In ~ Virginia ;;:: 0
i;- Florida ;;::
~ South Carolina 0
Louisiana
Washington
1 Meter Rise in Sea Level State Breakdown vs. Currently on Final NPL list
0 1.5 3 4.5
1 Meter Rise in Sea Level State Breakdown
6
- 1 Meter Rise in Sea Level State Breakdo .. .
Graph 6: Of the 17 sites listed on the final NPL list, a majority of them can be located in two States,
Washington and New Jersey. Each State has 5 Superfund sites currently listed on the final NPL list and
are within range of a 1 meter rise in sea level.

22Appendix
2
0
1 Meter Rise in Sea Level State Breakdown vs. Deleted from NPL Sites
Louisiana Texas Washington
Deleted from NPL Sites
- 1 Meter Rise in Sea Level State Breakdo .. .
Graph 7: The above charts list the number of deleted NPL sites that would be affected by a 1 meter rise in
sea level. Depending on the type of contaminant, these sites could still pose a risk to human health and the
environment. Of all the 1 meter rise sites identified, Georgia has the only proposed Superfund site that
would be affected by a 1 meter rise in sea levels.


