REPORTS OF THE TIBOR T. POLGAR FELLOWSHIP PROGRAM, 2013 David J. Yozzo, Sarah H. Fernald and Helena Andreyko Editors A Joint Program of The Hudson River Foundation and The New York State Department of Environmental Conservation December 2015
Transcript
REPORTS OF THE TIBOR T. POLGAR
FELLOWSHIP PROGRAM, 2013
David J. Yozzo, Sarah H. Fernald and Helena Andreyko
Editors
A Joint Program of The Hudson River Foundation
and The New York State Department of Environmental Conservation
December 2015
iii
ABSTRACT Eight studies were conducted within the Hudson River Estuary under the auspices of
the Tibor T. Polgar Fellowship Program during 2013. Major objectives of these studies
included: (1) reconstruction of past climate events through analysis of sedimentary
microfossils, (2) determining past and future ability of New York City salt marshes to
accommodate sea level rise through vertical accretion, (3) analysis of the effects of nutrient
pollution on greenhouse gas production in Hudson River marshes, (4) detection and
identification of pathogens in aerosols and surface waters of Newtown Creek, (5) detection of
amphetamine type stimulants at wastewater outflow sites in the Hudson River, (6)
investigating establishment limitations of new populations of Oriental bittersweet in
Schodack Island State Park, (7) assessing macroinvertebrate tolerance to hypoxia in the
presence of water chestnut and submerged aquatic species, and (8) examining the
distribution and feeding ecology of larval sea lamprey in the Hudson River basin.
v
TABLE OF CONTENTS Abstract ............................................................................................................... iii
Preface ................................................................................................................. vii
Fellowship Reports
Pelagic Tropical to Subtropical Foraminifera in the Hudson River: What is their Source? Kyle M. Monahan and Dallas Abbott .................................................................. I-1 Sea Level Rise and Sediment: Recent Salt Marsh Accretion in the Hudson River Estuary Troy D. Hill and Shimon C. Anisfeld .................................................................. II-1 Nutrient Pollution in Hudson River Marshes: Effects on Greenhouse Gas Production Angel Montero, Brian Brigham, and Gregory D. O’Mullan ............................... III-1 Microbial Agents of Concern Detected in Water and Air at the Hudson River Estuary Waterfront Sherif Kamal and M. Elias Dueker ...................................................................... IV-1 Occurrence and Ecological Effects of Amphetamine Type Stimulants in Wastewater Effluent Alexis M. Paspalof, Daniel Snow, and Emma Rosi-Marshall ............................. V-1 The Distribution of Invasive Celastrus Orbiculatus in an Anthropogenically Disturbed Riparian Ecosystem Shabana Hoosein and George Robinson .............................................................. VI-1 Hypoxia Tolerance of the Invertebrates Associated with Water-Chestnut Beds (Trapa natans L.) in the Hudson River Mariana Carolina Teixeira and David L. Strayer ................................................. VII-1 The Distribution and Feeding Ecology of Larval Sea Lampreys in the Hudson River Basin Thomas M. Evans and Karin E. Limburg ............................................................ VIII-1
vii
PREFACE
The Hudson River estuary stretches from its tidal limit at the Federal Dam at Troy, New
York, to its merger with the New York Bight, south of New York City. Within that reach,
the estuary displays a broad transition from tidal freshwater to marine conditions that are
reflected in its physical composition and the biota its supports. As such, it presents a major
opportunity and challenge to researchers to describe the makeup and workings of a complex
and dynamic ecosystem. The Tibor T. Polgar Fellowship Program provides funds for
students to study selected aspects of the physical, chemical, biological, and public policy
realms of the estuary.
The Polgar Fellowship Program was established in 1985 in memory of Dr. Tibor T.
Polgar, former Chairman of the Hudson River Foundation Science Panel. The 2013 program
was jointly conducted by the Hudson River Foundation for Science and Environmental
Research and the New York State Department of Environmental Conservation and
underwritten by the Hudson River Foundation. The fellowship program provides stipends
and research funds for research projects within the Hudson drainage basin and is open to
graduate and undergraduate students.
viii
Prior to 1988, Polgar studies were conducted only within the four sites that comprise
the Hudson River National Estuarine Research Reserve, a part of the National Estuarine
Research Reserve System. The four Hudson River sites, Piermont Marsh, Iona Island, Tivoli
Bays, and Stockport Flats exceed 4,000 acres and include a wide variety of habitats spaced
over 100 miles of the Hudson estuary. Since 1988, the Polgar Program has supported
research carried out at any location within the Hudson estuary.
The work reported in this volume represents the eight research projects conducted by
Polgar Fellows during 2013. These studies meet the goals of the Tibor T. Polgar Fellowship
Program to generate new information on the nature of the Hudson estuary and to train
students in estuarine science.
David J. Yozzo
Henningson, Durham & Richardson Architecture and Engineering, P.C.
Sarah H. Fernald
New York State Department of Environmental Conservation
Helena Andreyko
Hudson River Foundation for Science and Environmental Research
I-1
PELAGIC TROPICAL TO SUBTROPICAL FORAMINIFERA IN THE HUDSON RIVER: WHAT IS THEIR SOURCE?
A Final Report of the Tibor T. Polgar Fellowship Program
Kyle M. Monahan
Polgar Fellow
Institute for a Sustainable Environment Clarkson University Potsdam, NY 13676
Project Advisor:
Dallas Abbott Lamont–Doherty Earth Observatory
Columbia University Palisades, NY 10964
Monahan, K. M. and D. H. Abbott. 2015. Pelagic Tropical to Subtropical Foraminifera in the Hudson River: What Is Their Source? Section I: 1-19 pp. In D.J. Yozzo, S.H. Fernald and H. Andreyko (eds.), Final Reports of the Polgar Fellowship Program, 2013. Hudson River Foundation.
I-2
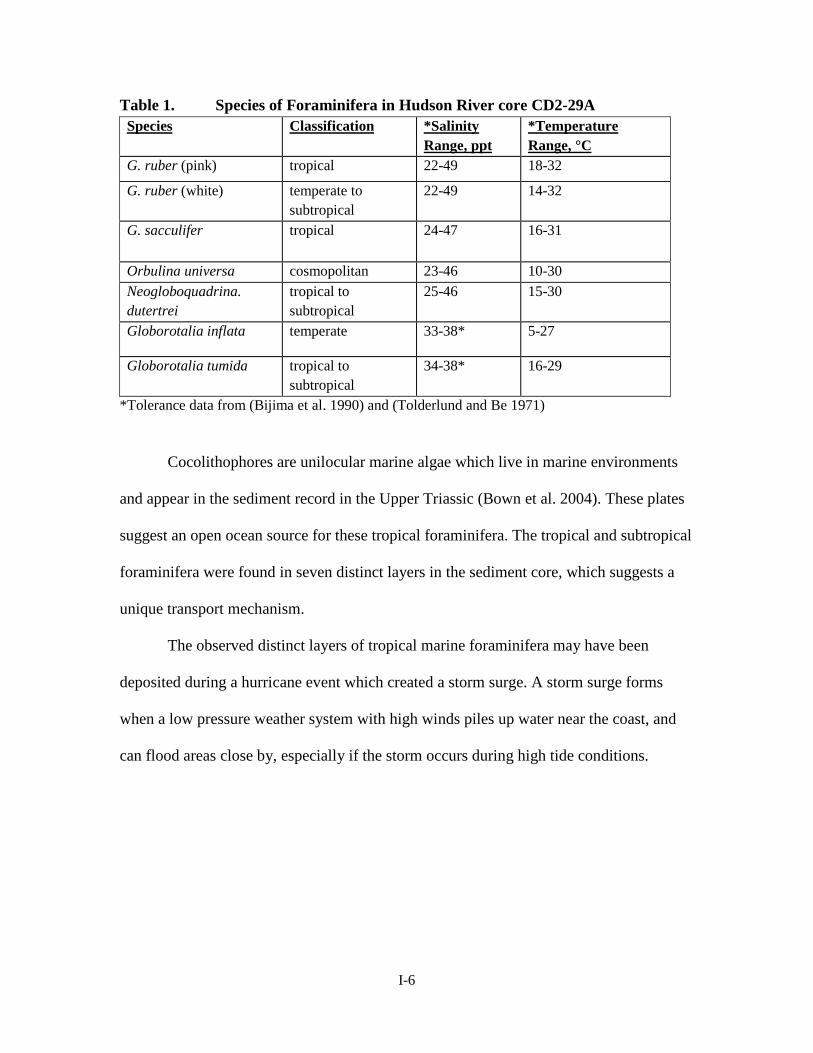
ABSTRACT
Reconstruction of past climate events in the Hudson River basin is useful to
calibrate historical records, and increasingly important in light of recent hurricane
impacts on the area. The concentration of radiogenic nuclides such as Cs-137 and Pb-210
can be used as a sediment dating technique (Bopp and Simpson 1989), but do not provide
historical climate data intrinsically. Microfossil identification was used, which provides
δ18O reconstructions and species specific tolerance ranges. Sediment samples from three
Hudson River sediment cores were sieved and picked for microfossils. Discrete layers of
marine pelagic foraminifera were found in one core, CD02-29A and replicated in CD02-
13. Tropical foraminifera species such as Globigerinoides ruber (pink) dominate the
assemblages from CD02-29A. Dating estimates of the cores were provided by Pb-210
and Cs-137 profiles. Pending carbon-14 dates from CD02-29A and CD02-13 will provide
more robust sedimentation rate assessments, and future hurricane event correlations.
*Tolerance data from (Bijima et al. 1990) and (Tolderlund and Be 1971)
Cocolithophores are unilocular marine algae which live in marine environments
and appear in the sediment record in the Upper Triassic (Bown et al. 2004). These plates
suggest an open ocean source for these tropical foraminifera. The tropical and subtropical
foraminifera were found in seven distinct layers in the sediment core, which suggests a
unique transport mechanism.
The observed distinct layers of tropical marine foraminifera may have been
deposited during a hurricane event which created a storm surge. A storm surge forms
when a low pressure weather system with high winds piles up water near the coast, and
can flood areas close by, especially if the storm occurs during high tide conditions.
I-7
Figure 1. SEM photomicrographs of pelagic foraminifera from Hudson River
cores. Top left: G. ruber (pink) from CD2-29A. Top right: Magnification of the black box in the figure to the left, showing coccoliths cemented onto the foraminiferal test. Bottom left: pelagic marine foraminifer from VM32-2. Bottom right: two coccoliths from area of foraminifer in box. Photo credits: Dee Breger, Micrographic Arts, Greenfield, NY.
Storm surges can form from both Nor’easters and hurricanes (tropical cyclones).
Warm core rings from the Gulf Stream travel to 40°N and contain tropical foraminifera
(Ruddiman 1969). Under most circumstances, warm core rings stay on the outer shelf.
The strong onshore winds and less intense rainfall produced by a hurricane whose eye has
its landfall south of the Hudson River (like Hurricane Sandy), could help to move warm
core rings from the outer shelf onto the inner shelf and subsequently into the Hudson. In
I-8
this case, the foraminifera were most likely dead by the time they reached the Hudson
River.
Another possible transport mechanism is through drought conditions, which
would be evident in the movement northward of the “salt wedge” that is formed in an
estuary like the Hudson, where the dense salt water flows below the freshwater. This
would allow the foraminifera to live further up the river than the salinity tolerances of the
foraminifera species would originally suggest, and could result in such depositional
layers as the drought seasons come and go. This effect would be most likely to occur in
midsummer, a time when tropical to subtropical foraminifera would find it easier to
thrive in the offshore ocean, and may be exacerbated by strong offshore winds.
In this study, goals were to check the reproducibility of foraminifera bearing
layers in CD02-29A by re-sieving samples from the core, and to provide higher
resolution Cs-137 and Pb-210 dating of CD02-29A to further constrain the sedimentation
rate. Another objective was to process another similar core titled CD02-13 for Cs-137
concentration to assess sedimentation rate and sieve this core for microfossils.
Constraining the spatial distribution and absolute ages of the stratigraphic microfossil
layers is the first step to developing a useful paleoclimatic proxy.
METHODS
Core Sampling
Sediment cores CD02-29A and CD02-13 were kept in refrigerated storage at
Lamont Doherty Earth Observatory. Samples were taken from different depths in core in
2 cm3 sizes for analysis. Sampling depths in both cores were selected using lows in
I-9
acoustic impedance as a proxy for incursions of marine, clay-rich sediment. Some depths
in core CD02-29 where foraminifera had been found previously were resampled to check
on the reproducibility of the prior results. The sediment core CD02-29A was originally
recovered during the “Can-Do” cruise on June 3rd, 2002 using a vibracore mechanism at
8.2 m water depth. Similarly, CD02-13 was taken on May 31st, 2002 at 11 m water depth,
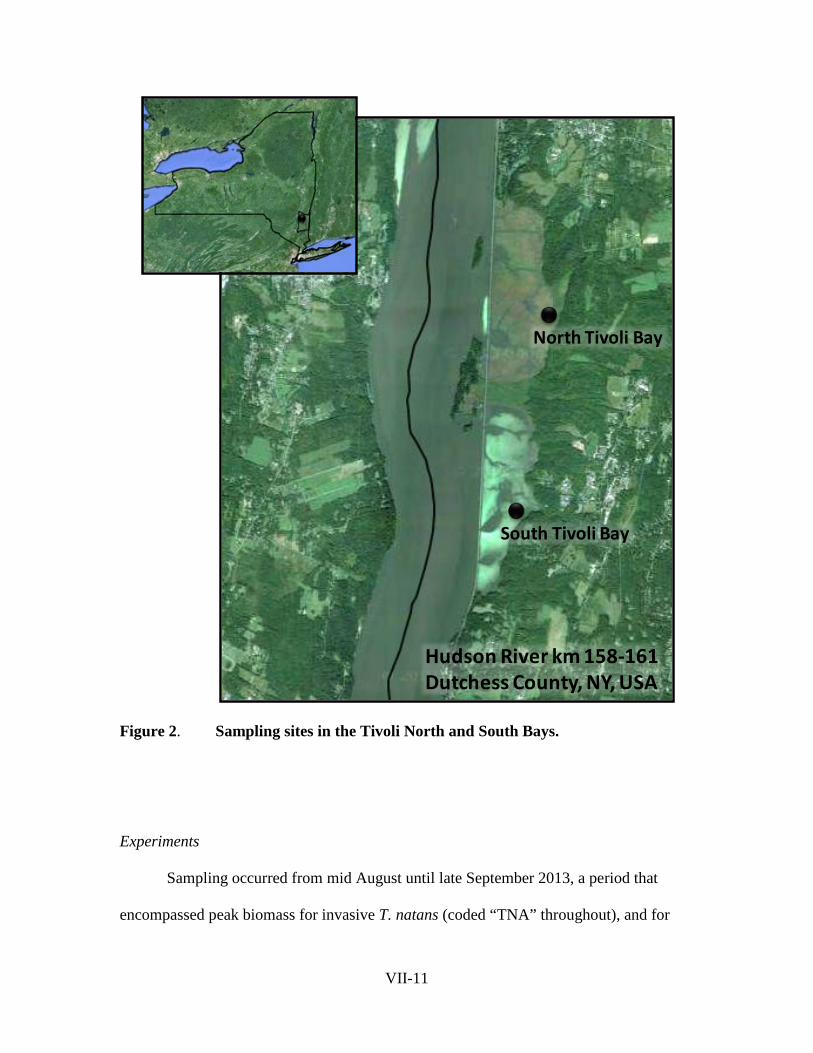
also a vibracore. Core locations are shown in Figure 2.
Figure 2. Map of the three sediment cores used in this study. VM32-2 is a piston
core, CD02-13 and CD02-29A are vibracores.
Sample Collection
Sediment core samples were processed using wet sieving methods. Small
subsamples were weighed and then dried in a sealed oven at 23° C for two days, and the
weight was again recorded.
Next, the original sample was disaggregated in de-ionized water. The sample was
sonified for 15 minutes, and allowed to settle overnight. This sonification step was
repeated three times. In order to segregate different test size fractions, the samples were
I-10
washed through stacked 250μm, 125μm, 63μm, and 38μm sieve sizes, and rinsed with de-
ionized water. Stacked sieves with samples were covered with a watch-glass and dried
overnight. Sieves were cleaned through ultra-sonification in a water bath between each
sample.
Fossil Picking
Fossil picking was accomplished with a Herrbrugg Wild MSA stereographic
microscope for each size fraction at each depth sampled. The number and species of
fossils were recorded and tests were stored in slides for reference and possible future
isotopic analysis.
RESULTS
Multiple layers containing tropical planktonic foraminifera including a large
number of G. ruber (pink) were recovered after sieving and fossil picking in CD02-13
(Fig 3, Fig 4). These assemblages were very similar in abundance and species distribution
to CD02-29A.
Figure 3. SEM and visual light image of a G. ruber (pink) test from CD02-13,
100-102cm. Photo credits: Dee Breger, Micrographic Arts, Greenfield, NY.
I-11
Figure 4. Visual light images of other marine planktonic foraminifera tests from
CD02-13.
Layers containing marine planktonic foraminifera were replicated in CD02-29A, and
the core profile was updated to reflect the new values. Acoustic impedance was a good
predictor of carbonate bearing layers (Fig. 5). New layers containing benthic foraminifera
were also found in CD02-29A.
CD02-29A Updated Core Profile
Figure 5.
The acoustic impedance, number of pelagic forams, and the percent G. ruber (pink) is provided by depth in core.
I-12
Refined radiogenic isotope data for CD02-29A provided a higher resolution
dating profile for Cs-137. Peaks were resolved at 1971 for the Indian Point nuclear power
plant leak of radioactive material, in 1963 for the fallout maximum, and a final drop-off
in 1954 (Fig 6). For CD02-13, post-1954 Cs-137-bearing sediment was only detected in
the first 2 cm, and mixed with post-1954 level sediment until 6cm. Below this line, Cs-
137 was inconclusive for CD02-13 (Fig 7).
Figure 6. The Cs-137 profile for CD02-29A shows a peak at 1971, during the
leak at Indian Point, another fallout peak in 1963, and a final drop-off at 1954, all of which can be used as stratigraphic markers (Levinton and Waldman 2006).
I-13
Figure 7. The Cs-137 profile for CD02-13 shows a slight increase at the
beginning of the core of post-1954 Cs-137 and mixing down to 6cm, but lower values are within standard error variation.
Assuming a constant influx of sediment to the core location, an estimate of the
sedimentation rate can be provided from the Cs-137 values. For CD02-29A, the estimated
sedimentation rate is between 0.5 cm/year and 1.5 cm/year. Total Pb-210 activity from
CD02-13 was inconclusive.
Figure 8. The total Pb-210 data from CD02-13 with the production of refined
lead in the Hudson Basin adjacent (Nelson, 2011).
0
5
10
15
20
25
30
-60 -40 -20 0 20 40 60 80 100 120
Cor
e D
epth
(cm
)
Cs-137 (pCi/kg)
CD02-13 Cs-137 Activity
I-14
DISCUSSION
Previously suggested pelagic foraminifera-bearing layers were confirmed by repeat
core sampling and sieving of CD02-29A. This result supports the previous layer
identifications, and sampling at many depth levels corroborated the hypothesis that these
are the main stratigraphic foram-bearing layers.
Similar assemblages of sub-tropical and tropical planktonic foraminifera were found
in core CD02-13, located upriver from CD02-29A. This replicates the findings in CD02-
29A and suggests that deposits of pelagic foraminifera may occur throughout the lower
Hudson River. However, abundances of the fossils found were much lower than in
CD02-29A. Issues of possible contamination of the sieves by entrapped foraminiferal
tests were addressed through sonification of sieves between each use, as in Green (2001).
In the future, methylene blue treatment of the sieves could provide a more robust
protection against contamination, due to the low abundances present in CD02-13.
Radiogenic sediment dating for CD02-29A and CD02-13 provides valuable temporal
parameters for the former, but for the latter core the Cs-137 peaks were not resolved. This
is likely due to sedimentation rate changes or local dredging, as depositional patterns are
very spatially dynamic within the Hudson River Estuary (McHugh et al. 2004). Common
influences on the resolution of Cs-137 profiles within sediment cores include: reworking
of sediment (re-suspension and bioturbation), diffusional movement of Cs-137 through
pore waters, and particle size of sediments, which impacts particle association (Ritchie
and McHenry 1990). The most likely influence on the difference between resolved Cs-
137 horizons between CD02-29A and CD02-13 is changes in the sedimentation rate.
I-15
Sedimentation rates can vary seasonally, and commonly sedimentation in the Hudson
occurs both due to mechanisms of flocculation from an increase in salinity downstream
and kinetic settling of suspended matter in lower flow conditions (Woodruff et al. 2001).
High levels of rapid sediment deposition can occur in the estuarine turbidity maximum
(ETM) zone (Meade 1969). In this area, physical sediment trapping mechanisms such as
salinity-inducted flocculation and tidal effects cause a focusing and concentration of
suspended sediment (Nitsche et al. 2010).
The collection of these suspended particles acts as a sediment trap at the marine-
freshwater water interface, creating high sedimentation rates through rapid sheer velocity
changes, salinity gradients, and spatial stratification gradients (Ralston et al. 2013). The
depositional profiles at the ETM can change as the fluxes of freshwater from upriver flow
seasonally change (Woodruff et al. 2001). During times of high flow during snowmelt or
storm events, the increase in freshwater can push the ETM downstream, changing the
salinity gradients in the Hudson and allowing for higher rates of sediment deposition
downriver (Woodruff et al, 2001). Gathering bathymetric and seismic data can help to
address accumulation rates and depositional profiles (Nitsche et al. 2010), which may
help understand the dynamics of sediment deposition in the range of CD02-29A and
CD02-13.
A hurricane event could re-suspend sediment containing planktonic foraminifera tests
deposited from a tropical source (likely the Gulf Stream) which are then deposited once
the tests reach the depositional area of the ETM within the Hudson River. This
resuspended material could be deposited further upriver in the event of a storm surge.
One such storm surge event occurred in 1998 when high winds from the East produced
I-16
water surface elevations into the Battery as far North as Albany, NY (Blumberg and
Hellweger 2006). The well-preserved nature of the tests suggests a rapid depositional
profile without post-depositional suspension, such as would be common in the ETM. This
assemblage of foraminifera from this paper is quite characteristic of the Gulf Stream, as
G. sacculifer has its highest abundances within the Gulf Steam, which was another
tropical foraminifera identified as a component of the tropical assemblage (Balsam and
Felssa et al. 1978). The high levels of fine-grained materials in the depositional layers
and correlation with acoustic impedance are consistent with high depositional rate event
sediment profiles in the Hudson, monitored by both sediment core and optical acoustic
measurements (Traykovski et al. 2004).
An external check for the climatic signal could be obtained through use of carbon-14
dating. Using this method in estuaries can be complex due to re-suspension and
incorporation of old carbon sources into shell material, however it has been used in the
past (Pekar et al. 2004) for this area in the Hudson. Pending carbon-14 dates from CD02-
29A and CD02-13 will provide more robust sedimentation rate assessments, and future
hurricane event correlations.
In the future, collection of another sediment vibracore in the depositional area near
CD02-29A would provide for replication of depositional layers in the sediment. Review
of other core candidates near CD02-13 which have a higher resolution Cs-137 profile is
suggested as well. Though greater levels of replication in identified stratigraphic layers
are needed, the implications of current results still suggest a unique depositional
mechanism and climatic signal, possibly due to storm surges.
I-17
ACKNOWLEGMENTS
We would like to thank the Tibor T. Polgar Fellowship program and the Hudson
River Foundation for funding and support of this project. Thank you to Dee Breger for
her SEM images and workup of the images in Figure 1. Thank you to Richard Bopp and
Miriam Katz at Rensselaer Polytechnic Institute for their support and continued advice,
along with Bärbel Hönisch, Nichole Anest and Jon Stelling at LDEO.
I-18
REFERENCES
Bopp, R. F., and H. J. Simpson. 1989. Contamination of the Hudson River: The sediment record. Pages 401-416 in Contaminated Marine Sediments Assessment and Remediation. Marine Board, National Commission on Engineering and Technical Systems, National Research Council. National Academies Press, Washington, D.C.
Bown, P. R., J. A. Lees, and J. R. Young. 2004. Calcareous nannoplankton evolution and diversity through time. Pages 481-508 in H. Thierstein and J. Young, (eds.), Coccolithophores: From Molecular Processes to Global Impact. Springer Berlin Heidelberg, New York.
Bijima, J., W.W. Faber, and C. Hemleben. 1990. Temperature and salinity limits for growth and survival of some planktonic foraminifers in laboratory cultures: Journal of Foraminiferal Research 20:95-116.
Blumberg, A.F., and F.L. Hellweger. 2006. Hydrodynamics of the Hudson River Estuary. Pages 1-19 in J. Waldman, K. Limburg, and D. Strayer, (eds.), Hudson River Fishes and Their Environment. American Fisheries Society Symposium 51.
Cronin, T. M., R. Thunell, G. S. Dwyer, C. Saenger, M. E. Mann, C. Vann, and R. R. Seal. 2005. Multiproxy evidence of Holocene climate variability from estuarine sediments, eastern North America: Paleoceanography 20:1-21.
Green, O.R. 2001. A manual of practical laboratory and field techniques in paleobiology: Klumer Academic Publishers. Boston.
Levinton, J.S., and J.R. Waldman, eds. 2006. The Hudson River Estuary. Cambridge University Press.
McHugh, C, S.F.Pekar, N Christie-Blick, B.F. Ryan, S. Carbotte, and R. Bell. 2004. Spatial variations in a condensed interval between estuarine and open-marine settings: Holocene Hudson River estuary and adjacent continental shelf: Geology 32.2:169-172.
Meade, Robert H. 1969. Landward transport of bottom sediments in estuaries of the Atlantic coastal plain: Journal of Sedimentary Research 39:222-234.
Nelson, T. 2011. Establishing a Platinum Group Element (PGE) Method of Sediment Chronology While Tracing New York Harbor’s Industrial Past: 1910-1982: Columbia College Senior Thesis.
Pekar S.F., C.M. McHugh, N. Christie-Blick, M. Jones, S.M. Carbotte, and R.E. Bell. 2004. Estuarine processes and their stratigraphic record: paleosalinity and sedimentation changes in the Hudson Estuary: Marine Geology 209:113-129.
I-19
Ralston, D.K., J.C. Warner, W.R. Geyer, and G.R. Wall. 2013. Sediment transport due to extreme events: The Hudson River estuary after tropical storms Irene and Lee: Geophysical Research Letters 40:5451-5455.
Ramsey, A. T. S. 1974. Coccoliths: production, transportation and sedimentation: Marine Micropaleontology 1:65-79.
Ritchie, J. C., and J.R. McHenry. 1990. Application of radioactive fallout cesium-137 for measuring soil erosion and sediment accumulation rates and patterns: a review: Journal of Environmental Quality. 19:215-233.
Ruddiman, W. F. 1969. Historical stability of the Gulf Stream, foraminiferal evidence: Deep Sea Research and Oceanographic Abstracts 15:137-148.
Tolderlund, D. S., and A.W. Be. 1971. Seasonal distribution of planktonic foraminifera in the western North Atlantic: Micropaleontology 17:297-329.
Traykovski, P., R. Geyer, and C. Sommerfield. 2004. Rapid sediment deposition and fine‐scale strata formation in the Hudson estuary: Journal of Geophysical Research: Earth Surface (2003–2012) 109:1-20.
Weiss, D., K. Geitzenauer, and F.C. Shaw, 1978, Foraminifera, diatom and bivalve distribution in recent sediments of the Hudson Estuary: Estuarine and Coastal Marine Science 7:393-400.
Woodruff, J., R. Geyer, C., Sommerfield, and N. Driscoll. 2001. Seasonal variation of sediment deposition in the Hudson River estuary. Marine Geology 179:105-119.
II - 1
SEA LEVEL RISE AND SEDIMENT: RECENT SALT MARSH ACCRETION IN
THE HUDSON RIVER ESTUARY
A Final Report of the Tibor T. Polgar Fellowship Program
Troy D. Hill
Polgar Fellow
School of Forestry and Environmental Studies
Yale University
New Haven, CT 06511
Project Advisor:
Shimon C. Anisfeld
School of Forestry and Environmental Studies
Yale University
New Haven, CT 06511
Hill, T. D. and S. C. Anisfeld. 2015. Sea Level Rise and Sediment: Recent Salt Marsh
Accretion in the Hudson River Estuary. Section II: 1-32 pp. In D.J. Yozzo, S.H. Fernald
and H. Andreyko (eds.), Final Reports of the Tibor T. Polgar Fellowship Program, 2013.
Hudson River Foundation.
II - 2
ABSTRACT
Salt marshes occupy a narrow elevation range within the intertidal zone. If they
are to remain viable, marshes must rise at a rate commensurate with sea level. To
understand the prospects for accommodating future sea level rise, this research asks
whether vertical accretion in New York City salt marshes has kept pace with rising sea
levels over the past two centuries, and how the resultant disparities have changed the
flooding stress experienced by the marshes.
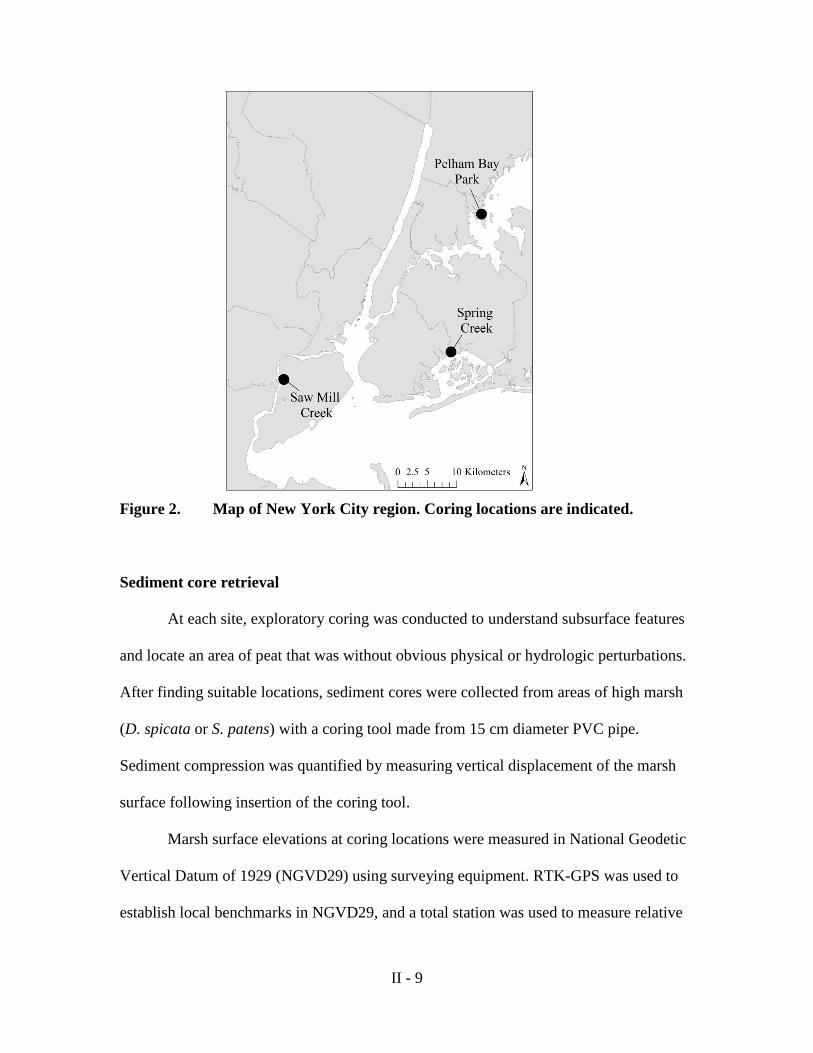
Sediment cores were retrieved from marshes on Staten Island, Jamaica Bay, and
the Bronx, NY. Age-depth models were calibrated using multiple independent age
markers; 210
Pb, 137
Cs, and total Hg content. Subsamples from depth increments were
combusted to determine mineral and organic content. Water level loggers were deployed
at each site and used to model historic tide data based on the 150-year tide data record for
New York City.
These data show that marsh surface accretion has been variable in time and space,
but has overwhelmingly lagged behind sea level rise over the past two centuries. This de-
coupling has led to a substantial reduction in the elevation of the marsh surface relative to
sea level, and has dramatically increased the frequency and duration of flooding
experienced by the marshes, although there is evidence of a rebound of marsh accretion
in response to increased flooding. Contributions of mineral and organic sediment
deposition to total accumulation rates are examined within the context of changing
inundation regimes. These results suggest that an uncertain future awaits many coastal
NUTRIENT POLLUTION IN HUDSON RIVER MARSHES: EFFECTS ON GREENHOUSE GAS PRODUCTION
A Final Report of the Tibor T. Polgar Fellowship Program
Angel Montero
Polgar Fellow
School of Earth and Environmental Sciences Queens College, City University of New York
Flushing, NY 11367
Project Advisors:
Brian Brigham and Gregory D. O’Mullan School of Earth and Environmental Sciences
Queens College, City University of New York Flushing, NY 11367
Montero, A., B. Brigham, and G.D. O’Mullan. 2015. Nutrient Pollution in Hudson River Marshes: Effects on Greenhouse Gas Production. Section III: 1- 26 pp. In D.J. Yozzo, S.H. Fernald and H. Andreyko (eds.), Final Reports of the Tibor T. Polgar Fellowship Program, 2013. Hudson River Foundation.
III-2
ABSTRACT
The Hudson Valley has experienced rapid development and urbanization over the
last century. As a result, the release of untreated sewage from Combined Sewer
Overflows (CSOs) continues to be of concern as a nutrient loading vector to the
environment. The majority of nutrient pollution in the Hudson River Estuary is
transferred to the lower Hudson, including Iona Island Marsh, from New York City
through tidal forcing. Wetland systems are primarily composed of anaerobic sediment
that is regulated by different energy constraints than more well-studied terrestrial
systems. A nutrient addition incubation experiment was performed with Iona Island
wetland soil that measured the production of carbon dioxide and methane over a two-
week period in response to different combinations of carbon and nitrogen additions. The
addition of carbon, in the form of acetate, to incubated wetland soils was found to cause
significantly increased production of carbon dioxide and methane, both potent
greenhouse gases. In contrast, nitrogen only additions, in the form of nitrate or
ammonium, did not result in significantly increased greenhouse gas production compared
to the no nutrient addition control treatment. These results suggest that CSO releases into
the lower Hudson River Estuary are likely to stimulate increased pulses of both carbon
dioxide and methane from Hudson marshes and provide added rationale to more tightly
manage anthropogenic carbon release into the estuarine environment.
III-3
TABLE OF CONTENTS
Abstract ................................................................................................................ III – 2
Table of Contents ................................................................................................. III – 3
Lists of Figures and Tables .................................................................................. III – 4
Introduction .......................................................................................................... III – 5
Methods................................................................................................................ III – 7
Results .................................................................................................................. III – 12
Discussion ............................................................................................................ III – 19
Conclusions .......................................................................................................... III – 21
Acknowledgements .............................................................................................. III – 23
References ............................................................................................................ III – 24
III-4
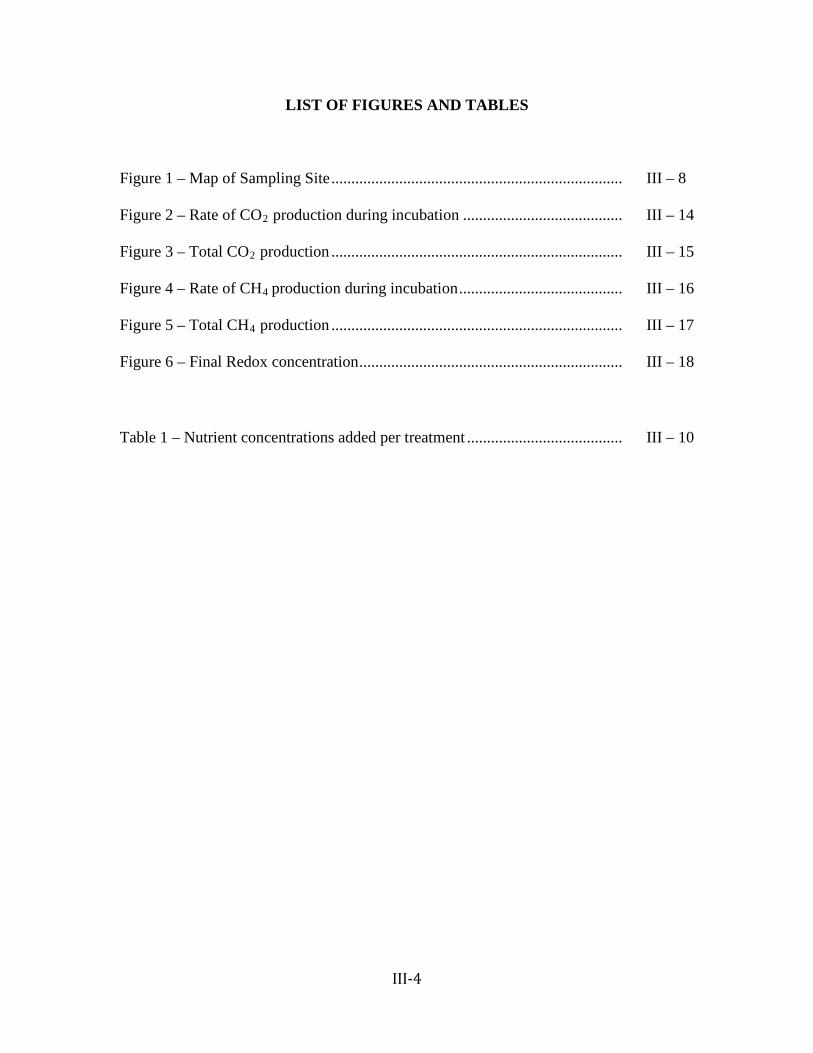
LIST OF FIGURES AND TABLES
Figure 1 – Map of Sampling Site ......................................................................... III – 8
Figure 2 – Rate of CO2 production during incubation ........................................ III – 14
Figure 3 – Total CO2 production ......................................................................... III – 15
Figure 4 – Rate of CH4 production during incubation ......................................... III – 16
Figure 5 – Total CH4 production ......................................................................... III – 17
Figure 6 – Final Redox concentration .................................................................. III – 18
Table 1 – Nutrient concentrations added per treatment ....................................... III – 10
III-5
INTRODUCTION
Wetlands are being subjected to increasing pollution from anthropogenic
phenomena (Bianchi 2011). The Hudson valley has seen rapid development and
urbanization over the last century, and it hosts one of the largest population densities in
the United States (US Census Bureau 2011). Restoration efforts following the Clean
Water Act of 1972 have done much to improve water quality in the Hudson (Brosnan et
al. 2006); however, the input of nutrient pollution in the form of carbon (C) and nitrogen
(N) remains significant (Howarth et al. 2006). The majority of nutrient pollution to the
lower Hudson, including Iona Island Marsh, originates in New York City and is
transported through tidal forcing (Griffith and Raymond 2011; Yoon and Raymond
2012). In New York City, and many other local riverfront communities, street runoff and
raw sewage are combined into a single sewer system. During periods of high
precipitation, a portion of the water from sewers containing combined untreated sewage
and street runoff are expelled directly into the Hudson as Combined Sewer Overflows
(CSOs), a matter of ongoing concern as a vector of nutrient loading in the environment
(Griffith and Raymond 2011).
Marshes are a major interface between terrestrial and aquatic habitats, providing
crucial ecosystem services. For example, marshes are believed to play a critical role in
filtering toxins from watersheds and providing a buffer to coastal flooding during major
storm events (Barbier et al. 2011). Estuaries and associated marshes are also important
fishery habitats and act as a nursery to many species of fish (Limburg et al. 2006).
Therefore, the wetland loss observed in recent decades has been a matter of concern in
coastal New York. For example, Jamaica Bay, NY, has experienced a steady increase in
III-6
salt marsh fragmentation and conversion to mud flats and pools since the 1950s (Hartig et
al. 2002). Small plot – scale experimental manipulations (Deegan et al. 2002; Turner et
al. 2009) and marsh-scale studies (Deegan et al. 2012) have shown that nutrient
enrichment can lead to changes in plant physiology leading to decreased formation of
below ground roots, consequently increasing erosion and wetland loss (Morris and
Bradley 1999; Turner et al. 2009); however, less work has been conducted to describe
the role microbial communities have in changing wetland dynamics following nutrient
enrichment (Bowen et al. 2009).
Wetland systems are primarily composed of anaerobic sediment that is regulated
by different energy constraints than more well-studied terrestrial systems (Reddy and
DeLaune 2008). In anaerobic sediments, microbial communities are forced to use
alternative electron acceptors, and subsequently alternative metabolic pathways to
generate energy (Conrad 1996); however, these alternative acceptors have lower redox
potentials than oxygen and their reduction generates less energy per mol of organic
material degraded (Canfield et al. 2004; Thauer et al. 1977). The energy constraints of
oxygen-deprived microbial communities lead to the buildup of recalcitrant C pools in
anaerobic zones as organic C remains energetically unavailable (Bridgham et al. 2006).
Nutrient additions to anaerobic soil could trigger the activation of microorganisms that
promote increased greenhouse gas (GHG) emissions such as carbon dioxide (CO2) and
methane (CH4) and possibly facilitate soil C loss (Blagodatskaya and Kuzyakov 2008).
Therefore, elucidating the mechanistic interactions between nutrient additions, microbial
activity, and GHG production is crucial in order to understand the consequences of
sewage release into local waterways and more effectively manage estuaries.
III-7
The objective of this experiment was to quantify the microbial response to C and
N addition by measuring the production of CO2 and CH4 in anaerobic soil slurries
exposed to different C and N treatments. It was hypothesized that C additions to soil
slurries would increase the decomposition of organic matter measured by an increase in
both CO2 and CH4 rates, while N addition would not stimulate additional GHG
production.
METHODS
Overview. The experiment aimed to quantify soil anaerobic microbial response
to C and N sources, and the subsequent production of the GHGs; CO2 and CH4.
Sediment cores and overlying water were collected from Iona Island Marsh, NY and
utilized to created soil slurries in one-liter Mason jars. A nutrient addition incubation
experiment was performed that measured the production of CO2 and CH4 in response to
different combinations and forms of C and N over a two-week period. Following the
incubation, units were broken down and extracted water and soil slurry samples were
collected for future biogeochemical and molecular analysis (beyond the scope of this
fellowship report).
Site description. Iona Island marsh (Figure 1), located 60 km north of New York
City, was chosen for its proximity to Queens College, and its relatively low salinity
concentrations. In World War II it served as a U.S Navy ammunition depot. In 1965, it
was donated to the Palisades Interstate Park Commission. Today, it is one of four
wetlands composing the Hudson River National Estuarine Research Reserve. It is a
sanctuary for many bird species and marine and aquatic organisms like ducks and crabs,
which were observed during field excursions there.
III-8
Figure 1a. (above) A map of Iona Island with the sampling location circled in red.
Figure 1b. (left) A map of the lower Hudson River estuary marking the location of Iona Island.
III-9
Field sampling phase. Soil samples were collected from eight sites with an
average distance of 10 meters from each other. Overlying water (20 liters) was collected
in close proximity to collection sites. Sediment cores were collected from each site with
an AMS specialty wetland soil corer equipped with plastic core liners. The corer was
driven into the ground, rotated clockwise 90 degrees, and slowly pulled up to extract a
core. The cores varied from approximately 18 - 20 cm in length and were 5 cm in
diameter. The core liners were then capped and stored in a collection bag at ambient
temperature. Once all sites were visited, the soil cores were stored in an ice-cooled chest,
while the overlying water was stored in containers at ambient temperature.
Preparatory phase. Upon arrival in the laboratory, the material collected was
immediately processed and prepared for incubation. Soil cores were removed from liners
and placed at 4°C in Ziploc bags. Before soil slurry unit fabrication, individual cores
from each site were mixed together into homogenous slurry. The overlying water was
filtered (0.22 micron Sterivex filter), autoclaved, degassed, and refrigerated (4°C). To
prepare Mason jar units, approximately 105 g of wet soil was weighed. A small sample
of approximately 5 g was removed from this mass, weighed, and stored for soil C and N
analysis. The remainder (100 g) was weighed, and inserted into the Mason jar. The jar
was then filled with approximately 200 g of processed overlying water and shaken at low
rpm for 10 minutes. All the units were then flushed with nitrogen using a one hour
procedure to remove oxygen from both the headspace and water of the experimental
units. Seven replicate units from each site were constructed, for a total of 56 Mason jar
units. A single replicate from each site was randomly assigned to one of seven treatment
groups. The groups consisted of (Table 1): pre-treatment (PT); negative control (NT);
(A+NO3); and acetate + ammonia addition (A + NH4).
Pre-incubation phase. After preparing Mason jar units, a two–week incubation
period was completed before nutrients were added. Units were stored in a temperature
controlled incubation chamber at 25°C for both the pre-incubation and the incubation
period following nutrient addition. CO2 headspace concentrations were measured in the
pre-incubation units to monitor microbial activity. At the conclusion of the pre-
incubation, indicated by complete reduction in CO2 production rate, nutrients were added
as noted below (Table 1) to simulate expected nutrient loads following storm events
(Griffith and Raymond 2011). The amount added was approximately ten-fold higher
than the daily rate modeled by Griffith and Raymond 2011 simulating expected nutrient
loading during storm events (Yoon and Raymond 2012).
Immediately following the nutrient addition, all units were flushed to eliminate any
accumulated GHGs before the incubation began.
Nutrient phase. During the main incubation phase, both CO2 and CH4
headspace concentration were measured in regular time intervals, every 24 hours and
every 48 hours, respectively. CO2 was measured with an EGM-4 (IRGA) environmental
Treatment Type Vol (mL) Nutrient ConcentrationsNo Treatment (NT) 10 deionized waterNitrate (NO3) 10 potassium nitrate to final concentration of 3.57 mmol N
Ammonium (NH4) 10 ammonium chloride to final concentration of 3.57 mmol N Acetate (A) 10 sodium acetate to final concentration of 16.67 mmol C
Acetate + Nitrate (A + NO3) 10potassium nitrate + sodium acetate for final concentrations of 3.57 mmol N/16.67 mmol C
Acetate + Ammonium (A + NH4) 10ammonium chloride + sodium acetate for final concentrations of 3.57 mmol N/16.67 mmol C
Table 1. Nutrients added to treatment groups with C and N concentrations per L of volume (wet soil sample + overlying water volume.)
III-11
gas monitor and CH4 was measured with a Hewlett-Packard 5890 Series plus II Gas
Chromatograph (GC) installed with a Flame Ionization Detector. A 60 ml plastic BD
syringe was used to extract gas samples from units. To extract a headspace sample, the
syringe was inserted through the unit’s septum, the headspace was then mixed by gently
pulling the syringe’s plunger up to 50 ml and back to 0 two times. The desired volume of
headspace sample was then extracted. During days when both CO2 and CH4 were
measured, 30 ml of headspace was extracted from the unit. From that 30 ml, 5 ml was
initially expelled, 10 ml was injected into the GC and analyzed for CH4, and the
remaining 15 ml inserted into the EGM-4 and analyzed for CO2. On days when only
CO2 was measured, only 15 ml of the unit’s headspace sample was extracted and
analyzed. The GC and EGM-4 were both flushed (air and N2 respectively) with gas after
each unit was sampled. The volume of gas extracted from the experimental unit’s
headspace was replaced with nitrogen after sampling.
Breakdown. At the end of the pre-nutrient (pre-treatment units only) and nutrient
phases the Mason jar units being sampled were broken down, and slurry-water mix tested
for pH, redox, and salinity (Sensorex reference electrodes) with the Micro Observatory
sensor system (Analytical Instrument Systems). Each unit was first shaken for ten
minutes. Before sampling, the unit slurries were inverted three times to homogenize the
contents. The units were then opened, and probes inserted into the slurry mix to be
analyzed. After probe-measurements, soil and water samples were vacuum filtered,
collected, and frozen for future biogeochemical measurements.
Statistics. Data from the end point of experimental incubations were analyzed
using software from the R project for statistical computing (www.r-project.org). Analysis
of Variance (ANOVA) was used to test for differences in the mean and if significant
differences were detected among groups, a post-hoc Tukey’s Range Test was used to
adjust p-values for multiple comparisons to identify the pairs of experimental units with
significantly different means.
RESULTS
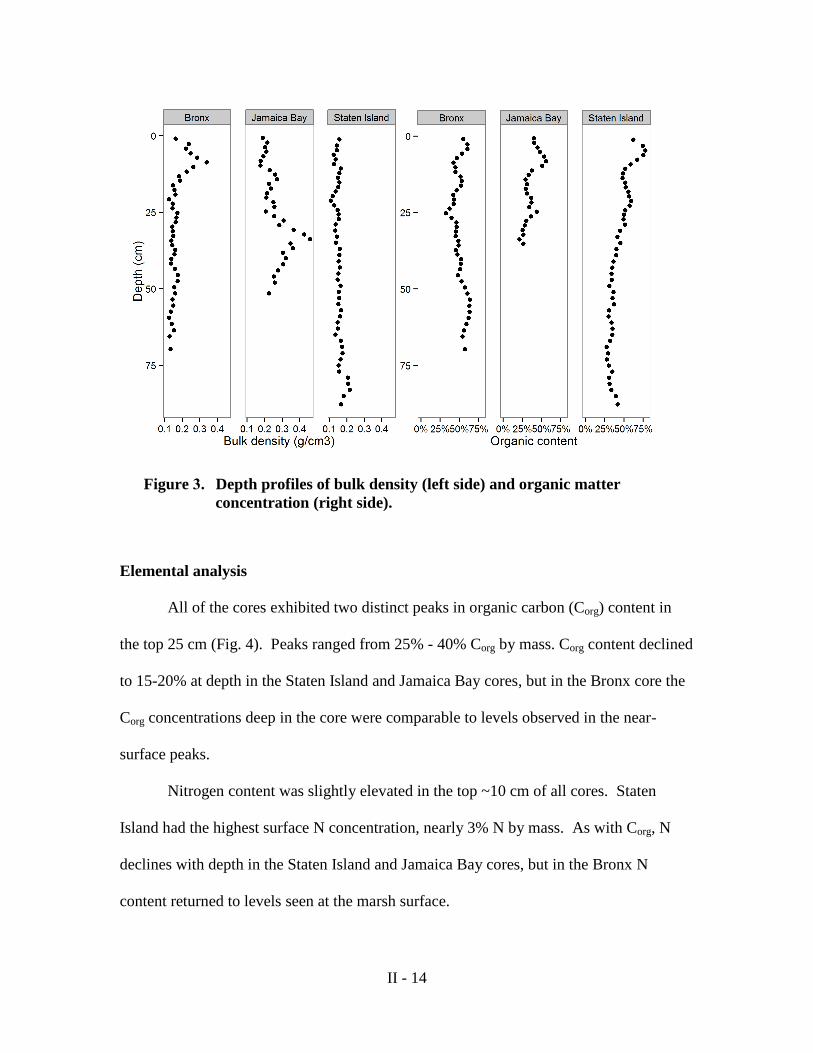
Greenhouse gas production. CO2 production rates increased in carbon-treated
groups (A+NH4, A+NO3, A), most notably in days 8, 9, and 10, after which production
rates leveled off (Figure 2). A temporary decrease in CO2 accumulation was observed in
the A+NO3 group in the 2nd day of the experiment. Total CO2 production differed
significantly (p < 0.01) among treatments (Figure 3) with greater production found in C
addition treatments. Only A (p<0.01), A+NO3 (p<0.01), and A+NH4 (p<0.01) treatment
groups were significantly different from the control (NT) treatment. In contrast, N
additions did not have a significant effect on CO2 production when compared to the no
addition control. In C–treated groups, an average of 460 µg C/ g of dry soil accumulated
as CO2 was produced. In contrast, an average of 229 µg C/ g of dry soil accumulated as
CO2 was produced in the NO3, NH4, and NT groups.
CH4 production was observed in C addition treatments but was not measurable in
N only and control treatments (Figure 4). Final CH4 differed among groups (ANOVA,
p<0.01) (Figure 5); however, only A (p < 0.05) and A+NH4 (p < 0.01) treatments were
significantly different from the no addition control (NT) treatment. In C–treated groups,
an average of 206 µg C/ g of dry soil accumulated as CH4 was produced. In contrast, an
average of 3 µg C/ g of dry soil accumulated as CH4 in the NO3, NH4, and NT groups.
III-13
In total, 66% percent (µg C / g of dry soil) of gaseous C measured was in the
form of CO2, while CH4 made up 33% of gaseous C measured. C + N treatment groups
accumulated 3.3 times as much C compared to treatments with N only addition. CO2
comprised 51% of total C accumulation in acetate, 53% in A + NH4, 73% in A + NO3,
and >99% for all other treatments. CH4 comprised 49% of total C accumulation in
acetate, 47% in A + NH4, 27% in A + NO3, and < 1% for all other treatments.
Probe measurements Redox measurements conducted at the end of the
incubation period demonstrate that the most significant reduction of experimental units
occurred in C treated groups (Figure 6). Significant differences were detected among
groups (ANOVA, p<0.01). The A (p<0.01), A+NH4 (p<0.01), A + NO3 (p<0.01), and
NO3 (p<0.01) treatments differed significantly from the no addition control treatment.
There were significant differences in pH among groups (p < 0.01). The measured
pH for the C–treated groups varied from 7 – 7.5. In contrast, the pH measured in N only
and control groups varied from 6.5 to 7.0. Only A (p < 0.01), A+NO3 (p < 0.01) and
A+NH4 (p<0.01) treatments significantly differed from the no addition control (NT).
The salinity levels measured in the field varied from 0.5 to 2.0 ppt.
III-14
Figure 2. CO2 production rate for the treatment groups through the two – week incubation period. The rate is measured as the amount µg C produced as CO2 since the last measurement point. The values were adjusted for slight variations in temperature and pressure, and normalized to the rate of C production per gram of dry soil weight present in the unit.
III-15
Figure 3. Box plot demonstrating the amount of C mineralized as CO2 at the end of the experiment. Concentrations were adjusted for slight temperature and pressure differences, and normalized to total µg C produced per gram of dry soil. Significant differences from the control are marked with an asterisk and groups that do not show significant differences among samples are designated with a letter.
III-16
Figure 4. CH4 production rate from the treatment groups through the two –
week incubation period. The rate is measured as the amount µg C produced as CH4 since the last measurement point. The values were adjusted for slight variations in temperature and pressure, and normalized to the rate of C production per gram of dry soil weight present in the unit.
III-17
Figure 5. Box plot demonstrating amount of C mineralized as CH4 at the end of the experiment. Concentrations were adjusted for slight temperature and pressure differences, and normalized to total µg C produced per gram of dry soil. Note log scale of axis. Significant differences from the control are marked with an asterisk and groups that do not show significant differences among samples are designated with a letter.
III-18
Figure 6. Box plot showing redox condition at the end of experiment.
Significant differences from the control are marked with an asterisk and groups that do not show significant differences among samples are designated with a letter.
III-19
DISCUSSION
Nutrient additions, similar to concentrations that would be expected in post-storm
nutrient pulses, were found to have variable influence on GHG production, depending on
the chemical composition of the addition. The addition of acetate, with or without
ammonium or nitrate, was found to cause significant increases in both CO2 and CH4
production in wetland soil slurries. Nutrient cycling in wetlands is generally thought to
be controlled by the availability of C and N sources to produce energy for metabolism
and growth (Conrad 1996). In the wetland system studied, anaerobic microbes use
alternative electron acceptors in lieu of oxygen; however, the energy available through
these compounds is very low in comparison to aerobic respiration (Thauer et al. 1977).
As a consequence, microbial growth is often sluggish in anaerobic environments as they
are starved for energy and unable to utilize the recalcitrant C pool present. It appears that
microbial communities in these soils were limited mainly by energy in the form of easily
degradable C. It is therefore not surprising that the redox potential in these treatments
was also found to decrease and that, under these reduced redox conditions, CH4 was
produced in substantial quantities relative to the treatments lacking labile C additions and
characterized by higher redox potential.
In contrast, the addition of nitrate or ammonium alone was not sufficient to
increase GHG production from marshes as compared to the no addition control,
suggesting that N limitation is not a major factor acting to suppress anaerobic
metabolism, nor did it cause a reduction in redox potential of the experimental units by
stimulating anaerobic metabolism. The addition of nitrate can also act as a favorable
electron acceptor in anaerobic systems, and was observed to increase redox potential, as
III-20
expected, suggesting that denitrification might become a dominant energy producing
pathway in this treatment. When adequate electron donors are available, microbial
communities can be differentiated by their preference of electron acceptors that vary in
metabolic efficiency. In the absence of aerobic respiration, due to the lack of oxygen,
denitrification is the next most efficient catabolic process, followed by iron reduction,
sulfate reduction, and lastly methanogenesis, which generally occurs only in highly
reduced conditions (Conrad 1996). Microbial activity would be expected to be
dominated by metabolic pathways providing the highest available energy yield, and as
favorable electron acceptors become depleted, microbial activity would shift according to
the redox condition. In saline environments, sulfate reduction has been found to produce
ten times more energy than other metabolic activities (Howarth and Teal 1980) due to the
high concentration of sulfate. Presence of sulfates has also been found to hamper
methanogenic activities (Martens and Berner 1974; King and Wiebe 1980). Iona Island
is typically fresh (0.5 - 2.0 ppt) suggesting that denitrification and methanogenesis would
be expected to be important pathways utilizing available organic C; however, in this
experiment the addition of N alone did not result in increased CO2 or methane
production, indicating that the system was primarily limited by availability of electron
donors, not electron acceptors. In addition, it is expected that the lower Hudson area
already receives ample N from wastewater sources (Brosnan et al. 2006), which would
make N widely available in marshes such as Iona Island.
These findings are important to interpret in the context of sewage and other
nutrient pollution sources. Sewage contains high levels of labile C that, based on these
findings, would be expected to increase GHG production from marshes in both the form
III-21
of CO2 and CH4, while also reducing the redox potential in impacted marsh soils, causing
an increase in the relative utilization of C for anaerobic respiration. N can be released
into the estuary either from sewage or other sources such as fertilizer usage. It appears
that the addition of N may have little direct impact on GHG production in Iona Marsh
sediment; however, the N pollution sources could still have indirect impacts on marsh
soils by stimulating primary production in the estuary and thereby resulting in the
addition of labile C to anaerobic marsh soils (Bianchi 2011). Management activities,
such as reduction in CSOs and improved efficiency of wastewater treatment, that reduce
N pollution, and especially those that reduce C pollution, would be expected to reduce
GHG production from Iona Island marsh and similar wetland systems.
CONCLUSIONS
These results highlight the importance of labile C as a mediator of GHG
production. This is importantly noted, as previous studies in northeastern U.S.A have
largely focused on the role of N impacts on wetland habitats (Deegan et al. 2002). There
has been little previous work on the combined effects of C and N on microbial
communities in the Hudson River Estuary. The results from this experiment show that C
has a larger effect on microbial activity in Iona Island marsh than N. The results show
that C should be a more closely monitored element in water quality research and steps
should be taken to minimize watershed exposure to C from anthropogenic sources.
Methanogenesis was shown to be strongly influenced by C addition. This is
important to consider as CH4 is thought to have 25 times the warming potential of CO2
over a hundred year period (IPCC 2007). Studying the ways CH4 is produced and how
III-22
anthropogenic activities affect CH4 production is vital to help mitigate the effects of
climate change. CSO releases would be expected to stimulate pulses of CH4 from
Hudson marsh environments. Coupled with the increasing vulnerability of this fragile
system to climate change and increased storm events, a closer look at the intricate
relationship between anthropogenic pollution and the Hudson’s health is warranted in
order to better direct ecosystem conservation and restoration efforts.
III-23
ACKNOWLEDGEMENTS
We would like to thank the Hudson River Foundation for supporting this project
and members of the Polgar Committee for their valuable feedback to improve this report.
In addition, we would like to thank Dr. Jeffrey Bird and members of the Bird laboratory
at Queens College for their assistance in designing and conducting this project.
III-24
REFERENCES Barbier, E.B., S.D. Hacker, C. Kennedy, E.W. Koch, A.C. Stier, and B.R. Silliman. 2011.
The value of estuarine and coastal ecosystem services. Ecological Monographs 81:169-193.
Bianchi, T.S. 2011. The role of terrestrially derived organic carbon in the coastal ocean:
A changing paradigm and the priming effect. Proceedings of the National Academy of Sciences 49: 19473-19481.
Blagodatskaya, E., and Y. Kuzyakov. 2008. Mechanisms of real and apparent priming
effects and their dependence on soil microbial biomass and community structure: critical review. Biology Fertility Soils 45:115-131.
Bowen, J.L., B.C. Crump, L.A. Deegan, and J.E. Hobbie. 2009. Salt marsh sediment
bacteria: their distribution and response to external nutrient inputs. The ISME Journal 3:924-934.
Bridgham, S.D., J.P. Megonigal, J.K. Keller, N.B. Bliss, and C. Trettin. 2006. The carbon
balance of North American wetlands. Wetlands 26:889-916. Brosnan, T.M., A. Stoddard, and L.J. Hetling. 2006. Hudson river sewage inputs and
impacts: Past and present. Pages 340–341 in: J.S. Levinton and J.R. Waldman, editors. The Hudson River Estuary. Cambridge University Press, New York.
Canfield, D. E., K.B. Sørensen, and A. Oren. 2004. Biogeochemistry of a gypsum-
encrusted microbial ecosystem. Geobiology 2:133-150. Conrad, R. 1996. Soil microorganisms as controllers of atmospheric trace gases (H2,
CO2, CH4, OCS, N2O, and NO). Microbiological Reviews 60:609-640. Deegan, L.A., J.E. Hughes, and R.A. Rountree. 2002. Salt marsh ecosystem support of
marine transient species. Pages 333-365 in: M.P. Weinstein, and D.A. Kreeger, editors. Concepts and Controversies in Tidal Marsh Ecology. Springer Netherlands 333-365.
Deegan L.A., D.S. Johnson, R.S. Warren, B.J. Peterson, J.W. Fleeger, S. Fagherazzi, and
W.M Wollheim. 2012. Coastal eutrophication as a driver of salt marsh loss. Nature 490: 388-392.
Griffith, D.R., and P.A. Raymond. 2011. Multiple-source heterotrophy fueled by aged
organic carbon in an urbanized estuary. Marine Chemistry 124: 14-22. Hartig, E.K, V. Gornitz, A. Kolker, F. Mushacke, and D. Fallon. 2002. Anthropogenic
and climate-change impacts on salt marshes of Jamaica Bay, New York City. Wetlands 22:71-89
III-25
Howarth, R.W., R. Marino, D.P. Swaney, and E.W. Boyer. 2006. Wastewater and
watershed influences on primary productivity and oxygen dynamics in the lower Hudson River Estuary. Pages 121 - 139 in: J.S. Levinton and J.R. Waldman, editors. The Hudson River Estuary. Cambridge University Press, New York.
Howarth, R.W., and J.M. Teal. 1980. The role of reduced inorganic sulfur compounds.
The American Naturalist 116:862-872. IPCC. 2007. Changes in atmospheric constituents and in radiative forcing. Page 212 in: Solomon, S., D. Qin, M. Manning, Z. Chen, M. Marquis, K.B. Averyt, M. Tignor and H.L. Miller, editors. Climate Change 2007: The Physical Science Basis.
Contribution of Working Group I to the Fourth Assessment Report of the Intergovernmental Panel on Climate Change. Cambridge University Press, Cambridge, New York. King, G. M., and W. J. Wiebe. 1980. Regulation of sulfate concentrations and
methanogenesis in salt marsh soils. Estuarine and Coastal Marine Science 10: 215-224.
Limburg K.E., K.A. Hattala, A.W. Kahnle, and J.R. Waldman. 2006. Fisheries of the
Hudson River Estuary. Pages 189 – 204 in: J.S. Levinton and J.R. Waldman, editors. The Hudson River Estuary. Cambridge University Press, New York.
Martens, C.S., and R.A. Berner. 1974. Methane production in interstitial waters of
sulfate-depleted marine sediments. Science 185:1167-1169. Morris, J.T., and P.M. Bradley. 1999. Effects of nutrient loading on the C balance of
Coastal wetland sediments. Limnology and Oceanography 44:699-702. Reddy, K.R., and R.D. DeLaune. 2008. Biogeochemical Characteristics and Carbon.
Pages 157-162 in: K.R. Reddy and R.D. DeLaune Biogeochemistry of Wetlands. CRC Press, Boca Raton.
Thauer, R.K., K. Jungermann, and K. Decker. 1977. Energy conservation in
Toner. 2009. Salt marshes and eutrophication: An unsustainable outcome. Ecological Research 19:29-35
U.S Census Bureau. 2011. Large Metropolitan Statistical Areas - Population: 1990 to
2010. Pages 26-28 in Statistical Abstract of the United States: 2012 (131st edition). Washington, DC.
III-26
Yoon, B., and P. A. Raymond. 2012. Dissolved organic matter export from a forested watershed during Hurricane Irene. Geophysical Research Letters 39: L18402
IV-1
MICROBIAL AGENTS OF CONCERN DETECTED IN WATER AND AIR AT THE HUDSON RIVER ESTUARY WATERFRONT
A Final Report of the Tibor T. Polgar Fellowship Program
Sherif Kamal
Polgar Fellow
Department of Environmental Studies Parsons The New School for Design
66 Fifth Avenue, New York, NY 10011
Project Advisor:
M. Elias Dueker School of Earth and Environmental Sciences
Queens College, City University of New York Flushing, NY 11367
Kamal, S. and M. E. Dueker. 2015. Microbial Agents of Concern in Water and Air at the Hudson River Estuary Waterfront. Section IV: 1-27 pp. In D.J. Yozzo, S.H. Fernald and H. Andreyko (eds.), Final Reports of the Tibor T. Polgar Fellowship Program, 2013. Hudson River Foundation.
IV-2
ABSTRACT
Despite building evidence of the transfer of bacteria from contaminated water
surfaces to coastal aerosols, the presence of antibiotic resistant bacteria and sewage
indicating bacteria in the air in urban waterfronts has not been sufficiently studied. This
represents an understudied route of pathogen exposure to human populations in proximity
to sewage-contaminated surface waters. To bridge this gap, this study deployed new
methodologies to detect and taxonomically identify these microbial agents of concern in
the lower Hudson River Estuary (HRE). Aerosol and water surface samples were
collected from the Newtown Creek Nature Walk, which is adjacent to a highly-urbanized
tributary of the lower HRE, to assess whether microbial agents of concern were present
and detectable. Antibiotic resistant bacteria and sewage indicators were detected in both
water and air on each sampling day at this site. This occurred despite the fact that viable
bacterial fallout was lower at this site than other previously studied waterfronts on the
HRE. The percentage of antibiotic resistance in bacterial aerosols (~20%) was
significantly higher than in surface water bacteria (~8%). Molecular analysis of the 16S
rRNA gene of viable bacteria sampled revealed a diverse bacterial community with a
wide range of possible sources, including water, land, and sewage. Many of the resistant
aerosols and water bacteria were members of genera known to contain human pathogens,
including Massilia, Pseudomonas, and Roseomonas. These findings greatly expand the
potential public health implications for sewage contamination in the urban coastal
environment, adding aerosol exposure as a potential route for human contact with
Over 39% of the US population now lives near a coastline, and wastewater
inputs to rivers, estuaries and marine waters have been increasing (Niemi et al. 2004;
NOAA 2013). Raw sewage releases contain many pathogenic bacteria (Tourlousse et al.
2008; Korzeniewska et al. 2009) and antibiotic resistant bacteria (Kim et al. 2010;
Young et al. 2013), creating potential public health risks for human contact with these
waters. Direct contact with contaminated waters (ingestion, skin contact) is known to
lead to illnesses including gastroenteritis, conjunctivitis, and wound infections (US EPA
Office of Water 2012); however, contact through inhalation of aerosols created from
contaminated waters is an additional and understudied human exposure pathway.
Aerosols can be created from water surfaces by surface disruption such as wind-wave
interactions, wave-shore interactions, and the recreational use of water (Monahan et al.
1983; Blanchard 1989; de Leeuw et al. 2000). This results in the movement of water
surface materials to the air, which may include viable bacteria, as established in previous
studies of coastal environments including the Hudson River Estuary (HRE) (Aller et al.
2005; Dueker et al. 2012a; Dueker et al. In Review).
This water-air movement of materials creates the opportunity for airborne human
exposure to microbial agents of concern, including sewage pathogens and antibiotic-
resistant bacteria, when raw sewage is present in urban surface waters. Research
conducted at Louis Valentino Pier (LVP) in Red Hook, Brooklyn showed that the
number of culturable bacteria in the air correlated with the culturable bacteria residing
in surface waters (Dueker et al. In Review). Untreated sewage released to estuarine and
coastal environments gets restricted to the surface in a density-stratified layer.
IV-6
Therefore, any surface disruption of contaminated waters may cause the release of raw
sewage materials into the atmosphere as indicated by previous research conducted at
Newtown Creek (Brooklyn, NY) (Dueker et al. 2012a).
Enterococci are routinely used as an indicator of human and animal fecal waste
in HRE surface waters and are associated with microbes that are of serious public
health concern (US EPA Office of Water 2012). Although Enterococcus presence in
HRE surface waters has been closely monitored, there is no current literature outlining
their presence in HRE waterfront air. Several studies have investigated the negative
public health prospects of aerosol exposure to aerosolized sewage microbes in relation
to sewage treatment plants (Woodcock 1955; Muscillo et al. 1997; Brandi et al. 2000;
Carducci et al. 2000; Radke 2005; Baertsch et al. 2007; Heinonen-Tanski et al. 2009;
Korzeniewska et al. 2009); however, the presence of these bacteria and their dominant
source in urban aerosols is a novel field of research.
Over the recent past the public has become increasingly alarmed by new
scientific findings of connections between the overuse of antibiotics in both medicine
and the agriculture–agrifood industry and the environmental emergence and spread of
antibiotic-resistant bacteria (Nikiforuk 1996; Feinmen 1998; Levy 1998;
Khachatourians 2013). Microbial resistance to antibiotics is on the rise. With fewer
new chemotherapeutic agents coming onto the market, the problem of microbial
resistance to drugs already in use has become a crisis in health care (Jungkind et al.
1995; US Office of Technology Assessment 1995). Previous studies conducted on
antibiotic resistant microbes in aerosols have been restricted to indoor hospital
environments (King et al. 2013; Muzslay et al. 2013) and agricultural environments
IV-7
(Liu et al. 2012; Schulz et al. 2012), where antibiotic resistant microbes are found to
travel in viable state through the air.
Based on a recent study, high concentrations of Enterococci (indicating the
presence of raw sewage) in HRE surface waters were directly related to concentrations
of ampicillin and tetracycline-resistant bacteria in surface waters (Young et al. 2013).
Given the high frequency of raw sewage release to HRE water (Riverkeeper 2011) and
the documented transfer of surface water materials to the air in coastal regions (Dueker
et al. 2011; Dueker et al. 2012a; Dueker et al. 2012b) the potential exists for
aerosolization of antibiotic resistant and sewage-associated bacteria when raw sewage
is present. Despite these findings, little to no research has been conducted on the
presence and potential sources for antibiotic resistant bacteria in outdoor air.
To address this gap, microbial agents of concern in the air and water were
quantified and identified at a highly-urbanized lower HRE waterfront site. The goals of
this study were to determine if microbial agents of concern were detectable in urban
air and adjacent surface waters and to make a preliminary assessment of possible
sources for these agents. The outcome of this study provides a unique dataset
confirming the presence of microbial agents of concern both in water and air at the
highly-urbanized lower HRE waterfront. These findings highlight the potential for
unique pathways of exposure that may connect people to aquatic pollution, via
aerosolized microbial agents of concern.
IV-8
METHODS Study Site and Meteorology
Field sampling took place on five full days between 5 June 2013 and 4 July 2013
at the Newtown Creek Nature Walk (NCNW) (40.7368528 N, 73.9464472 W), a public
park adjacent to the Newtown Creek Water Treatment Facility. Newtown Creek, once
one of the busiest hubs of NYC industrial activity, is a 3.5 mile creek forming the
northern and southern borders of Brooklyn and Queens has been heavily industrialized
and traveled since the mid 1800’s (US EPA 2010). Newtown Creek was declared an EPA
Superfund site in September 2010 and is known to have frequent sewage contamination
(including sewage-indicators and antibiotic resistant bacteria) of surface waters
(Riverkeeper 2011; Young et al. 2013).
A portable Vantage Pro2 Plus Weather Station (Davis Instruments, Hayward,
CA) was used to measure meteorological conditions including air temperature, wind
speed, and relative humidity. Total aerosol particle size and concentration was measured
using a stationary Met One 9012 Ambient Aerosol Particulate Profiler (Met One
Instruments, Grants Pass, OR). The profiler was placed about 3 m above water level
(depending on tidal height). During each aerosol sampling event, water surface salinity
and temperature were measured using a ThermoScientific Orion Star Portable
Multiparameter Meter (ThermoScientific, Waltham, MA).
Bacterial Aerosols
Culturable bacterial aerosol fallout was measured at the site during onshore wind
conditions by exposing triplicate agar plates per media type to ambient aerosols on a
IV-9
platform oriented into the wind. This sampling method (Dueker et al. 2011; Dueker et al.
2012a; Dueker et al. 2012b) is not representative of the total concentration of bacteria in
the air, but has the advantage of enumerating bacteria that are viable and able to grow on
the provided media at the time of exposure. Four types of media (each deployed in
triplicate during each exposure event) were used in these exposures: Reasoner´s 2A agar
(R2A) media (Fisher Scientific), R2A amended with ampicillin (50 mg/L) and R2A
amended with tetracycline (10 mg/L) and MEI (Membrane Enterococcus Indoxyl-β-D-
Glucoside) Agar (manufacturer-prepared plates, Molecular Toxicology, Inc.). R2A has
commonly been used in past aerosol studies to detect a broad spectrum of bacterial
species (Lighthart and Shaffer 1995; Shaffer and Lighthart 1997) and MEI Agar selects
for Enterococci, which are bacteria used as indicators of sewage presence as per the EPA
(US EPA Office of Water 2012).
Before each sampling day, 15 exposure plates were prepared for each media type
using aseptic technique in a laminar flow hood. For each media type, three plates served
as field controls, lab controls, 15-minute field exposures, 30-minute field exposures and
90 minute field exposures. After exposure in the field, all control and exposure plates
were incubated for three days at 25 °C in the dark, then colonies growing on antibiotic-
amended plates were transferred to fresh, unexposed antibiotic-amended media plates to
ensure antibiotic resistance. After five days total incubation, CFUs (Colony-Forming
Unit) on all incubated plates (control, exposure, and transfer plates) were counted and
then picked for future molecular analyses by transferring colony material to sterile
HyClone water (ThermoScientific, Waltham, MA). Bacterial aerosol fallout rate (CFU
m−2 s−1) for each exposure event was calculated using plate counts, the surface area of the
IV-10
exposed petri dishes (0.0079 m2), and the duration of exposure.
Surface Water Bacteria
Surface water was sampled by collecting water in 50-ml centrifuge tubes that
were rinsed three times with sample water prior to collection. Immediately after sample
collection, tubes were kept in the dark and on ice until returned to the lab. To assess
culturable bacterial concentrations in surface waters, a series dilution was created at a
1:10, 1:100 and 1:1000 dilution of sample water with autoclaved and filter-sterilized
HRE water. A 100 μL aliquot of each dilution was spread onto triplicate R2A,
R2A+Amp, and R2A+Tet plates in a laminar flow hood. Plates were incubated for five
days and CFUs enumerated and picked for molecular analysis as outlined for aerosol
plates above.
The presence of sewage-associated bacteria was inferred from the presence of the
indicator organism Enterococcus in surface waters and aerosols as outlined by EPA
regulations (US EPA Office of Water 2012). Colony growth on MEI selective media
exposures was enumerated after aerosol exposure (exposed simultaneously with R2A
plates above). After exposure, these plates were incubated in the dark at 41°C for 24
hours, after which CFUs were counted, picked for molecular analysis, and transferred to
fresh MEI plates to further confirm media selectivity.
Water-surface samples were processed using the EPA-approved IDEXX
Enterolert system (IDEXX Laboratories, Westbrook, ME) (Riverkeeper 2011; Suter et al.
2011). Briefly, within 6 hours of collection, surface water was diluted 1:10 using
autoclaved, filter-sterilized Newtown Creek surface water, and then added to liquid
media before being sealed in a Quanti-tray (IDEXX) and being incubated in the dark at
IV-11
41°C for 24 hours. After incubation, growth of Enterococci was confirmed and quantified
by exposing the Quanti-tray to UV light and recording the number of wells fluorescing
blue. This resulted in the most probable number (MPN) of Enterococci per ml of sample
water.
Molecular Analyses for Taxonomic Identification of Resistant Bacteria
To gain a preliminary understanding of the types of antibiotic resistant bacteria
present in waterfront aerosols and surface waters, colonies were picked from at least one
antibiotic-amended, aerosol-exposed and water surface media plate per sample date and
suspended in 50 μL of HyClone sterile water. This material was then boiled for five
minutes to lyse cells and frozen until polymerase chain reaction (PCR) analysis was
performed.
The 16S rRNA gene from DNA of lysed cells was amplified using universal
bacterial primers 8F (5′-AGRGTTTGATCCTGGCTCAG-3′) and 1492R (5′-
CGGCTACCTTGTTACGACTT-3′) (Teske et al. 2002). Thermocycling conditions
consisted of 35 cycles: 45s denaturation at 94°C, 45s of annealing at 55 ° C, and one min
elongation at 72 ° C. After PCR, gel electrophoresis was performed on PCR products to
ensure correct length of amplified fragments and that controls did not amplify.
Amplifications were then sent for single-pass Sanger sequencing to SeqWright Inc.
(Houston, TX). The sequence output files were edited using the Geneious software
package (www.geneious.com), exported in FASTA format and uploaded to the
Ribosomal Database Project (RDP) webserver (http://rdp.cme.msu.edu/) for alignment
and taxonomic classification to the level of genus with 80% confidence unless otherwise
noted.
IV-12
A GenBank top-hits analysis (Dueker et al. 2012a) was performed on aerosol
sequences to assess potential sources for these bacteria. Briefly, sequences were blasted
against the GenBank database using Geneious’ Megablast function, and the sequence hit
with the highest bit-score was designated the top hit for each sequence. The
environmental source reported for this top hit was then recorded.
RESULTS
During sampling days the mean velocity of onshore winds was very low, at 1.4 ±
0.3 m s-1, the average temperature was 23 ± 1 ºC and average relative humidity was 66 ±
4% (Table 1). Average water temperature was 22 ± 0.5 ºC, and average salinity was 16.9
± 0.4 ppt (Table 2). Enterococci were present in surface waters every sampling day, but
only exceeded EPA standards (EPA threshold for safe water contact = 104 cells/100 ml
for single-sample values) on 4 July 2013, when it exceeded the threshold by an order of
magnitude at 9,104 cells/100 ml (Table 2). These high sewage-indicator concentrations
followed a heavy rain event occurring late afternoon/evening of 3 July 2013 (Table 2).
Table 1. Meteorological context at Newtown Creek Nature Walk on sampling days. Mean of parameter during aerosol exposures, ± 1 standard deviation.
IV-13
Table 2. Surface water quality at Newtown Creek Nature Walk on sampling
days. Mean of parameter ± 1 standard deviation. Italics, bolded numbers in Enterococcus column indicate that Enterococcus concentrations exceeded EPA standards for single-sample values (104/100 ml).
Microbial fallout on R2A-only (no antibiotics) plates was significantly lower at NCNW
in comparison to the English Kills portion of Newtown Creek (Dueker et al. 2012a) and
Louis Valentino Pier (Dueker et al. In Review) (Fig. 1). Antibiotic-resistant bacteria (Fig.
2) and sewage-indicating bacteria were detected in water (Table 2) and aerosol (Table 3)
samples on each sampling day at this site. Colonies that initially grew on exposed
ampicillin plates transferred to new, unexposed R2A+Amp plates with 100% success,
confirming ampicillin resistance. The same was true for R2A+Tet plates that were
exposed for 15 or 45 minutes, but not for 90 minute exposures. R2A+Tet plates exposed
for 90 minutes had < 60% transfer success rates, suggesting that the sun was breaking
down the tetracycline during 90 minute exposures. Data and colonies from 90-minute
R2A+Tet exposure plates were therefore excluded from further analyses. All colonies
growing transferred to new MEI plates with 100% regrowth.
IV-14
Figure 1. Microbial fallout on R2A plates (no antibiotics) at Newtown Creek Nature Walk compared to previous studies conducted at Louis Valentino Pier (Dueker et al., In Review) and Newtown Creek English Kills (Dueker et al 2012b)
Table 3. Enterococcus growing on exposed MEI agar plates, with transfer
plate (selection confirmation) and molecular analysis results. ND = Not Determined (sequencing not yet performed).
IV-15
The percentage of bacterial fallout made up of antibiotic resistant bacteria was
significantly higher than the percentage of antibiotic resistant bacteria in the water (p <
0.01 for both R2A+Amp and R2A+Tet) (Figure 2). With the exception of exposures
conducted on 4 July 2013, bacterial fallout and surface water concentrations were linearly
related for R2A (R2 = 0.75), R2A+Amp (R2 = 0.48), and R2A+Tet (R2 = 0.69) (Fig. 3).
Molecular analysis conducted on colonies grown on MEI plates confirmed that
they were formed by Enterococcus faecalis (Table 3). After quality control, a total of 140
sequences from antibiotic resistant bacteria were used in analyses, 17 from aerosol
exposures and 123 from surface waters. RDP classification of these sequences revealed a
taxonomically diverse community of antibiotic-resistant bacteria in both water and air,
with Aeromonas, Acinetobacter, and Acidovorax dominating surface water resistant
Figure 2. Percentage of antibiotic resistance in surface water bacteria and bacterial aerosols (amp = ampicillin, tet=tetracycline). Black bars indiate standard error of geometric mean, letters above bars indicate significant difference (p < 0.01).
IV-16
bacteria and Roseomonas and Bacillus dominating viable resistant bacterial aerosols
(Table 4). The GenBank top-hits analysis of the resistant aerosols resulted in a broad
range of possible sources, including soil, water, and sewage (Table 5).
Figure 3. Microbial fallout vs. bacterial concentrations in surface waters. R2
and p-value of linear models (excluding 4 July 2013 data) noted.
IV-17
Table 4. RDP taxonomic classification (genus level) of antibiotic-resistant bacteria in air and water at the study site
IV-18
Table 5. Top-hits analysis of antibiotic-resistant bacterial aerosols sequenced in this study
IV-19
DISCUSSION Microbial agents of concern at the HRE waterfront
This study confirmed the presence of microbial agents of concern both in water
and air at the highly-urbanized NCNW waterfront. Antibiotic resistant and sewage-
indicating bacteria were detected at NCNW in both air and water on each sampling
day. This occurred despite the fact that bacterial fallout at this site was significantly
lower than fallout at other previously-studied HRE waterfront locations (Dueker et al.
2012a; Dueker et al. In Review). This lower fallout was most likely due to differences
in environmental and aerosol production conditions between sites. The Newtown
Creek English Kills site is currently being remediated through underwater bubbling,
which has been shown to increase aerosol particle concentrations over the waterway
(Dueker et al. 2012a). Studies at Louis Valentino Pier (LVP) (Dueker et al. In Review)
were conducted under much higher mean wind speeds than at the NCNW where wind
speeds were < 2 m s-1. Also, LVP is on a very busy harbor, with much more boat
activity (and therefore aerosol production) than at NCNW. The presence of microbial
agents of concern in NCNW aerosols under low fallout conditions strongly suggests
the presence, and possibly higher abundance, of microbial agents of concern at HRE
waterfront sites with higher fallout rates and contaminated surface waters.
Many of the resistant bacterial genera in water represented include potential
pathogens, including Aeromonas and Pseudomonas. Almost all of the resistant bacteria
were also in genera representing potential pathogens, including Bacillus, Burkholderia,
Comamonas, Massilia, and Roseomonas. Both the taxonomic composition and
percentages of antibiotic resistant bacteria in surface waters at this site agree with
IV-20
previous research conducted by Young et al. (2013). The presence of these genera in
aerosols at the waterfront indicates potential for public health impacts.
Preliminary Assessment of Antibiotic Resistant Aerosol Sources
Previous research at the HRE waterfront and Newtown Creek specifically has
shown that both terrestrial and aquatic sources influence the types of viable bacteria
present in aerosols (Dueker et al. 2012a; Dueker et al. In Review). Similar source
potentials for microbial agents of concern were found in these aerosols, with sewage
contamination strongly implicated.
Interestingly, higher percentages of the bacterial aerosols were antibiotic-resistant
(~22%) compared to bacteria found in surface waters (~2-8%) at this site. This indicates
different sources for antibiotic-resistant bacterial aerosols and/or selection processes
occurring through the aerosolization process. Aerosolized bacterial cells experience
extreme environmental stresses including desiccation and increased UV exposure.
Survival of these stresses, particularly under the relatively dry conditions (66% RH)
experienced during sampling, may require traits that are selected for during the
aerosolization process, favoring viability of certain bacteria over others. Although
determination of this is beyond the current study, it is interesting to note that the resistant
aerosols detected at NCNW include Bacillus, which can form endospores to survive
stressful environments (Leggett et al. 2012), Pseudomonas, which is known to survive
aerosolization in indoor environments (Walter et al. 1990), and a Roseomonas sequence
that closely matched an organism sampled previously from the Kennedy Space Center
clean room floor (accession: EU705114, Vaishampayan et al., unpublished).
IV-21
This study also found preliminary evidence of sewage-contaminated waters as a
source for microbial agents of concern detected in the waterfront air. The presence of
viable Enterococcus faecalis in aerosols is a strong indication of sewage influence on
aerosols at the site. Given the site’s proximity to the Newtown Creek Waste Water
Treatment Plant, sources for these organisms include the treatment facility itself.
However, these indicators were also present in surface waters every sampling day. The
GenBank top hits analysis of resistant bacterial aerosols also confirmed that many of the
resistant bacterial aerosols had been detected previously in aquatic and sewage-
contaminated environments.
Rain is known to introduce untreated raw sewage into the water (Riverkeeper
2011) and as per previous studies there is a linear connection between sewage presence
and antibiotic resistant bacteria (Young et al. 2013). Dueker et al. (in Review) found a
linear relationship between culturable bacterial aerosols and culturable surface water
bacterial concentrations at Louis Valentino Pier, indicating a connection between water
and air quality at this site. A similar relationship was observed at NCNW, with the
exception of sampling conducted on 4 July, with microbial fallout much lower than
expected given the high surface water bacterial concentrations. The outlier of 4 July 2013
may be explained by the fact that it had rained for 4 consecutive days just prior to
sampling (Table 2), which would cause spikes in bacterial concentrations of surface
waters through subsequent CSO releases.
IV-22
CONCLUSION
The outcome of this study provides a unique dataset confirming the presence
of microbial agents of concern both in water and air at the highly-urbanized lower
HRE waterfront. Many of the antibiotic resistant bacteria in water and air at the
NCNW site were members of bacterial genera known to contain human pathogens,
indicating potential public health implications for exposure to waterfront aerosols.
Sources for these bacterial aerosols included terrestrial and aquatic environments. The
presence of viable Enterococcus faecalis and other aquatic and sewage-associated
antibiotic-resistant bacteria in waterfront aerosols indicate that sewage pollution may
play an important role in the presence of microbial agents of concern at this site.
Similarities between antibiotic-resistant bacteria found in surface waters at NCNW
and Flushing Bay suggest that this study’s findings may be applicable to other sewage-
contaminated HRE waterfront sites. Further research into sources for these aerosolized
microbial agents of concern is merited.
IV-23
ACKNOWLEDGMENTS
This report was made possible by generous support from the Hudson River
Foundation. Special thanks to the Tibor T. Polgar committee for study guidance and
feedback, Gregory O’Mullan for his participation in study design and use of his CUNY
Queens College lab, and to Roman Reichert and Angel Montero for laboratory analysis
training and support.
IV-24
REFERENCES Aller, J. Y., M. R. Kuznetsova, C. J. Jahns and P. F. Kemp. 2005. The sea surface
microlayer as a source of viral and bacterial enrichment in marine aerosols. Journal of Aerosol Science 36: 801-812.
Baertsch, C., T. Paez-Rubio, E. Viau and J. Peccia. 2007. Source tracking aerosols
released from land-applied class B biosolids during high-wind events. Applied and Environmental Microbiology 73: 4522-4531.
Blanchard, D. C. 1989. The ejection of drops from the sea and their enrichment with
bacteria and other materials - a Review. Estuaries 12: 127-137. Brandi, G., M. Sisti and G. Amagliani. 2000. Evaluation of the environmental impact of
microbial aerosols generated by wastewater treatment plants utilizing different aeration systems. Journal of Applied Microbiology 88: 845-852.
Carducci, A., E. Tozzi, E. Rubulotta, B. Casini, L. Cantiani, E. Rovini, M. Muscillo and
R. Pacini. 2000. Assessing airborne biological hazard from urban wastewater treatment. Water Research 34: 1173-1178.
de Leeuw, G., F. P. Neele, M. Hill, M. H. Smith and E. Vignali. 2000. Production of sea
spray aerosol in the surf zone. Journal of Geophysical Research-Atmospheres 105: 29397-29409.
Dueker, M. E., K. C. Weathers, G. D. O'Mullan, A. R. Juhl and M. Uriarte. 2011.
Environmental controls on coastal coarse aerosols: Implications for microbial content and deposition in the near-shore Eenvironment. Environmental Science & Technology 45: 3386-3392.
Dueker, M. E., G. D. O'Mullan, A. R. Juhl, K. C. Weathers and M. Uriarte. 2012a. Local
environmental pollution strongly influences culturable bacterial aerosols at an urban aquatic Superfund site. Environmental Science & Technology 46: 10926-10932.
Dueker, M. E., G. D. O'Mullan, K. C. Weathers, A. R. Juhl and M. Uriarte. 2012b.
Coupling of fog and marine microbial content in the near-shore coastal environment. Biogeosciences 9: 803-813.
Dueker, M. E., G. D. O'Mullan, A. R. Juhl, K. C. Weathers and M. Uriarte. In Review.
Wind strengthens bacterial connections between water quality and air quality at an urban waterfront. Atmospheric Environment.
IV-25
Feinmen, S. E. 1998. Antibiotics in animal feed: drug resistance revisited. American
Society for Microbiology News 64: 64:24-30. Heinonen-Tanski, H., T. Reponen and J. Koivunen. 2009. Airborne enteric coliphages
and bacteria in sewage treatment plants. Water Research 43: 2558-2566. Jungkind, D. L., J. E. Mortensen, H. S. Fraimow and G. B. Calandra. 1995. Antimicrobial
resistance -- a crisis in health care. Advances in Experimental Medicine and Biology 1-248.
Khachatourians, G. G. 2013. Agricultural use of antibiotics and the evolution and transfer
of antibiotic-resistant bacteria. Canadian Medical Association Journal Volume 159, Issue 9, pages 1129-1136, 1998
Kim, S., H. Park and K. Chandran. 2010. Propensity of activated sludge to amplify or
attenuate tetracycline resistance genes and tetracycline resistant bacteria: a mathematical modeling approach. Chemosphere 78: 1071-1079.
King, M.-F., C. J. Noakes, P. A. Sleigh and M. A. Camargo-Valero. 2013. Bioaerosol
deposition in single and two-bed hospital rooms: A numerical and experimental study. Building and Environment 59: 11.
Korzeniewska, E., Z. Filipkowska, A. Gotkowska-Plachta, W. Janczukowicz, B. Dixon
and M. Czulowska. 2009. Determination of emitted airborne microorganisms from a BIO-PAK wastewater treatment plant. Water Research 43: 2841-2851.
Leggett, M. J., G. McDonnell, S. P. Denyer, P. Setlow and J. Y. Maillard. 2012. Bacterial
spore structures and their protective role in biocide resistance. Journal of Applied Microbiology 113: 485-498.
Levy, S. B. 1998. The challenge of antibiotic resistance. Scientific American 278: 46-53. Lighthart, B. and B. T. Shaffer. 1995. Viable bacterial aerosol particle size distributions
in the midsummer atmosphere at an isolated location in the high desert chaparral. Aerobiologia 11: 19-25.
Liu, D. J., T. J. Chai, X. Z. Xia, Y. W. Gao, Y. M. Cai, X. X. Li, Z. M. Miao, L. Y. Sun,
H. Y. Hao, U. Roesler and J. Wang. 2012. Formation and transmission of Staphylococcus aureus (including MRSA) aerosols carrying antibiotic-resistant genes in a poultry farming environment. Science of the Total Environment 426: 139-145.
Monahan, E. C., C. W. Fairall, K. L. Davidson and P. J. Boyle. 1983. Observed
IV-26
interrelations between 10m winds, ocean whitecaps and marine aerosols. Quarterly Journal of the Royal Meteorological Society 109: 379-392.
Muscillo, M., G. La Rosa, A. Carducci, L. Cantiani and C. Marianelli. 1997. Molecular
analysis of poliovirus 3 isolated from an aerosol generated by a waste water treatment plant. Water Research 31: 3125-3131.
Muzslay, M., G. Moore, J. F. Turton and A. P. Wilson. 2013. Dissemination of antibiotic-
resistant enterococci within the ward environment: The role of airborne bacteria and the risk posed by unrecognized carriers. American Journal of Infection Control 41: 57-60.
Niemi, G., D. Wardrop, R. Brooks, S. Anderson, V. Brady, H. Paerl, C. Rakocinski, M.
Brouwer, B. Levinson and M. McDonald. 2004. Rationale for a new generation of indicators for coastal waters. Environmental Health Perspectives 112: 979-986.
Nikiforuk, A. 1996. The Fourth Horseman: a Short History of Plagues, Scourges, and
Emerging Viruses. Toronto, Penguin. NOAA. 2013. State of the Coast. http://stateofthecoast.noaa.gov/ (accessed [INSERT
DATE] 2013). Radke, M. 2005. Sterols and anionic surfactants in urban aerosol: Emissions from
wastewater treatment plants in relation to background concentrations. Environmental Science & Technology 39: 4391-4397.
Riverkeeper 2011. How's The Water? Sewage Contamination in the Hudson River
Estuary 2006-2010. Riverkeeper, Ossining, NY. Schulz, J., A. Friese, S. Klees, B. A. Tenhagen, A. Fetsch, U. Rosler and J. Hartung.
2012. Longitudinal study of the contamination of air and of soil surfaces in the vicinity of pig barns by livestock-associated Methicillin-resistant Staphylococcus aureus. Applied and Environmental Microbiology 78: 5666-5671.
Shaffer, B. T. and B. Lighthart. 1997. Survey of culturable airborne bacteria at four
diverse locations in Oregon: Urban, rural, forest, and coastal. Microbial Ecology 34: 167-177.
Suter, E., A. R. Juhl and G. D. O’Mullan. 2011. Particle association of Enterococcus and
total bacteria in the lower Hudson River Estuary, USA. Journal of Water Resource and Protection 3: 715-725.
Tourlousse, D. M., F. Ahmad, R. D. Stedtfeld, G. Seyrig, M. Duran, E. W. Alm and S. A.
Hashsham. 2008. Detection and occurrence of indicator organisms and pathogens. Water Environment Research 80: 898-928.
IV-27
USEPA. 2010. Newtown Creek, EPA Region 2: NPL Listing History. ID: NYN00020628.
USEPA Office of Water. 2012. Recreational Water Quality Criteria, 820-F-12-058: 69. US Office of Technology Assessment. 1995. Impacts of antibiotic resistant bacteria. Walter, M. V., B. Marthi, V. P. Fieland and L. M. Ganio. 1990. Effect of aerosolization
on subsequent bacterial survival. Applied And Environmental Microbiology 56: 6.
Woodcock, A. H. 1955. Bursting bubbles and air pollution. Sewage and Industrial Wastes
27: 1189-1192. Young, S., A. R. Juhl and G. D. O'Mullan. 2013. Antibiotic resistant bacteria in the
Hudson River Estuary linked to wet weather sewage contamination. Journal of Water and Health 11: 297-310.
V-1
OCCURRENCE AND ECOLOGICAL EFFECTS OF AMPHETAMINE TYPE STIMULANTS IN WASTEWATER EFFLUENT
A Final Report of the Tibor T. Polgar Fellowship Program
Alexis M. Paspalof
Polgar Fellow
School of Natural Resources University of Nebraska-Lincoln
Lincoln, NE 68508
Project Advisors:
Daniel Snow School of Natural Resources
University of Nebraska-Lincoln Lincoln, NE 68508
Emma Rosi-Marshall Cary Institute of Ecosystem Studies
Millbrook, NY 12545
Paspalof, A.M., D. Snow, and E. Rosi-Marshall. 2015. Occurrence and Ecological Effects of Amphetamine Type Stimulants in Wastewater Effluent. Section V: 1-24 pp. In D.J. Yozzo, S.H. Fernald and H. Andreyko (eds.), Final Reports of the Tibor T. Polgar Fellowship Program, 2013. Hudson River Foundation.
V-2
ABSTRACT
The presence of illicit drugs and their metabolites has become an increasingly
important topic worldwide, and their potential ecological effects are essentially unknown.
Some of the most interesting of these illicit compounds are the amphetamine type
stimulants (ATSs). Very little research has been conducted in the Hudson River Valley
(HRV) to determine the presence of various pharmaceuticals, let alone illicit drugs. This
report provides information from the summer of 2013 as to the presence of ATSs and
several other pharmaceutical compounds at six different sites in the HRV. Amphetamine
(AMPH) was detected at one site, the outflow of Kingston’s wastewater treatment plant
(WWTP). The detection at a combined sewer overflow (CSO) point indicates the release
of ATSs into the HRV, but lack of detects suggests these compounds are subjected to
high dilution and therefore persist at concentrations below current technologies limit of
detection. The ability to derivatize and quantify dopamine and other catecholamines in
algae is discussed in this report. This is in response to possible biological effects ATSs
have on the presence of catecholamines such as dopamine within algae. Detection by
high performance liquid chromatography (HPLC) coupled with fluorescence was first
evaluated, but determined to lack the sensitivity desired for this research. Currently a
method utilizing derivatization with N-Methyl-N-trimethylsily Trifluoroacetamide
(MSTFA) and detection using gas chromatography mass spectrometry (GC-MS) is being
developed. This research lays the framework for artificial stream experiments that will be
conducted in the spring of 2014 in which chronic exposure of biofilms will be monitored
from the three northern sites. All six sites and an additional two sites, Fort Montgomery
and Haverstraw Bay, are a part of a long term research project directed by the Cary
Institute of Ecosystem Studies. This group has water quality data dating back over twenty
years from a study that has focused on the impacts of the zebra muscle Dreissena
polymorpha (Strayer et al. 2004), making their sites perfect locations for the study of
pharmaceutical analysis.
Three other sites in surrounding tributaries of the Hudson River were sampled in
June 2013 (Figure 3 D-F). These sites were chosen based upon collaboration with the
Hudson River Keeper, and coordinated with
several sampling sites they visit on a
regular basis to monitor the prevalence of
the sewage indicating bacteria Enterococci.
One location on the Esopus, Catskill, and
Rondout Creeks was visited with the goal
of again determining the extent to which
these areas are polluted with amphetamines
and to collect algal samples.
SAMPLING
Study sites: Hudson River
At each sampling site, a single
water sample and six algae samples were
collected. Water samples were filtered in
the field using a GeopumpTM (Figure 4). The water was collected directly off the boat and
Figure 3. Locations of the six sampling
sites visited within the HRV: A - Albany, B – Castleton,
C – Coxsackie, D – Catskill Creek, E – Esopus Creek, F – Kingston WWTP
V-11
then placed in an amber glass jar for analysis at a later date. At these sites, algae was
sampled directly from the water column. In the case of the Coxsackie site, water and
algae samples were collected directly from shore due to equipment issues concerning the
boat that was being used. Algal samples were filtered from the water column onto
0.47μm glass fiber filter paper using the Geo-pump. Water was filtered directly from the
river into a graduated cylinder to ensure accurate filtrate measurements.
Study sites: Tributaries
Water samples were collected from
the three tributary sites in a similar fashion
to that described above for the Coxsackie
site; however, at these three sites benthic
algae was collected instead of algae within
the water column. Six rocks at each site
were bagged and put on ice for transport to
the Cary Institute of Ecosystem Studies,
where each rock was processed. Each rock
was individually cleaned by rinsing with deionized water and carefully scrubbed in order
to remove biofilms. The water used to rinse and wash the rocks was measured and
recorded. A fixed amount of this water was filtered through 0.47μm glass fiber filter
paper to determine chlorophyll a, ash free dry mass, and potentially other pigments.
Algae were then filtered onto three additional filters for later determination of potential
catecholamine concentrations.
Figure 4. Water sample collection
off the side of the Cary Institute boat at the Albany sampling site.
V-12
PROCESSING WATER SAMPLES
Collected water samples were put on ice and transported back to the Cary Institute
where they were frozen upon arrival. To quantify ATSs and other pharmaceutical
compounds solid phase extraction (SPE) was conducted using HLB 6cc cartridges. Each
cartridge was initially primed with deionized water and acetone. Cartridges with sample
extracts were then transported to the University of Nebraska-Lincoln, where they were
eluted with 6 ml of Optima grade acetone. Samples were then blown down to dryness
under vacuum and constant stream of nitrogen gas. For each sample, 200 μl of
methanol/water (50:50) was added, as well as 100 ng of internal standard. Samples were
analyzed using liquid chromatography tandem mass spectrometry (LC/MS), a technique
that has been proven to provide best analytical results for illicit drugs and metabolites
(Castiglioni et al. 2006a; Castiglioni et al. 2006b; Pal et al. 2012).
After initial analysis, it was determined that acetone alone did not provide
quantitative recovery for some compounds. Cartridges were re-eluted with 6 ml of
Optima grade methanol. This was combined with the original extracts and the steps above
were repeated for re-analysis. This additional step improved recovery of compounds in a
method limit detection test.
MEASURING DOPAMINE
Algae samples were collected on glass fiber filters as stated above and then kept
frozen until analysis. Dopamine and other catecholamine levels in algae were extracted
using methods described by Van Alstyne et al (2006) combined with a derivatiztion
method described by Suzuki et al. (2003). Approximately 0.1g of algae was frozen for 36
hours in 80% aqueous methanol (MEOH) at -16°C. Then, 2 ml of each extract was
V-13
filtered using a GF/A glass fiber filter followed by a 0.2 μm filter following Van Alstyne
et al. (2006). Extracts were then blown down to dryness under vacuum and a steady
stream of nitrogen gas. Dried samples had 50μl MSTFA with 1% TCMS and 50μl
pyridine added before being capped and placed on a vortex for approximately 10 seconds
(Suzuki et al. 2003). This mixture was then incubated at 40°C for 30 minutes and a 1 μl
sample analyzed via GC-MS.
RESULTS
PRESENCE OF CONTAMINANTS
Initial analysis of water samples from each field site resulted in no detects of
ATSs; however, there were consistent detects of 1,7-dimethylxanthine, acetaminophen,
caffeine, and DPH in a majority of locations sampled. Highest detects were seen in
tributary sites, which is likely a result from sampling of smaller streams. Re-elution of the
HLB cartridges with methanol was able to improve the detection of amphetamine,
carbamazepine and cotinine.
Figure 5 (A and B) refers to the compounds that were detected at the Hudson
River sites and tributaries, respectively. Amphetamine was only detected at the Kingston
WWTP site (Figure 6). Fewer detects of ATSs potentially resulted from high dilution of
the contaminants being released within the HRV. A more complete overview of the
amounts of each compound detected is presented in Table 1.
V-14
Figure 5. (A) Concentrations of pharmaceutical compounds detected at the
three sampling sites on the main stem of the Hudson River. (B) Concentrations of pharmaceutical compounds detected at three tributary sites within the HRV.
Dihydroxybenzylamine. M/z of 355 and 147 for both norepinephrine and epinephrine
were also monitored since initial tests indicated multiple derivatives were produced for
these compounds.
DISCUSSION
The results of this study did not demonstrate large amounts of amphetamines
within effluent and receiving water in the HRV; however, detection of amphetamine at
Kingston’s WWTP effluent outflow does indicate the potential for the occurrence of
these stimulants. Limited detections of target compounds are most likely due to high
dilution factors. Due to the high cost of analysis, few water samples could be processed.
This limited the number of sampling sites visited (Figure 3).
A majority of sampling was done after large rain events. The relevance of this is
due to the use of CSOs along the Hudson River. CSOs are designed to collect rainwater,
domestic sewage and industrial wastewater within the same pipe and route it all to
various WWTPs. Several issues arise during or immediately following large rain events
as pipes become overloaded and raw sewage bypasses WWTPs, to be released directly
into streams and rivers (EPA 1994). Therefore, the pharmaceutical information presented
in this paper is a good indication of what can be expected to be present after large rain
events. Further research could potentially lead to detection of compounds not analyzed in
this study, as well as detection of compounds that were not seen at these six sampling
sites.
V-18
Of the compounds that were consistently detected, there is cause for some
concern regarding the persistence of DPH and carbamazepine (Table 1). DPH has been
known to cause behavioral changes in fathead minnows (Pimephales promelas)
(Berninger et al. 2011). Carbamazepine has been identified as a compound that alters
feeding behavior (Nassef et al. 2010), impairs growth (Van den Brandhof and Monforts
2010), and induces stress responses in several different fish species (Li and Brownawell
2010). The detection of these two compounds as well as amphetamine, acetaminophen,
and thiabendazole provides new information in addition to what has been previously
identified (Kolpin et al. 2002; Yu et al. 2006; Palmer et al. 2008; Cantwell et al. 2010; Li
and Brownawell 2010; Reiner and Kanna 2011; Liao et al. 2012).
Determination of catecholamines in algae has not been completed at this point in
time. Initially, catecholamines were to be derivatizated with 6-aminoquinolyl-N-
hydroxysuccinimidyl (AQC) and then measured with HPLC-fluorescence. Initial tests
yielded broad peaks and relatively low sensitivity. To improve the derivatization of
catecholamines, new AQC was synthesized following Cohen and Michaud (1993) and a
new C-18 column was purchased from Thermo Scientific. When results did not improve,
a borate buffer with ascorbate and EDTA was used to aid in the derivatization. Boughton
et al. (2011) indicated that this small change should improve the recovery of target
cartecholamines and slow the breakdown of derivatives; however, these changes did not
result in improved peaks or sensitivity, so it was determined that HPLC was not sensitive
enough.
It was decided that GC-MS analysis similar to methods in Suzuki et al. (2003)
was a more practical way to measure dopamine and other compounds within algae. Initial
V-19
analysis of algae collected at Esopus Creek, Catskill Creek and the Kingston WWTP
showed no detects at the 0.25 ng/μl detection limit. Samples from Albany, Castleton and
Coxsackie have not been processed at this time due to the small algal samples collected
from these sites. The lack of detection of catecholamines from the samples that were
processed may have resulted from small sample sizes (~0.1g), or, alternatively, the
specific algal species collected does not possess the ability to create these
catecholamines. The algae processed by Van Alstyne et al. (2006) was Ulvaria obscura, a
marine green algae. A pure culture experiment will be run in the future using a species
similar to U. obscura.
The information presented in this study is a precursor to experiments that will be
conducted within artificial streams. Stream experiments were originally planned for fall
2013, but since this work involves the use of controlled substances a special permit was
needed before any work could begin. Though the permit has now been obtained, these
experiments will be postponed until spring 2014. This will allow for determination of the
best possible method to extract catecholamines from algae, as well as determine
concentrations of amphetamine to spike artificial streams.
V-20
ACKNOWLEDGMENTS
The authors wish to thank the Hudson River Foundation and the Polgar
Fellowship Committee for their support in the efforts of this research. A special thanks
also goes to the researchers at the Cary Institute of Ecosystem Studies and River Keeper,
especially Captain John Lipscomb, for their assistance.
V-21
REFERENCES Bartelt-Hunt, S. L., D. D. Snow, T. Damon, J. Shockley, and K. Hoagland. 2009. The
occurrence of illicit and therapeutic pharmaceuticals in wastewater effluent and surface waters in Nebraska. Environmental Pollution 157:786-791.
Berninger, J.P., B. Du, K.A. Conners, S.A. Eytcheson, M.A. Kolkmeier, K.N. Prosser,
T.W. Valenti Jr., C.K. Chambliss, and B.W. Brooks. 2011. Effects of the antihistamine diphenhydramine on selected aquatic organisms. Environmental Toxicology and Chemistry 30:2065-2072.
Biederman, J. and S.V. Faraone. 2005. Attention-deficit hyperactivity disorder. The
Lancet 366:237-248. Bijlsma, L, J.V. Sancho, E. Pitarch, M. Ibáñez, and F. Hernández. 2009.
Simultaneous ultra-high pressure liquid chromatography–tandem mass spectrometry determination of amphetamine and amphetamine-like stimulants, cocaine and its metabolites, and a cannabis metabolite in surface water and urban wastewater. Journal of Chromatography A 1216:3078–3089.
Boughton, B.A, D.L. Callahan, C. Silva, J. Bowne, A. Nahid, T. Rupasinghe, D.L. Tull,
M.J. McConville, A. Bacic, and U. Roessner. 2011. Comprehensive profiling and quantitation of amine group containing metabolites. Analytical Chemistry 83:7523-7530.
Brodin, T., J. Fick , M. Jonsson, and J. Klaminder. 2013. Dilute concentrations of a
psychiatric drug alter behavior of fish from natural populations. Science 339:814-815.
Burgess, and J.P. Smith. 2010. Temporal trends of triclosan contamination in dated sediment cores from four urbanized estuaries: evidence of preservation and accumulation. Chemosphere 78:347-352.
Castiglioni, S., R. Bagnati, R. Fanelli, F. Pomati, D. Calamari, and E. Zuccato. 2006a.
Removal of pharmaceuticals in sewage treatment plants in Italy. Environmental Science & Technology 40:357-363.
Castiglioni, S., E. Zuccator, E. Crisci, C. Chiabradno, R. Fanelli, and R. Bagnati. 2006b.
Identification and Measurement of Illicit Drugs and Their Metabolites in Urban Wastewater by Liquid Chromatography−Tandem Mass Spectrometry. Analytical Chemistry 78:8421–8429.
Centers for Disease Control and Prevention (CDC). 2005. Mental health in the United States: Prevalence of diagnosis and medication treatment for attention-deficit/hyperactivity disorder—United States. Morbidity Mortality Weekly Report 54:842–847.
Cody , J.T., S. Valtier, and S.L. Nelson. 2003. Amphetamine enantiomer excretion profile
following administration of Adderall. Journal of Analytical Toxicology 27:485-492.
Cohen, S.A. and D.P. Michaud. 1993. Synthesis of a fluorescent derivatizing reagent 6
aminoquinolyl-N-hydroxysuccinimidyl carbamate, and its application for the analysis of hydrolysate amino acids via high performance liquid chromatography. Analytical Biochemistry 211:279-287.
Environmental Protection Agency (EPA). 1994. Combined sewer overflow (CSO) control policy. Federal Register 59:18688-18698.
Heberer, T. 2002. Occurrence, fate, and removal of pharmaceutical residues in the
aquatic environment: a review of recent research data. Toxicology Letters 131:5-17.
Huerta-Fontela, M, M.T. Galceran, J. Martin-Alonso, and F. Ventura. 2008. Occurrence
of psychoactive stimulatory drugs in wastewaters in north-eastern Spain. Science of the Total Environment 397:31-40.
chemical integrative sampling and liquid chromatography–Electrospray/ion-trap mass spectrometry for sssessing selected prescription and illicit Drugs in treated sewage effluents. Archives of Environmental Contamination and Toxicology 47:427-439.
Kasprzyk-Hordern, B., R.M. Dinsdale, and A.J. Guwy. 2008. The occurrence of
pharmaceuticals, personal care products, endocrine disruptors and illicit drugs in surface water in South Wales, UK. Water Research 42:3498–3518.
Kessler, R.C., L. Adler, R. Barkley, J. Biederman, C.K. Conners, O. Demler, S.V.
Faraone, L.L. Greenhill, M.J. Howes, K. Secnik, T. Spencer, T.B. Ustun, E.E. Walters, and A.M. Zaslavsky. 2006. The prevalence and correlates of adult ADHD in the United States: Results from the National Comorbidity Survey Replication. American Journal of Psychiatry 163:716–723.
H.T. Buxton. 2002. Pharmaceuticals, hormones, and other organic wastewater contaminants in U.S. streams, 1999-2000: a national reconnaissance. Environmental Science Technology 36:1202-1211.
V-23
Kuklin, A.I. and B.V. Conger. 1995. Catecholamines in plants. Journal of Plant Growth Regulation 14:91-97.
Li, X., and B.J. Brownawell. 2010. Quaternary ammonium compounds in urban estuarine
sediment environments – a class of contaminants in need of increased attention. Environmental Science Technology 44:7561-7568.
Liao, C., F. Liu, H.B. Moon, N. Yamashita, S. Yun, and K. Kannan. 2012. Bisphenol
analogues in sediments from industrialized areas in the United States, Japan, and Korea: spatial and temporal distributions. Environmental Science & Technology 46:11558-11565.
Nassef, M, S. Matsumoto, S. Masanori, F. Khalil, I.J. Kang, Y. Shimasaki, Y. Oshima,
and T. Honjo. 2010. Acute effects of triclosan, diclofenac and carbamazepine on feeding performance of Japanese medaka fish (Oryzias latipes). Chemosphere 80:1095-1100.
Pal, R., M. Megharaj, K.P. Kirkbride, and R. Naidu. 2012. Illicit drugs and the
environment—a review. Science of the Total Environment 464:1079-1092. Palmer, P.M., L.R. Wilson, P. O’Keefe, R. Sheridan, T. King, and C.Y. Chen. 2008.
Sources of pharmaceutical pollution in the New York City watershed. Science of the Total Environment 394:90-102.
Postigo, C., M.J López de Alda, and D. Barceló. 2008. Drugs of abuse and their
metabolites in the Ebro River basin: Occurrence in sewage and surface water, sewage treatment plants removal efficiency, and collective drug usage estimation. Environment International 36:75-84.
Reiner, J.L. and K. Kanna. 2011. Polycyclic musks in water, sediment, and fishes from
the upper Hudson River, New York, USA. Water, Air, & Soil Pollution. 214:335-342.
Strayer, D.L., K.. Hattala, and A.W. Kahnle. 2004. Effects of an invasive bivalve (Dreissena polymorpha) on fish in the Hudson River estuary. Journal of Fisheries and Aquatic Sciences 61:924-941.
Suzuki, M., M. Mizoguchi, F. Yano, U. Hara, M. Yokoyama, and N. Watanabe. 2003.
Changes in catecholamine levels in short day-induced cotyledons of Pharbitis nil. Journal of Biosciences 58:220-224.
Ternes, T.A. 1998. Occurrence of drugs in German sewage treatment plants and rivers.
Water Resources 32:3245-3260.
V-24
Van Alstyne, K.L., A.V. Nelson, J.R. Vyvyan, and D.A. Cancilla. 2006. Dopamine functions as an antiherbivore defense in the temperate green alga Ulvaria obscura. Oecologia 148:304–311.
Van den Brandhof, E.J., and M. Montforts. 2010. Fish embryo toxicity of carbamazepine,
diclorenac and metoprolol. Ecotoxicology and Environmental Safety 73:1862-1866.
Yu, J.T., E.J. Bouwer, and M. Coelhan. 2006. Occurrence and biodegradability studies of
select pharmaceuticals and personal care products in sewage effluent. Agriculture Water Management 86:72-80.
Zuccato, E., D. Calamari, M. Natangelo, and R. Fanelli. 2000. Presence of therapeutic
drugs in the environment. The Lancet 355:1789-1790. Zuccato, E., S. Castigloni, R. Bagnati, C. Chiabrando, P. Grassi, and R. Fanelli. 2008.
Illicit drugs, a novel group of environmental contaminants. Water Research 42:961-968.
VI-1
THE DISTRIBUTION OF INVASIVE CELASTRUS ORBICULATUS IN AN ANTHROPOGENICALLY DISTURBED RIPARIAN ECOSYSTEM
A Final Report to the Tibor T. Polgar Fellowship Program
Shabana Hoosein
Polgar Fellow
Ecology and Evolutionary Biology Program State University of New York at Albany
Albany, NY 12222
Project Advisor:
George Robinson Ecology and Evolutionary Biology Program
State University of New York at Albany Albany, NY 12222
Hoosein, S. and G. Robinson. 2015. The Distribution of Invasive Celastrus orbiculatus in an Anthropogenically Disturbed Riparian Ecosystem. Section VI: 1-32 pp. In D.J. Yozzo, S.H. Fernald and H. Andreyko (eds.), Final Report of the Tibor T. Polgar Fellowship Program, 2013. Hudson River Foundation.
VI-2
ABSTRACT
The Hudson River Estuary has been colonized by numerous terrestrial invasive
plant species, due in part to its history of anthropogenic and natural disturbance riparian
dynamics. This study investigates the spatial patterns of a widespread invasion by
Oriental (or Asiatic) bittersweet (Celastrus orbiculatus Thunb) in Schodack Island State
Park, Rensselaer and Columbia Counties. The Park is home to rare species and
communities, several of which are threatened by the encroachment of bittersweet.
Bittersweet populations were mapped and surveyed on a fixed grid throughout the island,
to determine distribution patterns. Stem densities were approximately 50% higher in sites
with dredged material substrate. Local experimental tests were carried out to investigate
the establishment limitations of new populations. Five site types were selected based on
substrate properties (dredged material and forest floodplain) and local bittersweet
densities. Ten greenhouse-grown seedlings (transplants) and 100 seeds were planted at
each site, and then tracked for their survival, growth, and evidence of mycorrhizal
inoculation. Transplants survived and grew at similar rates among the five experimental
site types, but seed germination varied, with the highest rate in the dredged material
zones (p=0.05). No ectomycorrhizae were found on roots of experimental transplants,
seedlings, or wild-growing bittersweet, consistent with previous greenhouse studies by
other researchers. These results indicate that controlling bittersweet populations and
expansion should be focused on habitat management in dredged material-covered areas,
which represent a large fraction of the island’s upland area.
tidal marsh, freshwater tidal swamp, and floodplain forest (NY NHP 2005). The park is a
designated Bird Conservation Area (NYS DEC 2012), Department of State Significant
Coastal Fish and Wildlife Habitat, and Significant Scenic Area (NYS DOS 2012). Since
at least 1965, the site has supported a breeding population of Cerulean Warbler
(Setophaga cerulea; NYS Species of Special Concern), with 13 singing males counted in
1997 (Barbour and Kiviat 2001), and their presence reconfirmed in 2012 by NY Audubon
volunteers. Bald Eagle (Haliaeetus leucocephalus) maintain two active nests, Osprey
(Pandion haliaetus) are commonly observed roosting and foraging, and a resident Great
Blue Heron (Ardea herodias) colony contains about 50 nests.
Schodack Island began as a set of alluvial islands, once used for agriculture by
Native Americans. Beginning in the 1920’s, dredged material was deposited up to 2 m
above river level, creating a single land mass that is a mosaic of natural and artificial
topography and soils (Miller et al. 2006). Schodack Island State Park, which includes all
but the southern tip of the island (still an active USACE dredged material placement
area), was established in 2002, and several rounds of planning identified the significance
of its avian habitats as well as the threats they faced (NYS OPRHP 1998; C&S Engineers
1998; Barbour and Kiviat 2001). The most prominent invasive species is Oriental
bittersweet.
VI-11
Experimental Design
Survey
In summer-fall 2012, operating with a research permit from NY State Parks, thirty
transects were mapped out along the E-W axis of the island. Each transect was separated
by 230 m on the N-S axis (which is totaled at 9.5 km) creating a grid within the park
boundaries. Bittersweet populations were surveyed at 146 grid points (Figure 1).
Figure 1. Map of bird habitats, roads/trails and experimental survey grid on Schodack Island. Survey points are noted as the intersection between N-S and E-W transects.
VI-12
Within a 2 m radius of each point, UTM coordinates, stem densities of cane-
forming and climbing bittersweet, thickest stem diameters, and reproductive status were
recorded. All climbing bittersweet were cut at 0.5 m above ground level, to investigate
future regrowth patterns. Rapid assessments were made along roads and trails throughout
the park to locate larger bittersweet lianas (> 2 cm dia.), which were mapped, measured,
cut and aged.
Phytometer Experiment
In November 2012, approximately 4,000 bittersweet fruits (with 3-5 seeds each)
were collected from random locations across Schodack Island, and approximately 5,000
seeds were cleaned, batched, and stored under refrigeration (Young and Young 1992).
Preliminary tests indicate germination rates of about 70% in the greenhouse (Figure 2). In
March 2013, more than 1,000 seeds began germination in the greenhouse, planted in pots
of sterile medium, watered and fertilized, in preparation for field transplantation, which
occurred May 29-June 23, 2013. Transplants were grown in pots with 10 other seeds in
the greenhouse. During installation, transplants were separated in to groups with 2-4
individuals, thinning out weaker seedlings to keep densities low.
VI-13
Figure 2. Scatter plot showing Oriental bittersweet time to germination in a greenhouse. Graph shows a logarithmic regression with a cluster of individuals germinating within 20 days and a second cluster of individuals germinating between 40-50 days.
Phytometer Bittersweet Densities
Twenty-five experimental sites were selected on the basis of five site categories
(Figure 3), with five replicates of each. High, low and absent densities of Oriental
bittersweet were quantified into categories based on the field survey (Figure 5). High
densities consisted of survey points that had more than 16 stems per 2m2. Low densities
consisted of survey points that had between 1-10 stems per 2m2. Absent densities
consisted of survey points that had 0 stems per 2m2. Soil classifications were roughly
based on habitat community maps provided by The New York Natural Heritage Program
(Figure 3b).
VI-14
Table 1. Matrix of experimental site categories, designated on the basis of previous surveys and observations. Bittersweet has not been observed at high densities in wetter, low-lying areas on Schodack Island. Site-specific Dredged Flood- bittersweet densities Material plain High X Low X X Absent X X
VI-15
Figure 3. Map showing habitat communities and phytometer experimental sites. The number correlated with each point identifies the waypoint for each site. Warm colored points (red, pink, purple) represent sites on the dredged material habitat. Cool colored points (blue, green) represent the sites on the native floodplain forest. H (high), L (low), A (absent) is a quantification of the adult bittersweet communities at each site.
Native vs. Non-native Soil Type
At each site, 10 transplant seedlings and 100 seeds were planted in mapped and
marked locations. Transplants were grouped in clusters of 2-4 stems and planted within a
one meter diameter of the data collection point. Seeds were spread evenly within a two
meter diameter from the data collection point at about a half meter in width. Stem length
was recorded during installation and monitoring which occurred three times throughout
the summer and fall (50, 40 and 30 days apart). During monitoring, percent germination
was also recorded. The monitoring period ended after 120 days in which evidence of
herbivory was noted for each individual plant. In addition, soil samples were collected
from each of the 25 sites and sent to Cornell University‘s Nutrient Analysis Laboratory
for soil fertility (Morgan extractable P and NO3; K, Ca, Mg, Fe, Mn, Zn, and Al; pH;
buffer pH; % H20 and % organic matter).
Seedling Growth
Surviving seedlings were dried and weighed (separating roots and stems). Roots
of collected seedlings were separated from stems (excised immediately above the
uppermost root) and examined visually for evidence of ectomycorrhizae. Stems were
dried in paper bags for 24 hours at 60°C. Weights of paper bags before and after drying
were also taken into consideration for data collection.
VI-16
Statistical Analyses
Liana and cane densities and diameters were compared between dredged materials
and floodplain sites were made with two-tailed paired t-tests, using data from all survey
points (N = 85). The same test was applied to pH values for the subset of points with soil
samples (N = 26). The means and standard deviations for the phytometer experimental
tests based on soil type (forest floodplain vs. dredged material) and adult densities
(absent, low and high) were calculated. Experimental transplants were pooled into their
original clusters (3-4 per site), using means of the 2-4 plants per cluster. This rule was
applied because the transplants were moved and planted as groups (just as seeds are
carried 2-4 per fruit by dispersers), and because they tended to share microenvironmental
factors, such as substrate condition and herbivory. Survival (%) and growth increments
(above-ground) were compared among the five treatment levels using one-way Analysis
of Variance (ANOVA), following tests for normality and variance homogeneity. Mean
seedling germination rate (%) was counted as the maximum value per site over three
survey periods, and growth as the mean above-ground stem dry weight per site, again
using one-way ANOVAs. A power analysis indicates that with five replicates at five
levels, achieving a power of 0.8 (at alpha = .05) required a standard deviation < 1/2 the
mean difference among treatments). Thus, a 20% difference in means would have an
80% probability of achieving a significant effect with a standard deviation < 10%.
One low-density dredged material site was found to contain well over 100 new
seedlings during the final survey, well beyond the observed range of germination periods
for both greenhouse and field trials. Evidence from the surrounding area indicated a high
level of natural germination, confounding the results, so this site was ruled out in
VI-17
statistical comparisons of germination rates and seedling biomass. All analyses were
performed using SYSTAT 13 (Systat Software, Inc. Chicago, IL).
RESULTS
Surveys
Oriental bittersweet showed a variety of age ranges, with the oldest stem observed
being approximately 20 years old at 7 cm (Figure 4). The distribution of the largest stems
seemed more proximate to the roads and trail edges. Larger stems in higher densities are
generally seen in the dredged material habitat (Figure 5). Most of the fruit-bearing stems
are lianas > 2.4 cm (7-10 yrs.), therefore younger populations may only be spreading
through clonal expansion. Stem diameter was positively, but weakly correlated with
density (R2 = .289).
Figure 4. Scatter plot showing the relationship between Oriental bittersweet stem diameter and age. Graph shows a logarithmic regression with the oldest bittersweet stem at approximately 20 years old.
VI-18
VI-19
Figure 5. Map showing the habitat communities and survey points on Schodack Island. The figure on the left represents the northern part of the island, while the figure on the right represents the southern half. Survey points that are directly overlaid indicate higher densities than the single survey points.
The stem density of established Oriental bittersweet throughout the Schodack
Island was significantly correlated with soil type (Figure 6). On average, stem density per
2 m2 on the dredged material was greater than the native soil stem density (p=0.002).
VI-20
Oriental bittersweet stem diameter for the largest individual per survey site averages at
about 1.75 cm (or approx. 5-7 yrs.) on Schodack Island and is not strongly correlated
with stem densities (R2 = .088, N = 138 local populations). Sample sites were clustered
near roads and trails, which may explain similarities in pH (Figure 7), however additional
soil analyses from phytometer sites also found no significant differences (Table 2). In
contrast to density differences, stem diameters for both cane and liana forming
bittersweet stems were similar among site types (Figure 8a, b).
Figure 6. Line graph showing relationship between soil type and mean stem density at each survey point.
Figure 7. Line graph showing relationship between soil type and pH.
VI-21
Figure 8. Line graphs showing (a) relationship between soil type and mean diameter of cane-forming bittersweet vines that mainly occupy the understory layer, and (b) relationship between soil type and mean diameter for liana-forming bittersweet vines that mainly occupy the canopy.
Phytometer Site Soil Nutrients
The native floodplain soils were much richer in organic matter, and in several
major nutrients (Table 2). These differences may reflect differences in nutruent cycles as
well as physical properties of the two substrates. Higher levels of Ca, Mg, and Mn may
be attributable to greater clay content in native floodplains, in addition to a higher
fraction of organic matter. Likewise, highly soluble nitrate may be bound less tightly in
the sandy soils of dredged material origin.
VI-22
Table 2. Results of tests of soil samples taken from dredged material sites (D) and floodplain sites (F). LOI = loss on ignition; OM = organic matter. Adjusted p values represent Bonferroni corrections for multiple t-tests (ns = p > .05). Test Site Adjusted Variable Type N Mean SD p-Value H2O (%) D 15 0.395 0.294 <0.0001 F 10 1.306 0.296 pH D 15 5.901 0.408 ns F 10 6.217 0.379 LOI (%) D 15 2.227 1.644 <0.0001 F 10 6.134 1.84 OM (%) D 15 1.327 1.15 0.001 F 10 4.063 1.289 P (mg/Kg) D 15 2.026 1.559 ns F 10 4.693 2.597 Al (mg/Kg) D 15 6.315 3.006 ns F 10 5.607 3.536 Ca (mg/Kg) D 15 750.943 533.024 <0.0001 F 10 2,448.75 411.737 Fe (mg/Kg) D 15 3.753 1.597 ns F 10 5.846 5.977 K (mg/Kg) D 15 52.136 23.051 ns F 10 77.284 25.011 Mg(mg/Kg) D 15 80.41 70.149 <0.0001 F 10 234.494 63.661 Mn (mg/Kg) D 15 5.336 4.197 <0.0001 F 10 14.617 2.725 Zn (mg/Kg) D 15 3.094 2.007 ns F 10 5.975 2.455 NO3 (mg/Kg) D 15 4.171 3.099 0.027
F 10 10.802 4.919
Phytometer Bittersweet Germination, Survuval, and Growth
Of the 2,500 seeds that were planted throughout the island, only 211 seeds
germinated. Final seedling counts ranged from zero (in 12 sites) to 27, for a mean of 4.7
VI-23
per site, or <5% of the total introduced seeds. These values stand in contrast to the high
greenhouse germination rates (above), but are not atypical of woody plants in natural
systems (Harper 1977). Germination rates varied among treatments (Figure 9; Table 3).
Once germinated, 64.2% of the new seedlings survived the duration of the experiment,
Figure 9. Bar graph representing the differences in soil type and adult bittersweet densities with mean percent germination of planted seeds (ANOVA results in Table 3).
Table 3. ANOVA results from tests of seedling germination per site type.
Source Type III SS df Mean Sq F-Ratio p
Site type 358.358 4 89.590 2.872 0.05
Error 592.600 19 31.189
Eighty-five percent of the total transplanted seedlings survived for the first 120
days. For the period studied, high levels of variance ruled out significant treatment
differences (mean 3.53 seedlings lost; sd 5.08; ANOVA F4,74 = 1.66, p = .167). Sizes of
VI-24
plants from field-germinated seeds were equivalent among treatments (ANOVA F4,74 =
2.17, p = .915).
Mean transplant growth was all fairly low over the 120 day period. In the most
extreme cases, averaging under 5 cm across all treatments, which had similar values
(mean 1.71 cm; sd 3.66; ANOVA F4,74 = 1.66, p = .167). Under optimal conditions,
established plants of Oriental bittersweet can grow up to 100 cm in 120 days (Patterson
1974; Leicht and Silander 2006). Ten of 250 transplants were clipped with an angular cut,
indicating possible herbivory by meadow voles (Microtus pennsylvanicus; Manson et al.
2001). An additional 42 (16.8%) were not found, and categorized as unexplained losses.
Phytometer Ectomycorrhizal Inoculation
Among the 214 seedlings collected (including the potential natural seedlings from
one site), all roots examined had unmodified root caps and visible root hairs, with none of
the swelling or bifurcation associated with ectomycorrrhizae. This finding is consistent
with results from Lett et al. (2011), whose experiments demonstrated that C. orbiculatus
could not be inoculated with generalist ectomycorrhizal fungi in a laboratory setting.
DISCUSSION
Survey Results
Ring counts of the largest bittersweet lianas indicate a maximum age of
approximately 20 yr. This is consistent with its relatively recent spread in the region, and
during the course of this project, similar-aged specimens were found on nearby
Papscanee Island, to the north. Given that bittersweet seeds are bird-dispersed and have
VI-25
high germination potential, the invader probably began arriving on Schodack Island less
than 25 years ago. In contrast to null predictions, distributions of bittersweet were non-
random – stem densities were greater in the dredged material-derived soils compared to
the native soils. In addition, high-density bittersweet populations were not encountered in
any native soil locations.
Native substrate was uniformly classified as floodplain soil because it was found in
low-lying areas and on shorelines. Therefore, waterlogging could be a factor in limiting
bittersweet in these areas. Confirmation would require a longer study in conjunction with
manipulation experiments. Soil nutrients are an unlikely explanation for site-specific
differences, because the native soils were richer in several key nutrients, and bittersweet
is not known as a poor-soil specialist (Leicht and Silander 2006; Leicht et al. 2007). A
further explanation for greater stem densities in dredged material soils may lie in
differential patterns of bird dispersal, coupled with clonal propagation. Large stems were
found in several locations across the island, but its expansion could potentially be traced
back to a few major colonization points that have expanded. The positive (although
weak) correlation between stem diameters and stem densities supports this latter
possibility. Other research has found evidence for positive density dependence in
bittersweet populations (Leicht-Young et al. 2011).
Phytometer Results
Germination rates of planted seeds differed among treatments, with lower rates in
native soils and dredged material sites with bittersweet absent. Transplant survival and
growth as well as growth of seedlings from planted seeds were equivocal among
VI-26
treatments. However, the duration studies was limited to a single season, and final results
of planned concluding work may show clearer differences. In addition, the experimental
design was sensitive to the levels of variance encountered, as indicated in the power
analysis (see Methods). Differential herbivory may have played a role, but it was variable
among sites and not directly investigated.
CONCLUSIONS
The two main results provide support for a difference between substrate type in the
establishment and success of bittersweet. What remains to be demonstrated are clearer
mechanisms for the apparent role of substrate. For example, although ectomycorrhizae
seem unimportant, VAM inoculations can be quantified in bittersweet plants removed
from the two different substrates. Mycorrhizae are sensitive to nutrient levels (Allen
1991), and invasive plants may owe a large part of their success to an ability to form
mycorrhizal mutualisms in new settings (Pringle et al. 2009). Therefore, it is conceivable
that properties of the native soils may limit bittersweet’s potential to establish and grow
via indirect interactions mediated by soil fungi.
If further work confirms that the dredged material-derived soils are preferred growth
zone, more targeted management strategies can be developed for the control of
bittersweet in Schodack Island State Park. Sensitive habitats and other areas of
conservation interest have been demarcated for the park (NYS OPRHP 1998), and the
next step is to assess bittersweet populations in their vicinity. Targeted removal of the
largest stems has already begun, but supplies of new recruits are plentiful on and off the
island. Using the new information from the study in this report, it seems reasonable to
VI-27
focus broader control efforts on source populations growing on dredged material-derived
soils. An additional strategy seems apparent. Much of the Hudson River (western)
shoreline of the park is rimmed with bulwarks and other hardened features, a legacy of
previous use that continues to disrupt tidal floodplain connections. Restoring those
connections may provide a measure of resistance to further spread of bittersweet on
Schodack Island.
VI-28
ACKNOWLEDGEMENTS
I would thank the Tibor T. Polgar Fellowship program for a wonderful
opportunity that has inspired, taught and furthered me in my research career. I am
grateful for Dr. George Robinson who has helped me in my constant struggles and has
provided great resources to help me excel with my project. New York State Office of
Parks and Recreation and Casey Holtzworth were very helpful in providing ideas and
providing information about the island. I would also like to thank the State University of
New York Research Foundation and State University of New York Graduate Student
Office for supporting this research and its continued exposure, and The New York State
Natural Heritage Program for providing various maps and advice throughout the process.
And finally, I wouldn’t have gotten this far without the help of volunteers from The
Audubon Society (Capital District Chapter), Nick Osseni, Alyssa Resey and Kate Foley.
VI-29
REFERENCES
Albright, T.P., D.P. Anderson, N.S. Keuler, S.M. Pearson and M.G. Turner. 2009. The spatial legacy of introduction: Celastrus orbiculatus in the southern Appalachians, USA. Journal of Applied Ecology. 46: 1229-1238.
Allen, M.F. 1991. The Ecology of Mycorrhizae. Cambridge University Press,
Cambridge, UK. Barbour, S. and E. Kiviat. 2001. Cerulean Warbler survey of the southern portion of
southern Schodack Island and Houghtaling Island, Hudson River. Final Report to U.S. Army Corps of Engineers, New York District, New York, NY.
Browder, J.R. 2011. The effect of Celastrus orbiculatus, Oriental bittersweet, on the
herbaceous layer along a western North Carolina creek. Master’s Thesis. Western Carolina University, Cullowhee, NC.
Brown, R.L. and R.K. Peet. 2003. Diversity and invasibility of southern Appalachian
plant communities. Ecology 84: 32-39. C&S Engineers, Inc. and Terrestrial Environmental Specialists, Inc. 1998. Environmental
Assessment Report (Phase I & II) for Schodack Island State Park: NYSOPRHP. Final Report to New York State Office of Parks and Recreation Heritage Program, New York, NY.
Dreyer, G.D. 1994. Element Stewardship Abstract for Celastrus orbiculata. The Nature
Conservancy, Davis, CA. Dreyer, G.D., L.M. Baird, C. Fickler. 1987. Celastrus scandens and Celastrus
orbiculatus – comparisons of reproductive potential between a native and an introduced woody vine. Bulletin of the Torrey Botanical Club. 114: 260-264.
Ehrenfeld, J.G. 2003. Effects of exotic plant invasions on soil nutrient cycling processes.
Ecosystems 6: 503-523. Ferren, W.R. and A.E. Schuyler. 1980. Intertidal vascular plants of river systems near
Philadelphia. Proceedings of the Academy of Natural Sciences of Philadelphia 32: 86-120.
Harper, J.L. 1977. Population Biology of Plants. Academic Press, London, England. Hutchinson, M. 1992. Vegetation management guideline: round-leaved bittersweet
(Celastrus orbiculatus). Natural Areas Journal 12:161. Kourtev, P.S., J.G. Ehrenfeld, and M. Haggblom. 2002. Exotic plant species alter the
microbial community and function in the soil. Ecology 83: 3152-3166.
VI-30
Ladwig, L.M. 2009. Ecology and impacts of lianas in regenerating forests. Master’s
Thesis. Eastern Illinois University, Charleston, IL. Leicht S.A., and J.A. Silander. 2006. Differential responses of invasive Celastrus
orbiculatus (Celastraceae) and native C. scandens to changes in light quality. American Journal of Botany 93: 972–977.
Leicht, S.A., J.A. Silander, Jr. and A.M. Latimer. 2007. Comparative performance of
invasive and native Celastrus species across environmental gradients. Oecologia 154: 273-282.
Leicht-Young, S.A., H. O’Donnell, A.M. Latimer and J.A. Silander. 2009. Effects of
invasive plant species, Celastrus orbiculatus, on the soil composition and processes. American Midland Naturalist 161: 219-231.
Leicht-Young, S.A, A.M Latimer and J.A. Silander. 2011. Lianas escape self-thinning:
Experimental evidence of positive density dependence in temperate lianas Celastrus orbiculatus and C. scandens. Perspectives in Plant Ecology, Evolution and Systematics 13: 163-172.
Lett, C.N., L.E. DeWald and J. Horton. 2011. Mycorrhizae and soil phosphorus affect
growth of Celastrus orbiculatus. Biological Invasions 13: 2339-2350. Manson, R.H., R.S. Ostfeld, and C.D. Canham. 2001. Long-term effects of rodent
herbivores on tree invasion dynamics along forest–field edges. Ecology 82: 3320–3329.
competitive effects of an invasive forb on a native bunchgrass. Ecology 80: 1180-1186.
McNab, W.H. and M. Meeker. 1987. Oriental bittersweet: a growing threat to hard-wood
silviculture in the Appalachians. Northern Journal of Applied Forestry 4:174-177. McNab, W.H. and D.L. Loftis. 2002. Probability of occurrence and habitat for oriental
bittersweet in an oak forest in the southern Appalachian Mountains, USA. Forest Ecology and Management 155: 45-54.
Miller, D., J. Ladd, and W.C. Nieder. 2006. Channel morphology in the Hudson River
Estuary: Historical changes and opportunities for restoration. In: J. Waldman, K. Limburg, and D. Strayer, (eds.) Hudson River Fishes And Their Environment. American Fisheries Society Symposium 51:29-38.
VI-31
New York Natural Heritage Program-NY NHP. 2005. Biodiversity in New York’s State Park System: Summary of Findings. Report for the New York State Office of Parks, Recreation and Historic Preservation. Albany, NY.
New York State Department of Environmental Conservation-NYS DEC. 2012. “Bird
Conservation Areas Program” http://www.dec.ny.gov/animals/30935.html New York State Department of State-NYS DOS. 2012. “Designated Significant Coastal
Fish and Wildlife Habitat” https://www.dot.ny.gov/divisions/engineering/environmental-analysis/manuals-and-guidance/epm/repository/4-2-a-6.pdf
New York State Office of Parks, Recreation, and Historic Preservation-NYS OPRHP.
1998. Final Master Plan/Final Environmental Impact Statement for Schodack Island State Park. Saratoga –Capital District State Park Region, Saratoga, NY.
Ohimain, E. 2004. Environmental impacts of dredging in the Niger Delta: Options for
sediment relocation that will mitigate acidification and enhance natural mangrove restoration. Terra et Aqua 97: 9-19.
Patterson, D.T. 1974. The ecology of the Oriental bittersweet, Celastrus orbiculatus, a
weedy introduced ornamental vine. Doctoral dissertation. Duke University, Durham, NC.
Pavlovic, N.B., S.A. Leicht-Young, K. Frohnapple and D. Morford. 2009. To burn or not
to burn Oriental bittersweet: A fire manager’s conundrum. First Progress Report by USGS, Porter, IN.
Pavlovic, N.B., S.A. Leicht-Young, K. Frohnapple, D. Morford and N. Mulconrey. 2010.
To burn or not to burn Oriental bittersweet: A fire manager’s conundrum. Second Progress Report by USGS, Porter, Indiana.
Pooler, M., R.L. Dix and J. Feely. 2002. Interspecific hybridizations between the native
bittersweet, Celastrus scandens, and the introduced invasive species, C. orbiculatus. Southeastern Naturalist 1: 69-76.
Pringle, A. J.D. Bever, M. Gardes, J.L. Parrent, M.C. Rilling and J.N. Klironomos. 2009.
Mycorrhizal symbioses and plant invasions. Annual Review of Ecology, Evolution, and Systematics 40: 699-715.
Reinhart, K.O. and R.M. Callaway. 2006. Soil biota and invasive plants. New Phytologist
170: 445-457 Rejmanek, M. 2000. Invasive plants: approaches and predictions. Australian Journal of
HYPOXIA TOLERANCE OF THE INVERTEBRATES ASSOCIATED WITH WATER-CHESTNUT BEDS (TRAPA NATANS L.) IN THE HUDSON RIVER
A Final Report of the Tibor T. Polgar Fellowship Program
Mariana Carolina Teixeira
Polgar Fellow
Freshwater Ecology Post-Graduation Program Universidade Estadual de Maringá
Maringá, PR, Brazil
Project Advisor:
David L. Strayer Cary Institute of Ecosystem Studies
Millbrook, NY 12545
Teixeira, M. C. and D. L. Strayer. 2015. Hypoxia Tolerance of the Invertebrates Associated with Water-chestnut Beds (Trapa natans L.) in the Hudson River. Section VII: 1-29 pp. In D. J. Yozzo, S.H. Fernald and H. Andreyko (eds.), Final Reports of the Tibor T. Polgar Fellowship Program, 2013. Hudson River Foundation.
VII-2
ABSTRACT
Aquatic macrophytes provide structures to be colonized and used as refuge,
shelter and feeding sites by many organisms. As ecosystem engineers, they also have
major effects on the physical and chemical features of water and sediment. Low oxygen
concentrations are one of the recurrent impacts of dense beds of aquatic macrophytes, so
the macroinvertebrates that inhabit macrophyte beds may have to cope with hypoxia.
This study tested the survival of six groups of macroinvertebrates associated with
different species of macrophytes (Trapa natans or submerged species) under hypoxia.
The hypothesis tested was that the organisms that inhabit stands of the invasive T. natans
are more resistant to low oxygen concentrations than those that inhabit submerged
aquatic vegetation (SAV). Chironomids and amphipods associated with T. natans were
more resistant than those associated with submerged species. Gastropods, ostracods and
planarians from the two habitats were equally resistant to hypoxia, with high survival in
both cases. Zygopterans were the most impaired group, with no survival at all. The
results indicate the responses to hypoxia vary among groups, and so do the mechanisms
Figure 1 - Submerged growth form of Vallisneria americana versus
the floating-leaved form of Trapa natans ............................................... VII-7
Figure 2 -Sampling sites in the Tivoli North and South Bays ............................. VII-11
Figure 3 -Survival under hypoxia of organisms associated
with T. natans (TNA) and submerged aquatic vegetation (SAV)
for six and eighteen hours exposures ..................................................... VII-16
Table 1 –Trapa natans vs. SAV-dwelling
macroinvertebrates’ survival to hypoxia .................................................. VII-15
VII-5
INTRODUCTION
Biological invasions have become one of the greatest threats to the integrity of
Earth’s ecosystems (Strayer 2010). Invasive species are usually exotic (but not always)
to the habitat they colonize and very successful in them, often to the detriment of the
former inhabitants. They bring in new traits that represent new pressures to the system,
frequently culminating in undesirable impacts to native communities and the
environment. In freshwater habitats, which are especially sensitive to anthropogenic
impacts (Dudgeon et al. 2006), invasions are recurrent and their effects have become
obvious and a cause of concern (Strayer 2010).
Aquatic macrophytes create distinctive habitats within aquatic ecosystems. They
provide structures to be colonized by an array of organisms, and are used as refuge,
shelter and feeding sites (Agostinho et al. 2007; Mormul et al. 2010). They also have
major effects on the physical and chemical features of water and sediment (Urban et al.
2009; Bini et al. 2010; Kleeberg et al. 2010; Tall et al. 2011; Rodríguez et al. 2012), and,
because of that, are considered ecosystem engineers (Bouma et al. 2005; Caraco et al.
2006). When macrophytes are invasive, their “engineering” can become a problem if it
causes changes that the original inhabitants of the invaded area cannot cope with.
Macrophytes have a great potential of becoming invasive because they adapt easily to a
large range of habitats, have high rates of vegetative reproduction and fast growth
(Santamaría 2002).
A few macrophyte traits are often related to impacts in their environment and to
other organisms when they become invasive. Biomass production, photosynthesis and
decomposition, for example, are three functions through which macrophytes can alter
VII-6
habitat complexity, light penetration, pH and dissolved oxygen concentration (Schultz
and Dibble 2012). Low oxygen concentrations have been identified as one of the
recurrent impacts of dense growth of aquatic macrophytes (Caraco et al. 2006; Bunch et
al. 2010; Turner et al. 2010; Desmet et al. 2011). Overnight respiration in large
macrophyte beds usually creates a daily variation pattern in dissolved oxygen (DO)
levels, with lower values at sunrise and higher values when light is most available for
photosynthesis (Jones et al. 1996; Miranda et al. 2000; Thomaz et al. 2001; Colon-Gaud
et al. 2004). Besides plants’ metabolic activities, oxygen dynamics also depend on the
physical structure of the stands, as they regulate light incidence and water circulation
(Jones et al. 1996; Miranda and Hodges 2000; Bunch et al. 2010). In floating-leaved and
emergent species, for example, the diel pattern can be overcome by the constant shading
and reduced exchange at the water-air interface caused by the biomass that lies above the
surface. Furthermore, the oxygen produced during photosynthesis by the aerial biomass is
liberated to the atmosphere while the oxygen dissolved in the water is still consumed by
respiration and decomposition. This unbalanced uptake can lead to more prolonged
hypoxia or anoxia in dense beds of floating-leaved or emergent plants, which has been
shown to occur in many macrophyte beds (Bunch et al. 2010; Turner et al. 2010; Desmet
et al. 2011), among them water-chestnut beds in the Hudson River (Caraco and Cole
2002).
The water-chestnut Trapa natans L. is native to temperate and tropical Eurasia
and Africa (Crow and Hellquist 2000), and was introduced in the United States in 1874
(Hummel and Kiviat 2004). In 1930, it reached the Hudson River (Hummel and Kiviat
2004), where it is now widespread, forming stands of hundreds of hectares (Nieder et al.
VII-7
2004). This macrophyte is rooted in the sediment, with a submerged stem and feather
leaves, and a dense canopy of floating leaves (Hummel and Kiviat 2004). T. natans has
already replaced part of the native aquatic vegetation, dominated by the submerged
species Vallisneria americana Michx. (water-celery), in many parts of the Hudson River
(Strayer et al. 2003). The native V. americana is also rooted in the sediment, but its
leaves are long and flat, grow from rhizomes, and the whole plant is submersed. Such
different growth forms, shown in Figure 1, create distinct habitats for all macrophyte-
associated organisms, as much in their physical structuring as in their influence on
physical and chemical parameters of water and sediments.
Figure 1. Comparison between the submerged growth form of Vallisneria americana (water-celery) and the floating-leaved form of Trapa natans (water-chestnut).
The case of T. natans in the Hudson River has been thoroughly investigated
(Caraco and Cole 2002; Hummel and Findlay 2006; Goodwin et al. 2008). Tidal
Trapa natansVallisneria americana
VII-8
influence has been shown to add to its engineering on DO dynamics. Caraco and Cole
(2002) showed that the DO levels in T. natans beds varied in a 12.5 h tidal cycle, with
high peaks (ca. 7.5 mg.L-1) during high tides as fresh, well-oxygenated water flows in
from the open water of the river, and lows of 0 to 2.5 mg.L-1 during low tides. In V.
americana stands however, DO never dropped below 5 mg.L-1 and was always higher
than in the open water surrounding the bed (Caraco and Cole 2002). Therefore, the
hypoxic to anoxic events that take place in T. natans beds are temporally limited by the
tides, lasting approximately six hours with DO values from 0 to 2.0 mg.L-1 (Caraco and
Cole 2002). These low DO values could be maintained for much longer periods in large
beds that are not subjected to periodic flushes of oxygen-rich water.
Such different habitats created by T. natans in relation to the former dominant
species V. americana could have led to changes in the macrophyte-dwelling
communities. Strayer et al. (2003) compared the communities of aquatic
macroinvertebrates in stands of T. natans and V. americana in the Hudson River. They
found that although some community attributes, such as species richness and diversity,
did not differ between the native and invasive stands, taxonomic composition differed
greatly. The ability of species to deal with the distinctive dissolved oxygen dynamics
with its periodic hypoxic events was thought to explain part of the differences between T.
natans- and V. americana-associated macroinvertebrate communities, along with
predator pressure and food availability, both which would also be influenced by T. natans
engineering (Strayer et al. 2003). Kornijów et al. (2010) attempted to unveil the role of
dissolved oxygen dynamics in determining the macroinvertebrate community in T. natans
beds. They found that species richness, diversity and density did not differ among
VII-9
microhabitats (beds’ edges versus center; leaves versus sediments) with different degrees
of oxygen depletion in T. natans beds, meaning that the macroinvertebrates inhabiting
these beds can and do cope with periodic short-term hypoxia.
Dissolved oxygen concentration in aquatic habitats has diverse effects on the
physiology, behavior, life cycle, growth capacity, distribution, reproductive success and
immunological system of animals (Ekau et al. 2010). Morphological, physiological and
behavioral adaptations to low levels of dissolved oxygen have been reported for many
aquatic organisms, including auxiliary respiratory appendages (Robinson et al. 1991;
Marziali et al. 2006), migration to oxic microhabitats (Apodaca and Chapman 2004;
Sesterhenn et al. 2013), use of atmospheric air (Hanley and Ultsch 1999; Seuffert and
Martin 2010; Penha-Lopes et al. 2010), induction of respiratory pigments (Spicer 1993;
Panis et al. 1996) and anaerobic metabolism (Frank 1983; Hamburger et al. 1995;
Hamburger et al. 2000).
The aim of this study was to investigate whether the organisms that inhabit stands
of the invasive T. natans are more resistant to low oxygen concentrations than those that
inhabit submerged aquatic vegetation (V. americana and Myriophyllum spicatum L.
(European milfoil)) stands. This study also aims to discuss which adaptations could
provide T. natans-dwelling macroinvertebrates with a better capacity to cope with
hypoxia.
VII-10
METHODS
Study area
The North and South Tivoli Bays, shown in Figure 2, encompass ca. 290 ha of
freshwater tidal marshes, subtidal shallows and intertidal mudflats, along 3 km of the
eastern shore of the Hudson River. The marshes are dominated by narrow-leaved cattail
(Typha angustifolia L.), the subtidal shallows are dominated by the submerged species V.
americana and M. spicatum, and the South Bay mudflats are dominated by the invasive
T. natans (Yozzo et al. 2005). All these macrophytes have been shown to support dense
and diverse macroinvertebrate communities (Strayer et al. 2003; Kornijów et al. 2010;
Yozzo and Osgood 2013). These areas are also used by many fishes, such as black bass
(Micropterus sp.), white perch (Morone americana) and common carp (Cyprinus carpio),
waterfowl, many birds, and snapping turtles (Yozzo et al. 2005).
VII-11
Figure 2. Sampling sites in the Tivoli North and South Bays.
Experiments
Sampling occurred from mid August until late September 2013, a period that
encompassed peak biomass for invasive T. natans (coded “TNA” throughout), and for
North Tivoli Bay
South Tivoli Bay
Hudson River km 158-161Dutchess County, NY, USA
VII-12
submerged V. americana and M. spicatum (coded “SAV” throughout) (Caraco and Cole
2002). Animals were collected from a large TNA bed in Tivoli South Bay and from an
SAV bed in Tivoli North Bay by putting whole plants into a submerged bucket, gently
shaking them, pouring the water into a plankton net (118 µm mesh size) and collecting
the retained material, which often included mud and debris, in jars. In SAV beds, some
samples were collected by sweeping the net in the beds to avoid destroying the plants.
All collected material was kept on ice and immediately taken to the lab for sorting.
Organisms were sorted under a stereomicroscope, separated by groups and kept in
jars with river water. The most abundant groups in the samples were Chironomidae,
Gastropoda, Amphipoda, Ostracoda, Zygoptera and Planariidae. All jars were kept in a
large tray containing water and ice packs to keep temperature low. With the exception of
Amphipoda, no organisms were kept longer than 24 hours before the trials, and the
Amphipoda that were kept longer (up to five days) were in a large plastic tray (ca. 10 L)
with an air pump providing high oxygen levels, and live chironomids were added as food.
To determine the resistance of organisms to hypoxia, a series of laboratory assays
were run by manipulating dissolved oxygen levels and measuring the survival of different
invertebrates. River water was sparged with N2 gas until low concentrations of DO (0.5
to 1.0 mgO2.L-1) were achieved for the hypoxic treatment and aerated (when necessary)
until saturation for the normoxic treatment (8 - 9 mgO2.L-1). These concentrations are
within the range of variation found by Caraco and Cole (2002) in TNA (low DO) and
SAV (high DO) beds. The assays were run in 300 ml biological oxygen demand bottles.
Water temperature was not controlled and averaged 22.2±0.7°C (mean±SD). After all
bottles were filled with water, and oxygen and temperature were measured with a
VII-13
handheld YSI ProODO meter, the organisms were added and bottles sealed. Each trial
consisted of one group being tested in a set of five replicates for each treatment, run
according with organism’s availability. In a few cases, only three replicates were run, or
the five replicates were run in blocks of two and three replicates. Five individuals were
used in each bottle with the exception of ostracods, for which ten individuals were used
per bottle.
Two different exposure times were tested: six hours, which was based on the
length of hypoxic events observed in the Hudson River (Caraco and Cole 2002), and
eighteen hours, which meant to represent an environment without tidal influence and
consequently longer hypoxic periods. At the end of each trial, DO and temperature were
measured in each bottle and the organism’s survival was verified. Animals were
checked, under magnification when necessary, and considered alive when moving
spontaneously or in response to touching. The total number of organisms recovered,
which differed for some groups from the initial number probably due to predation and/or
difficulties in handling, was used to calculate the survival percentage. All organisms
were kept in 70% alcohol for later taxonomic identification.
Statistical analysis
Welch t-tests (Welch 1947) were used to test for differences between the survival
of organisms from different origins (TNA vs. SAV) within each taxonomic group
(Amphipoda, Odonata, Gastropoda, Chironomidae, Ostracoda and Planariidae) and
exposure time (six and eighteen hours). A paired Welch t-test was also run including
data from all taxonomic groups to test for differences in survival between origins within
VII-14
each exposure time. In all analyses, the response variable was the percentage of survival
in the hypoxic treatment divided by the percentage of survival in the normoxic treatment.
Tests were performed with R (R Core Team 2013).
RESULTS
DO initial and final concentrations in hypoxic treatments averaged 0.69±0.2
mgO2.L-1 and 0.25±0.3 mgO2.L-1, while normoxic concentrations averaged 8.65±0.3
mgO2.L-1 at the beginning of experiments and 7.29±1.5 mgO2.L-1 at the end. The
normoxic controls of all trials (SAV and TNA, 6 and 18 hours, n=117) averaged 97±9%
of survival, which indicates that handling and experimental conditions did not by
themselves kill many animals; however, the survival values used in the analyses did take
into account the survival in normoxic treatments, as mentioned in methods.
The results of t-tests can be seen in Table 1 and in Figure 3. When all taxa were
considered, there were no significant differences in survival between organisms
associated with TNA or SAV beds for either exposure time. When each taxonomic group
was tested separately, significant differences were only found for Amphipoda in the six
hour trial and for Chironomidae in the eighteen hour trial. Both groups showed higher
survival of organisms associated with TNA rather than SAV, as predicted in the
hypothesis. Nevertheless, none of the remaining groups (Zygoptera, Ostracoda,
Gastropoda, Planariidae) differed in their survival according to organisms’ origin.
Zygoptera had no survival at all in low DO at either exposure time and regardless
of the origin of the organisms. On the other hand, Ostracoda had high survival in all
hypoxic treatments, independent of originating from TNA or SAV.
VII-15
Table 1. Comparison (Welch t-test) between Trapa natans- and submerged aquatic vegetation-dwelling macroinvertebrates’ survival to hypoxia. Significant differences (p<0.05) are in bold.
Groups Exposure t Df p
All 6h 1.52 20 0.1442
18h -0.85 27 0.4048
Amphipoda 6h 5.72 5.54 0.0016
18h - - -
Zygoptera 6h -1.44 4 0.2228
18h - - -
Gastropoda 6h -1 2 0.4226
18h -2.25 5.74 0.0676
Chironomidae 6h 1.12 4.53 0.3181
18h 3.64 4 0.0220
Ostracoda 6h -1.05 4 0.351
18h 1.01 7.34 0.344
Planariidae 18h -1.04 5.68 0.342
When considering all groups, Amphipoda, Gastropoda and Chironomidae,
survival was higher in the six hour trials than in the eighteen hour ones. Moreover, when
survival between origins in different exposure times was compared, there seemed to be an
interaction between these factors, with a smaller difference between origins in the six
hour treatment than in the eighteen hour one.
VII-16
Figure 3. Survival under hypoxia (mean ± standard error) of organisms associated with T. natans (TNA) and submerged aquatic vegetation (SAV) in six (■) and eighteen (●) hours exposure. The * indicates significant difference between TNA and SAV (p<0.05).
TNA SAV
0.0
0.2
0.4
0.6
0.8
1.0
SUR
VIVA
L
ALL GROUPS
TNA SAV
0.0
0.2
0.4
0.6
0.8
1.0
SUR
VIVA
L
AMPHIPODA
*
TNA SAV
0.0
0.2
0.4
0.6
0.8
1.0
SUR
VIVA
L
CHIRONOMIDAE
*
TNA SAV
0.0
0.2
0.4
0.6
0.8
1.0
SUR
VIVA
L
ZYGOPTERA
TNA SAV
0.0
0.2
0.4
0.6
0.8
1.0
SUR
VIVA
L
GASTROPODA
TNA SAV
0.0
0.2
0.4
0.6
0.8
1.0
SUR
VIVA
L
OSTRACODATNA SAV
0.0
0.2
0.4
0.6
0.8
1.0
SUR
VIVA
L
PLANARIIDAE
VII-17
DISCUSSION
Mixed support was found for the hypothesis that macroinvertebrates associated
with TNA beds are more resistant to hypoxia than those inhabiting SAV. Data for
Amphipoda and Chironomidae supported this hypothesis, while data for the other tested
groups did not. Thus, the results indicate that the differences in community composition
found by Strayer et al. (2003) between TNA and Vallisneria americana (which is one of
the two species in SAV) stands can be attributed only in part to differential resistance to
hypoxia.
The mechanisms involved in some groups’ resistance to hypoxia can only be
inferred to a certain extent. Higher survival of Chironomidae associated with TNA could
be related to the presence of hemoglobin in animals living in TNA beds and its absence
or lower quantity in SAV organisms, since there is great inter-specific variation in
hemoglobin content among chironomids (Panis et al. 1996). However, Strayer et al.
(2003) found more hemoglobin-bearing chironomid species in V. americana than in TNA
beds, so this might not be the main mechanism here. Chironomids also possess
morphological adaptations, such as thoracic horns and fringed anal lobes that tend to be
more developed in species coping with low DO (Marziali et al. 2006). These structures,
together with undulatory movements of the abdomen (Panis et al. 1996), can increase
ventilation, but the animals would still rely on DO. It has been shown though that some
chironomids can turn to an anaerobic metabolism that could give them resistance to short
(a few days) and even long-term (a few months) hypoxia (Frank 1983; Hamburger et al.
1995; Hamburger et al. 2000). Species differ in their ability to perform anaerobic
VII-18
metabolism (Frank 1983), and this could account for the higher survival of TNA-
dwelling chironomids in relation to the SAV ones.
The other group that showed higher survival to hypoxia when collected from TNA
beds was Amphipoda, in the six hour trials. In the eighteen hour trials, however, all
animals died, revealing that their resistance is limited to short-term exposure to hypoxia.
Previous studies (Hoback and Barnhart 1996; Spicer et al. 2002) showed that the species
Gammarus pseudolimnaeus and Gammarus pulex were highly sensitive to low DO, with
up to 100% mortality in 90 minutes of anoxic conditions for G. pulex. An attribute that
could enhance survival of amphipods in low DO environments would be their ability to
escape to more oxygenated areas due to their good swimming skills; however, in this
experiment, this mechanism was impaired because the animals were enclosed in an arena
with uniformly low DO. Moreover, in the field, this behavior might increase predation
risk and thus mortality (Kolar and Rahel 1993). The presence of the respiratory pigment
hemocyanin was demonstrated in many amphipods (Stucliffe 1984; Spicer 1993) and it
might be an important physiological adaptation to hypoxia. On the other hand, a low DO-
induced anaerobic metabolism was shown to be poor and of little importance for G. pulex
(Spicer et al. 2002), so the survival during short-term hypoxia of Amphipoda species in
this experiment is more likely to be related to the presence of respiratory pigments.
Out of the groups tested, Zygoptera was the most strongly impaired by hypoxia,
with no survival at all in low DO at either exposure time and regardless of the origin of
the organisms. As tracheal gill breathers, they do tend to be more sensitive to hypoxia
than other groups (Chapman et al. 2004). It was also observed that these animals were
much more abundant in SAV (data not shown), meaning that DO might play a part in
VII-19
their distribution. They possess a morphological accessory, their caudal lamellae, that
can assist oxygen uptake among other functions (Apodaca and Chapman 2004;
Sesterhenn et al. 2013); however, even though most of the animals used had their
lamellae intact, they did not survive even the short-term hypoxia. This suggests they must
possess some kind of behavioral adaptation to escape it, since they were found in TNA
beds. In fact, this group is known to migrate towards the water’s surface to find higher
DO concentrations (Robinson et al. 1991; Apodaca and Chapman 2004; Sesterhenn et al.
2013). This might be an important mechanism for the Zygoptera in Hudson River
habitats, since Strayer et al. (2003) found them to occur on plants but not sediments, and
Kornijów et al. (2010) collected them from TNA leaves but not from other parts of the
plants, suggesting a dependence on more oxygenated areas of TNA beds.
At the other extreme, Ostracoda were highly resistant to hypoxia, even in the
eighteen hour exposure treatment, regardless of origin, with an average survival of 80%.
These results agree with former works that showed high survival of freshwater ostracods
under hypoxia (Hagerman 1969; Rossi et al. 2002), although others have stated Ostracoda
can be very sensitive to low DO levels (Rosseti et al. 2004; Ruiz et al. 2013). A migratory
behavior towards oxygen-rich microhabitats was described by many authors as an
adaptation of ostracods to hypoxia (Hagerman 1969; Corbari et al. 2004; Corbari et al.
2005), especially because they seem incapable of regulating their oxygen uptake
according to DO availability (Corbari et al. 2004; Corbari et al. 2005). Although no
evidence was found in the literature for anaerobic metabolism in ostracods (this study;
Rossi et al. 2002), some species contain hemoglobin (Fox 1957), which may assist their
survival under hypoxia.
VII-20
Gastropods did not differ in survival by habitat of origin and had relatively high
survival rates under hypoxia. Calow (1975) showed around 60% survival after five days
of anoxia for Ancylus fluviatilis and up to 80% after weeklong anoxia for Planorbis
contortus (values estimated from his figure 7). Animals in this group can be air- or
water-breathers or both, and although some species might rely on their access to the
atmosphere (Penha-Lopes et al. 2010; Seuffert and Martin 2010), some, even pulmonates,
do not (this study; Burky and Burky 1977; Hanley and Ultsch 1999). The presence of
hemoglobin was considered unimportant for Planorbella duryi and Helisoma anceps,
since they showed similar responses to hypoxia as non-hemoglobin-bearing species
(Hanley and Ultsch 1999). Also, pulmonate and prosobranch snails did not differ in their
responses to hypoxia (Hanley and Ultsch 1999). No papers were found demonstrating the
occurrence of anaerobic metabolism in Gastropoda, so their survival is more likely to be
related to their great capacity of regulating their oxygen consumption under varying DO
concentrations (Hanley and Ultsch 1999).
Planarians also showed high resistance to hypoxia and no effect of origin in these
experiments; however, Rivera and Perich (1994) identified DO as the most critical out of
six variables affecting survival and reproduction of four species of planarians (Dugesia
dorotocephala, D. tigrina, Cura foremanni and Dendrocelopsis vaginatus). Their
experiments consisted of a two week exposure to different levels of DO, and none of the
species survived the 0 and 2 mg.L-1 DO levels. In this shorter-term (18 hours) hypoxia
treatment though, planarians were very successful. Some flatworms contain hemoglobin
(Crompton and Smith 1963), but no studies were found reporting the occurrence of
anaerobic metabolism in these animals.
VII-21
Macroinvertebrates inhabiting hypoxic macrophyte beds such as TNA beds in the
Hudson have two alternatives to cope with the hypoxic habitat within the beds: they can
escape to more oxygenated micro-habitats, or possess adaptations to survive through
hypoxia. The first alternative was not available for the animals in this experiment, so
with the exception of Zygoptera, which must survive hypoxia by escaping to oxygenated
zones, all other groups tested must have adaptations to survive hypoxia in place. Some
groups in these experiments (Gastropoda, Ostracoda, Planariidae) displayed the same
ability to survive hypoxia whether their habitat requires them to do so (TNA beds) or not
(SAV). On the other hand, Chironomidae and Amphipoda inhabiting TNA beds seem to
have been selected by their better resistance to hypoxia than their relatives in SAV.
Because of their engineering activities on DO, macrophyte beds can impose
challenges as well as benefits for the macroinvertebrates that live there. Whether through
their regular dark respiration and daylight photosynthesis or growth form-related DO
fluctuations, large macrophyte beds represent habitats with abiotic filters that may require
specific adaptations of organisms. The results show that these challenges can be met in
several different ways by macroinvertebrates: probable movement to nearby oxygenated
habitats by zygopterans, short-term (6-18 hour) tolerance of hypoxia by amphipods and
chironomids, and long-term (>18 hour) tolerance of hypoxia by gastropods, ostracods and
planarians. The fact that different invertebrates meet the challenge of hypoxia in
different ways means that different kinds of hypoxic macrophyte beds may support
different assemblages of macroinvertebrates. Specifically, the spatial and temporal extent
of hypoxia will be critical (whether well-oxygenated refuges are nearby, or whether the
hypoxia lasts for longer than the invertebrate can tolerate). Likewise, shifts in
VII-22
macrophyte species composition caused by species invasions or other reasons may have
differential effects on macroinvertebrates that are caused by different oxygen regimes.
VII-23
ACKNOWLEDGEMENTS
I would like to acknowledge the Hudson River Foundation and the Tibor T.
Polgar Fellowship Program for funding this research and Dr. David L. Strayer for the
opportunity to work with him and his valuable advising. I am also deeply grateful to
Mary P. Budd for her help in sampling, sorting of organisms and especially for the great
time we had while working together. I am also grateful to David T. Fischer, Paul T.
Henne and all Cary Institute’s personnel, who were always welcoming and willing to
help, and my advisor in Brazil Dr. Sidinei M. Thomaz for always encouraging me to
move forward in science.
VII-24
REFERENCES
Agostinho, A.A., S.M. Thomaz, L.C. Gomes, and S.L.S.M. Baltar. 2007. Influence of the macrophyte Eichhornia azurea on fish assemblage of the Upper Paraná River floodplain (Brazil). Aquatic Ecology 41:611-619.
Apodaca C.K. and L.J. Chapman. 2004. Larval damselflies in extreme environments: behavioral and physiological response to hypoxic stress. Journal of Insect Physiology 50:767-775.
Bini, L.M., S.M. Thomaz, and P. Carvalho. 2010. Limnological effects of Egeria najas Planchon (Hydrocharitaceae) in the arms of Itaipu Reservoir (Brazil, Paraguay). Limnology 11:39-47.
Bouma, T.J., M.B. De Vries, E. Low, G. Peralta, I. C. Tánczos, J. Van De Koppel, and P.M.J. Herman. 2005. Trade-offs related to ecosystem engineering: a case study on stiffness of emerging macrophytes. Ecology 86:2187-2199.
Bunch, A.J., M.S. Allen, and D.C. Gwinn. 2010. Spatial and temporal hypoxia dynamics in dense emergent macrophytes in a Florida lake. Wetlands 30:429-435.
Burky, K.A., and A.J. Burky. 1977. Buoyancy changes as related to respiratory behavior in an amphibious snail, Pomacea urceus (Müller), from Venezuela. The Nautilus 91:97-104.
Calow, P. 1975. The respiratory strategies of two species of freshwater gastropods (Ancylus fluviatilis Müll and Planorbis contortus Linn) in relation to temperature, oxygen concentration, body size, and season. Physiological Zoology 48:114-129.
Caraco, N.F., and J.J. Cole. 2002. Contrasting impacts of a native and alien macrophyte on dissolved oxygen in large river. Ecological Applications 12:1496-1509.
Caraco, N.F., J.J. Cole, S. Findlay, and C. Wigand. 2006. Vascular plants as engineers of oxygen in aquatic systems. BioScience 56:219-225.
Chapman, A., K.R. Schneider, Apodaca, C. and C. A. Chapman. 2004. Respiratory ecology of macroinvertebrates in a swamp-river system of East Africa. Biotropica 36:572-585.
Colon-Gaud, J., W.E. Kelso, and D.A. Rutherford. 2004. Spatial distribution of macroinvertebrates inhabiting hydrilla and coontail beds in the Atchafalaya Basin, Louisiana. Journal of Aquatic Plant Management 42:85-91.
Corbari, L., P. Carbonel, and J. Massabuau. 2004. How a low tissue O2 strategy could be conserved in early crustaceans: the example of the podocopid ostracods. The Journal of Experimental Biology 207:4415-4425.
VII-25
Corbari, L., P. Carbonel, and J. Massabuau. 2005. The early life history of tissue oxygenation in crustaceans: the strategy of the myodocopid ostracod Cylindroleberis mariae. The Journal of Experimental Biology 208:661-670.
Crompton, D.W.T., and M.H. Smith. 1963. Haemoglobin in a flatworm. Nature 197:1118-1119.
Crow, G.E. and C.B. Hellquist. 2000. Aquatic and wetland plants of northeastern North America. University of Wisconsin Press, Madison.
Desmet, N.J.S., S. V. Belleghem, P. Seuntjens, T.J. Bouma, K. Buis, and P. Meire. 2011. Quantification of the impact of macrophytes on oxygen dynamics and nitrogen retention in a vegetated lowland river. Physics and Chemistry of the Earth 36:479-489.
Dudgeon, D., A.H. Arthington, M.O. Gessner, Z. Kawabata, D.J. Knowler, C. Lévêque, R.J. Naiman, A. Prieur-Richard, D. Soto, M.L.J. Stiassny, and C.A. Sullivan. 2006. Freshwater biodiversity: importance, threats, status and conservation challenges. Biological Reviews 81:163-182.
Ekau, W., H. Auel, H.O. Pörtner, and D. Gilbert. 2010. Impacts of hypoxia on the structure and processes in pelagic communities (zooplankton, macro-invertebrates and fish). Biogeosciences 7:1669-1699.
Fox, H.M. 1957. Haemoglobin in the Crustacea. Nature 164:59.
Frank, C. 1983. Ecology, production and anaerobic metabolism of Chironomus plumosus L. larvae in a shallow lake. II Anaerobic metabolism. Archiv für Hydrobiologie 96:354-362.
Goodwin, K., N. Caraco, and J. Cole. 2008. Temporal dynamics of dissolved oxygen in a floating-leaved macrophyte bed. Freshwater Biology 53:1632-1641.
Hagerman, L. 1969. Respiration, anaerobic survival and diel locomotory periodicity in Hirschmannia viridis Müller (Ostracoda). Oikos 20:384-391.
Hamburger, K., P.C. Dall and C. Lindegaard. 1995. Effects of oxygen deficiency on survival and glycogen content of Chironomus anthracinus (Diptera, Chironomidae) under laboratory and field conditions. Hydrobiologia 297:187-200.
Hamburger, K., P.C. Dall, C. Lindegaard, and I.B. Nilson. 2000. Survival and energy metabolism in an oxygen deficient environment: field and laboratory studies on the bottom fauna from the profundal zone of Lake Esrom, Denmark. Hydrobiologia 432:173-188.
Hanley, R.W., and G.R. Ultsch. 1999. Ambient oxygen tension, metabolic rate, and habitat selection in freshwater snails. Archiv für Hydrobiologie 144:195-214.
VII-26
Hoback, W.W., and M.C. Barnhart. 1996. Lethal limits and sublethal effects of hypoxia on the amphipod Gammarus pseudolimnaeus. Journal of the North American Benthological Society 15:117-126.
Hummel, M., and E. Kiviat. 2004. Review of world literature on water chestnut with implications for management in North America. Journal of Aquatic Plant Management 42:17-27.
Hummel, M., and S. Findlay. 2006. Effects of water chestnut (Trapa natans) beds on water chemistry in the tidal freshwater Hudson River. Hydrobiologia 559:169-181.
Jones, J. I., K. Hardwick, and J.W. Eaton. 1996. Diurnal carbon restriction on the photosynthesis of dense stands of Elodea nuttallii (Planch) St. John. Hydrobiologia 340:11-16.
Kleeberg, A., J. Köhler, T. Sukhodolova and A. Sukhodolov. 2010. Effects of aquatic macrophytes on organic matter deposition, resuspension and phosphorus entrainment in a lowland river. Freshwater Biology 55:326-345.
Kolar, C.S., and F.J. Rahel. 1993. Interaction of a biotic factor (predator presence) and an abiotic factor (low oxygen) as an influence on benthic invertebrate communities. Oecologia 95:210-219.
Kornijów, R., D.L. Strayer, and N.F. Caraco. 2010 Macroinvertebrate communities of hypoxic habitats created by an invasive plant Trapa natans in the freshwater tidal Hudson River. Fundamental and Applied Limnology 176:199-207.
Marziali, L., V. Lencione, and B. Rossaro. 2006. Adaptations of pupae of Chironomidae (Insecta: Diptera) to oxygen-poor habitats. Polish Journal of Ecology 54:687-693.
Miranda, L.E., and K.B. Hodges. 2000. Role of aquatic vegetation coverage on hypoxia and sunfish abundance in bays of a eutrophic reservoir. Hydrobiologia 427:51-57.
Miranda, L.E., M.P. Driscoll, and M.S. Allen. 2000. Transient physicochemical microhabitats facilitate fish survival in inhospitable aquatic plant stands. Freshwater Biology 44:617-628.
Mormul, R.P., S.M. Thomaz, M.J. Silveira, and L. Rodrigues. 2010. Epiphyton or macrophyte : Which primary producer attracts the snail Hebetancylus moricandi? American Malacological Bulletin 133:127-133.
Nieder, W.C., E. Barnaba, S. E. G. Findlay, S. Hoskins, N. Holochuck, and E.A. Blair. 2004. Distribution and abundance of submerged aquatic vegetation and Trapa natans in the Hudson River estuary. Journal of Coastal Research: Special Issue 45:150-161.
VII-27
Panis, L.I., B. Goddeeris, and R. Verheyen. 1996. On the relationship between vertical microdistribution and adaptations to oxygen stress in littoral Chironomidae (Diptera). Hydrobiologia 318:61-67.
Penha-Lopes, G., F. Bartolini, S. Limbu, S. Cannicci, Y. Mgaya, E. Kristensen, and J. Paula. 2010. Ecosystem engineering potential of the gastropod Terebralia palustris (Linnaeus, 1767) in mangrove wastewater wetlands - A controlled mesocosm experiment. Environmental Pollution 158:258-266.
R Core Team. 2013. R: a language and environment for statistical computing. R Foundation for Statistical Computing. Vienna, Austria. http://www.R-project.org (accessed October 31, 2013).
Rivera, V.R., and M.J. Perich. 1994. Effects of water quality on survival and reproduction of four species of planaria (Turbellaria: Tricladida). Invertebrate Reproduction and Development 25:1-7.
Robinson, J.V., L.R. Shaffer, D.D. Hagemier, and N.J. Smatresk. 1991. The ecological role of caudal lamellae loss in the larval damselfly, Ischnura posita (Hagen) (Odonata: Zygoptera). Oecologia 87:1-7.
Rodríguez, P., H. Pizarro, and M.S. Vera. 2012. Size fractionated phytoplankton production in two humic shallow lakes with contrasting coverage of free floating plants. Hydrobiologia 691:285-298.
Rosseti, G., M. Bartoli, and K. Martens. 2004. Limnological characteristics and recent ostracods (Crustacea, Ostracoda) of freshwater wetlands in the Parco Oglio Sud (Northern Italy). Annales de Limnologie 40:329-341.
Rossi, V., E.B.A. Todeschi, A. Gandolfi, M. Invidia, and P. Menozzi. 2002. Hypoxia and starvation tolerance in individuals from a riverine and a lacustrine population of Darwinula stevensoni (Crustacea: Ostracoda). Archiv für Hydrobiologie 154: 151-171.
Ruiz, F., M. Abad, A.M. Bodergat, P. Carbonel, J. Rodríguez-Lázaro, M.L. Gonzalez-Regalado, A. Toscano, E.X. Garcia, and J. Prenda. 2013. Freshwater ostracods as environmental tracers. International Journal of Environmental Science and Technology 10:1115-1128.
Santamaría, L. 2002. Why are most aquatic plants widely distributed? Dispersal, clonal growth and small-scale heterogeneity in a stressful environment. Acta Oecologica 23:137-154.
Schultz, R., and E. Dibble. 2012. Effects of invasive macrophytes on freshwater fish and macroinvertebrate communities: the role of invasive plant traits. Hydrobiologia, 684:1-14.
VII-28
Sesterhenn. T.M., E.E. Reardon, and L.J. Chapman, 2013. Hypoxia and lost gills: respiratory ecology of a temperate larval damselfly. Journal of Insect Physiology 59:19-25.
Seuffert, M.E., and P.R. Martin. 2010. Dependence on aerial respiration and its influence on microdistribution in the invasive freshwater snail Pomacea canaliculata (Caenogastropoda, Ampullariidae). Biological Invasions 12:1695-1708.
Spicer, J. 1993. Oxygen binding by amphipod (Crustacea) haemocyanins. Marine Behavior and Physiology 24:123-136.
Spicer, J., C.L. Dando, and L. Maltby. 2002. Anaerobic capacity of a crustacean sensitive to low environmental oxygen tensions, the freshwater amphipod Gammarus pulex (L.). Hydrobiologia 477: 189-194.
Strayer, D.L., C. Lutz, H.M. Malcom, K. Munger, and W.H. Shaw. 2003 Invertebrate communities associated with a native (Vallisneria americana) and an alien (Trapa natans) macrophyte in a large river. Freshwater Biology 48:1938-1949.
Strayer, D.L. 2010. Alien species in fresh waters: ecological effects, interactions with other stressors, and prospects for the future. Freshwater Biology 55:152-174.
Stucliffe, D.W. 1984. Quantitative aspects of oxygen uptake by Gammarus (Crustacea, Amphipoda): a critical review. Freshwater Biology 14:443-489.
Tall, L., N. Caraco, and R. Maranger. 2011. Denitrification hot spots: dominant role of invasive macrophyte Trapa natans in removing nitrogen from a tidal river. Ecological Applications 21:3104-3114.
Thomaz, S.M., A. Enrich-Prast, J.F. Gonçalves Jr., A.M. dos Santos, and F.A. Esteves. 2001. Metabolism and gaseous exchanges in two coastal lagoons from Rio de Janeiro with distinct limnological characteristics. Brazilian Archives of Biology and Technology 44:433-438.
Turner, A.M., E.J. Cholak, and M. Groner. 2010. Expanding American lotus and dissolved oxygen concentrations of a shallow lake. The American Midland Naturalist 164:1-8.
Urban, R. A., J.E. Titus, and W.X. Zhu. 2009. Shading by an invasive macrophyte has cascading effects on sediment chemistry. Biological Invasions 11:265-273.
Welch, B.L. 1947. The generalization of Student’s’ problem when several different population variances are involved. Biometrika 34: 28-35.
Yozzo, D.J., J.L. Andersen, M.M. Cianciola, W.C. Nieder, D.E. Miller, S. Ciparis, and J. McAvoy. 2005. Ecological profile of the Hudson River National Estuarine Research Reserve. New York Department of Environmental Conservation.
VII-29
Yozzo, D.J., and D.T. Osgood. 2013. Invertebrate communities of low-salinity wetlands: overview and comparison between Phragmites and Typha marshes within the Hudson River estuary. Estuaries and Coasts 36:575-584.
VIII - 1
THE DISTRIBUTION AND FEEDING ECOLOGY OF LARVAL SEA
LAMPREYS IN THE HUDSON RIVER BASIN
A Final Report of the Tibor T. Polgar Fellowship Program
Thomas M. Evans
Polgar Fellow
Department of Environmental and Forest Biology State University of New York, School of Environmental Science and Forestry
Syracuse, NY 13210
Project Advisor:
Karin E. Limburg Department of Environmental and Forest Biology
State University of New York, School of Environmental Science and Forestry Syracuse, NY 13210
Evans, T. E. and K. E. Limburg. 2015. The Distribution and Feeding Ecology of Larval Sea Lampreys in the Hudson River Basin. Section VIII: 1-50 pp. In D. J. Yozzo, S. H. Fernald and H. Andreyko (eds.), Final Reports of the Tibor T. Polgar Fellowship Program, 2013. Hudson River Foundation.
VIII - 2
ABSTRACT
Anadromous fishes are important members of the Hudson River fish community,
but not all members have been well studied. Sea lampreys (Petromyzon marinus) have
largely been ignored, and as a result even their distribution within the Hudson River is
poorly understood. Sea lampreys are currently present in four tributaries of the Hudson
River: 1) Cedar Pond Brook, 2) Catskill Creek, 3) Roeliff Jansen Kill, and 4) Rondout
Creek. Catskill Creek and its tributary, Kaaterskill Creek, produce the majority of sea
lamprey in the Hudson River. The Roeliff Jansen Kill is also important for sea lampreys
in the Hudson River, as sea lampreys appear to grow faster here than at other tributaries.
Sea lampreys are likely to increase their range in the Hudson River in the near future as
the removal of barriers to migration continues, but global climate change poses a serious
long term threat to lamprey populations in the Hudson River.
Isotopic analysis demonstrated that site influenced the importance of terrestrially
derived plant material (allochthonous) and aquatic plant sources (autochthonous) to sea
lamprey larvae. For instance, larval lamprey from the Kaaterskill Creek depended on up
to 60% on allochthonous sources, while those at Cedar Pond Brook only obtained ~1% of
their nutrition from the same source. Changes in watershed land use were not associated
with nutritional source dependence, and local sources may be more important than
watershed level effects. Larval lamprey were isotopically distinct from all
macroinvertebrates measured, suggesting that they exploit resources in different
proportions from measured invertebrates and help more fully utilize organic material in
streams. This study provides important data about the current distribution of sea lampreys
in the Hudson River, and is the first to examine sea lampreys and the invertebrate
Figure 1: Tributaries to the Hudson River below the Troy Dam (A), in the
mid-Hudson River(B), and in the Lower Hudson (C) sampled ............... VIII-10
Figure 2: Logistic regression model predicting the presence or absence of sea
lamprey (Petromyzon marinus) in Hudson River .................................... VIII-18
Figure 3: Average size of young of year lamprey from all streams ..................... VIII-21
Figure 4: Stable isotope ratios of macroinvertebrates, young of year sea lamprey
larvae, and potential food sources ........................................................... VIII-23
Figure 5: Median percent contributions of different nutritional resources to
macroinvertebrate and sea lamprey larvae .............................................. VIII-39
Table 1: Sites assessed for sea lamprey (Petromyzon marinus) in the Hudson
River ......................................................................................................... VIII-17
Table 2: Physical and chemical properties measured at the sample sites in the
Hudson River ........................................................................................... VIII-19
Table 3: Macroinvertebrate data collected in the present study listed by site ..... VIII-20
Table 4: Sites for which sea lamprey (Petromyzon marinus) have been
reported in the Hudson River and the capture confirmation or explanation
of discordance .......................................................................................... VIII-24
VIII - 5
INTRODUCTION
Sea Lamprey in the Hudson River
Anadromous fishes, or those species that spawn in freshwater but migrate to
marine ecosystems for the majority of their growth, are important members of many
coastal ecosystems. The historic abundance of anadromous fishes, combined with their
ease of capture during spawning migrations, has provided economic and social
opportunities for numerous societies (Hardy 1999; Bolster 2006; Bottom et al. 2009).
Early European settlers, familiar with migratory fishes, were still impressed by the
abundance and diversity of species that greeted them upon their arrival to North America
(Collette and Klein-Macphee 2002). However, after initially utilizing these vast
resources, Europeans rapidly overexploited the fisheries, while simultaneously limiting
access to and destroying the freshwater habitats upon which anadromous fishes depended
(Hardy 1999; Lichter et al. 2006; Limburg and Waldman 2009). Current estimates
suggest that >90% of the historic biomass of these migratory fishes has already been lost
(Limburg and Waldman 2009).
The Hudson River is a biologically diverse ecosystem which currently contains
ten anadromous fish species (Levinton and Waldman 2006) and has been the focus of
extensive research (Jackson et al. 2005). The anadromous fish community in the Hudson
River has been, in general, well studied. However, research efforts have not been evenly
divided between all species, and gaps in the current understanding of this important group
remain (Waldman 2006). Sea lampreys (Petromyzon marinus) are the most poorly studied
member of the Hudson River anadromous fish community. Sea lampreys were neglected
because they were not considered economically or socially important in North America,
VIII - 6
are often difficult to sample effectively, and perceptions about this species have been
dominated by research efforts on invasive populations in the upper Great Lakes.
Sea lampreys belong to the most primitive group of vertebrate lineages (Order:
Cyclostomata), and exhibit an anadromous, semelparous (i.e., a species that spawns only
once) life history. Unlike most other anadromous fishes, which spend a shorter time in
fresh than in the marine waters, sea lampreys spend protracted periods in freshwater (up
to 17 years) before a relatively brief time at sea (1-3 years; Beamish 1980). In addition,
unlike many other anadromous fishes in the Northeast where at least some adults are
iteroparous (i.e., they spawn more than once), sea lampreys are an obligatory
semelparous species (Saunders et al. 2006). Because of the limited information available,
there is no way to know historical abundance, or which streams were utilized by sea
lampreys prior to large scale habitat alteration by European settlers. Even recent records
of sea lampreys (i.e., those within the last 100 years) are difficult to find, and are often
anecdotal.
Although sea lampreys have not often been considered an important member of
the anadromous fish community, they may provide or have provided many of the same
ecosystem services as other anadromous species (Holmlund and Hammer 1999). Sea
lamprey larvae and carcasses of spent adults may have provided important food subsidies
to freshwater aquatic and terrestrial systems (Nislow and Kynard 2009). In Maine, sea
lamprey spawning coincides with first feeding of salmonid parr (juveniles), and spent
adults, eggs, and embryos of sea lampreys may all provide important food sources to
these young salmonids (Saunders et al. 2006). In addition, sea lampreys continue to
spawn after other anadromous species during the spawning run (Saunders et al. 2006). A
VIII - 7
sea lamprey adult was observed at a spawning site as late as June 26th during the course
of this study. Also, sea lamprey body shape and swimming style are unlike any other
anadromous species, and they may prefer habitats not utilized by other anadromous
species. In the Great Lakes (where sea lampreys are invasive) barriers are designed that
specifically exploit their climbing style and exclude them from upstream reaches
(McLaughlin et al. 2006).
Stable Isotope Analysis of Lower Trophic Levels in Stream Food Webs
To better understand what role sea lampreys may play in freshwater food webs
stable isotope ratio analysis was used to examine young-of-year (YOY) larval lamprey,
different functional feeding groups of aquatic insects, and primary producers. Briefly,
many elements consist of two or more stable isotopes that differ slightly in mass due to
different numbers of neutrons in the nucleus. These small differences can be quantified
with mass spectrometers, and the ratios can provide important insights into biophysical
processes. All living organisms develop isotopic signatures based upon the source
materials they utilize for growth and development (Michener and Lajtha 2007). The
lighter isotope is preferentially incorporated into biological materials because it is
energetically less expensive to fix (i.e., fractionation), but, when the organism produces
waste, it favors compounds with the lighter isotope for expulsion. Ultimately, the
organism becomes more enriched in the heavier isotope than the food source. These
differences in fractionation develop natural tracers in food webs, which can be used to
follow the flow of nutrients as they move through the ecosystem. The predictable
VIII - 8
fractionation of isotopes as they move through food webs also allows for the estimation
of the trophic level at which an organism is feeding (Peterson and Fry 1987).
Although extensive visual examination of larval lamprey gut content has
documented materials they consume (primarily detritus), the source(s) of the detrital
material is still largely unknown (Moore and Mallatt 1980, Sutton and Bowen 1994,
Mundahl et al. 2005). In contrast to visual identification methods, natural abundance
isotopic analysis represents potentially a more robust and quantitative approach for
assessing the sources of organic matter (OM) supporting the somatic growth and
energetic maintenance of an organism or population (Cole and Solomon 2012; Roach et
al. 2011). Naturally occurring isotopes of C, N, H, O and S in OM may be used to assess,
both qualitatively and quantitatively, different OM sources supporting organism nutrition
and through food webs and even ecosystems, provided the isotopes of these elements can
be measured in both the potential food sources and the target organisms (Peterson and
Fry 1987; Michener and Lajtha 2007). Simultaneous use of multiple natural isotopes can
help resolve with greater accuracy the dietary and nutritional sources of a given species
than with a single isotope (Peterson and Fry 1987; Caraco et al. 2010). Natural abundance
stable isotopes can also be used to help establish at which trophic level organisms are
feeding using predictable fractionation values (Post 2002).
Understanding the nutritional sources supporting larval lamprey is important for
their conservation and to understand better how they interact with the larger stream
community. In addition, although stable isotopes have only been applied in a limited
number of studies of larval lampreys (Hollett 1995; Shirakawa et al. 2009; Limm and
Power 2011), isotopes have been widely used to examine macroinvertebrates (Vander
VIII - 9
Zanden and Rasmussen 1999; Finlay 2001). Many macroinvertebrates have a similar
feeding ecology to larval lamprey, but to date only a single study has simultaneously
examined larval lampreys and stream macroinvertebrates with stable isotopes together
(Bilby et al. 1996). All species of larval lampreys are filter feeders (Mallatt 1982), as are
many aquatic invertebrates (Voshell 2002), but it is unclear if they utilize food sources in
the same proportions. This study attempts to develop a more complete picture of the
stream community by concurrently examining stable isotopes of both invertebrates and
lamprey.
Therefore, the purpose of this study was twofold: 1) to identify the current
distribution of sea lampreys in the Hudson River estuary below the Troy Dam, and 2) to
determine the likely OM supporting YOY larval lampreys and selected
macroinvertebrates utilizing stable isotope analysis. It was hypothesized that YOY sea
lamprey nutrition will be predominantly composed of allochthonous materials, and that
larval lamprey will be isotopically similar to macroinvertebrate filterers. It was also
hypothesized that the increased urbanization and agricultural land uses within the
watershed will increase the reliance on autochthonous sources, because more nutrients
and light will enter the stream. This will be reflected by more positive isotopic values in
the consumers (including sea lamprey larvae).
METHODS
Surveys for Sea Lamprey
In the present study, 23 tributaries of the Hudson River below the Troy Dam were
surveyed for sea lampreys in the summer of 2013 (Figure 1). At 19 of these sites a full
VIII - 10
Figure 1: Tributaries to the Hudson River below the Troy dam (A), in the mid-Hudson River (B), and in the lower Hudson (C) sampled. The length of each stream is the area below the first impassable barrier for sea lamprey (Petromyzon marinus). Numbers are tributaries and are as follows: 1-Poesten Kill, 2-Normans Kill, 3-Vloman Kill, 4-Vlockie Kill, 5-Muitzes Kill, 6-Hannacroix Creek, 7-Coxsackie Creek, 8-Stockport Creek (including Claverack and Kinderhook Creek), 9-Catskill Creek, 10-Kaaterskill Creek, 11-Roeliff Jansen Kill, 12-Saw Kill, 13-Rondout Creek, 14-Indian Kill, 15-Black Creek, 16-Quassaick Creek, 17-Moodna Creek, 18-Indian Brook, 19-Annsville Creek, 20-Cedar Pond Brook, 21-Minisceongo Creek, 22-Furnace Brook, 23-Croton River.
A B C
No record and not captured Recorded but not captured Record and capture
VIII - 11
workup was performed, while at the remaining four only sampling for sea lampreys was
performed. A full workup included measuring local habitat characteristics, physical and
chemical sampling of the stream, a macroinvertebrate sample, and a survey for sea
lampreys at the site. In those sites where a full workup was not conducted, conditions
were determined to be extremely unlikely to support lampreys, usually because of
siltation or high water temperatures. However, to validate the expectation, sampling for
lamprey was conducted in the same manner as at all other sites. Individuals who visited
the site during sampling were also interviewed. Any pertinent information they provided
to the study was noted and is reported.
To determine the composition of the surface area of the sampled stream reach, a
diagonal transect across the stream from bankfull to bankfull was walked. Bankfull was
defined as the point at which water would exit the river and enter the flood plain. At
every step along the transect two points were randomly selected and the bottom
composition was determined following the New York State Department of Environmental
Conservation (NYSDEC) bottom composition scale for at least 100 points (NYSDEC
2009). If a transect was too short to sample 100 points, a second transect was set and the
process repeated.
Aquatic macroinvertebrate samples were collected by sampling the nearest riffle
to the sample site, walking along a 5 m diagonal transect, and kicking into a D-frame net
(mesh size 500 µm) for five minutes. During two sampling events the 500 µm net was
lost and a 600 µm sampler was used instead (at the Black Creek and Moodna Creek). The
entire sample was immediately placed in 70% ethanol and stored at ambient temperature.
Upon return from the field invertebrates were picked from detrital material and classified
VIII - 12
to order. Cleaned invertebrate samples were then subsampled in a tray divided into 25
blocks (1.7 cm2 per block). Blocks were randomly selected and all macroinvertebrates
with heads present in the block were identified to genus. Macroinvertebrates which could
not be identified to genus were identified to the next lowest level and then assigned to a
genus, based upon the assignment of other positively identified members of the same
group. Blocks were selected until at least100 individuals had been identified. Individuals
belonging to Chironomidae and Simuliidae were never classified below the family level,
and did not count towards the 100 classified macroinvertebrate individuals. The number
of individuals belonging to each group in the overall sample was calculated by
multiplying the measured proportions in the subsample by the number of individuals in
the overall sample. The estimated sample was then used to calculate the Shannon
diversity index (SDI) and Hilsenhoff‘s Biological Index (HBI). The SDI was calculated
as follows:
[1] 𝑆𝑆′ = −�𝑝𝑝𝑖𝑖𝑙𝑙𝑙𝑙 𝑝𝑝𝑖𝑖
𝑅𝑅
𝑖𝑖=1
Where pi is the proportion of individuals in the overall sample (excluding Chironomids)
belonging to the lowest taxonomic group identified. The HBI was calculated as follows:
[2] 𝐻𝐻′ = �𝑙𝑙𝑖𝑖𝑎𝑎𝑖𝑖
N
𝑅𝑅
𝑖𝑖=1
Where ni is the number of animals in the taxonomic grouping, ai is the biological
tolerance value, and N is the total number of animals in the sample (excluding
Chironomids; Bode et al. 1996).
To determine if sea lamprey were present at a site, a backpack electrofisher
(Haltech, HT-2000) was used to electrofish for larval lampreys. A low shock (5 Hz, 150
VIII - 13
V, 2:2 pulse pattern) was used to cause larval lampreys to emerge from the substrate.
Animals that emerged from the substrate were captured before they could burrow. It was
observed that the weak pulsed electrical output encouraged larval lampreys to emerge and
attempt to burrow rapidly, in contrast to a continuous pattern which generally caused
them to forego burrowing and attempt to escape the electric field or remain burrowed.
Electrofishing occurred for 15 minutes at each site, which allowed the sampling of all
habitats that appeared likely to support sea lamprey larvae (a mixture of loosely packed
sand and fine organic matter; Slade et al. 2003).
Collections for Stable Isotopes Analysis
For stable isotope analysis, YOY larval lampreys were collected following the
procedure described above. The smallest size class at a site was assumed to be YOY
(Hardisty 1961). Larval lamprey were then stored at ~0°C in sand and stream water from
where they were collected, until they could be returned to laboratory to be frozen at -
20°C. Animals were never held alive for more than 24 hrs. Sand was added to allow
larval lamprey to rest; otherwise, it was observed that they would continue to attempt to
burrow until they were too exhausted to move. Common aquatic invertebrates of the local
macroinvertebrate community were collected by kick netting in nearby riffles and then
hand-picking individuals. Predatory animals were separated from other groups and all
were stored in stream water at 0-4°C for 36-48 hours to allow them to void their guts.
Potential primary food sources were also collected simultaneously by hand picking
terrestrial leaves, soil, aquatic plants and algae, and undisturbed sediment from the areas
in which ammocoetes were collected.
VIII - 14
Samples for stable isotope analysis were dried to constant mass at ~60°C and then
homogenized by grinding in a clean porcelain mortar. Samples were then stored in
desiccation chambers. Stable isotope values were calculated as follows:
[3] 𝛿𝛿𝛿𝛿 = 1000 �𝑅𝑅𝑠𝑠𝑠𝑠𝑠𝑠𝑠𝑠𝑠𝑠𝑠𝑠𝑅𝑅𝑠𝑠𝑠𝑠𝑠𝑠𝑠𝑠𝑠𝑠𝑠𝑠𝑠𝑠𝑠𝑠
− 1�
where Rsample is the ratio of the heavy to light isotope in the sample and Rstandard is the
ratio in an agreed upon standard. To eliminate leading zeroes and ease readability the
sample was then multiplied by 1000. Values were reported as “per mil” (‰) and
designated by the notation δ with a superscript designating which heavy isotope has been
measured. Subsamples of every sample type were packed in clean tin capsules and
analyzed for δ13C and δ15N at the University of California, Davis (PDZ Europa ANCA-
GSL (EA) attached to a PDZ Europa 20-20 isotope ratio mass spectrometer (IRMS)).
Standard deviations for replicate analyses of standards for the instrument were < 0.2‰
for δ13C and < 0.3‰ for δ15N.
Analysis of Distribution, Abundance, and Isotope Data
A logistic regression model was used to quantify the probability of encountering
sea lampreys at a site (i.e., presence or absence). Logistic regression calculates the
probability of an event occurring based upon categorical or quantitative variables. If sea
lamprey presence could be linked to macroinvertebrate data, extensive archived data on
the latter could be used to predict potential sea lamprey distribution. The final model
included only the percent Ephemeropteran (mayfly) abundance, as no other measured
values were important for the model.
VIII - 15
To determine if sea lamprey isotopic values were driven by land use changes, the
percent land use in each watershed was calculated from the 2006 National Land Cover
Database (Fry et al. 2011) and the National Hydrography Dataset (USGS 2013). Land use
was divided into four groups: 1) urban/developed, 2) agriculture/pasture, 3)
forested/natural, and 4) open water. The percent land use of the watershed was correlated
with the average isotopic values of YOY larval lampreys from that site.
Stable Isotope Mixing Modeling
The Bayesian stable isotope mixing model MixSIR (Moore and Semmens 2008)
was used to estimate the contributions of potential food sources to YOY larval lamprey
nutrition. Bayesian statistics allow for backward reasoning (after observation of an event)
to predict the likely occurrences that led to that observation. MixSIR applies this
statistical analysis to stable isotope mixing models, allowing for the incorporation of the
uncertainties around source isotopic values and fractionation estimates to better predict
food source dependence and confidence of the importance of a given dietary item to the
organism (Moore and Semmens 2008).
Each site was modeled separately because of apparent differences in isotopic
values of primary producers and consumers. Potential food sources for lampreys and
invertebrates at each site were divided into two groups (i.e., autochthonous and
allochthonous). Autochthonous sources were considered to be all types of aquatic plants
collected at a site, including algae and macrophytes (e.g., Elodea sp., Potamogeton sp.,
and Myriophyllum sp.). Allochthonous sources were the terrestrial plants collected at a
site and included Acer spp., Vitis riparia, Quercus sp. and Rosa multiflora. Terrestrial
VIII - 16
surface soils and aquatic surface sediments were also considered for inclusion within
allochthonous and autochthonous sources in the model respectively, but they were
intermediate between these terrestrial and aquatic plants. Therefore, because these
sources were likely amalgamations of terrestrial and aquatic plants, which were already
accounted for in the model, they were not included explicitly in the final model. The final
models included all the measured terrestrial plants at a site as the allochthonous source,
and all of the measured aquatic plants, including algae, as the autochthonous source.
Isotopic values of larval lampreys, invertebrates, and potential nutritional sources
were determined from measurements of samples collected in the present study. On the
basis of prior work (Sutton and Bowen 1994), larval lampreys were assumed to be one
trophic level above primary producers and follow published fractionation values of
0.4±1.3‰ for δ13C and 3.4 ± 1.0‰ for δ15N (Post 2002). Invertebrates were also
considered to be one trophic level above primary producers and the same fractionation
values as for larval lampreys were utilized. All models were run with 1,000,000 iterations
(i.e., MixSIR attempted to find a solution to the model for each iteration). Results
conformed to the recommended guidelines for determining if the model output had
estimated true posterior distributions (Moore and Semmens 2008).
RESULTS
Sea lampreys were found in four tributaries to the Hudson River: the 1) Roeliff
Jansen Kill (Columbia County, confluence at river km 178), 2) Catskill Creek (Greene
County, river km 182), 3) Rondout Creek (Ulster County, river km 146), and 4) Cedar
Pond Brook (Rockland County, river km 63; Figure 1). Sea lampreys were not found in
VIII - 17
all Hudson River tributaries for which prior records of these animals existed (Table 1;
Figure 1).
Table 1: Sites assessed for sea lamprey (Petromyzon marinus) in the Hudson River.
Stream Name County River km
Lamprey Reported Prior Source
Lamprey observed in this study
Annsville Creek Westchester 71 N NA N Black Creek Ulster 135 Y Schmidt and Limburg 1989 N
Catskill Creek Greene 182 Y Numerous Y Cedar Pond Brook Rockland 63 Y www.piplon.org (2002) Y Coxsackie Creek Greene 204 N NA N
Croton River Westchester 55 N NA N Furnace Brook Westchester 63 N NA N
Hannacroix Creek Albany 212 Y Greeley and Bishop 1933 N Indian Brook Putnam 85 N NA N Indian Kill Dutchess 137 N NA N
Kaaterskill Creek Greene 182 Y Schmidt and Cooper 1996 Bryan et al. 2005 Y
Moodna Creek Orange 92 N NA N Minisceongo
Creek Rockland 64 N NA N
Muitzes Kill Rensselaer 217 N NA N Normans Kill Albany 225 N NA N
Poesten Kill Rensselaer 241 Y New York State Museum specimen (2007) N
Quassaick Creek Orange 100 Y NYSDEC specimen (2005) N
Roeliff Jansen Kill Columbia 178 Y Brussard et al. 1981
Waldman 2006 Y
Rondout Creek Ulster 146 Y Greeley and Greene 1937 Hudson River Almanac 2007b Y
Saw Kill Dutchess 158 Y Smith 1985 N
Stockport Creek Columbia 195 Y Hudson River Almanac 2005 Anonymous 2013 N
Vlockie Kill Rensselaer 219 N NA N Vloman Kill Albany 220 N NA N
VIII - 18
Sea lamprey presence was not correlated with percent bottom cover (i.e., percent
cover of rock, rubble, gravel, sand, or silt; Table 2), percentage of Trichopterans,
Plecopterans, Dipterans, or Chironomids in the invertebrate sample, species richness, the
SDI, or the HBI (Table 3). Although it was not significant (Chi-square, df = 1, X2 = 2.20,
p-value = 0.14), sea lampreys were never found at sites that did not also have
Plecopterans. A logistic regression found that sea lamprey presence was likely (> 50%)
when the percent of Ephemeropterans exceeded 44% (coefficient estimate = 0.10,
Figure 2: Logistic regression model predicting the presence or absence of sea lamprey (Petromyzon marinus) in Hudson River tributaries as a function of percent Ephemeroptera in the macroinvertebrate sample. Plecoptera presence was not included in the model, but sea lamprey were always found at sites which also had Plecopterans.
0 20 40 60 80 100Percent Ephemeroptera in Sample
Pres
ense
of S
ea L
ampr
eyN
oY
es
Plecopterans not presentPlecopterans present
𝐿𝐿(𝑥𝑥) =1
1 + e−(−4.60 + 0.104𝑥𝑥)
VIII - 19
Table 2: Physical properties and pH measured at the sample sites in the Hudson River.
Stream Name County Width (m)
Bottom type (%) Embeddedness pH Rock Rubble Gravel Sand Silt
Annsville Creek Westchester 15.7 4 7 65 16 8 100 7.4 Black Creek Ulster 77.0 0 5 75 9 12 <20 8.0
Catskill Creek Greene 59.0 0 36 63 0 0 0 8.1 Cedar Pond Brook Rockland 17.5 4 37 46 12 2 <5 8.7 Claverack Creek Columbia 51.0 2 15 56 11 17 ND 8.5 Coxsackie Creek Greene 24.0 3 40 32 10 14 50 8.4
The average length of YOY larval lamprey was different between sites (ANOVA,
df = 4, F-test = 11.53, p < 0.001). The Roeliff Jansen Kill YOY larval lamprey were
larger (28.8±3.5 mm, SD) than larvae from all other sites (18.8±2.6 mm, SD; Figure 3).
Figure 3: Average size of young of year lamprey from all streams at which lamprey were captured. The black line is the median and boxes are the second and third quartiles. Sites that are different are marked by different letters.
Isotope Modeling Results
YOY larval lamprey isotopic values were different from measured
macroinvertebrates at every site, even though many of the macroinvertebrate groups
measured are also filterers (i.e., Hydropsychidae, and Isonychiidae; Figure 4).
Contributions of autochthonous and allochthonous sources to YOY larval lamprey varied
010
2030
40
Stream Name
Tota
l Len
gth
(mm
)
Kaaterskill Creek Catskill Creek Rondout Creek Cedar Pond Brook Roeliff Jansen Ki
a a a a
b
VIII - 22
by site from almost complete dependence on autochthonous sources (median contribution
98.7% at Cedar Pond Brook), to less than half of their nutritional needs (40.3% at
Kaaterskill Creek; Figure 5). Larval lamprey dependence on autochthonous or
allochthonous sources was not associated with urban land (df = 2, t-value = 1.6, p-value =
Sea lamprey presence/absence was associated with only a few of the metrics
collected. These results are consistent with prior work that has found that sea lamprey
distribution at the level of the stream difficult to predict from habitat data (Neeson et al.
2007). Sea lamprey larvae utilize marginal habitat in the hyporheic zone (i.e., area along
the edge of the stream in which ground and surface waters mix), potentially limiting the
feasibility of utilizing high level generalizations about streams to predict their presence.
Subsurface flows, ground water temperature, and oxygen content may all play important
roles at the local level and are difficult to scale up. In addition, larvae may be
experiencing conditions different from the surface waters and the macroinvertebrate
communities that were examined during the course of this work.
Macroinvertebrate assemblages provide a tool to help other researchers in the
Hudson River select sites where they might expect to find sea lampreys. Plecopterans are
associated with cool, unpolluted, highly oxygenated waters (Stewart and Stark, 2008),
conditions which are highly favorable to sea lamprey growth and development (Morman
VIII - 23
Figure 4: Stable isotope ratios of macroinvertebrates, young of year sea lamprey larvae, and potential food sources. δ13C vs. δ15N for (a) Cedar Pond Brook, (b) Kaaterskill Creek, (c) Roeliff Jansen Kill, and (d) Rondout Creek
VIII - 24
Table 4: Sites for which sea lamprey (Petromyzon marinus) have been reported in the Hudson River and the capture confirmation or explanation of discordance.
Stream Name Lamprey Reported
Lamprey Observed Reason for Disagreement With Historic Data
Black Creek Y N Single larvae captured during large sampling effort, animals may be extremely rare
Catskill Creek Y Y Cedar Pond
Brook Y Y Hannacroix
Creek Y N Historic record (1934), possible lampreys currently spawn higher than sampling site
Kaaterskill Creek Y Y
Poesten Kill Y N Single record of an adult, possible migrant looking for spawning site
Quassaick Creek Y N Single record of a dead adult, possible migrant looking for spawning site
Rondout Creek Y Y Roeliff Jansen
Kill Y Y
Stockport Creek Y N Maybe currently extirpated, interview with an anonymous resident suggest this to be the case; no current observations
Saw Kill Y N American Brook Lamprey record, sea lampreys may occasionally attempt to spawn here
et al. 1980; Jobling 1981). The association of sea lamprey with Ephemeropterans may also be
because Ephemeropterans can be abundant and most diverse in rocky-bottomed, 2nd and 3rd order
streams (Waltz and Burian 2008), often where adult sea lampreys spawn. In areas in which sea
lampreys are no longer able to access historic grounds, the percentage of mayflies may provide a
way to help establish where sea lamprey occurred historically and inform potential restoration
efforts.
Assessed Tributary Narratives
A narrative of each sampled stream listed alphabetically by stream name, is reported
below. Sites for which a record of sea lampreys existed are summarized in Table 4. This survey
was conducted in the summer following Hurricane Sandy, and within two years of Hurricane
Irene and Tropical Storm Lee, all of which caused serious flooding in the Hudson River.
Flooding events can wash larval lampreys out of streams (Potter 1980), and these events likely
VIII - 25
depressed lamprey populations in the Hudson Valley. As a result, 2013 may have been an
atypical year for sea lampreys in the Hudson River.
Annsville Creek (Westchester County, river km 71)
Annsville Creek enters the Hudson River in Peekskill, NY, but is surrounded by large
stretches of forest. Residential communities are adjacent to much of the river and many small
besides Chironomids) and composed primarily of the crustacean Gammarus sp., which are
omnivorous and tolerant (Table 3). Siltation was also clearly occurring, with 62% of bottom
samples having 0.5 – 5 mm of deposition. Eutrophication is also likely occurring, as large mats
of filamentous algae were present. No sea lampreys were observed while surveying, and in its
current state this stream would not support them.
Croton River (Westchester County, river km 55)
The Croton River, near Croton-on- Hudson, NY, is fed by the New Croton Reservoir, the
final receiving reservoir in the East-of-Hudson component of New York City’s water supply
system. Eutrophication appeared to be an issue as water was turbid and visibility was limited to <
50 cm. Sea lampreys were not observed at this site, although abundant larval lamprey habitat
appeared to be available. Only a short stretch would be available to sea lampreys and may
preclude successful spawning.
Furnace Brook (Westchester County, river km 63)
Furnace Brook near Cortlandt, NY, is extensively dammed although there is a short
stretch below the first complete dam and the head of tide sea lampreys could access. The
invertebrate community was only moderately diverse (six genera, not including Dipterans), and
included no Plecopterans and few Ephemeropterans (Table 3). Sea lampreys were not observed
at this site, although it may have historically supported them. The extensive damming along this
stream may be preventing natural processes and is likely degrading the quality of the limited
habitat available. It is hard to recommend large scale efforts to remove or mitigate dams here,
VIII - 29
because of how numerous they are in the stream. Many of these dams are not functional, and
deserve to be inspected, as they may begin to pose a public safety hazard as they continue to age.
Hannacroix Creek (Albany County, river km 212)
Hannacroix Creek was historically a tributary utilized by sea lampreys (Greeley and
Bishop 1933) and is currently surrounded by forest and agricultural lands. Reaches lightly
influenced by tidal inputs were sampled, although these areas are not ideal for sea lampreys,
because access to higher reaches was difficult. Invertebrates were generally dominated by non-
insect groups (~80%, i.e., Crustacea, primarily Gammarus sp.), but Plecopterans (Agnetina sp.)
were present, suggestive of high quality habitat potentially upstream (Table 3). No larval
lampreys were observed though American eel (Anguilla rostrata) were found occasionally. Sea
lampreys may be able to exploit upper reaches, and further efforts should be made to determine if
they still utilize Hannacroix Creek.
Indian Brook (Putnam County, river km 85)
Indian Brook enters the Hudson River by flowing through Constitution Marsh, a large
wetland. The stream has a short stretch (~100 m) beyond head of tide of moderate gradient with
potential lamprey habitat, before a series of falls that would prevent migration further upstream.
The water quality at this site is likely extremely high as evidenced by the macroinvertebrate
community, which included three Plecopteran genera (Pteronarcys sp., Acroneuria sp., Leuctra
sp.) and seven genera which are listed as sensitive to very sensitive (e.g., Dolophilodes sp.,
Lepidostoma sp.; Table 3). During the spring a fyke net, operated by the Audubon Society, is
deployed across the mouth of the stream to capture in-migrating American eels (glass eels).
VIII - 30
Audubon staff reported that they have not seen or captured any lampreys. Water quality does not
prevent lampreys from utilizing this stream, but the limited habitat available may prevent
successful exploitation. Other tributaries to Constitution Marsh provide similar habitat, and
lampreys may intermittently spawn in them, but they are unlikely to succeed to any serious
degree.
Indian Kill (Dutchess County, river km 137)
The Indian Kill is a small stream that passes through Margaret Lewis Norrie State Park
before meeting the Hudson River. No lampreys were seen during the survey at this stream
although American eels were common. Schmidt and Cooper (1996) said that this stream had high
water quality, but reported that DO was < 100% saturation. The stretch has excellent potential
larval lamprey habitat as extensive loosely packed sand is present. However, the stream is very
shallow and the survey did not observe any riffles that would support spawning adult lampreys.
Kaaterskill Creek (Greene County, river km 182)
Kaaterskill Creek is a tributary of Catskill Creek, but is more turbid and much sandier
than the Catskill Creek. The additional sand provides excellent and extensive larval lamprey
habitat. Interestingly, a private land owner reported, during an interview, that he had observed
“…thousands of eels below the falls [at the junction of Cauterskill Rd and Cauterskill Ave] when
kayaking on the river” (Anonymous, personal communication). He had not determined if they
were sea lampreys (which are often called lamprey eels) or American eel, but it appears likely
they were sea lampreys. Sea lampreys can be visible in the day during the spawning run, and
would congregate below a natural barrier if it slowed their migration upstream. In contrast,
VIII - 31
American eel generally are nocturnal and congregate in sanctuaries together but not in the open
during daylight. Above the falls, larvae of multiple sizes were easily collected, suggesting
multiple successful spawning events over the course of numerous years. The New York State
Museum also reported in their collection a lamprey more than 9 km from the falls. Therefore,
Kaaterskill Creek is likely the most important stream for sea lamprey in the Hudson River. Based
on the unobstructed length of the Kaaterskill (~17 km) and the observation that habitat quality
generally appeared to be high along its entire length, the majority of sea lampreys in the Hudson
River may originate in this river. Efforts should be made to continue “business as usual” in this
stream as it appears critical for sea lamprey success in the Hudson River.
Minisceongo Creek (Rockland County, river km 64)
Minisceongo Creek, in West Haverstraw, NY, is a heavily urbanized stream that has
extensive heavy industrial activity near its mouth. However, the water was cool and clear when
sampling occurred. In addition, numerous trout (likely Brown, Salmo trutta or Brook trout,
Salvelinus fontinalis) were observed at the sample site. Sea lampreys were not captured at this
site, although there appeared to be appropriate habitat for adults and larval lamprey. Large
amounts of trash and some signs of sedimentation and pollution were also observed at the site. In
addition, this stream is immediately adjacent to a river which does contain sea lamprey. Local
conditions may be limiting sea lamprey usage of this stream, and cleanup efforts may be able to
establish a sea lamprey run here.
VIII - 32
Moodna Creek (Orange County, river km 92)
It was not possible to sample the main body of Moodna Creek and the first tributary on
the southern side was sampled instead. Moodna Creek was highly modified by hurricane Irene
and large portions of both banks were eroded. Construction activities occurred throughout the
summer to stabilize the banks and rebuild washed out bridges/roads which precluded access to
the river. Sea lampreys were not captured in the tributary, but American eels were not observed
either, suggesting a barrier further downstream. It is possible that the tributary has a blockage not
visible from aerial photographs or roads that is precluding migratory fish access. Plecopterans
were present at the sampled site, although mayflies were extremely rare (<5% of invertebrate
community). Without being able to sample the main stem, the presence of sea lampreys in this
tributary cannot be conclusively ruled out.
Normans Kill (Albany County, river km 225)
The Normans Kill is south of Albany, NY, and urban sprawl is encroaching on a number
of banks, likely increasing erosion and sedimentation. The water of the main body was always
turbid near Albany and further upstream, though it was visited during both low and high flow
events. Upstream habitat is protected by forested areas in some regions, and some tributaries
appear to be transporting large amounts of loosely packed sand, which would provide excellent
habitat for sea lamprey larvae. There are natural rapids near the mouth of the river, but these
likely do not prevent sea lamprey access to the river. The Normans Kill is noted as a high quality
warm water stream (NYSDEC 2007), and as a result likely does not support lamprey. There are
no reports of sea lampreys in the Normans Kill though the NYSDEC has surveyed the stream
VIII - 33
multiple times (NYSDEC 2007). If sea lampreys utilize the Normans Kill they may use small
tributaries that are cool enough to support larvae year round.
Poesten Kill (Rensselaer County, river km 241)
The Poesten Kill is a highly urbanized stream that passes through Troy, NY, and the
stream was filled with trash and refuse when sampled. However, the macroinvertebrate
community was rich, and two species found at this site (i.e., Siphlonurus sp., Haploperla sp.)
were found nowhere else in the Hudson River during the course of this study (Table 3).
American eels were extremely abundant, and both large and small eels were encountered
frequently. The site appeared to offer excellent conditions for sea lampreys from a community
perspective. However, no sea lampreys were found although a sea lamprey adult has been
collected in recent years within the creek (Hudson River Almanac 2007a). The adult may have
been brought in attached to another fish or may have been searching for spawning sites. It is also
possible that adults do spawn in this stream but that conditions are inappropriate for larval
development. American eel are known to feed on larval lamprey (Perlmutter 1951; Denoncourt
and Stauffer 1993), and the proximity to the urban environment may result in high levels of salt
runoff during winter.
Quassaick Creek (Orange County, river km 100)
Quassaick Creek is a small, highly urbanized stream, in Newburgh, NY with barriers to
sea lamprey migration ~1 km from its mouth. Trash and filamentous algae were present
throughout the stream when sampled. However, water clarity was high, and the bottom was
visible at all depths (~1 m). No lamprey larvae were found, but American eels were common. A
VIII - 34
recent report (June 27 2005) of a deceased sea lamprey adult in this stream (Hudson River
Almanac 2005) suggest that adults do occasionally enter the creek. Currently, however
conditions appear wholly unsuitable for larval growth and development. Besides a variety of
pollutants, salting of the local roads may also pose a threat to sea lamprey larvae here.
Roeliff Jansen Kill (Columbia County, river km 178)
The Roeliff Jansen Kill (locally known as the “Roe-Jan”) is a high quality, cool water
stream that has a long stretch (> 6 km) before the first barrier (NYSDEC 2012b). Land use in
downstream reaches is primarily forest with small amounts of residential, while the upstream is
primarily agricultural. Sea lampreys have been captured here before (Brussard et al. 1981;
Waldman 2006), and numerous individuals who were interviewed along the Roe-Jan had seen
sea lampreys in the stream. One individual reported observing them spawning yearly at the Mill
dam immediately below the Mill Road bridge (Anonymous, personal communication). At this
location there is an old dam on top of a natural rapids which likely limits further upstream
movement. High rains and the closure of the Mill Road precluded visual confirmation of adult
migrations within the stream during the spawning run. Prior to construction of the dam, this may
still have been the upper limit of sea lamprey migration. To confirm if the barrier was completely
impassable, the survey sampled above the barrier where habitat conditions also appeared suitable
for lampreys, but did not find any individuals. Likely lamprey redds were observed further
downstream in June.
Larvae were abundant at the local level, but their distribution was patchy and often areas
that appeared appropriate by visual inspection did not contain any larvae. YOY larvae captured
here were larger (29 ± 4 mm, SD) than at all other sites (19 ± 3 mm, SD; Figure 3), suggesting
VIII - 35
growing conditions for lamprey in the Roe-Jan are the most favorable in the Hudson River.
Farmers in this watershed should be encouraged to maintain buffer strips and local residents
should be educated not to develop highly mowed and treated lawns (wherever possible) to
maintain this habitat. Any work that is conducted within the stream or immediately adjacent
should take into account that the habitat is highly unique and important for sea lampreys.
Rondout Creek (Ulster County, river km 146)
Rondout Creek is a large tributary of the Hudson that passes through Kingston, NY
before emptying into the Hudson River. The stream is highly urbanized around the Kingston
metropolitan area, but generally forested further upstream. Agriculture is also an important land
use in the watershed, but is primarily concentrated around the main body of the stream. A historic
record (Greeley and Greene 1937) and recent reports (Hudson River Almanac 2007b), have
documented sea lamprey utilization of this river. Larval lampreys were found immediately
downstream from High Falls, NY, and this is likely the upper limit for sea lampreys. Appropriate
habitat is available upstream but the steep waterfalls and high flows likely preclude adults
reaching these areas. Larvae were common in sandbars along the shoreline at High Falls.
However, the depth of the stream (>2 m) made it difficult to estimate how many larvae might be
present. There may be numerous larval lampreys utilizing this river in deeper areas. There appear
to be no immediate threats to sea lamprey usage of this habitat, unless access is limited by the
currently passable Eddyville Dam further downstream.
VIII - 36
Saw Kill (Dutchess County, river km 158)
The Saw Kill has a short stretch of stream (~100m) before the first large natural falls and
above the head of tide. Invertebrate diversity was high (17 families were collected not including
Chironomids), and there were numerous groups (five genera) that are listed as sensitive (Table
3). The Saw Kill is unusual in that it is the only stream in the Hudson River, north of New York
City, for which a record of American brook lamprey (Lethenteron appendix) has been reported
(Smith 1985). When surveyed no lampreys of any kind were found, although adult sea lampreys
have been observed at the falls (E. Kiviat, personal communication). The habitat available for
larval lampreys below the falls is extremely limited and likely not a successful rearing area for
sea lampreys. American brook lampreys are small (usually < 200 mm) non-parasitic lampreys
that likely migrate only short distances to spawn. This animal probably did not migrate from
more southerly populations near New York City to the Saw Kill, but was possibly washed
downstream from the headwaters of the Saw Kill. There may be, or was, a population of
American brook lampreys further upstream that attracts sea lampreys occasionally to the stream
(Fine et al. 2004). In the present survey, sampling for American brook lamprey was attempted at
upstream locations, but suitable access points were unavailable. Researchers working with
permission from land owners should examine the headwaters of the Saw Kill to determine if an
undocumented population of American brook lampreys is present.
Stockport Creek (Columbia County, river km 195)
Stockport Creek, located north of Hudson, NY, has a long, tidally influenced delta region
that is surrounded by private residences and forest. There is a small waterfall (approximately
three m in height) under the Route 9 bridge that separates the upper river from the tidal portion,
VIII - 37
but likely does not limit sea lamprey migration. Upstream of the falls Stockport Creek eventually
splits into Claverack Creek and Kinderhook Creek. The Claverack Creek has a dam within 500
m of its mouth, but the dam has been severely damaged and would not prevent migration.
However, only eight insect genera where present (excluding Dipterans; Table 3) and water
temperatures approached sea lamprey lethal limits (30°C in stream, lethal limit is 31°C).
Although extensive appropriate habitat appeared to be present no lampreys were found.
Kinderhook Creek appeared to have high water quality and provide potential habitat. The
invertebrate community was very diverse (18 genera excluding Dipterans; Table 3) and
abundant. Upstream of the mouth are multiple dams currently used for hydropower that are built
on top of a series of natural falls. Water temperatures in the stream were also close to the lethal
limit for sea lamprey (30°C in stream, the lethal limit is 31°C). Therefore, lower reaches are
unlikely to support larval lampreys, and adults likely need to penetrate further upstream to
successfully reproduce.
An interviewed individual currently working at one of the hydropower facilities reported
regularly seeing small sea lampreys damaged or killed in the turbines when removing dead,
impinged, American eels (Anonymous, personal communication). Their size and direction of
capture (i.e., as they moved downstream) suggest these animals were migratory transformers
heading out to sea to feed. He also reported not having seen any for “…a couple of years…”
Surveys for lampreys above the dams in Valatie, NY were conducted, but no lampreys or eels
were found. Habitat upstream looked to be of high quality and it is likely if sea lampreys could
access the habitat, they would utilize it. The long, protracted larval period may allow rare adult
penetrations into upper reaches to produce successful migrants for long periods. This may result
VIII - 38
in a net sink for the lamprey population as migrating adults are attracted to the scent of larval
lamprey and congregate below successful spawning areas, wasting their reproductive output.
Vlockie Kill (Rensselaer County, river km 219)
The Vlockie Kill, near Castleton-on-Hudson, is a small stream that has short stretch
(~0.5-1 km) available to migratory sea lamprey. Although this site was surrounded by forest
there was a large amount of siltation present (possibly from tidal influence), human refuse, and
few fish were observed. The Vlockie Kill may be suffering from modifications upstream that
have allowed the mobilization of silt/fines. No sea lampreys were found and they will not exploit
this habitat unless siltation is significantly reduced.
Vloman Kill (Albany County, river km 220)
The Vloman Kill is south of Albany, NY and has a very limited stretch available for
migratory fishes (<1 km) below the first barrier. The delta floodplain was surveyed for sea
lampreys during low tide but none were found. The water was very turbid and the bottom was
primarily fine clay particles which were anoxic at a few mm in depth. It was therefore not
suitable for sea lamprey larvae. Two barriers to upstream movement are present, and these are
likely able to restrict all anadromous fish movement into higher reaches. Individuals nearby
reported that they had never seen sea lampreys at the Vloman Kill, but had observed them
frequently and in large numbers in the Catskill Creek.
VIII - 39
Stable Isotope Analysis
At Cedar Pond Brook, lampreys were primarily supported by autochthonous sources
(Figure 5), because aquatic plants had isotopic values high enough to explain the high isotopic
values of lampreys (both in respect to δ13C and δ15N). Although the model explained larval
lamprey isotopic values with autochthonous sources, lampreys at this site may actually be
receiving N and C contributions from anthropogenic waste sources, such as sewage or leaky
septic systems, however, these sources was not sampled. Anthropogenic waste is more positive
with respect to both δ13C and δ15N than natural sources (McClelland et al. 1997; Cravotta 2002),
Figure 5: Median percent contributions of different nutritional resources (i.e., autochthonous and allochthonous) to macroinvertebrates and sea lamprey larvae from different streams calculated by the Bayesian model MixSIR. Lower and upper error bars correspond to the 5% and 95% posterior proportional contributions respectively.
VIII - 40
and larval values (range of δ13C = -27 to -23, and of δ15N = 6 to 9) would be easily explained by
this source (δ13C = -25 to -20, and of δ15N = -2 to 13; Cravotta 2002). The stream was filled with
large amounts of trash, and is immediately downstream of a county park. Larval lampreys may
also have access to liquefied wastes traveling in subsurface waters, and may utilize this source if
it exists.
The macroinvertebrates measured at the site did not appear to be relying on the same
materials and were well explained by sources. Therefore, larval lamprey (which spend time
burrowed in sediments and rarely emerge) may be relying on sources not often consumed by the
invertebrates measured. Interestingly, one larval lamprey had lower isotopic values (δ13C = -27.1,
δ15N = 5.7) than the other two lampreys at the site (δ13C = -23.3 and -24.0, δ15N = 9.2 and 8.6;
Figure 4). The first lamprey was larger (24 mm) than the other two lampreys (18 and 19 mm),
suggesting it may have been spawned earlier in the year. If it was spawned earlier it was likely
further upstream and was washed downstream to the site where it was collected later. It may still
have been coming to isotopic equilibrium with its sources at the collection site (Tieszen et al.
1983), and its isotopic signature may have reflected sources further upstream. Larval lampreys
may be very sensitive to differences in local site conditions, and may offer a way to detect
anthropogenic waste in streams.
Predicted contributions of sources from modeling to different groups at Kaaterskill Creek
were similar, and uncertainty was large for all estimates (Figure 5). A single aquatic algae sample
had a δ13C signature similar to terrestrial plants, which resulted in a large standard deviation for
autochthonous sources in the model. Kaaterskill Creek appears to be more dependent on
allochthonous sources as all groups had more elevated values than at any other site. The water at
the site was moderately turbid, and the bottom of the stream was not readily visible at all depths.
VIII - 41
The turbidity appeared to be the result of suspended particulate matter, which may have been the
result of runoff from local fields transporting soil material. If this is the case the system may be
more dependent on allochthonous carbon, because particulates shade algal growth but also
provide a source of nutrition (Rounick et al. 1982; Bartels et al. 2012).
At the Roeliff Jansen Kill (where growth of lampreys was fastest; Figure 3), larval
lampreys were dependent approximately equally on autochthonous and allochthonous sources
(Figure 5). Larval lamprey growth may be dependent on the quality of food available, but is also
known to depend on the density of animals (Morman 1987). Further work could be done to
determine if lamprey in the Roeliff Jansen Kill are growing faster because of better nutrition or
for another reason. Source contributions to larval lamprey at this site were more similar to those
of Heptageniid mayflies, which are scrapers, than the collecting-filtering Isonychiids mayflies.
Larval lamprey filtering/collecting is assumed to be similar to other invertebrates, but may not be
similar to other groups. Lampreys are unlike all other filter feeders, and have no good proxy
among any extant group (Mallatt 1982). Part of the success of lamprey as a group maybe their
ability to exploit a habitat and feeding style that no other group has adapted to fill.
At Rondout Creek, autochthonous sources were more important than allochthonous
sources for all groups. Again lampreys were more similar to Heptageniid mayflies (scrapers) and
Hydropsychiid caddisflies (sedentary collector-filterers), than the more mobile collector-filtering
Isonychiids. The Rondout is wide (> 10 m) and slow moving above the barrier to sea lamprey
migration, and likely produces high amounts of algal growth. Large black fly (Simuliidae)
larvae, which are also filter feeders, were also very common at the site, often completely
covering rocks in areas of high current. It seems likely that algal sources upstream provide large
VIII - 42
amounts of productivity to communities immediately downstream where these animals were
captured. Lamprey throughout the Rondout may not be as dependent on autochthonous sources.
Larval lampreys appear capable of exploiting a variety of sources to meet nutritional
requirements. In addition, larval lampreys may be sensitive to some types of human pollution,
which could be detected with isotopic analysis. Further work is needed to determine if they could
be useful as bio-monitoring tools. Their limited distribution and the difficulty of sampling for
larval lamprey may prevent wide scale use, but at sites in which they do occur, they could offer
unique information about their environment. Larval lampreys were also isotopically unique from
the macroinvertebrate community in which they occur, and appeared to rely on a different
proportion of autochthonous and allochthonous sources.
CONCLUSIONS
The current distribution of larval lampreys in the Hudson River is restricted to only a few
tributaries (i.e., Cedar Pond Brook, Catskill Creek, Roeliff Jansen Kill, Rondout Creek).
However, densities of larval lampreys at the local scale can be high (~2 individual/ m2). Sea
lampreys were found in fewer locations than previously reported in the Hudson River. However,
many of the reports are for adult animals, which were likely seeking suitable spawning habitat
and are not as sensitive as larvae. In at least one case (i.e., Stockport Creek), there appears to be a
true reduction in their range in recent years. Sea lampreys may be able to make rare, successful
spawning events that produce larvae for extended periods, but attract easily visible adults for
long periods by means of odor trails (Fine et al. 2004). The barriers to migration at Stockport
Creek would be difficult for sea lamprey to pass except during exceptionally high flow years.
Animals unable to penetrate above the falls and dams likely do not produce larvae, but any adult
VIII - 43
that made it upstream would have excellent habitat available for spawning and the subsequent
larvae. In at least one location (i.e., Saw Kill), undocumented populations of American brook
lampreys may be present based on a prior capture report (Smith 1985) as well as reports of sea
lampreys entering the stream. Sea lampreys are attracted to the larvae of any lamprey species
(Fine et al. 2004), but adult sea lampreys would not be able to successfully reproduce in the
mouth of the Saw Kill.
Currently, Catskill Creek is the most important producer of sea lampreys, and the
Kaaterskill Creek (which is a tributary to the Catskill Creek) is its most important tributary. The
Kaaterskill Creek has a long stretch (> 10 km) of unobstructed habitat appropriate for both sea
lamprey larvae and adults, making this unique to the Hudson River. The Roeliff Jansen Kill is
also an important tributary for sea lamprey in the Hudson River. Sea lampreys in the Roe-Jan
appear to grow more quickly than at any of the other tributaries where they were captured. More
work is needed to determine if growth rates are actually higher throughout the Roe-Jan, or if
larval growth is more dependent on local conditions.
Sea lampreys prefer cool water, and as a result climate change is likely to restrict and
reduce sea lamprey numbers in the Hudson River. Although climate change is a threat to the
future of sea lamprey in the Hudson River, past and present anthropogenic activities have also
likely limited populations through the construction of dams and pollution of stream waters.
However, sea lampreys in the Hudson River were likely never as abundant as other members of
the diadromous fish community. The erosion of decaying dams and the removal of barriers to
migration may allow sea lampreys to exploit more habitats, potentially providing a buffer against
climate change impacts. Sea lampreys are an unusual member of the Hudson River that have
been little studied, but their uniqueness and importance as members of the anadromous fish
VIII - 44
community make them deserving of more directed research efforts. Additionally, their presence
indicates high stream quality and thus restoration efforts might be able to use their presence as a
criterion for achievement of some restoration goals.
ACKNOWLEDGEMENTS
I thank the Tibor T. Polgar Fellowship Program of the Hudson River Foundation and the Edna S.
Bailey Sussman Foundation for funding and support of this project. I also thank Kathy Hattala
and Robert Adams for advice and guidance on selecting locations and choosing streams to
survey. In addition, thanks to all members of the NYSDEC who provided help and reports of sea
lamprey, and especially to those working on the Hudson River Almanac. Thanks also to David
Yozzo who allowed me to come field sampling with him and for providing information. Thanks
to the University of California Davis Stable Isotope Facility as well as Joy Matthews for their
excellent work and rapid turnaround of our samples. Special thanks to John Waldman, Robert
Schmidt, and Erik Kiviat for their help this summer. Thanks to Karin Limburg for her help and
support throughout my work on this project, and for reviewing and editing drafts of the final
manuscript. Thanks also to reviewers at the Hudson River Foundation whose comments
improved the manuscript before its completion. Finally, thanks to Caitlin Eger, my wife, for all
her help and for assisting in almost all of the field sampling for this project.
VIII - 45
REFERENCES
Bartels, P., J. Cucherousset, K. Steger, P. Eklöv, L. J. Tranvik, and H. Hillebrand. 2012. Reciprocal subsidies between freshwater and terrestrial ecosystems structure consumer resource dynamics. Ecology 93:1173-1182.
Beamish, F. W. H. 1980. Biology of North American anadromous sea lamprey, Petromyzon
marinus. Canadian Journal of Fisheries and Aquatic Science 37:1924-1943. Bilby, R. E., B. R. Fransen, and P. A. Bisson. 1996. Incorporation of nitrogen and carbon from
spawning coho salmon into trophic system of small streams: evidence from stable isotopes. Canadian Journal of Fisheries and Aquatic Science 53:164-173.
Bode, R.W., M. A. Novak, and L. E. Abele. 1996. Quality assurance work plan for
biological stream monitoring in New York State. NYS Department of Environmental Conservation, Albany, NY. 89 p.
Bolster, W, J. 2006. Opportunities in marine environmental history. Environmental History 11:567–597.
Bottom, D. L., K. K. Jones, C. A. Simenstad, and C. L. Smith. 2009. Reconnecting social and
ecological resilience in salmon ecosystems. Ecology and Society 14:[online]. Brussard, P. F., M. C. Hall, and J. Wright. 1981. Structure and affinities of freshwater sea
lamprey (Petromyzon marinus) populations. Canadian Journal of Fisheries and Aquatic Sciences 38:1708-1714.
Bryan, M. B., D. Zalinski, K. B. Filcek, S. Libants, W. Li, and K. T. Scribner. 2005. Patterns of
invasion and colonization of the sea lamprey (Petromyzon marinus) in North America as revealed by microsatellite genotypes. Molecular Ecology 14:3757-3773.
Caraco, N., J. E. Bauer, J. J. Cole, S. Petsch, and P. Raymond. 2010. Millennial-aged organic
carbon subsidies to a modern river food web. Ecology 91:2385-2393. Cole, J. J., and C. T. Solomon. 2012. Terrestrial support of zebra mussels and the Hudson River
food web: a multi-isotope Bayesian analysis. Limnology and Oceanography 57:1802-1815.
Collette, B. B., and G. Klein-Macphee. 2002. Bigelow and Schroeder’s Fishes of the Gulf of
Maine. Smithsonian Books, Washington D. C.. 3rd edition. Cravotta III, C. A. 2002. Use of stable isotopes of carbon, nitrogen, and sulfur to identify sources
of nitrogen in surface waters in the lower Susquehanna River basin, Pennsylvania. US Geological Survey, Water-supply paper: Denver, CO.
VIII - 46
Denoncourt, C. E., and J. R. Stauffer Jr. 1993. Feeding selectively of the American eel Anguilla rostrata (LeSueur) in the upper Delaware River. American Midland Naturalist 129:301-308.
Fine, J. M., L. A. Vrieze, and P. W. Sorensen. 2004. Evidence that Petromyzontid lampreys
employ a common migratory pheromone that is partially comprised of bile acids. Journal of Chemical Ecology 30:2091-2110.
Finlay, J. C. 2001. Stable-carbon-isotope ratios of river biota: implications for energy flow in
lotic food webs. Ecology 82:1052-1064. Fry, J., G. Xian, S. Jin, J. Dewitz, C. Homer, L. Yang, C. Barnes, N. Herold, and J. Wickham.
2011. Completion of the 2006 National Land Cover Database for the Conterminous United States. Photogrammetric Engineering and Remote Sensing 77:858-864.
Greeley, J. R., and S. C. Bishop. 1933. Fishes of the upper Hudson watershed with an annotated
list, A biological survey of the lower Hudson watershed. New York State Conservation Department, Supplemental to twenty-second annual report: Albany, NY.
Greeley, J. R., and C. W. Greene. 1937. Fishes of the area with an annotated list, A biological
survey of the lower Hudson watershed. New York State Conservation Department, Supplemental to twenty-sixth report annual report: Albany, NY.
Hardisty, M. W. 1961. The growth of larval lampreys. Journal of Animal Ecology 30:357-371. Hardy III, C. 1999. Fish or foul: A history of the Delaware River basin through the perspective of
American shad, 1682 to the present. Pennsylvania History 66:506-534. Hollett, A. 1995. A feasibility study to determine the immediate source of carbon filtered by
Petromyzon marinus ammocoetes from the Root River, Sault Ste. Marie through the use of stable isotope analysis. Senior honors thesis. University of Waterloo, Ontario, Canada.
Holmlund, C. M., and M. Hammer. 1999. Ecosystem services generated by fish populations.
Ecological Economics 29:253-268. Hudson River Almanac. 2005. Highlights of the week. http://www.dec.ny.gov/lands/26113.html,
(accessed October 21 2013) Hudson River Almanac. 2007a. Highlights of the week.
http://www.dec.ny.gov/lands/35374.html, (accessed October 21 2013) Hudson River Almanac. 2007b. Highlights of the week.
http://www.dec.ny.gov/lands/34982.html, (accessed October 21 2013)
Jackson, J. K., A. D. Huryn, D. L. Strayer, D. L. Courtemanch, and D. W. Sweeney. 2005. Atlantic coast rivers of the northeastern United States. pp. 21-71 in: Benke, A. C. and C. E. Cushing, eds. Rivers of North America. Elsevier Academic Press: New York.
Jobling, M. 1981. Temperature tolerance and final preferendum – rapid methods for the
assessment of optimum growth temperatures. Journal of Fish Biology 19:439-455. Levinton, J. S., and J. R. Walman. 2006. The Hudson River Estuary. Cambridge University
Press: New York. Lichter, J., H. Caron, T. S. Pasakarnis, S. L. Rodgers, T. S. Squiers Jr., and C. S. Todd. 2006. The
ecological collapse and partial recovery of a freshwater tidal ecosystem. Northeastern Naturalist 13:153-178.
Limburg, K. E., and J. R. Waldman. 2009. Dramatic declines in North Atlantic diadromous
fishes. BioScience 59:955-965. Limm, M. P., and M. E. Power. 2011. Effect of the western pearlshell mussel Margaritifera
falcata on Pacific lamprey Lampetra tridentata and ecosystem processes. Oikos 120: 1076–1082.
Mallatt, J. 1982. Pumping rates and particle retention efficiencies of the larval lamprey, an
unusual suspension feeder. Biological Bulletin 163:197-210. McClelland, J. W., I. Valiela, and R. H. Michener. 1997. Nitrogen-stable isotope signatures in
estuarine food webs: a record of increasing urbanization in coastal watersheds. Limnology and Oceanography 42:930-937.
McLaughlin, R. L., L. Porto, D. LG. Noakes, J. R. Baylis, L. M. Carl, H. R. Dodd, J. D.
Goldstein, D. B. Hayes, and R. G. Randall. 2006. Effects of low-head barriers on stream fishes: taxonomic affiliations and morphological correlates of sensitive species. Canadian Journal of Fisheries and Aquatic Sciences 63:766-779.
Michener, R. H., and L. Lajtha. 2007. Stable isotope ratios as tracers in marine food webs: an
update. pp. 238-282 in: Michener, R. H. and K. Lajtha, eds. Stable Isotopes in Ecology and Environmental Science. Blackwell Publishing: Massachusetts.
Moore, J. W., and J. M. Mallatt. 1980. Feeding of larval lamprey. Canadian Journal of Fisheries
and Aquatic Science 37:1658-1664. Moore, J. W., and B. X. Semmens. 2008. Incorporating uncertainty and prior information into
stable isotope mixing models. Ecology Letters 11:470-480. Morman, R. H., D. W. Cuddy, and P. C. Rugen. 1980. Factors influencing the distribution of sea
lamprey (Petromyzon marinus) in the Great Lakes. Canadian Journal of Fisheries and Aquatic Sciences 37:1811-1826.
VIII - 48
Morman, R. H. 1987. Relationship of density to growth and metamorphosis of caged larval sea lampreys, Petromyzon marinus Linnaeus, in Michigan streams. Journal of Fish Biology 30:173-181.
Mundahl, N. D., C. Erickson, M. R. Johnston, G. A. Sayeed, and S. Taubel. 2005. Diet, feeding
rate, and assimilation efficiency of American brook lamprey larvae. Environmental Biology of Fishes 72:67-72.
Neeson, T. M., J. F. Koonce, and P. J. Whiting. 2007. Predicting sea lamprey (Petromyzon
marinus) ammocoete habitat using geographic information systems. Journal of Great Lakes Research 33:546-553.
New York State Department of Environmental Conservation. 2007. Normans Kill. Riparian
Corridor Study: Albany, NY. New York State Department of Environmental Conservation. 2009. Standard operating
procedure: biological monitoring of surface waters in New York State. Operating Procedure: Albany, NY.
New York State Department of Environmental Conservation. 2012a.
http://www.dos.ny.gov/communitieswaterfronts/consistency/Habitats/HudsonRiver/Catskill_Creek_FINAL.pdf, (accessed October 19 2013)
New York State Department of Environmental Conservation. 2012b.
http://www.dos.ny.gov/communitieswaterfronts/consistency/Habitats/HudsonRiver/Roeliff_Jansen_Kill_FINAL.pdf, (accessed October 20 2013)
Nislow, K. H., and B. E. Kynard. 2009. The role of anadromous sea lamprey in nutrient and
material transport between marine and freshwater environments. pp. 485-494 in: Haro, A., K. L. Smith, R. A. Rulifson, C. M. Moffitt, R. J. Klauda, M. J. Dadswell, R. A. Cunjak, J. E. Cooper, K. L. Beal and T. S. Avery, eds. Challenges for Diadromous Fishes in a Dynamic Global Environment. American Fisheries Society: Maryland.
Perlmutter, K. A. 1951. An aquarium experiment on the American eel as a predator on larval
lampreys. Copeia 1951:173-174. Peterson, B. J., and B. Fry. 1987. Stable isotopes in ecosystem studies. Annual Review of
Ecology and Systematics 18:293-320. Post, D. M. 2002. Using stable isotopes to estimate trophic position: models, methods, and
assumptions. Ecology 83:703-718. Potter, I. C. 1980. Ecology of larval and metamorphosing lampreys. Canadian Journal and
Reis-Santos, P., S. D. McCormick, and J. M. Wilson. 2008. Ionoregulatory changes during metamorphosis and salinity exposure of juvenile sea lamprey (Petromyzon marinus L.). Journal of Experimental Biology 211:978-988.
Roach, K. A., M. Tobler, and K. O. Winemiller. 2011. Hydrogen sulfide, bacteria, and fish: a
unique, subterranean food chain. Ecology 92:2056-2062. Rounick, J. S., M. J. Winterbourn, and G. L. Lyon. 1982. Differential utilization of allochthonous
and autochthonous inputs by aquatic invertebrates in some New Zealand streams: a stable carbon isotope study. Oikos 39:191-198.
Saunders, R., M. A. Hachey, and C. W. Fay. 2006. Maine’s diadromous fish community: past,
present, and implications for Atlantic salmon recovery. Fisheries 31:537-547. Schmidt, R. E., and S. Cooper. 1996. A catalog of barriers to upstream movement of migratory
fishes in Hudson River tributaries. Report of Hudsonia Limited to the Hudson River Foundation, New York.
Schmidt, R. E., and K. Limburg. 1989. Fishes spawning in non-tidal portions of Hudson River
tributaries. Final report to the Hudson River Foundation, New York, NY. Shirakawa, H., Y. Seiji, and K. Kouchi. 2009. Habitat selection of fluvial lamprey larvae
Lethenteron japonicum change with growth stage. Ecology and Civil Engineering 12: 87–98.
Slade, J. W., J. V. Adams, G. C. Christie, D. W. Cuddy, M. F. Fodale, J. W. Heinrich, H. R.
Quinlan, J. G. Weise, J. W. Weisser, and R. J. Young. 2003. Technique and methods for estimating abundance of larval and metamorphosed sea lampreys in Great Lakes tributaries, 1995 to 2001. Journal of Great Lakes Research 29:137-151.
Smith, C. L. 1985. The Inland Fishes of New York State. New York State Department of
Environmental Conservation: Albany, NY. Stewart, K. W., and B. P. Stark. 2008. Plecoptera. pp 311-384. in: Merritt, R. W., K. W. Cummins
and M. B. Berg, eds. An Introduction to the Aquatic Insects of North America. Kendall Hunt: Iowa.
Sutton, T. M. and S. H. Bowen. 1994. Significance of organic detritus in the diet of larval
lampreys in the Great Lakes basin. Canadian Journal of Fisheries and Aquatic Science 51:2380-2387.
Tieszen, L. L., T. W. Boutton, K. G. Tesdahl, and N. A. Slade. 1983. Fractionation and turnover
of stable carbon isotopes in animal tissues: implications for δ13C analysis of diet. Oecologia 57:32-37.
VIII - 50
United States Geological Survey. 2013. http://nhd.usgs.gov/index.html, (accessed November 16, 2013)
Vander Zanden, M. J., and J. B. Rasmussen. 1999. Consumer δ13C and δ15N and the trophic
position of aquatic consumers. Ecology 80:1395-1404. Voshell Jr. J. R. 2002. A Guide to Common Freshwater Invertebrates of North America.
McDonald and Woodward Publishing Company, Blacksburg, VA. Waldman, J.W. 2006. The diadromous fish fauna of the Hudson River: life histories,
conservation concerns, and research avenues. pp. 171-188 in: Levinton, J. S. and J. W. Waldman, eds. The Hudson River Estuary. Cambridge University Press: New York.
Waltz, R. D., and S. K. Burian. 2008. Ephemeroptera. pp 181-236. in: Merritt, R. W., K. W. Cummins and M. B. Berg, eds. An Introduction to the Aquatic Insects of North America. Kendall Hunt: Iowa.