Representing WAFS Significant Weather (SIGWX) Data in BUFR Version 4.3 November 2013 World Area Forecast Centres World Area Forecast Centres World Area Forecast Centres World Area Forecast Centres (WAFCs) London and Washington (WAFCs) London and Washington (WAFCs) London and Washington (WAFCs) London and Washington
Transcript
Representing WAFS Significant
Weather (SIGWX ) Data in BUFR
Version 4.3
November 2013
World Area Forecast Centres World Area Forecast Centres World Area Forecast Centres World Area Forecast Centres (WAFCs) London and Washington(WAFCs) London and Washington(WAFCs) London and Washington(WAFCs) London and Washington
Representing WAFS Significant Weather (SIGWX) Data in BUFR – Version 4.3 (November 2013) - 2 -
Table of Contents
1. THE BUFR FORMAT 9 1.1 INTRODUCTION 9 1.2 SCOPE OF DOCUMENT 9 1.3 CONCEPTS 10 1.3.1 BUFR TABLES 10 1.3.2 REPRESENTATION 10 1.3.3 STANDARDS 10 1.3.4 OPEN/CLOSED AREAS 11 1.3.5 UNIT CONVERSIONS 11 1.3.6 WMO MESSAGE HEADER ID's 11 2. HEADER REPRESENTATION 12 2.1 MESSAGE HEADER FOR SWH 12 2.2 MESSAGE HEADER FOR SWM 13 3. FEATURES REPRESENTED 14 3.1 GENERAL GUIDANCE AND RECOMMENDED PRACTICES 16 3.2 HANDLING OF WAFS BUFR BULLETINS THAT CONTAIN NO DATA 19 4. JET STREAM REPRESENTATION 20 4.1 FEATURE HEADER 22 4.2 FEATURE DATA 22 5. CAT REPRESENTATION 23 5.1 FEATURE HEADER 23 5.2 FEATURE DATA 24 6. CLOUD REPRESENTATION 24 6.1 FEATURE HEADER 25 6.2 FEATURE DATA 25 7. FRONT REPRESENTATION 26 8. TROP REPRESENTATION 26 8.1 FEATURE HEADER 26 8.2 FEATURE DATA 27 9. VOLCANOES, SANDSTORMS, TROPICAL CYCLONES AND RADIATION REPRESENTATION 27 9.1 FEATURE HEADER 28 9.2 FEATURE DATA 28 10. MEDIUM LEVEL SIGWX (SWM) DATA 28 10.1 GENERAL 29 10.2 SWM CLEAR AIR TURBULENCE (CAT) 30 10.3 SWM VOLCANOES, SANDSTORMS, TROPICAL CYCLONES and RADIATION 30 10.4 SWM TROPOPAURE (TROP) HEIGHT 30 10.5 SWM JET STREAMS 31 10.6 SWM FRONTS 31 10.7 SWM CLOUD, IN-CLOUD ICING AND TURBULENCE 31 10.7.1 FEATURE HEADER 32 10.7.2 FEATURE DATA 32 11. RELEVANT BUFR TABLES 32 12. CONTACT DETAILS 38 ANNEX 1 - SYMOBOLS FOR SIGNIFICANT WEATHER 39
Representing WAFS Significant Weather (SIGWX) Data in BUFR – Version 4.3 (November 2013) - 3 -
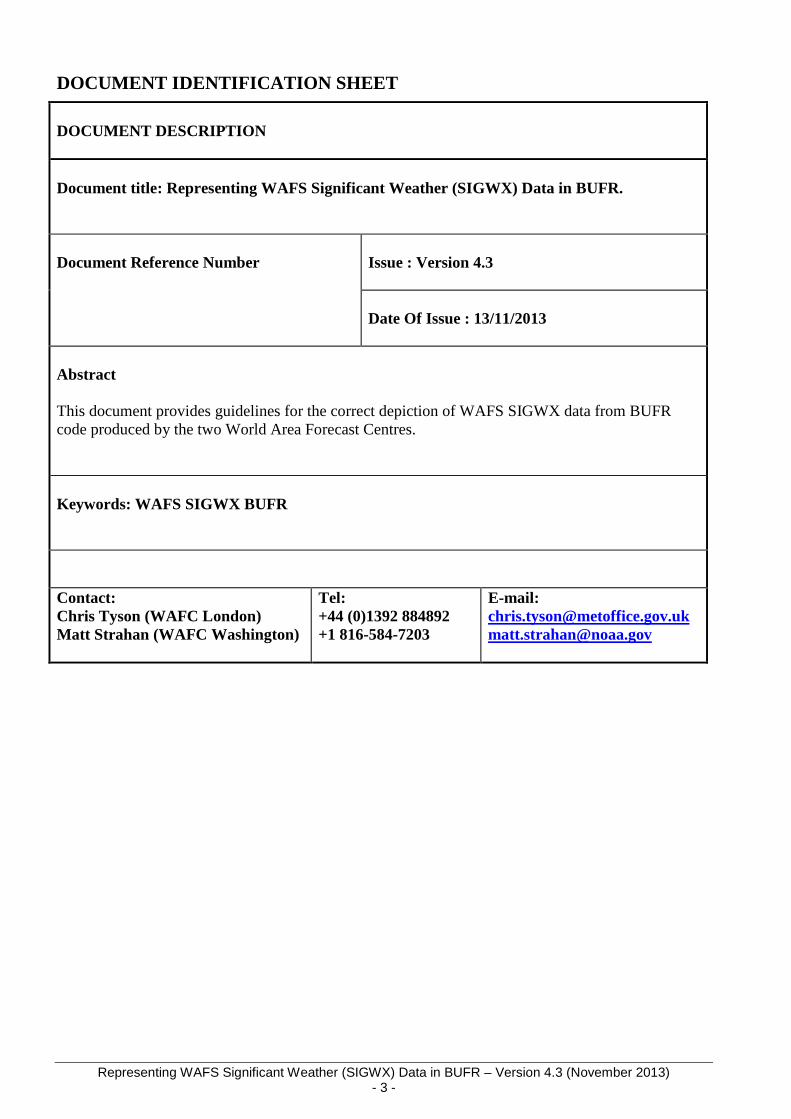
DOCUMENT IDENTIFICATION SHEET
DOCUMENT DESCRIPTION Document title: Representing WAFS Significant Weather (SIGWX) Data in BUFR. Document Reference Number
Issue : Version 4.3
Date Of Issue : 13/11/2013
Abstract This document provides guidelines for the correct depiction of WAFS SIGWX data from BUFR code produced by the two World Area Forecast Centres. Keywords: WAFS SIGWX BUFR Contact: Chris Tyson (WAFC London) Matt Strahan (WAFC Washington)
Representing WAFS Significant Weather (SIGWX) Data in BUFR – Version 4.3 (November 2013) - 4 -
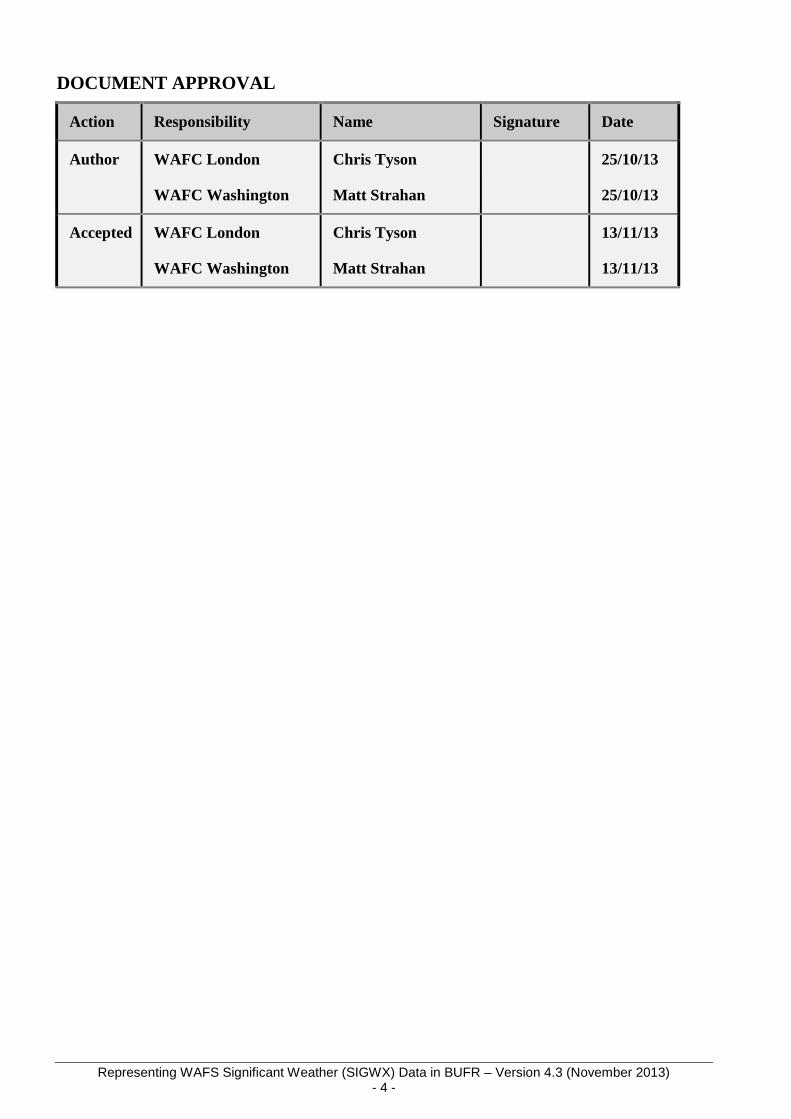
DOCUMENT APPROVAL
Action Responsibility Name Signature Date
Author WAFC London
WAFC Washington
Chris Tyson
Matt Strahan
25/10/13
25/10/13
Accepted WAFC London
WAFC Washington
Chris Tyson
Matt Strahan
13/11/13
13/11/13
Representing WAFS Significant Weather (SIGWX) Data in BUFR – Version 4.3 (November 2013) - 5 -
DOCUMENT CHANGE RECORD ISSUE DATE REASON FOR CHANGE SECTION PAGES
AFFECTED 0.3
Nov. ‘03 First full draft prepared for joint WAFC BUFR liaison meeting (18/12/03)
All
1.0 21/01/04 Final draft incorporating comments from WAFC liaison meeting.
All
1.1 24/03/04 Minor word change in BUFR table 020008, and some typos corrected.
1.1, 3.1, 4 12,13, 15
1.2 30/03/04 Deletion of word “Typically” to highlight the fact that only one set of frontal movement info should be assigned to each front within the BUFR bulletin.
Section 7.2
1.3 15/04/04 Change to the use of figure 12 in BUFR table 011031
Section 10
1.4 14/05/04 Modifications to jet depiction taking into account the display of the vertical height information.
Section 4
1.5 21/05/04 Inclusion of DRAFT guidance on SWM chart production.
New Section 10
2.0 11/10/04 Refinement of text in section 10, a number of additions and improvements to text throughout the document, in particular section 4.
Section 4 & 10. A few minor changes throughout the document.
2.1 01/11/04 Include modifications following Washington review.
Many sections.
2.2 02/11/04 Minor corrections. Section 2.2 2.3 10/11/04 Editorial changes Many sections. 2.4 12/11/04 Editorial changes sections 2.2 and 11 2.5 16/12/04 Guidance about excluding
Himalayan region from Asia South chart.
Section 10.1. New Appendix A.
2.6 22/12/04 21/03/05 09/05/05
Minor changes to text to improve clarity. Additions to text resulting from WAFSOPSG/2 Editorial changes and changes/additions to text. Include comments by Mr CM Shun. Include comments from WAFC Washington
Section 8.1 Section 10.7.2 Section 1.1 Sections 1.1, 1.3.6, 3.1 (new items 6 and 7), 4, 9, and 10.1, (delete) appendix A. Sections 1.2, 1.3.6, 3.1, 7, 10.7.2
2.7 10/05/05 18/05/05
Remove reference to replication factor used in MCLOUD bulletin. Change figure 10 in BUFR table 020008 to red coloured font, and change to explanatory text in section 11.
Section 10.7.1 Section 11
Representing WAFS Significant Weather (SIGWX) Data in BUFR – Version 4.3 (November 2013) - 6 -
Value 6 in descriptor 020008 change to font colour red. Change "MID" to "MEA". Improvements to text and include more information to describe SWM chart areas. New point 8 in section 3.1 Feedback received and incorporated from NCEP
New point 9 in section 3.1 New Annex 1 (extract from Appendix 1 to ICAO Annex 3) New guidance to describe depiction of revised jet depth Figures in BUFR tables 02008 and 020012 highlighted in red font Minor modification to text to include PNG charts New chart displaying revised jet depth format. Incorporate changes suggested by WAFC Washington (editorial and an improvement/clarification on words used). Minor editorials suggested by WAFC Washington
Correction – SWH header example modified for T+24 forecast Revised implementation date for new jet depth format (26 July 2006), plus change to wording in wind symbol/fleche example. Include changes following review by WAFC Washington (Larry Burch). Enhanced guidance to cover new jet depth orientation and new graphic to display tropical cyclone in the southern hemisphere. Explicit guidance to detail correct orientation when drawing fronts, incl guidance on quasi-stationary fronts. Additional text included to enhance description of drawing cloud boundaries. Remove reference to crossing jets – WAFSOPSG Memo No. 11 refers. Also, changes to the numbers of figures. Further change to section 4 to cover correct jet wind fleche depiction. Text deletion, and new rule added.
Section 2.1 Section 4 Sections 4 and 9 Section 7 Section 6 Section 4, and onwards just to the figure numbers. Section 4 Section 4 (deletion), section 7 (new rule)
Representing WAFS Significant Weather (SIGWX) Data in BUFR – Version 4.3 (November 2013) - 7 -
Removal of reference to T4 formatted SIGWX charts Reference to availability of WAFC Washington BUFR data on SADIS and ISCS broadcasts, and withdrawal of reference to NWS FTP server. Reference to operational products on SADIS FTP. Changes to legend box depiction under ICAO Annex 3 Amendment 74 proposals Adoption of flight-level specific jet depth information/depiction ICAO Annex 3 Amendment 74 proposed changes to depiction of surface fronts and intertropical convergence zones (SWH and SWM), and non-CB cloud amount and type (SWM) Update to contact details Removal of reference to Thunderstorms
1.1, 1.3.6, 3.1, and sections 4, 5, 7 and 10 1.2, 1.3.6 1.3.1 3.1 Section 4 1.1 and sections 2, 3, 7 and 10 Section 12 3.1 part 9
4.1 10/12/2007 i) Change to WMO website URL ii) Removal of reference to surface
fronts iii) Change HDL to AHL iv) Changes under Amendment 74 to
Annex 3 v) Deleted obsolete legend box
example vi) Removal of reference to Annex 3
discrepancy related to jet depth vii) Handling of WAFS BUFR
bulletins that contain no data viii) Representation of 80KT
jetstreams in BUFR data ix) Removal of reference to T4 chart x) Inclusion of reference to
sandstorms xi) Editorials to commonly used
SWM and/or SWH data xii) Update to template to depict 16th
Edition practices for “Symbols for Significant Weather”
i) 1.1 ii) 1.1, plus
sections 3, 7 and 10.6.
iii) 1.3.6 iv) Footnote 2, plus
sections 3.1 (part 9), 3.2 and 10 (parts 10.6 and 10.7)
4.2 i) Change of WAFC London authority, from Greg Brock to Chris Tyson, and WAFC
i)
Representing WAFS Significant Weather (SIGWX) Data in BUFR – Version 4.3 (November 2013) - 8 -
Washington authority from Larry Burch to Pat Murphy. Changes made in multiple locations, including email etc.
ii) Change of example SigWx High Chart – complying with new Legend requirements (strictly effective Nov 18th 2010.
iii) Specific examples of New Legends.
iv) Several modifications to sentence structure – largely minor.
v) Changes to more consistently reference tables/figures, and with subsequent re-numbering of same.
4.3 13/11/2013 i) BUFR Edition used in SIGWX
forecasts ii) Revise guidance on placement
of call-out arrows, and the necessity to have algorithms that produce unambiguous indications of intended weather
iii) Include explicit references to the cloud forms included in SWM and SWH forecasts, and hence SWM and SWH BUFR.
iv) Numerous editorial changes (without changing substance of document) including using convention of 'Courier New' font for bulletin IDs.
v) Removal of references to ISCS, and replacement with WIFS as appropriate.
vi) Inclusion of guidance regarding legend and text box entries for charts containing the 'radioactive materials in the atmosphere' symbol; updated references to BUFR with respect to volcano eruption time
vii) Clarified guidance with respect to convention of wind fleches on jetstreams crossing the equator
Representing WAFS Significant Weather (SIGWX) Data in BUFR – Version 4.3 (November 2013) - 9 -
1. THE BUFR FORMAT
1.1. INTRODUCTION BUFR stands for Binary Universal Form for the Representation of meteorological data. It is a standard developed by the World Meteorological Organisation (WMO; see WMO Manual 306 Part B for technical specification, which can be obtained via the WMO web site - http://www.wmo.int/pages/prog/www/WMOCodes/WMO306_vI2/VolumeI.2.html) for the efficient storage of meteorological features in a machine independent form, where all the information to describe the features are contained within the data. This document has been prepared by the World Area Forecast Centres (WAFCs) for the purpose of providing guidance to software developers who have the task of constructing WAFS SIGWX BUFR visualisation software. The document is designed to assist developers in the construction of compliant visualisation software that receives its data input from text files obtained from BUFR decoding software supplied by WAFC London. The primary aim of the visualisation software shoul d be to decode and display WAFS SIGWX data in a format that is identical to the equivalent WAFS PNG SIGWX chart in regard to the depiction of the meteorological pheno mena (cloud type, coverage and associated icing and turbulence for medium level cl oud, volcanoes, tropical cyclones, radiation events, CAT and jet-streams), and largely identical to the PNG product in regard to the display of text boxes (related to areas of c loud, volcanoes, and CAT). It is against this standard that compliances will be measured. In addition, it is recommended that visualisation software can deliver WAFS products to the standards recommended within Annex 3 to the Convention on International Civil Aviation (Meteorological Service for International Air Navigation). In particular, section 4 of Appendix 8 to ICAO Annex 3 provides recommendations related to the presentation of flight documentation. It is strongly recommended that visualisation software can deliver products to these recommended practices. ICAO and WMO have asked WAFC London to implement a software review process that involves assessing the quality of WAFS products produced by different visualisation systems against a list of high level criteria set by the ICAO SADIS Operations Group. Subject to the continuing agreement of the owners of the reviewed software packages, the results from these reviews will be displayed on the WAFC London web site, with the purpose of assisting customers in their software procurement process. The information is currently available from URL: http://www.metoffice.gov.uk/aviation/sadis/software . It should be stressed that this review process is not considered a certification or an endorsement of one product over another, but is simply an objective analysis of the degree of compliance of the software to display WAFS products in a valid manner. By making the list of compliant software packages widely available to States and individual users via ICAO, it is the intention to use the review process as a mechanism to raise the level of software compliances. The WAFCs have produced this document with the intention of circulating it to all interested parties. If additional guidance or advice in regard to any of the items included in this document is required, then users, software manufacturers and State Authorities are invited to contact WAFC London. A consultancy service is available to assist these users. Please contact Chris Tyson for further information: - E-mail: [email protected] Tel: +44(0)1392 884892.
1.2. SCOPE OF DOCUMENT Sections 4 to 9 outline how each feature is depicted on a HIGH level WAFS Significant Weather chart (SWH) is represented in BUFR. HIGH level data covers 25,000 - 63,000 feet (FL250 to FL630). Section 10 outlines how each feature is depicted on MEDIUM level WAFS Significant Weather chart (SWM) is represented in BUFR. Medium level data (SWM) which covers 10,000 - 45,000 feet (FL100 to FL450), and includes additional in-cloud moderate and severe TURBULENCE (TURB) and ICING data.
Representing WAFS Significant Weather (SIGWX) Data in BUFR – Version 4.3 (November 2013) - 10 -
WAFC London and WAFC Washington BUFR encoded SWH and SWM data is available from the SADIS satellite satellite broadcast, the Secure SADIS FTP server, and the WAFS Internet File Service (WIFS). Additions or changes to the way in which features are depicted on the SWH and SWM charts may occur during the next few years. This document will be updated and re-circulated prior to the introduction of these changes. This document outlines the text format used by both the WAFCs to encode and decode HIGH and MEDIUM level SIGWX data in BUFR.
1.3. CONCEPTS To produce a BUFR file, two elements are needed. Namely:
i) a file of raw data; and ii) a set of tables containing descriptors.
When the raw data is encoded, each data value is attached to a descriptor which defines what that data represents. The decoding process reads the BUFR file, looks up the descriptor in the relevant table, and writes out the information in whatever format is needed. It is essential to note that the SIGWX BUFR files c reated by both WAFCs are based upon BUFR Edition 3. Even though BUFR Edition 4 has now formally superseded BUFR Edition 3, there is currently no plan to commence i ssuance of SIGWX forecasts in BUFR Edition 3.
1.3.1. BUFR TABLES The binary BUFR files contain a set of tables’ descriptors and data values. To be able to understand what the values represent, the descriptors need to be decoded from a set of common tables that sit on the local machine. This format means that the BUFR messages are very small and are machine independent. They can be understood and decoded by any BUFR decoder which has the latest tables available. WAFC London and WAFC Washington use an ASCII file to store the raw data. This file is processed to produce a BUFR message. A similar procedure is used to decode BUFR messages into ASCII at the user end.
Examples of this ASCII text format are used throughout this document to explain how SIGWX data is represented in BUFR. The encoder, decoder, and example binary BUFR files, are available on request to WAFC London. Operational, real-time, files are also available from the SADIS FTP Service which is available to all approved SADIS and WIFS users, and manufacturers of commercial WAFS visualisation software.
1.3.2. REPRESENTATION Data held in the BUFR format is completely independent of the way in which the data is depicted on SIGWX charts. Only the information that describes the feature is encoded. For example, a CLOUD area is a list of points with the height of the base and top, the cloud type and cloud amount attributes attached. There is nothing in the BUFR bulletin about how the cloud area should be drawn, or how the attributes are to be displayed. On SIGWX charts, this is shown as a box, sometimes with a call-out arrow pointing to the area – but this depiction is determined by the graphical display program. This document has been produced to provide a standard in this regard. It is recommended that the overall aim of BUFR visualisation, as stated in section 1.1, should be carefully considered.
1.3.3 STANDARDS
Although no information is given in BUFR on how to visually represent the data, rules
Representing WAFS Significant Weather (SIGWX) Data in BUFR – Version 4.3 (November 2013) - 11 -
have been laid down by the International Civil Aviation Organisation (ICAO) and WMO. The ICAO requirements are laid out in Annex 3, Meteorological Service for International Air Navigation in the International Standards and Recommended Practices document. The ICAO documentation specifically relates to such elements as the World Area Forecast System (WAFS), how the forecasts should be prepared, the default chart areas (ICAO areas) that should be available and when the charts should be issued. They also include guidance on how the meteorological features are to be depicted on the charts. Further detailed information about these standards is available from WAFC London. WMO Manual 306 Part B should be the standard used for the BUFR code itself.
1.3.4 OPEN/CLOSED AREAS The boundaries of areas of cloud and CAT are described as being either “open” or “closed”, such that:
i) closed areas are defined as regions that have identical first and last coordinates; and
ii) open areas have different start and end coordinates.
Both open and closed areas are used by the WAFCs to represent cloud and CAT boundaries. When call-out arrows are used to link these open or closed areas to associated text boxes, it is essential that appropriate algorithms are used to ensure that the intended weather forecast/situation is unambiguously presented to the end user - particularly pilots or flight dispatchers - see sections 5 and 6. Areas are encoded with an orientation of the area being to the left of the boundary when drawn in the order of points given, i.e. area boundaries are encoded in an anti-clockwise direction.
1.3.5 UNIT CONVERSIONS On WAFS SIGWX charts, heights are shown in 100s feet (Flight Levels) and speeds in knots. However, in BUFR, these are represented metrically. To convert between imperial and metric measurements, the following conversions should be used:
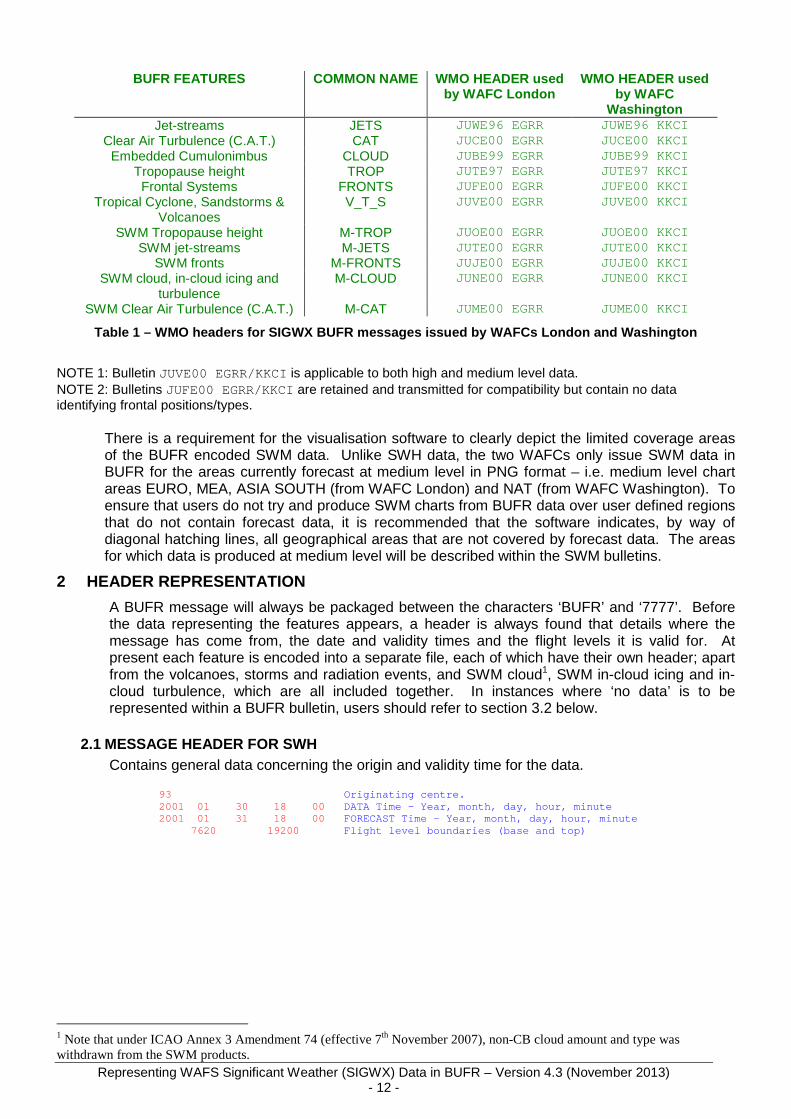
1.3.6 WMO MESSAGE HEADER IDs WAFC London and WAFC Washington produce operational HIGH and MEDIUM level SIGWX BUFR messages issued 4 times a day, and available on the SADIS and satellite broadcasts, the the Secure SADIS FTP service, and WIFS. The messages and the corresponding WMO abbreviated headers (AHL) are shown in Table 1.
Representing WAFS Significant Weather (SIGWX) Data in BUFR – Version 4.3 (November 2013) - 12 -
SWM Clear Air Turbulence (C.A.T.) M-CAT JUME00 EGRR JUME00 KKCI
Table 1 – WMO headers for SIGWX BUFR messages issue d by WAFCs London and Washington
NOTE 1: Bulletin JUVE00 EGRR/KKCI is applicable to both high and medium level data. NOTE 2: Bulletins JUFE00 EGRR/KKCI are retained and transmitted for compatibility but contain no data identifying frontal positions/types.
There is a requirement for the visualisation software to clearly depict the limited coverage areas of the BUFR encoded SWM data. Unlike SWH data, the two WAFCs only issue SWM data in BUFR for the areas currently forecast at medium level in PNG format – i.e. medium level chart areas EURO, MEA, ASIA SOUTH (from WAFC London) and NAT (from WAFC Washington). To ensure that users do not try and produce SWM charts from BUFR data over user defined regions that do not contain forecast data, it is recommended that the software indicates, by way of diagonal hatching lines, all geographical areas that are not covered by forecast data. The areas for which data is produced at medium level will be described within the SWM bulletins.
2 HEADER REPRESENTATION
A BUFR message will always be packaged between the characters ‘BUFR’ and ‘7777’. Before the data representing the features appears, a header is always found that details where the message has come from, the date and validity times and the flight levels it is valid for. At present each feature is encoded into a separate file, each of which have their own header; apart from the volcanoes, storms and radiation events, and SWM cloud1, SWM in-cloud icing and in-cloud turbulence, which are all included together. In instances where ‘no data’ is to be represented within a BUFR bulletin, users should refer to section 3.2 below.
2.1 MESSAGE HEADER FOR SWH Contains general data concerning the origin and validity time for the data.
93 Originating centre. 2001 01 30 18 00 DATA Time - Year, month, day, hour, minute 2001 01 31 18 00 FORECAST Time - Year, month, day, hour, minute 7620 19200 Flight level boundaries (base and top)
1 Note that under ICAO Annex 3 Amendment 74 (effective 7th November 2007), non-CB cloud amount and type was withdrawn from the SWM products.
Representing WAFS Significant Weather (SIGWX) Data in BUFR – Version 4.3 (November 2013) - 13 -
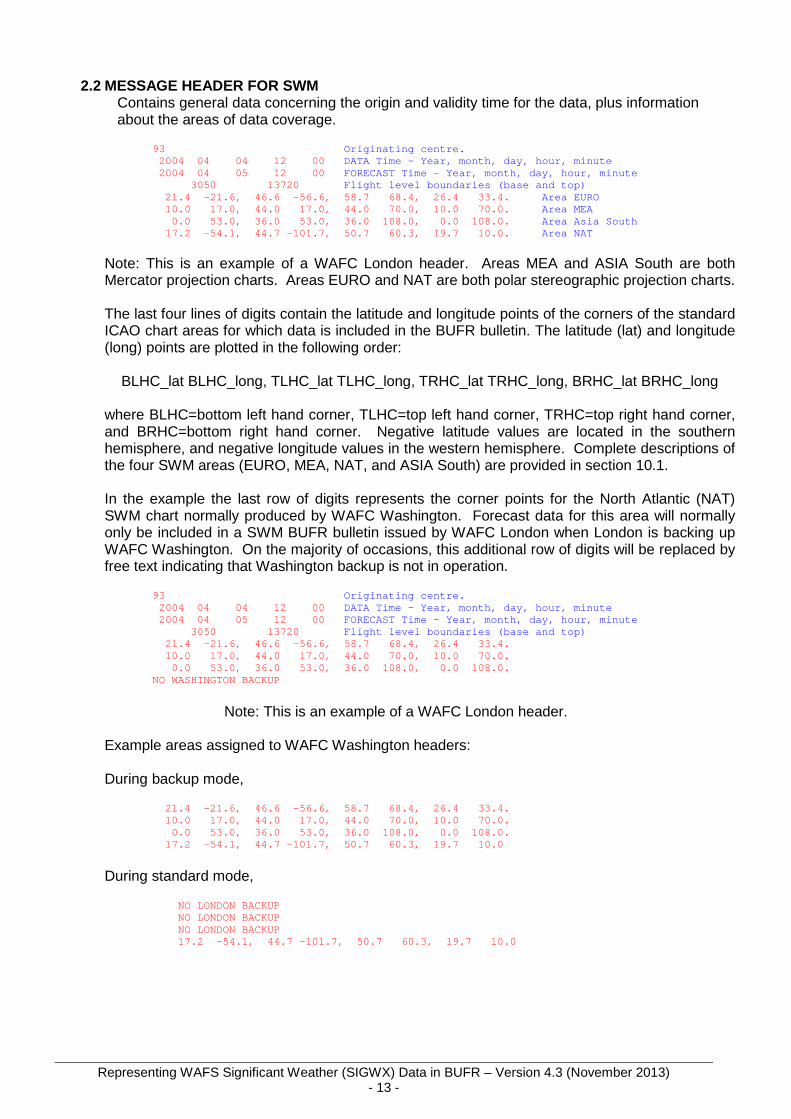
2.2 MESSAGE HEADER FOR SWM
Contains general data concerning the origin and validity time for the data, plus information about the areas of data coverage.
93 Originating centre. 2004 04 04 12 00 DATA Time - Year, month, day, hour, minute 2004 04 05 12 00 FORECAST Time - Year, month, day, hour, minute 3050 13720 Flight level boundaries (base and top) 21.4 -21.6, 46.6 -56.6, 58.7 68.4, 26.4 33.4. Area EURO 10.0 17.0, 44.0 17.0, 44.0 70.0, 10.0 70.0. Area MEA 0.0 53.0, 36.0 53.0, 36.0 108.0, 0.0 1 08.0. Area Asia South 17.2 -54.1, 44.7 -101.7, 50.7 60.3, 19.7 10.0. Area NAT
Note: This is an example of a WAFC London header. Areas MEA and ASIA South are both Mercator projection charts. Areas EURO and NAT are both polar stereographic projection charts.
The last four lines of digits contain the latitude and longitude points of the corners of the standard ICAO chart areas for which data is included in the BUFR bulletin. The latitude (lat) and longitude (long) points are plotted in the following order:
BLHC_lat BLHC_long, TLHC_lat TLHC_long, TRHC_lat TRHC_long, BRHC_lat BRHC_long where BLHC=bottom left hand corner, TLHC=top left hand corner, TRHC=top right hand corner, and BRHC=bottom right hand corner. Negative latitude values are located in the southern hemisphere, and negative longitude values in the western hemisphere. Complete descriptions of the four SWM areas (EURO, MEA, NAT, and ASIA South) are provided in section 10.1. In the example the last row of digits represents the corner points for the North Atlantic (NAT) SWM chart normally produced by WAFC Washington. Forecast data for this area will normally only be included in a SWM BUFR bulletin issued by WAFC London when London is backing up WAFC Washington. On the majority of occasions, this additional row of digits will be replaced by free text indicating that Washington backup is not in operation.
93 Originating centre. 2004 04 04 12 00 DATA Time - Year, month, day, hour, minute 2004 04 05 12 00 FORECAST Time - Year, month, day, hour, minute 3050 13720 Flight level boundaries (base and top) 21.4 -21.6, 46.6 -56.6, 58.7 68.4, 26.4 33.4. 10.0 17.0, 44.0 17.0, 44.0 70.0, 10.0 70.0. 0.0 53.0, 36.0 53.0, 36.0 108.0, 0.0 1 08.0. NO WASHINGTON BACKUP
Note: This is an example of a WAFC London header.
Example areas assigned to WAFC Washington headers:
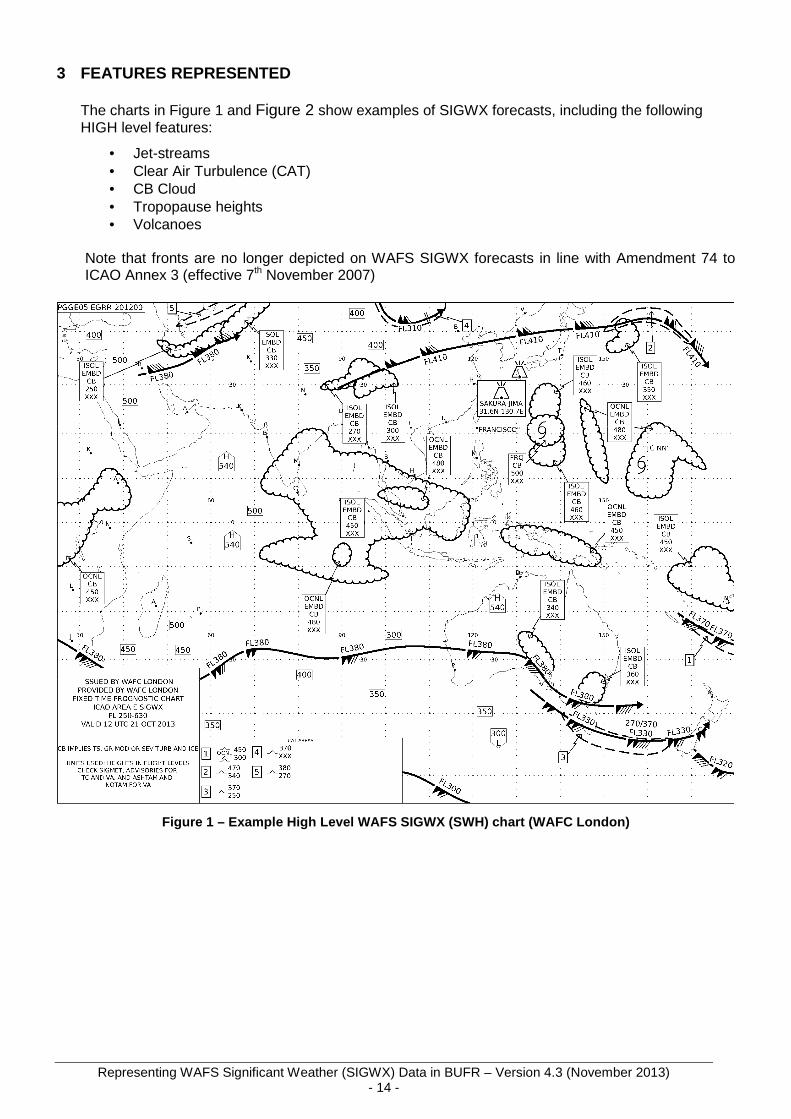
Note that fronts are no longer depicted on WAFS SIGWX forecasts in line with Amendment 74 to ICAO Annex 3 (effective 7th November 2007)
Figure 1 – Example High Level WAFS SIGWX (SWH) char t (WAFC London)
Representing WAFS Significant Weather (SIGWX) Data in BUFR – Version 4.3 (November 2013) - 15 -
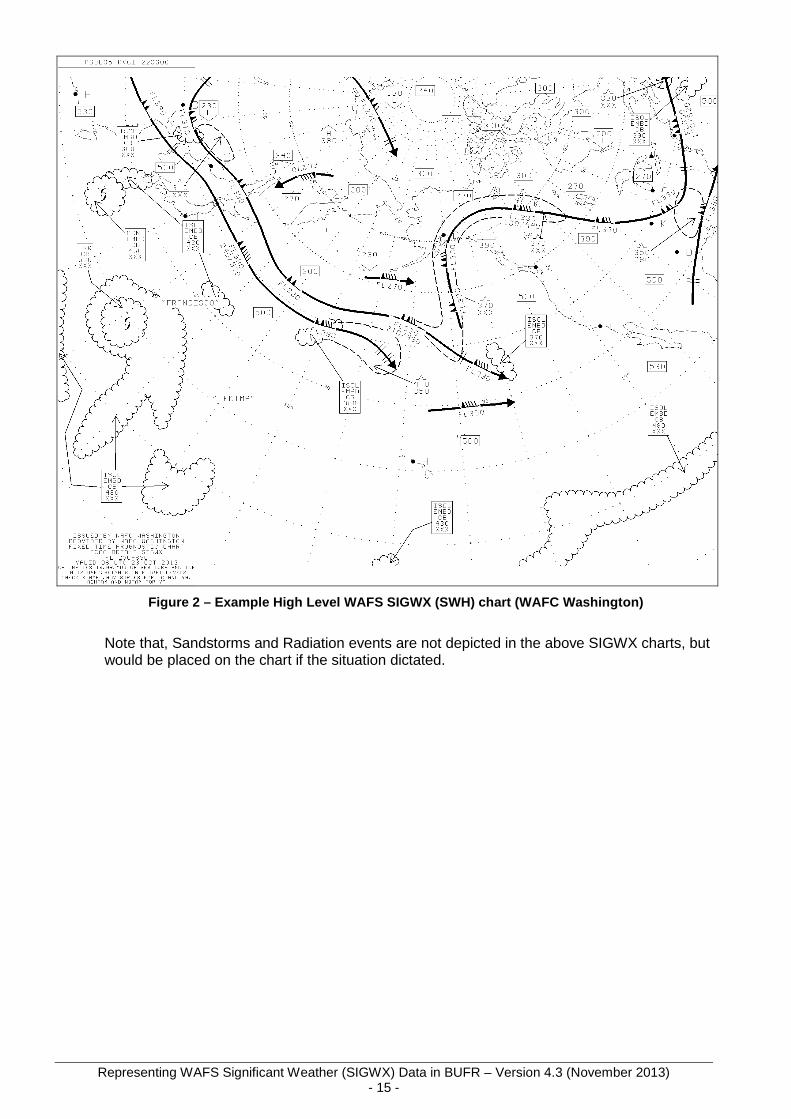
Figure 2 – Example High Level WAFS SIGWX (SWH) char t (WAFC Washington)
Note that, Sandstorms and Radiation events are not depicted in the above SIGWX charts, but would be placed on the chart if the situation dictated.
Representing WAFS Significant Weather (SIGWX) Data in BUFR – Version 4.3 (November 2013) - 16 -
3.1 GENERAL GUIDANCE AND RECOMMENDED PRACTICES
1. The standard against which software will be reviewed is for WAFS SIGWX charts produced from BUFR to be identical to the equivalent PNG SIGWX chart in regard to the depiction of meteorological information, and largely identical to the depiction of non-meteorological features, which include cloud text boxes, volcano legend boxes and CAT boxes. In addition, it is recommended that visualisation software can deliver WAFS products to the standards recommended within Annex 3 to the Convention on International Civil Aviation. In particular, section 4 of Appendix 8 to Annex 3 provides recommendations related to the presentation of flight documentation. It is strongly recommended that visualisation software can deliver products to these recommended practices.
2. With effect from the implementation of Amendment 75 to ICAO Annex 3 (November 18th,2010),
chart legends constructed from BUFR should state the issuing source of the BUFR data used to create the chart (i.e. WAFC London or WAFC Washington) and also the provider of the chart – i.e, the body that has used the source data from the stated WAFC and has generated the chart from that source data for provision to end users. However, if the providing body (or suitably qualified representative of the providing body) modifies any of the meteorological information contained on the chart, the software must automatically remove any reference to the issuing source. The addition of new meteorological information, e.g. interpolated jet speeds, using techniques specified in this document is permissible. The physical positions of cloud text boxes and CAT boxes can be modified without needing to remove reference to the source of the data.
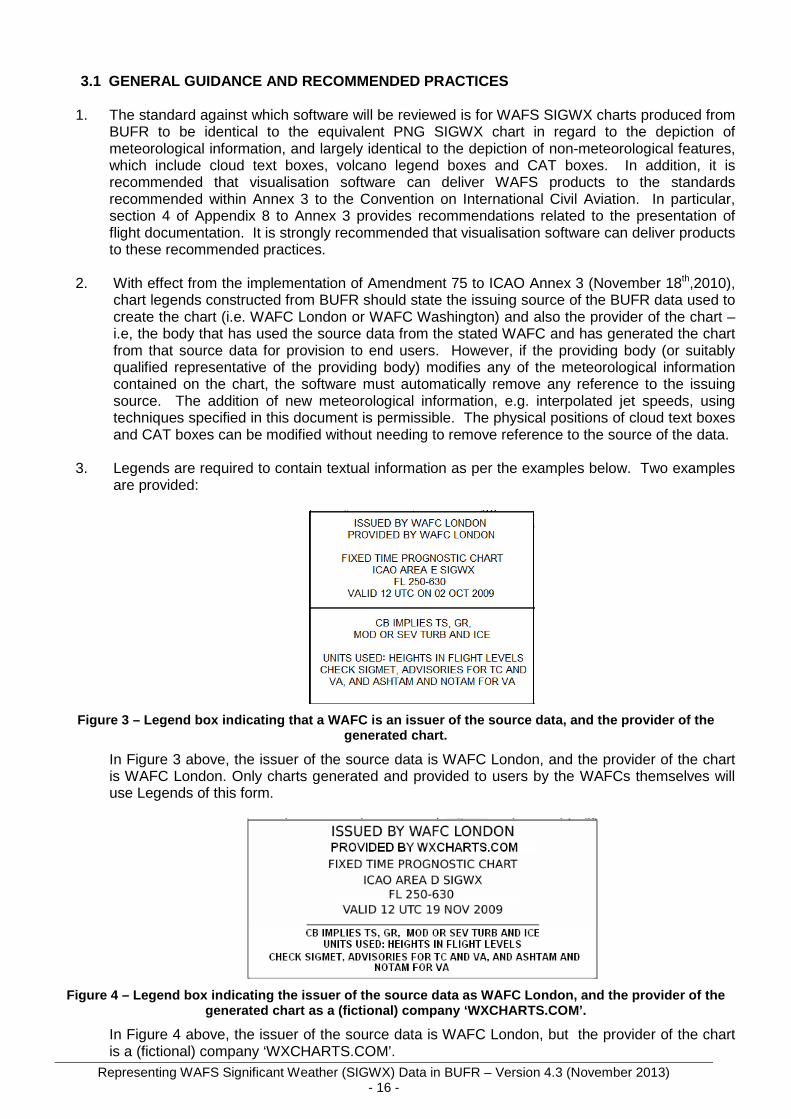
3. Legends are required to contain textual information as per the examples below. Two examples
are provided:
Figure 3 – Legend box indicating that a WAFC is an issuer of the source data, and the provider of the
generated chart.
In Figure 3 above, the issuer of the source data is WAFC London, and the provider of the chart is WAFC London. Only charts generated and provided to users by the WAFCs themselves will use Legends of this form.
Figure 4 – Legend box indicating the issuer of the source data as WAFC London, and the provider of the
generated chart as a (fictional) company ‘WXCHARTS. COM’.
In Figure 4 above, the issuer of the source data is WAFC London, but the provider of the chart is a (fictional) company ‘WXCHARTS.COM’.
Representing WAFS Significant Weather (SIGWX) Data in BUFR – Version 4.3 (November 2013) - 17 -
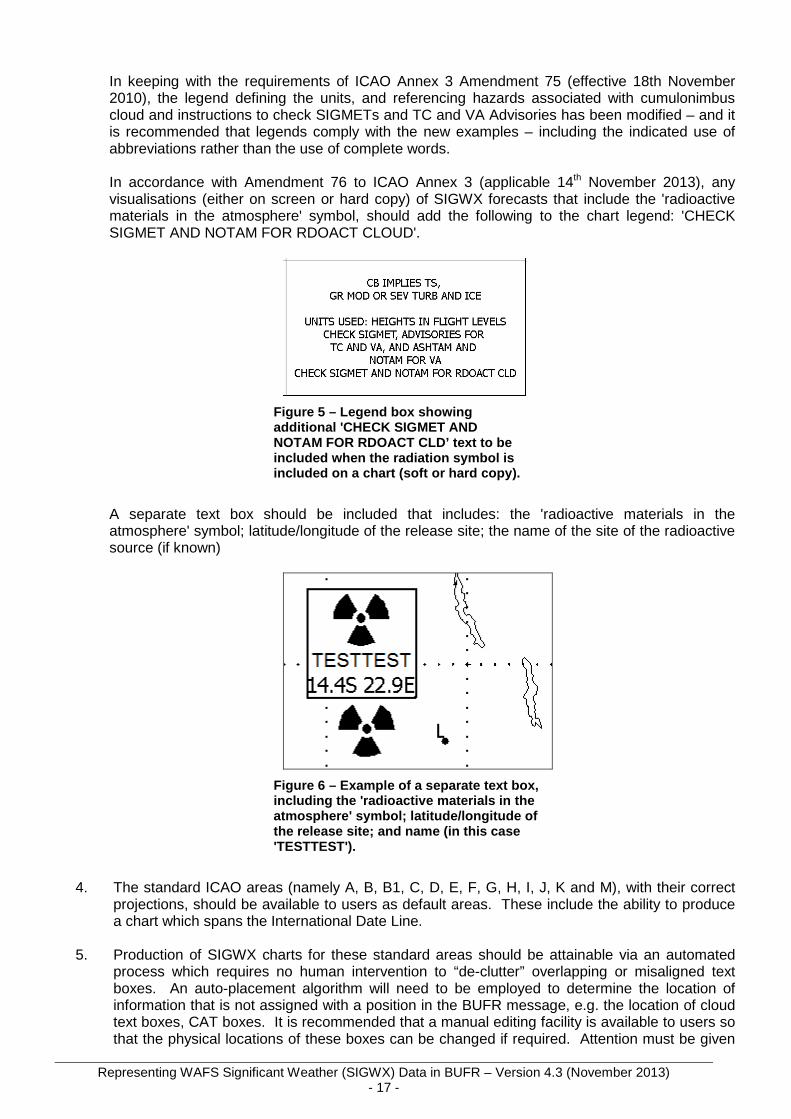
In keeping with the requirements of ICAO Annex 3 Amendment 75 (effective 18th November 2010), the legend defining the units, and referencing hazards associated with cumulonimbus cloud and instructions to check SIGMETs and TC and VA Advisories has been modified – and it is recommended that legends comply with the new examples – including the indicated use of abbreviations rather than the use of complete words. In accordance with Amendment 76 to ICAO Annex 3 (applicable 14th November 2013), any visualisations (either on screen or hard copy) of SIGWX forecasts that include the 'radioactive materials in the atmosphere' symbol, should add the following to the chart legend: 'CHECK SIGMET AND NOTAM FOR RDOACT CLOUD'.
Figure 5 – Legend box showing additional 'CHECK SIGMET AND NOTAM FOR RDOACT CLD’ text to be included when the radiation symbol is included on a chart (soft or hard copy).
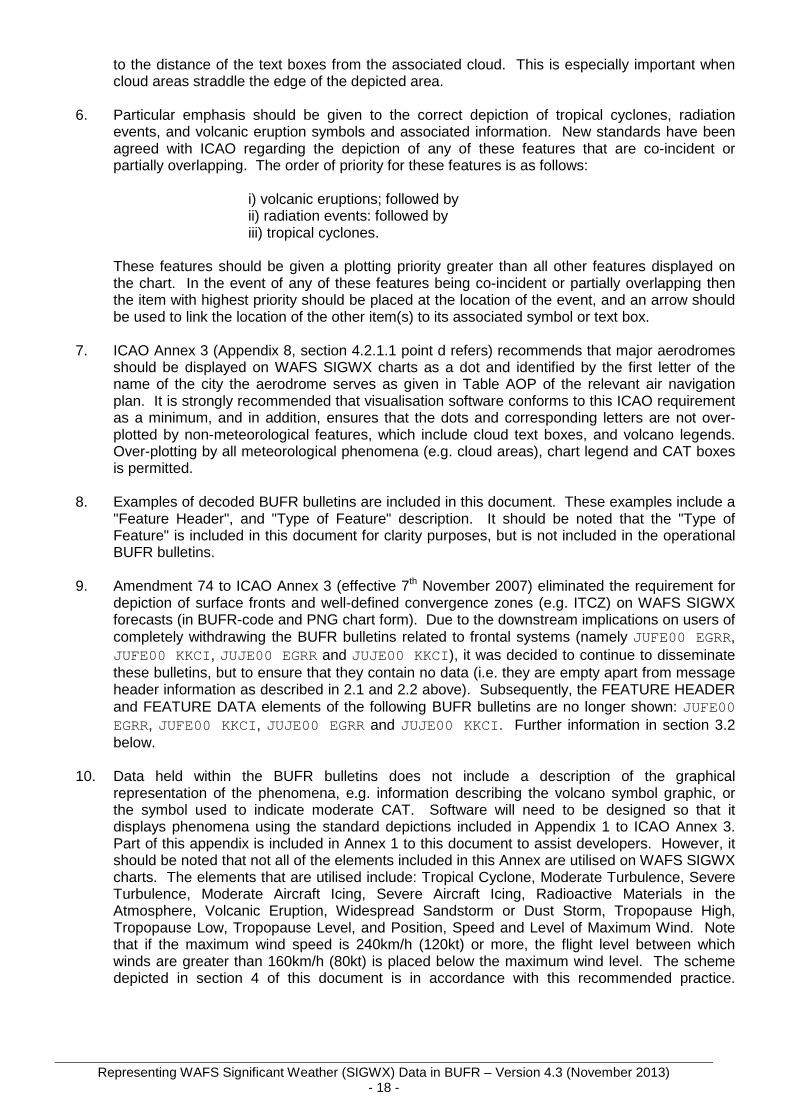
A separate text box should be included that includes: the 'radioactive materials in the atmosphere' symbol; latitude/longitude of the release site; the name of the site of the radioactive source (if known)
Figure 6 – Example of a separate text box, including the 'radioactive materials in the atmosphere' symbol; latitude/longitude of the release site; and name (in this case 'TESTTEST').
4. The standard ICAO areas (namely A, B, B1, C, D, E, F, G, H, I, J, K and M), with their correct
projections, should be available to users as default areas. These include the ability to produce a chart which spans the International Date Line.
5. Production of SIGWX charts for these standard areas should be attainable via an automated
process which requires no human intervention to “de-clutter” overlapping or misaligned text boxes. An auto-placement algorithm will need to be employed to determine the location of information that is not assigned with a position in the BUFR message, e.g. the location of cloud text boxes, CAT boxes. It is recommended that a manual editing facility is available to users so that the physical locations of these boxes can be changed if required. Attention must be given
Representing WAFS Significant Weather (SIGWX) Data in BUFR – Version 4.3 (November 2013) - 18 -
to the distance of the text boxes from the associated cloud. This is especially important when cloud areas straddle the edge of the depicted area.
6. Particular emphasis should be given to the correct depiction of tropical cyclones, radiation
events, and volcanic eruption symbols and associated information. New standards have been agreed with ICAO regarding the depiction of any of these features that are co-incident or partially overlapping. The order of priority for these features is as follows:
i) volcanic eruptions; followed by ii) radiation events: followed by iii) tropical cyclones.
These features should be given a plotting priority greater than all other features displayed on the chart. In the event of any of these features being co-incident or partially overlapping then the item with highest priority should be placed at the location of the event, and an arrow should be used to link the location of the other item(s) to its associated symbol or text box.
7. ICAO Annex 3 (Appendix 8, section 4.2.1.1 point d refers) recommends that major aerodromes
should be displayed on WAFS SIGWX charts as a dot and identified by the first letter of the name of the city the aerodrome serves as given in Table AOP of the relevant air navigation plan. It is strongly recommended that visualisation software conforms to this ICAO requirement as a minimum, and in addition, ensures that the dots and corresponding letters are not over-plotted by non-meteorological features, which include cloud text boxes, and volcano legends. Over-plotting by all meteorological phenomena (e.g. cloud areas), chart legend and CAT boxes is permitted.
8. Examples of decoded BUFR bulletins are included in this document. These examples include a
"Feature Header", and "Type of Feature" description. It should be noted that the "Type of Feature" is included in this document for clarity purposes, but is not included in the operational BUFR bulletins.
9. Amendment 74 to ICAO Annex 3 (effective 7th November 2007) eliminated the requirement for
depiction of surface fronts and well-defined convergence zones (e.g. ITCZ) on WAFS SIGWX forecasts (in BUFR-code and PNG chart form). Due to the downstream implications on users of completely withdrawing the BUFR bulletins related to frontal systems (namely JUFE00 EGRR, JUFE00 KKCI , JUJE00 EGRR and JUJE00 KKCI ), it was decided to continue to disseminate these bulletins, but to ensure that they contain no data (i.e. they are empty apart from message header information as described in 2.1 and 2.2 above). Subsequently, the FEATURE HEADER and FEATURE DATA elements of the following BUFR bulletins are no longer shown: JUFE00 EGRR, JUFE00 KKCI , JUJE00 EGRR and JUJE00 KKCI . Further information in section 3.2 below.
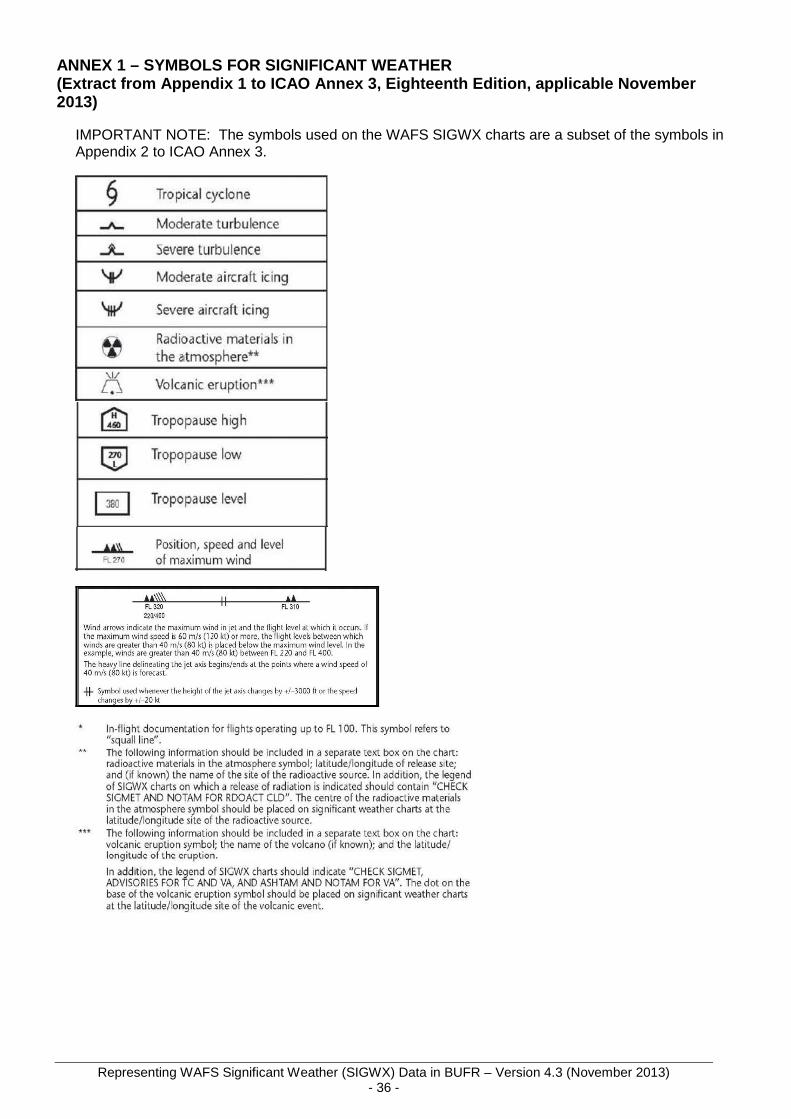
10. Data held within the BUFR bulletins does not include a description of the graphical
representation of the phenomena, e.g. information describing the volcano symbol graphic, or the symbol used to indicate moderate CAT. Software will need to be designed so that it displays phenomena using the standard depictions included in Appendix 1 to ICAO Annex 3. Part of this appendix is included in Annex 1 to this document to assist developers. However, it should be noted that not all of the elements included in this Annex are utilised on WAFS SIGWX charts. The elements that are utilised include: Tropical Cyclone, Moderate Turbulence, Severe Turbulence, Moderate Aircraft Icing, Severe Aircraft Icing, Radioactive Materials in the Atmosphere, Volcanic Eruption, Widespread Sandstorm or Dust Storm, Tropopause High, Tropopause Low, Tropopause Level, and Position, Speed and Level of Maximum Wind. Note that if the maximum wind speed is 240km/h (120kt) or more, the flight level between which winds are greater than 160km/h (80kt) is placed below the maximum wind level. The scheme depicted in section 4 of this document is in accordance with this recommended practice.
Representing WAFS Significant Weather (SIGWX) Data in BUFR – Version 4.3 (November 2013) - 19 -
3.2 HANDLING OF WAFS BUFR BULLETINS THAT CONTAIN NO DAT A
As alluded to in 2 above, under the direction of Amendment 74 to ICAO Annex 3 (effective 7th November 2007), the WAFCs are no longer required to depict surface fronts and well-defined convergence zones (e.g. ITCZ) on WAFS SIGWX forecasts (in BUFR-code and PNG chart form).
Due to the downstream implications on users of completely withdrawing the BUFR bulletins related to frontal systems (namely JUFE00 EGRR, JUFE00 KKCI , JUJE00 EGRR and JUJE00 KKCI), it was decided to continue to disseminate these bulletins, but to ensure that they contain no data (i.e. they are empty apart from message header information as described in 2.1 and 2.2 above).
This practice is in accordance with WMO guidelines related to the encoding of BUFR data, whereby BUFR will simply not encode feature types or feature data when there is no data.
Subsequently, the FEATURE HEADER and FEATURE DATA elements of the following WAFS BUFR bulletins are no longer shown (as routine):
JUFE00 EGRR; JUFE00 KKCI; JUJE00 EGRR; and JUJE00 KKCI.
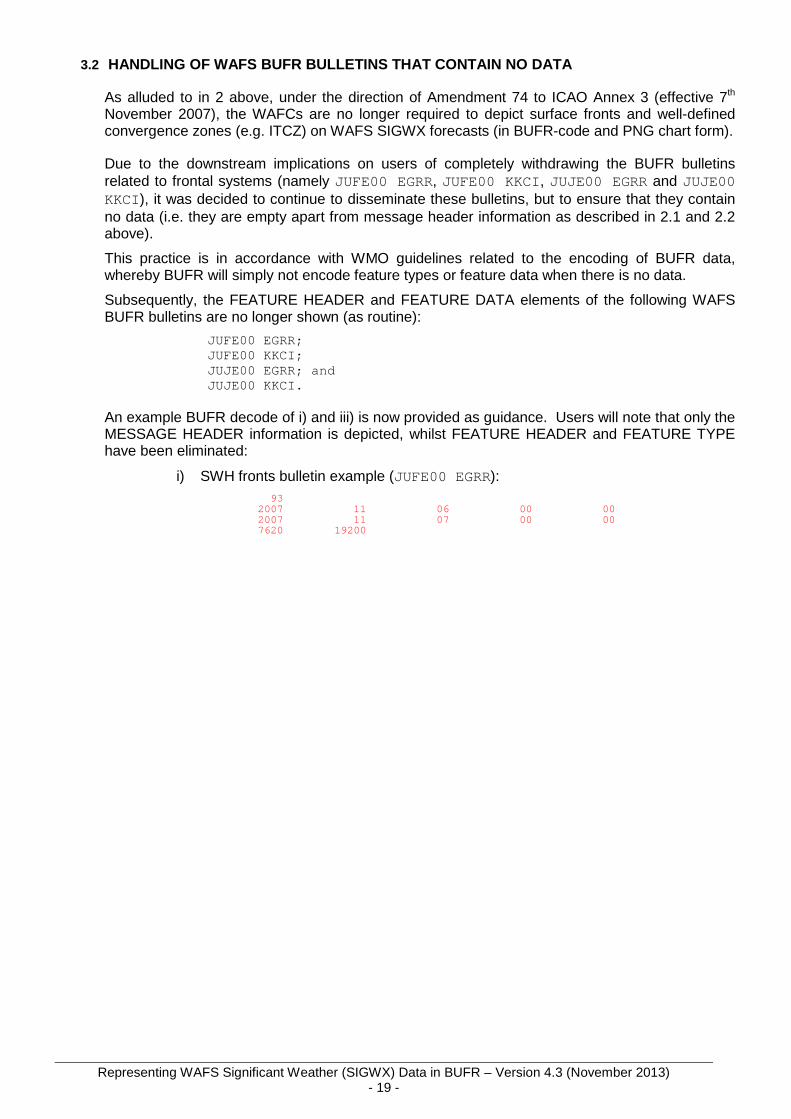
An example BUFR decode of i) and iii) is now provided as guidance. Users will note that only the MESSAGE HEADER information is depicted, whilst FEATURE HEADER and FEATURE TYPE have been eliminated:
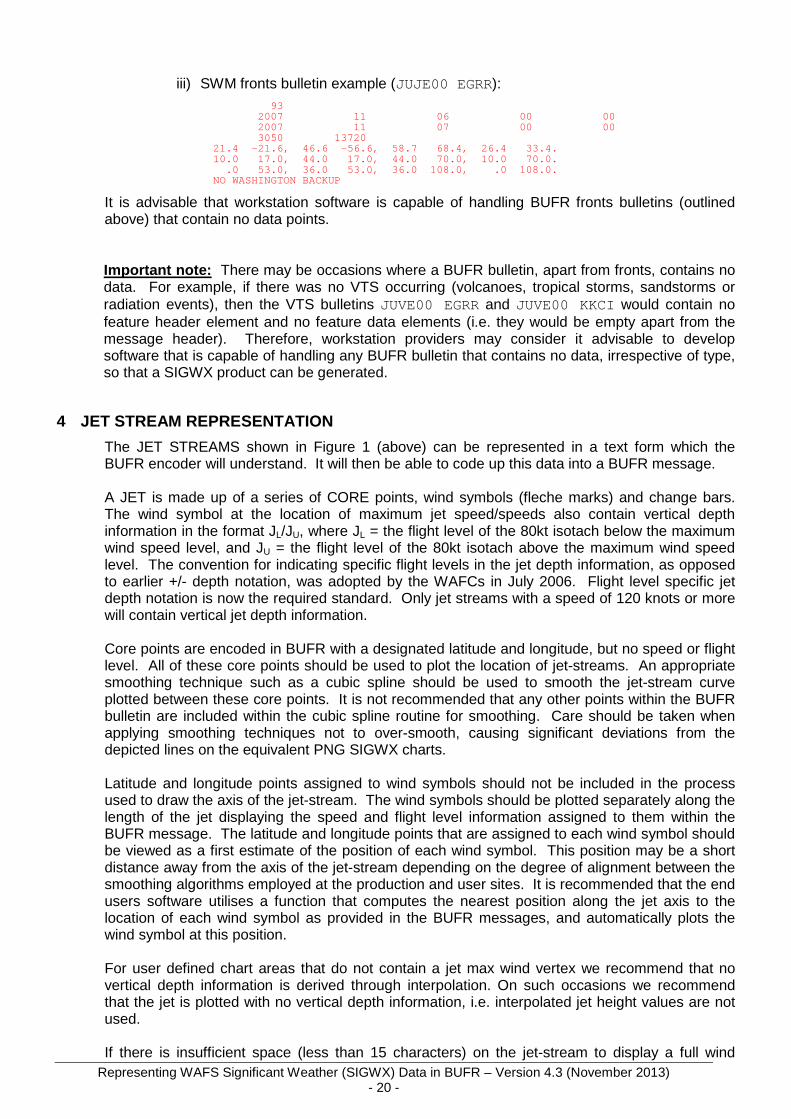
It is advisable that workstation software is capable of handling BUFR fronts bulletins (outlined above) that contain no data points.
Important note: There may be occasions where a BUFR bulletin, apart from fronts, contains no data. For example, if there was no VTS occurring (volcanoes, tropical storms, sandstorms or radiation events), then the VTS bulletins JUVE00 EGRR and JUVE00 KKCI would contain no feature header element and no feature data elements (i.e. they would be empty apart from the message header). Therefore, workstation providers may consider it advisable to develop software that is capable of handling any BUFR bulletin that contains no data, irrespective of type, so that a SIGWX product can be generated.
4 JET STREAM REPRESENTATION
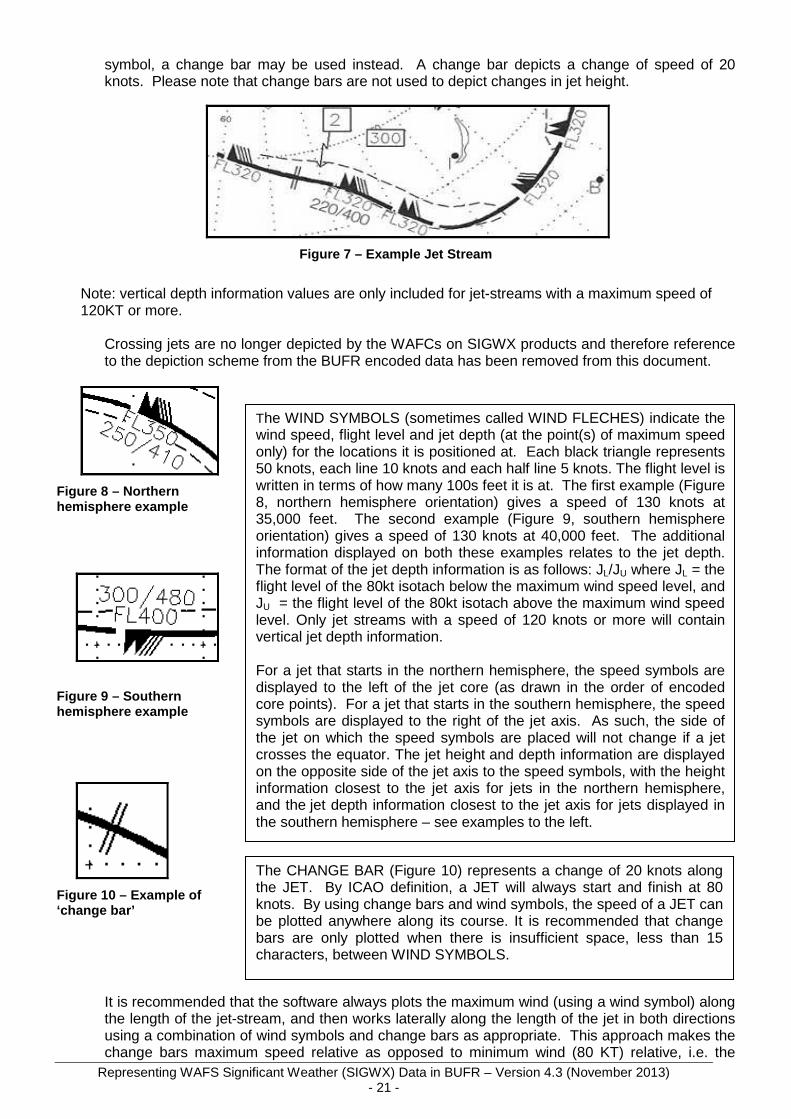
The JET STREAMS shown in Figure 1 (above) can be represented in a text form which the BUFR encoder will understand. It will then be able to code up this data into a BUFR message. A JET is made up of a series of CORE points, wind symbols (fleche marks) and change bars. The wind symbol at the location of maximum jet speed/speeds also contain vertical depth information in the format JL/JU, where JL = the flight level of the 80kt isotach below the maximum wind speed level, and JU = the flight level of the 80kt isotach above the maximum wind speed level. The convention for indicating specific flight levels in the jet depth information, as opposed to earlier +/- depth notation, was adopted by the WAFCs in July 2006. Flight level specific jet depth notation is now the required standard. Only jet streams with a speed of 120 knots or more will contain vertical jet depth information. Core points are encoded in BUFR with a designated latitude and longitude, but no speed or flight level. All of these core points should be used to plot the location of jet-streams. An appropriate smoothing technique such as a cubic spline should be used to smooth the jet-stream curve plotted between these core points. It is not recommended that any other points within the BUFR bulletin are included within the cubic spline routine for smoothing. Care should be taken when applying smoothing techniques not to over-smooth, causing significant deviations from the depicted lines on the equivalent PNG SIGWX charts. Latitude and longitude points assigned to wind symbols should not be included in the process used to draw the axis of the jet-stream. The wind symbols should be plotted separately along the length of the jet displaying the speed and flight level information assigned to them within the BUFR message. The latitude and longitude points that are assigned to each wind symbol should be viewed as a first estimate of the position of each wind symbol. This position may be a short distance away from the axis of the jet-stream depending on the degree of alignment between the smoothing algorithms employed at the production and user sites. It is recommended that the end users software utilises a function that computes the nearest position along the jet axis to the location of each wind symbol as provided in the BUFR messages, and automatically plots the wind symbol at this position. For user defined chart areas that do not contain a jet max wind vertex we recommend that no vertical depth information is derived through interpolation. On such occasions we recommend that the jet is plotted with no vertical depth information, i.e. interpolated jet height values are not used. If there is insufficient space (less than 15 characters) on the jet-stream to display a full wind
Representing WAFS Significant Weather (SIGWX) Data in BUFR – Version 4.3 (November 2013) - 21 -
symbol, a change bar may be used instead. A change bar depicts a change of speed of 20 knots. Please note that change bars are not used to depict changes in jet height.
Figure 7 – Example Jet Stream
Note: vertical depth information values are only included for jet-streams with a maximum speed of 120KT or more.
Crossing jets are no longer depicted by the WAFCs on SIGWX products and therefore reference to the depiction scheme from the BUFR encoded data has been removed from this document.
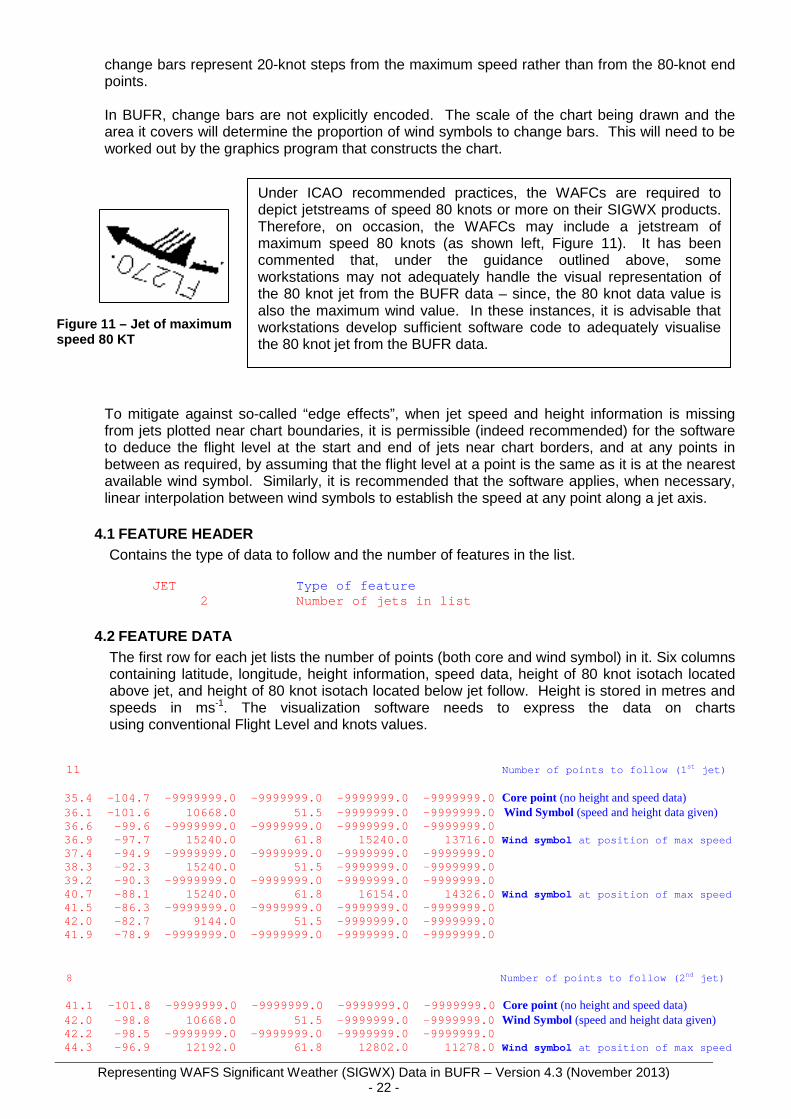
Figure 8 – Northern hemisphere example
Figure 9 – Southern hemisphere example
Figure 10 – Example of ‘change bar’
It is recommended that the software always plots the maximum wind (using a wind symbol) along the length of the jet-stream, and then works laterally along the length of the jet in both directions using a combination of wind symbols and change bars as appropriate. This approach makes the change bars maximum speed relative as opposed to minimum wind (80 KT) relative, i.e. the
The WIND SYMBOLS (sometimes called WIND FLECHES) indicate the wind speed, flight level and jet depth (at the point(s) of maximum speed only) for the locations it is positioned at. Each black triangle represents 50 knots, each line 10 knots and each half line 5 knots. The flight level is written in terms of how many 100s feet it is at. The first example (Figure 8, northern hemisphere orientation) gives a speed of 130 knots at 35,000 feet. The second example (Figure 9, southern hemisphere orientation) gives a speed of 130 knots at 40,000 feet. The additional information displayed on both these examples relates to the jet depth. The format of the jet depth information is as follows: JL/JU where JL = the flight level of the 80kt isotach below the maximum wind speed level, and JU = the flight level of the 80kt isotach above the maximum wind speed level. Only jet streams with a speed of 120 knots or more will contain vertical jet depth information. For a jet that starts in the northern hemisphere, the speed symbols are displayed to the left of the jet core (as drawn in the order of encoded core points). For a jet that starts in the southern hemisphere, the speed symbols are displayed to the right of the jet axis. As such, the side of the jet on which the speed symbols are placed will not change if a jet crosses the equator. The jet height and depth information are displayed on the opposite side of the jet axis to the speed symbols, with the height information closest to the jet axis for jets in the northern hemisphere, and the jet depth information closest to the jet axis for jets displayed in the southern hemisphere – see examples to the left.
The CHANGE BAR (Figure 10) represents a change of 20 knots along the JET. By ICAO definition, a JET will always start and finish at 80 knots. By using change bars and wind symbols, the speed of a JET can be plotted anywhere along its course. It is recommended that change bars are only plotted when there is insufficient space, less than 15 characters, between WIND SYMBOLS.
Representing WAFS Significant Weather (SIGWX) Data in BUFR – Version 4.3 (November 2013) - 22 -
change bars represent 20-knot steps from the maximum speed rather than from the 80-knot end points. In BUFR, change bars are not explicitly encoded. The scale of the chart being drawn and the area it covers will determine the proportion of wind symbols to change bars. This will need to be worked out by the graphics program that constructs the chart.
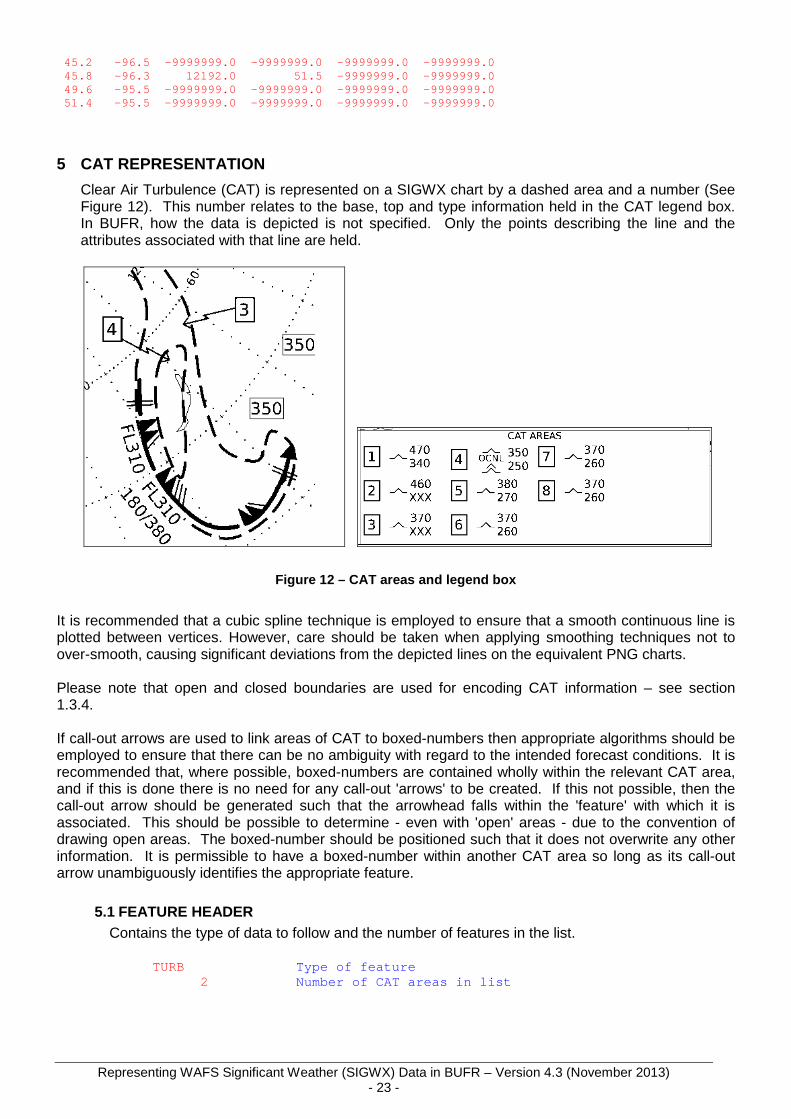
Figure 11 – Jet of maximum speed 80 KT
To mitigate against so-called “edge effects”, when jet speed and height information is missing from jets plotted near chart boundaries, it is permissible (indeed recommended) for the software to deduce the flight level at the start and end of jets near chart borders, and at any points in between as required, by assuming that the flight level at a point is the same as it is at the nearest available wind symbol. Similarly, it is recommended that the software applies, when necessary, linear interpolation between wind symbols to establish the speed at any point along a jet axis.
4.1 FEATURE HEADER Contains the type of data to follow and the number of features in the list.
JET Type of feature 2 Number of jets in list
4.2 FEATURE DATA The first row for each jet lists the number of points (both core and wind symbol) in it. Six columns containing latitude, longitude, height information, speed data, height of 80 knot isotach located above jet, and height of 80 knot isotach located below jet follow. Height is stored in metres and speeds in ms-1. The visualization software needs to express the data on charts using conventional Flight Level and knots values.
11 Number of points to follow (1 st jet) 35.4 -104.7 -9999999.0 -9999999.0 -9999999.0 - 9999999.0 Core point (no height and speed data) 36.1 -101.6 10668.0 51.5 -9999999.0 - 9999999.0 Wind Symbol (speed and height data given) 36.6 -99.6 -9999999.0 -9999999.0 -9999999.0 - 9999999.0 36.9 -97.7 15240.0 61.8 15240.0 13716.0 Wind symbol at position of max speed 37.4 -94.9 -9999999.0 -9999999.0 -9999999.0 -9999999.0 38.3 -92.3 15240.0 51.5 -9999999.0 -9999999.0 39.2 -90.3 -9999999.0 -9999999.0 -9999999.0 -9999999.0 40.7 -88.1 15240.0 61.8 16154.0 14326.0 Wind symbol at position of max speed 41.5 -86.3 -9999999.0 -9999999.0 -9999999.0 -9999999.0 42.0 -82.7 9144.0 51.5 -9999999.0 -9999999.0 41.9 -78.9 -9999999.0 -9999999.0 -9999999.0 -9999999.0
8 Number of points to follow (2 nd jet)
41.1 -101.8 -9999999.0 -9999999.0 -9999999.0 - 9999999.0 Core point (no height and speed data) 42.0 -98.8 10668.0 51.5 -9999999.0 -9999999.0 Wind Symbol (speed and height data given) 42.2 -98.5 -9999999.0 -9999999.0 -9999999.0 -9999999.0 44.3 -96.9 12192.0 61.8 12802.0 11278.0 Wind symbol at position of max speed
Under ICAO recommended practices, the WAFCs are required to depict jetstreams of speed 80 knots or more on their SIGWX products. Therefore, on occasion, the WAFCs may include a jetstream of maximum speed 80 knots (as shown left, Figure 11). It has been commented that, under the guidance outlined above, some workstations may not adequately handle the visual representation of the 80 knot jet from the BUFR data – since, the 80 knot data value is also the maximum wind value. In these instances, it is advisable that workstations develop sufficient software code to adequately visualise the 80 knot jet from the BUFR data.
Representing WAFS Significant Weather (SIGWX) Data in BUFR – Version 4.3 (November 2013) - 23 -
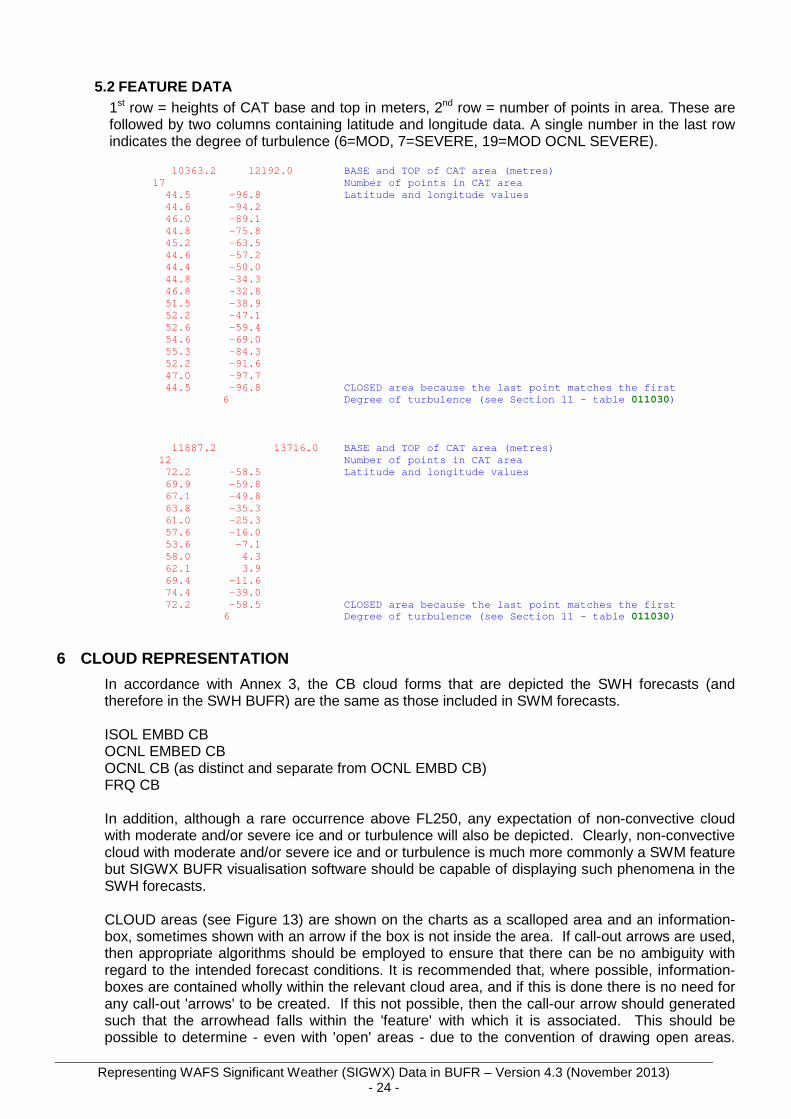
Clear Air Turbulence (CAT) is represented on a SIGWX chart by a dashed area and a number (See Figure 12). This number relates to the base, top and type information held in the CAT legend box. In BUFR, how the data is depicted is not specified. Only the points describing the line and the attributes associated with that line are held.
Figure 12 – CAT areas and legend box
It is recommended that a cubic spline technique is employed to ensure that a smooth continuous line is plotted between vertices. However, care should be taken when applying smoothing techniques not to over-smooth, causing significant deviations from the depicted lines on the equivalent PNG charts. Please note that open and closed boundaries are used for encoding CAT information – see section 1.3.4. If call-out arrows are used to link areas of CAT to boxed-numbers then appropriate algorithms should be employed to ensure that there can be no ambiguity with regard to the intended forecast conditions. It is recommended that, where possible, boxed-numbers are contained wholly within the relevant CAT area, and if this is done there is no need for any call-out 'arrows' to be created. If this not possible, then the call-out arrow should be generated such that the arrowhead falls within the 'feature' with which it is associated. This should be possible to determine - even with 'open' areas - due to the convention of drawing open areas. The boxed-number should be positioned such that it does not overwrite any other information. It is permissible to have a boxed-number within another CAT area so long as its call-out arrow unambiguously identifies the appropriate feature.
5.1 FEATURE HEADER Contains the type of data to follow and the number of features in the list.
TURB Type of feature
2 Number of CAT areas in list
Representing WAFS Significant Weather (SIGWX) Data in BUFR – Version 4.3 (November 2013) - 24 -
5.2 FEATURE DATA
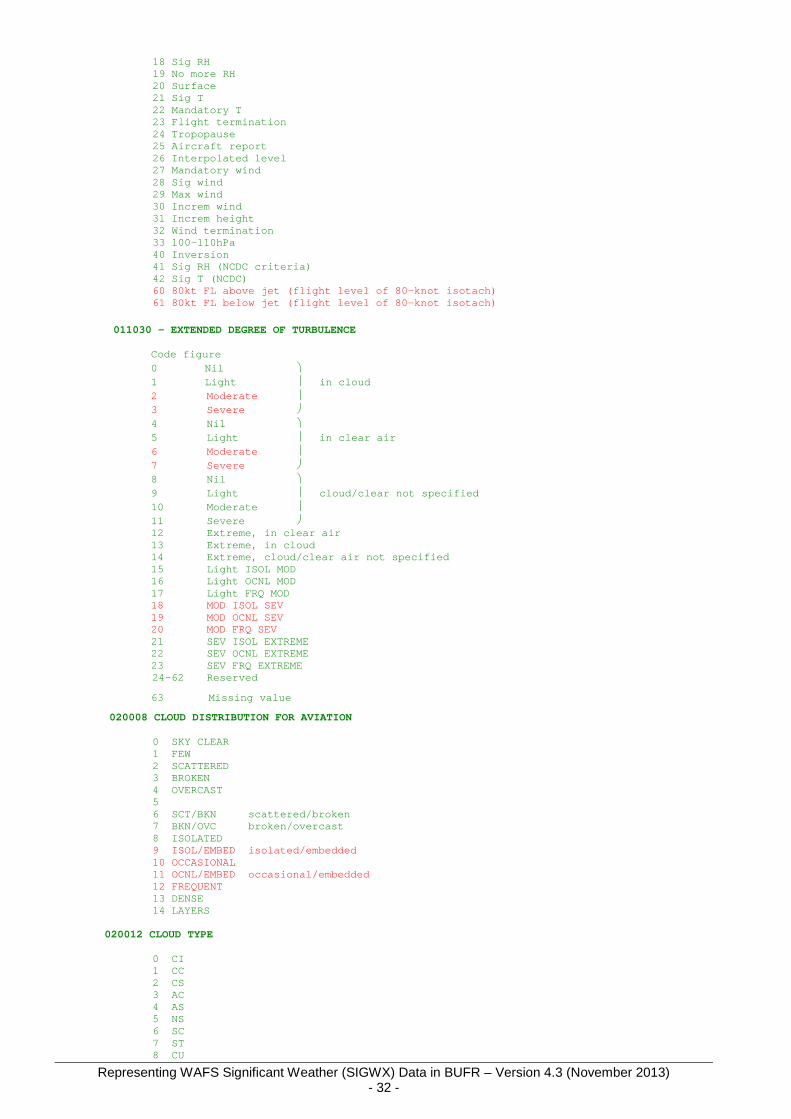
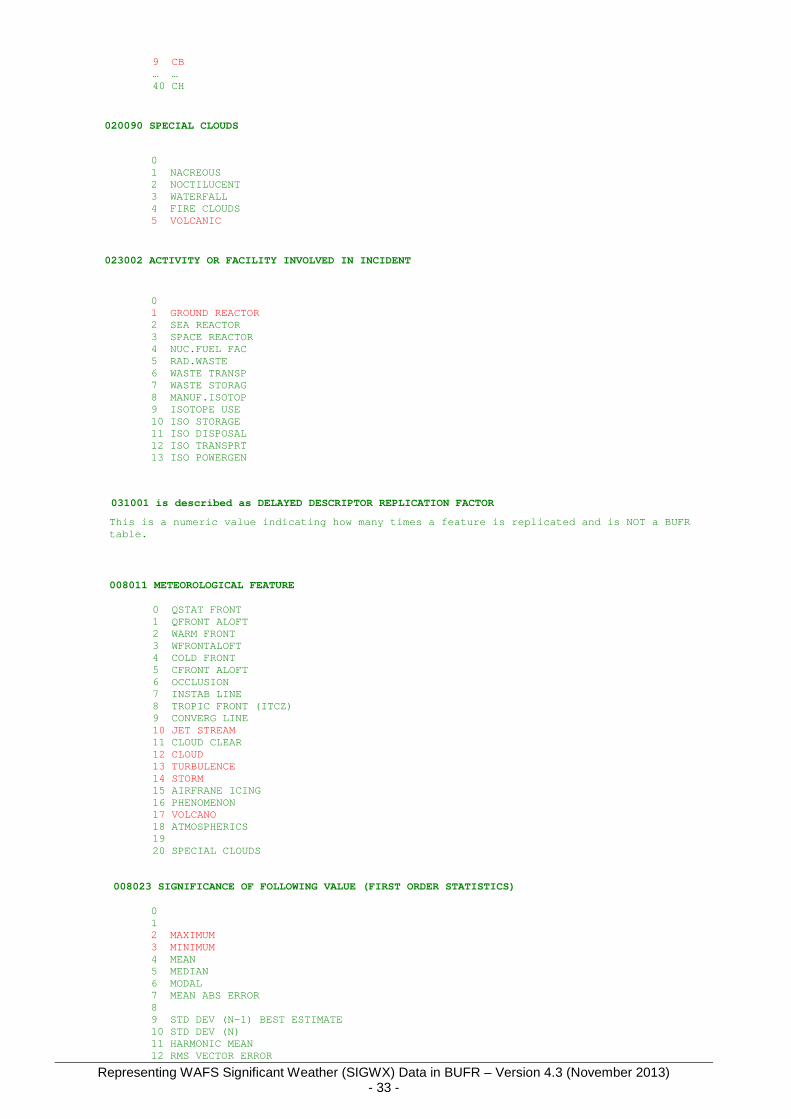
1st row = heights of CAT base and top in meters, 2nd row = number of points in area. These are followed by two columns containing latitude and longitude data. A single number in the last row indicates the degree of turbulence (6=MOD, 7=SEVERE, 19=MOD OCNL SEVERE).
10363.2 12192.0 BASE and TOP of CAT area (metres) 17 Number of points in CAT area 44.5 -96.8 Latitude and longitude values 44.6 -94.2 46.0 -89.1 44.8 -75.8 45.2 -63.5 44.6 -57.2 44.4 -50.0 44.8 -34.3 46.8 -32.8 51.5 -38.9 52.2 -47.1 52.6 -59.4 54.6 -69.0 55.3 -84.3 52.2 -91.6 47.0 -97.7 44.5 -96.8 CLOSED area because the last point matches the firs t 6 Degree of turbulence (see Section 11 - table 011030 ) 11887.2 13716.0 BASE and TOP of CAT area (metres) 12 Number of points in CAT area 72.2 -58.5 Latitude and longitude values 69.9 -59.8 67.1 -49.8 63.8 -35.3 61.0 -25.3 57.6 -16.0 53.6 -7.1 58.0 4.3 62.1 3.9 69.4 -11.6 74.4 -39.0 72.2 -58.5 CLOSED area because the last point matches the fi rst
6 Degree of turbulence (see Section 11 - table 011030 )
6 CLOUD REPRESENTATION
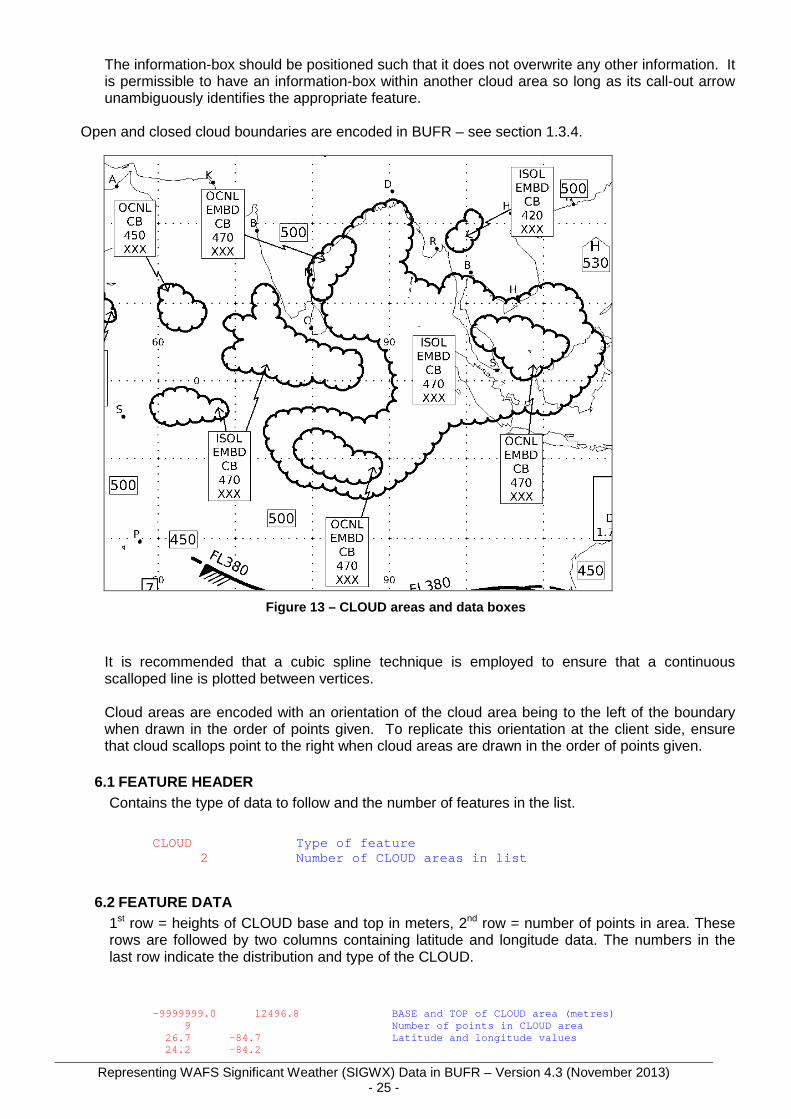
In accordance with Annex 3, the CB cloud forms that are depicted the SWH forecasts (and therefore in the SWH BUFR) are the same as those included in SWM forecasts. ISOL EMBD CB OCNL EMBED CB OCNL CB (as distinct and separate from OCNL EMBD CB) FRQ CB In addition, although a rare occurrence above FL250, any expectation of non-convective cloud with moderate and/or severe ice and or turbulence will also be depicted. Clearly, non-convective cloud with moderate and/or severe ice and or turbulence is much more commonly a SWM feature but SIGWX BUFR visualisation software should be capable of displaying such phenomena in the SWH forecasts. CLOUD areas (see Figure 13) are shown on the charts as a scalloped area and an information-box, sometimes shown with an arrow if the box is not inside the area. If call-out arrows are used, then appropriate algorithms should be employed to ensure that there can be no ambiguity with regard to the intended forecast conditions. It is recommended that, where possible, information-boxes are contained wholly within the relevant cloud area, and if this is done there is no need for any call-out 'arrows' to be created. If this not possible, then the call-our arrow should generated such that the arrowhead falls within the 'feature' with which it is associated. This should be possible to determine - even with 'open' areas - due to the convention of drawing open areas.
Representing WAFS Significant Weather (SIGWX) Data in BUFR – Version 4.3 (November 2013) - 25 -
The information-box should be positioned such that it does not overwrite any other information. It is permissible to have an information-box within another cloud area so long as its call-out arrow unambiguously identifies the appropriate feature.
Open and closed cloud boundaries are encoded in BUFR – see section 1.3.4.
Figure 13 – CLOUD areas and data boxes
It is recommended that a cubic spline technique is employed to ensure that a continuous scalloped line is plotted between vertices. Cloud areas are encoded with an orientation of the cloud area being to the left of the boundary when drawn in the order of points given. To replicate this orientation at the client side, ensure that cloud scallops point to the right when cloud areas are drawn in the order of points given.
6.1 FEATURE HEADER Contains the type of data to follow and the number of features in the list.
CLOUD Type of feature
2 Number of CLOUD areas in list
6.2 FEATURE DATA 1st row = heights of CLOUD base and top in meters, 2nd row = number of points in area. These rows are followed by two columns containing latitude and longitude data. The numbers in the last row indicate the distribution and type of the CLOUD.
-9999999.0 12496.8 BASE and TOP of CLOUD area (metres) 9 Number of points in CLOUD area 26.7 -84.7 Latitude and longitude values 24.2 -84.2
Representing WAFS Significant Weather (SIGWX) Data in BUFR – Version 4.3 (November 2013) - 26 -
CLOUD type (see Section 11 - table 020012 ) -9999999.0 11887.28 BASE and TOP of CLOUD area (metres) 8 Number of points in CLOUD area 28.2 -57.0 Latitude and longitude values 28.4 -49.2 28.0 -41.4 26.0 -30.7 30.7 -25.0 33.4 -33.1 31.7 -52.6 28.2 -57.0 11 9 CLOUD distribution (see Section 11 - table 020008 )
CLOUD type (see Section 11 - table 020012 )
7 FRONT REPRESENTATION, INCLUDING CONVERGENCE ZONES (E.G. ITCZ)
IMPORTANT NOTE: Amendment 74 to ICAO Annex 3 (effective 7th November 2007) eliminated the requirement for depiction of surface fronts and well-defined convergence zones (e.g. ITCZ) on WAFS SIGWX forecasts (in BUFR-code and PNG chart form). Due to the downstream implications on users of completely withdrawing the BUFR bulletins related to frontal systems (namely JUFE00 EGRR, JUFE00 KKCI, JUJE00 EGRR and JUJE00 KKCI ), it was decided to continue to disseminate these bulletins, but to ensure that they contain no data (i.e. they are empty apart from message header information as described in 2.1 and 2.2 above). Subsequently, the FEATURE HEADER and FEATURE DATA elements of the following BUFR bulletins are no longer shown:
SWH frontal bulletins: JUFE00 EGRR and JUFE00 KKCI SWM frontal bulletins: JUJE00 EGRR and JUJE00 KKCI .
8 TROP Representation
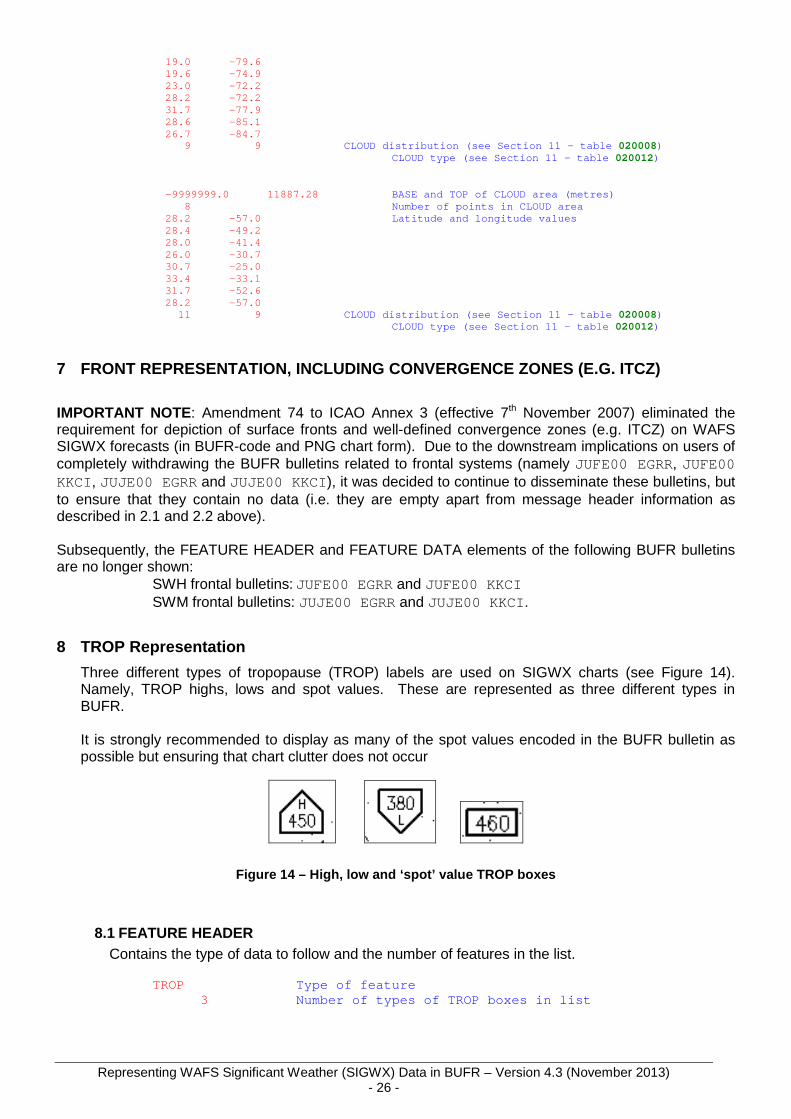
Three different types of tropopause (TROP) labels are used on SIGWX charts (see Figure 14). Namely, TROP highs, lows and spot values. These are represented as three different types in BUFR. It is strongly recommended to display as many of the spot values encoded in the BUFR bulletin as possible but ensuring that chart clutter does not occur
Figure 14 – High, low and ‘spot’ value TROP boxes
8.1 FEATURE HEADER Contains the type of data to follow and the number of features in the list.
TROP Type of feature 3 Number of types of TROP boxes in list
Representing WAFS Significant Weather (SIGWX) Data in BUFR – Version 4.3 (November 2013) - 27 -
8.2 FEATURE DATA
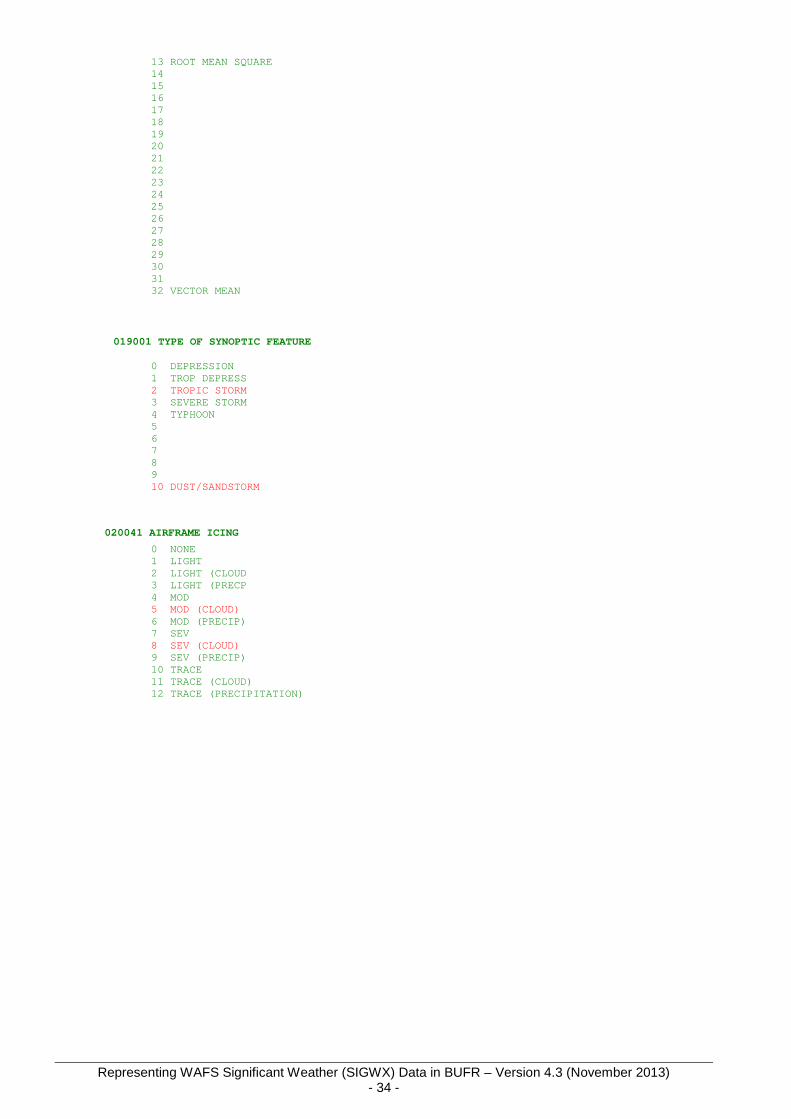
1st row = type of tropopause box (e.g. low, high). 2nd row = number of trop boxes of this type, followed by three columns containing latitude, longitude and height data. Heights are in metres.
-9999999 Type of TROP box (see Section 11 - table 008023 ) 4 Number of TROP boxes of this type 57.6 -116.9 14020.8 Latitude and longitude location and height value 78.7 -78.1 14020.8 73.6 14.1 14020.8 45.4 36.3 14020.8
3 Type of TROP box (see Section 11 - table 008023 ) 1 Number of TROP boxes of this type 55.0 30.0 11582.4 Latitude and longitude location and height value
2 Type of TROP box (see Section 11 - table 008023 ) 1 Number of TROP boxes of this type 31.8 -13.7 13716.0 Latitude and longitude location and height value
9 VOLCANOES, SANDSTORMS, TROPICAL CYCLONES AND RADI ATION REPRESENTATION
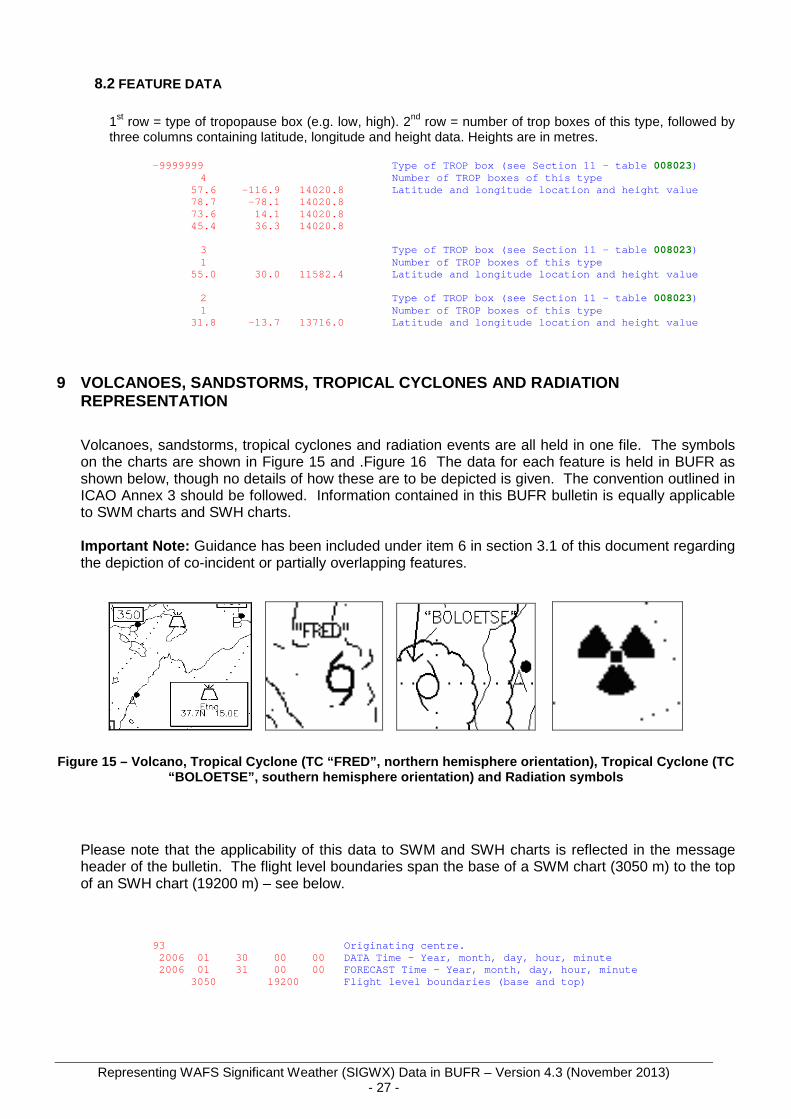
Volcanoes, sandstorms, tropical cyclones and radiation events are all held in one file. The symbols on the charts are shown in Figure 15 and .Figure 16 The data for each feature is held in BUFR as shown below, though no details of how these are to be depicted is given. The convention outlined in ICAO Annex 3 should be followed. Information contained in this BUFR bulletin is equally applicable to SWM charts and SWH charts. Important Note: Guidance has been included under item 6 in section 3.1 of this document regarding the depiction of co-incident or partially overlapping features.
Figure 15 – Volcano, Tropical Cyclone (TC “FRED”, n orthern hemisphere orientation), Tropical Cyclone ( TC “BOLOETSE”, southern hemisphere orientation) and Ra diation symbols
Please note that the applicability of this data to SWM and SWH charts is reflected in the message header of the bulletin. The flight level boundaries span the base of a SWM chart (3050 m) to the top of an SWH chart (19200 m) – see below.
93 Originating centre. 2006 01 30 00 00 DATA Time - Year, month, day, hour, minute 2006 01 31 00 00 FORECAST Time - Year, month, day, hour, minute 3050 19200 Flight level boundaries (base and top)
Representing WAFS Significant Weather (SIGWX) Data in BUFR – Version 4.3 (November 2013) - 28 -
9.1 FEATURE HEADER There are 3 possible headers in this file, each indicating the type of data to follow and the number of features in the list.
STORM Type of feature (covering Tropical Storms (TC) and Sandstorms)
1 Number of STORMS in list VOLCANO Type of feature
1 Number of VOLCANOES in list
RADIATION Type of feature 1 Number of RADIATION incidents in list
9.2 FEATURE DATA Each feature follows a different set of data as shown below.
STORM
FRED Name – ‘UNKNOWN’ used if it’s a sandstorm. 25.0 -78.0 Latitude and Longitude of storm 2 STORM type (see Section 11 - table 019001 )
VOLCANO
ETNA Name of volcano (if known) (- 9999999 used if not known) 37.7 15.0 Latitude and longitude of volcano 2003 11 25 9 30
Eruption time (year, month, day, hour and minute; the date and time of eruption are not routinely inc luded in the BUFR bulletins produced by the two WAFCs. This is b ecause the information is not normally available to the WAFC f orecasters.) As of Amendment 76 to ICAO Annex 3 (Applicable 14 Nove mber 2013) there is no longer a requirement to provide the eruption time on visualisations of SIGWX
RADIATION
SITENAME Location of incident (if known)) (- 9999999 used if not known) 53.2 -24.1 Latitude and longitude of incident -9999999 -9999999 -9999999 -9999999 -999999 9
Incident time (year, month, day, hour and minute; Year and month are not used)
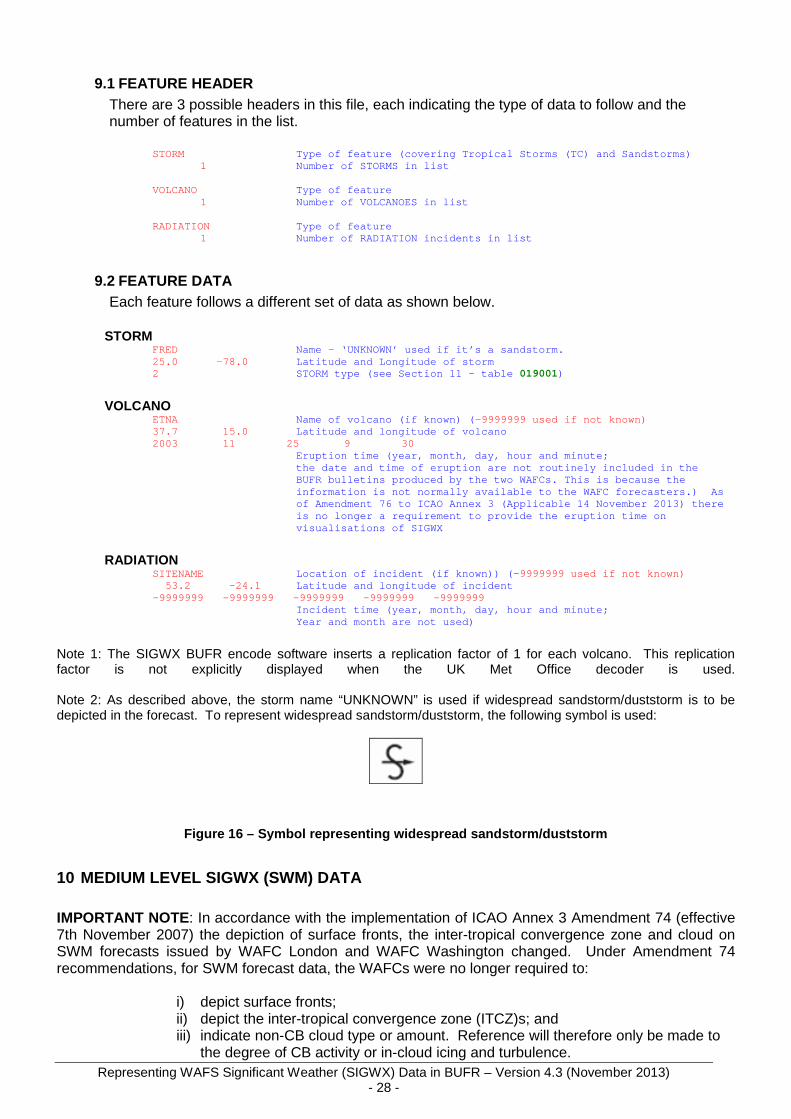
Note 1: The SIGWX BUFR encode software inserts a replication factor of 1 for each volcano. This replication factor is not explicitly displayed when the UK Met Office decoder is used. Note 2: As described above, the storm name “UNKNOWN” is used if widespread sandstorm/duststorm is to be depicted in the forecast. To represent widespread sandstorm/duststorm, the following symbol is used:
Figure 16 – Symbol representing widespread sandstor m/duststorm
10 MEDIUM LEVEL SIGWX (SWM) DATA IMPORTANT NOTE: In accordance with the implementation of ICAO Annex 3 Amendment 74 (effective 7th November 2007) the depiction of surface fronts, the inter-tropical convergence zone and cloud on SWM forecasts issued by WAFC London and WAFC Washington changed. Under Amendment 74 recommendations, for SWM forecast data, the WAFCs were no longer required to:
i) depict surface fronts; ii) depict the inter-tropical convergence zone (ITCZ)s; and iii) indicate non-CB cloud type or amount. Reference will therefore only be made to
the degree of CB activity or in-cloud icing and turbulence.
Representing WAFS Significant Weather (SIGWX) Data in BUFR – Version 4.3 (November 2013) - 29 -
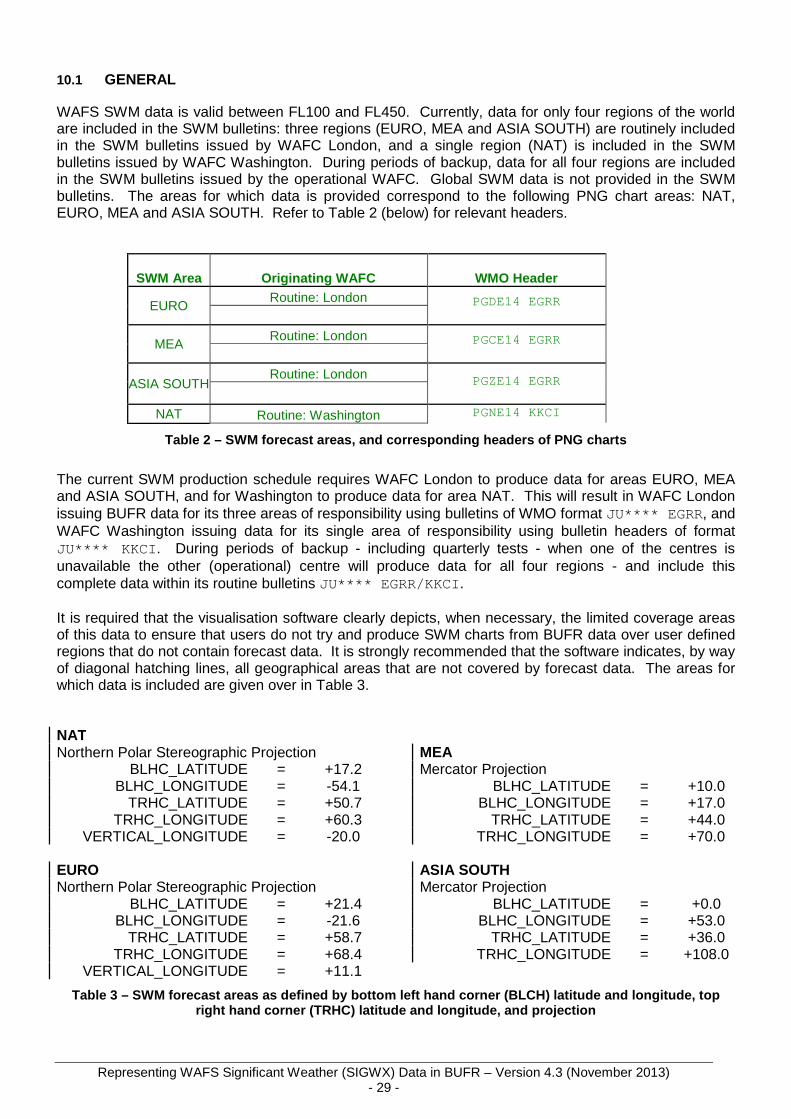
10.1 GENERAL WAFS SWM data is valid between FL100 and FL450. Currently, data for only four regions of the world are included in the SWM bulletins: three regions (EURO, MEA and ASIA SOUTH) are routinely included in the SWM bulletins issued by WAFC London, and a single region (NAT) is included in the SWM bulletins issued by WAFC Washington. During periods of backup, data for all four regions are included in the SWM bulletins issued by the operational WAFC. Global SWM data is not provided in the SWM bulletins. The areas for which data is provided correspond to the following PNG chart areas: NAT, EURO, MEA and ASIA SOUTH. Refer to Table 2 (below) for relevant headers.
SWM Area Originating WAFC WMO Header
EURO Routine: London PGDE14 EGRR
MEA Routine: London PGCE14 EGRR
ASIA SOUTH Routine: London PGZE14 EGRR
NAT Routine: Washington PGNE14 KKCI
Table 2 – SWM forecast areas, and corresponding hea ders of PNG charts
The current SWM production schedule requires WAFC London to produce data for areas EURO, MEA and ASIA SOUTH, and for Washington to produce data for area NAT. This will result in WAFC London issuing BUFR data for its three areas of responsibility using bulletins of WMO format JU**** EGRR , and WAFC Washington issuing data for its single area of responsibility using bulletin headers of format JU**** KKCI . During periods of backup - including quarterly tests - when one of the centres is unavailable the other (operational) centre will produce data for all four regions - and include this complete data within its routine bulletins JU**** EGRR/KKCI . It is required that the visualisation software clearly depicts, when necessary, the limited coverage areas of this data to ensure that users do not try and produce SWM charts from BUFR data over user defined regions that do not contain forecast data. It is strongly recommended that the software indicates, by way of diagonal hatching lines, all geographical areas that are not covered by forecast data. The areas for which data is included are given over in Table 3. NAT Northern Polar Stereographic Projection
BLHC_LATITUDE = +17.2 BLHC_LONGITUDE = -54.1
TRHC_LATITUDE = +50.7 TRHC_LONGITUDE = +60.3
VERTICAL_LONGITUDE = -20.0 EURO Northern Polar Stereographic Projection
BLHC_LATITUDE = +21.4 BLHC_LONGITUDE = -21.6
TRHC_LATITUDE = +58.7 TRHC_LONGITUDE = +68.4
VERTICAL_LONGITUDE = +11.1
MEA Mercator Projection
BLHC_LATITUDE = +10.0 BLHC_LONGITUDE = +17.0
TRHC_LATITUDE = +44.0 TRHC_LONGITUDE = +70.0
ASIA SOUTH Mercator Projection
BLHC_LATITUDE = +0.0 BLHC_LONGITUDE = +53.0
TRHC_LATITUDE = +36.0 TRHC_LONGITUDE = +108.0
Table 3 – SWM forecast areas as defined by bottom l eft hand corner (BLCH) latitude and longitude, top right hand corner (TRHC) latitude and longitude, an d projection
Representing WAFS Significant Weather (SIGWX) Data in BUFR – Version 4.3 (November 2013) - 27 -
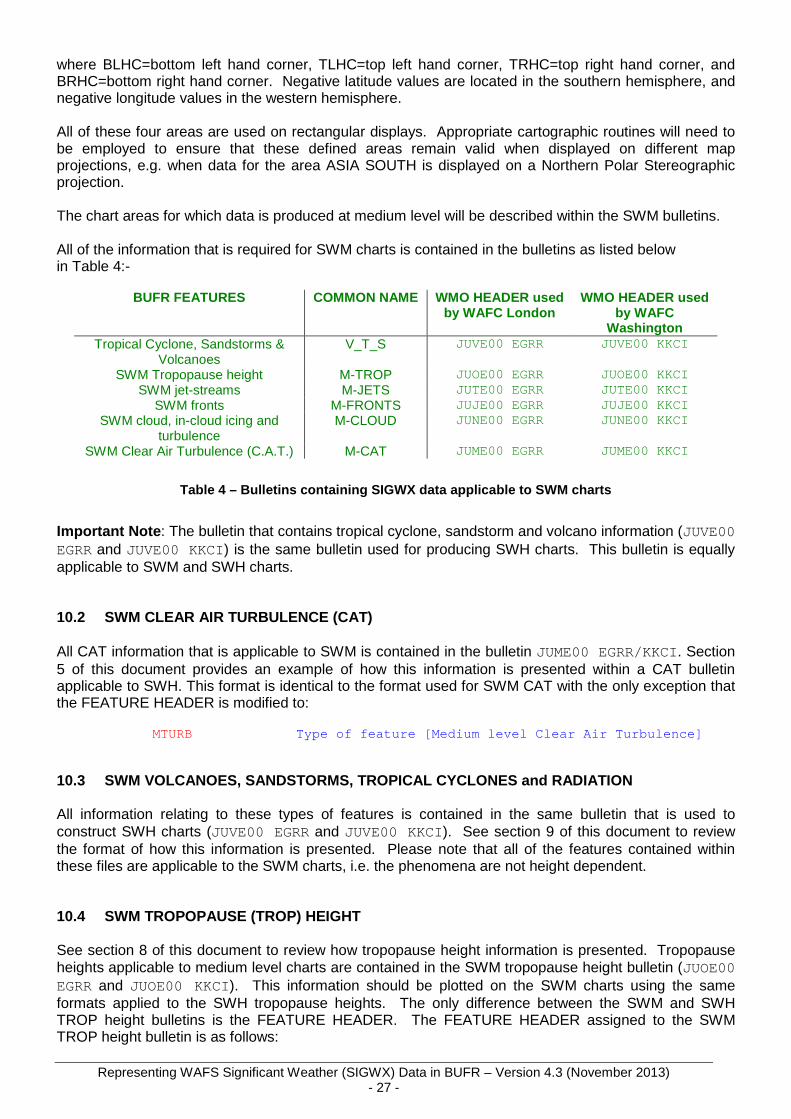
where BLHC=bottom left hand corner, TLHC=top left hand corner, TRHC=top right hand corner, and BRHC=bottom right hand corner. Negative latitude values are located in the southern hemisphere, and negative longitude values in the western hemisphere. All of these four areas are used on rectangular displays. Appropriate cartographic routines will need to be employed to ensure that these defined areas remain valid when displayed on different map projections, e.g. when data for the area ASIA SOUTH is displayed on a Northern Polar Stereographic projection. The chart areas for which data is produced at medium level will be described within the SWM bulletins. All of the information that is required for SWM charts is contained in the bulletins as listed below in Table 4:-
BUFR FEATURES COMMON NAME WMO HEADER used by WAFC London
SWM Clear Air Turbulence (C.A.T.) M-CAT JUME00 EGRR JUME00 KKCI
Table 4 – Bulletins containing SIGWX data applicabl e to SWM charts
Important Note : The bulletin that contains tropical cyclone, sandstorm and volcano information (JUVE00 EGRR and JUVE00 KKCI) is the same bulletin used for producing SWH charts. This bulletin is equally applicable to SWM and SWH charts. 10.2 SWM CLEAR AIR TURBULENCE (CAT) All CAT information that is applicable to SWM is contained in the bulletin JUME00 EGRR/KKCI. Section 5 of this document provides an example of how this information is presented within a CAT bulletin applicable to SWH. This format is identical to the format used for SWM CAT with the only exception that the FEATURE HEADER is modified to:
MTURB Type of feature [Medium level Clear Air Turbulence] 10.3 SWM VOLCANOES, SANDSTORMS, TROPICAL CYCLONES a nd RADIATION All information relating to these types of features is contained in the same bulletin that is used to construct SWH charts (JUVE00 EGRR and JUVE00 KKCI ). See section 9 of this document to review the format of how this information is presented. Please note that all of the features contained within these files are applicable to the SWM charts, i.e. the phenomena are not height dependent. 10.4 SWM TROPOPAUSE (TROP) HEIGHT See section 8 of this document to review how tropopause height information is presented. Tropopause heights applicable to medium level charts are contained in the SWM tropopause height bulletin (JUOE00 EGRR and JUOE00 KKCI ). This information should be plotted on the SWM charts using the same formats applied to the SWH tropopause heights. The only difference between the SWM and SWH TROP height bulletins is the FEATURE HEADER. The FEATURE HEADER assigned to the SWM TROP height bulletin is as follows:
Representing WAFS Significant Weather (SIGWX) Data in BUFR – Version 4.3 (November 2013) - 28 -
MTROP Type of feature [Medium level Tropopause height] 10.5 SWM JET STREAMS See section 4 of this document to review how jet stream information is presented. Jet streams applicable to medium level charts are contained in the SWM jet stream bulletin (JUTE00 EGRR and JUTE00 KKCI ). This information should be plotted on the SWM charts using the same formats applied to the SWH jet-streams. MJET Type of feature (Medium level jet-stream) 10.6 SWM Fronts
IMPORTANT NOTE: As alluded to in Section 7 above, Amendment 74 to ICAO Annex 3 (effective 7th November 2007) eliminated the requirement for depiction of surface fronts and well-defined convergence zones (e.g. ITCZ) on WAFS SIGWX forecasts (in BUFR-code and PNG chart form). Due to the downstream implications on users of completely withdrawing the BUFR bulletins related to frontal systems (namely JUFE00 EGRR, JUFE00 KKCI , JUJE00 EGRR and JUJE00 KKCI ), it was decided to continue to disseminate these bulletins, but to ensure that they contain no data (i.e. they are empty apart from message header information as described in 2.1 and 2.2 above).
Subsequently, the FEATURE HEADER and FEATURE DATA elements of the following BUFR bulletins are no longer shown:
SWH frontal bulletins: JUFE00 EGRR and JUFE00 KKCI SWM frontal bulletins: JUJE00 EGRR and JUJE00 KKCI .
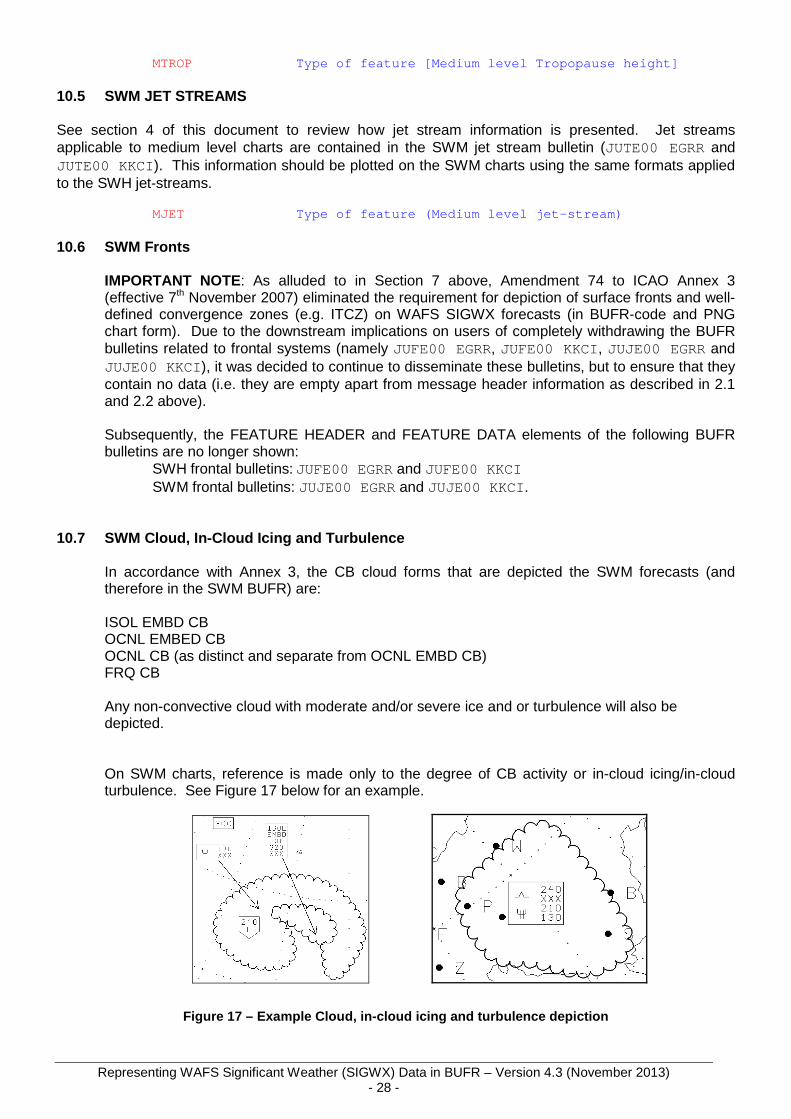
10.7 SWM Cloud, In-Cloud Icing and Turbulence
In accordance with Annex 3, the CB cloud forms that are depicted the SWM forecasts (and therefore in the SWM BUFR) are: ISOL EMBD CB OCNL EMBED CB OCNL CB (as distinct and separate from OCNL EMBD CB) FRQ CB Any non-convective cloud with moderate and/or severe ice and or turbulence will also be depicted. On SWM charts, reference is made only to the degree of CB activity or in-cloud icing/in-cloud turbulence. See Figure 17 below for an example.
Figure 17 – Example Cloud, in-cloud icing and turbu lence depiction
Representing WAFS Significant Weather (SIGWX) Data in BUFR – Version 4.3 (November 2013) - 29 -
10.7.1 FEATURE HEADER
Contains the type of data to follow and the number of features in the list.
MCLOUD Type of feature
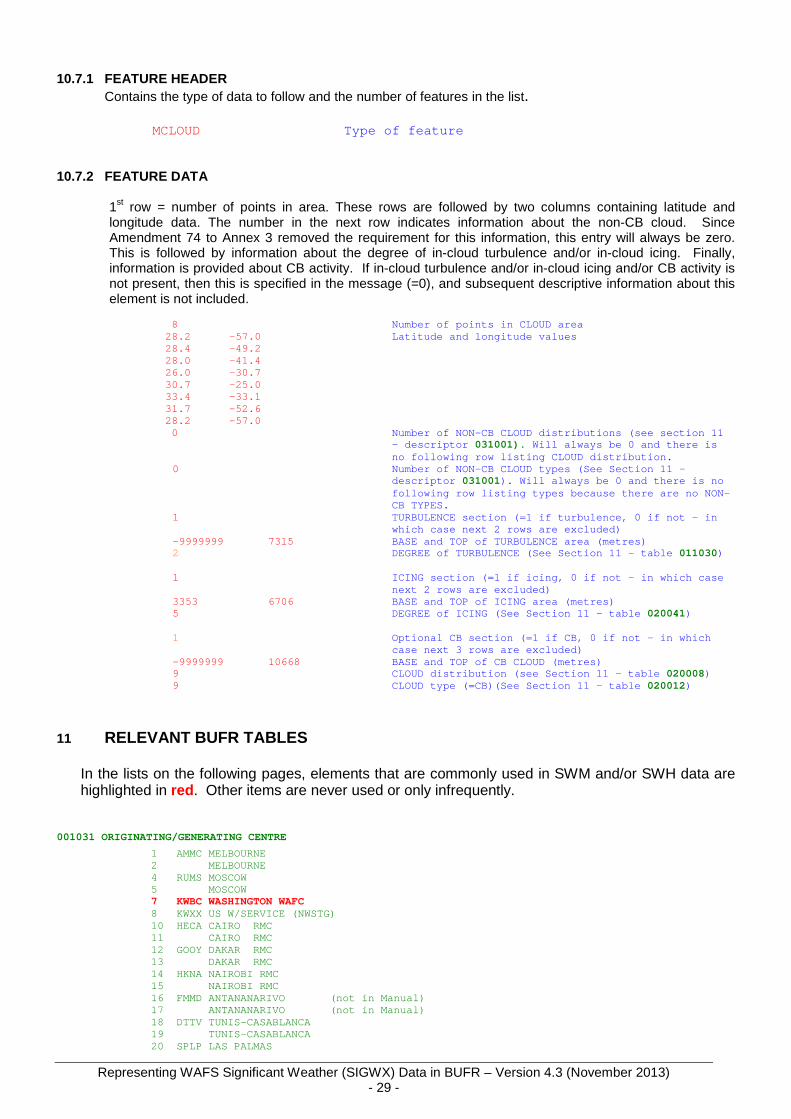
10.7.2 FEATURE DATA
1st row = number of points in area. These rows are followed by two columns containing latitude and longitude data. The number in the next row indicates information about the non-CB cloud. Since Amendment 74 to Annex 3 removed the requirement for this information, this entry will always be zero. This is followed by information about the degree of in-cloud turbulence and/or in-cloud icing. Finally, information is provided about CB activity. If in-cloud turbulence and/or in-cloud icing and/or CB activity is not present, then this is specified in the message (=0), and subsequent descriptive information about this element is not included.
8 Number of points in CLOUD area 28.2 -57.0 Latitude and longitude values 28.4 -49.2 28.0 -41.4 26.0 -30.7 30.7 -25.0 33.4 -33.1 31.7 -52.6 28.2 -57.0 0 Number of NON-CB CLOUD distributions (see section 1 1
- descriptor 031001). Will always be 0 and there is no following row listing CLOUD distribution.
0 Number of NON-CB CLOUD types (See Section 11 – descriptor 031001 ). Will always be 0 and there is no following row listing types because there are no NO N-CB TYPES.
1 TURBULENCE section (=1 if turbulence, 0 if not - in which case next 2 rows are excluded)
-9999999 7315 BASE and TOP of TURBULENCE area (metres) 2 DEGREE of TURBULENCE (See Section 11 – table 011030 ) 1 ICING section (=1 if icing, 0 if not - in whic h case next 2 rows are excluded) 3353 6706 BASE and TOP of ICING area (metres) 5 DEGREE of ICING (See Section 11 – table 020041 ) 1 Optional CB section (=1 if CB, 0 if not - in which
case next 3 rows are excluded) -9999999 10668 BASE and TOP of CB CLOUD (metres) 9 CLOUD distribution (see Section 11 - table 020008 ) 9 CLOUD type (=CB)(See Section 11 – table 020012 )
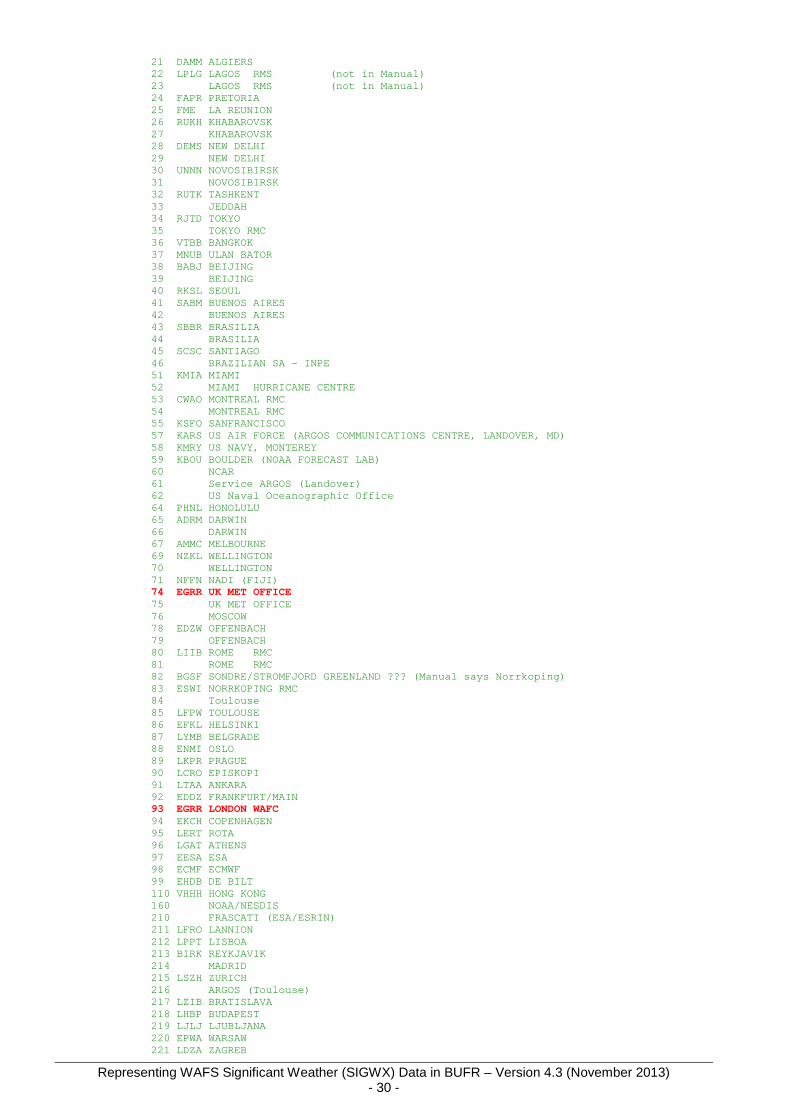
11 RELEVANT BUFR TABLES
In the lists on the following pages, elements that are commonly used in SWM and/or SWH data are highlighted in red . Other items are never used or only infrequently.
Representing WAFS Significant Weather (SIGWX) Data in BUFR – Version 4.3 (November 2013) - 30 -
21 DAMM ALGIERS 22 LPLG LAGOS RMS (not in Manual) 23 LAGOS RMS (not in Manual) 24 FAPR PRETORIA 25 FME LA REUNION 26 RUKH KHABAROVSK 27 KHABAROVSK 28 DEMS NEW DELHI 29 NEW DELHI 30 UNNN NOVOSIBIRSK 31 NOVOSIBIRSK 32 RUTK TASHKENT 33 JEDDAH 34 RJTD TOKYO 35 TOKYO RMC 36 VTBB BANGKOK 37 MNUB ULAN BATOR 38 BABJ BEIJING 39 BEIJING 40 RKSL SEOUL 41 SABM BUENOS AIRES 42 BUENOS AIRES 43 SBBR BRASILIA 44 BRASILIA 45 SCSC SANTIAGO 46 BRAZILIAN SA - INPE 51 KMIA MIAMI 52 MIAMI HURRICANE CENTRE 53 CWAO MONTREAL RMC 54 MONTREAL RMC 55 KSFO SANFRANCISCO 57 KARS US AIR FORCE (ARGOS COMMUNICATIONS CENTRE, LANDOVER, MD) 58 KMRY US NAVY, MONTEREY 59 KBOU BOULDER (NOAA FORECAST LAB) 60 NCAR 61 Service ARGOS (Landover) 62 US Naval Oceanographic Office 64 PHNL HONOLULU 65 ADRM DARWIN 66 DARWIN 67 AMMC MELBOURNE 69 NZKL WELLINGTON 70 WELLINGTON 71 NFFN NADI (FIJI) 74 EGRR UK MET OFFICE 75 UK MET OFFICE 76 MOSCOW 78 EDZW OFFENBACH 79 OFFENBACH 80 LIIB ROME RMC 81 ROME RMC 82 BGSF SONDRE/STROMFJORD GREENLAND ??? (Manual sa ys Norrkoping) 83 ESWI NORRKOPING RMC 84 Toulouse 85 LFPW TOULOUSE 86 EFKL HELSINKI 87 LYMB BELGRADE 88 ENMI OSLO 89 LKPR PRAGUE 90 LCRO EPISKOPI 91 LTAA ANKARA 92 EDDZ FRANKFURT/MAIN 93 EGRR LONDON WAFC 94 EKCH COPENHAGEN 95 LERT ROTA 96 LGAT ATHENS 97 EESA ESA 98 ECMF ECMWF 99 EHDB DE BILT 110 VHHH HONG KONG 160 NOAA/NESDIS 210 FRASCATI (ESA/ESRIN) 211 LFRO LANNION 212 LPPT LISBOA 213 BIRK REYKJAVIK 214 MADRID 215 LSZH ZURICH 216 ARGOS (Toulouse) 217 LZIB BRATISLAVA 218 LHBP BUDAPEST 219 LJLJ LJUBLJANA 220 EPWA WARSAW 221 LDZA ZAGREB
Representing WAFS Significant Weather (SIGWX) Data in BUFR – Version 4.3 (November 2013) - 31 -
254 EUMETSAT
008001 VERTICAL SOUNDING SIGNIFICANCE (7-BIT FLAG T ABLE)
1 SURFACE 2 STANDARD 3 TROPOPAUSE 4 MAX WIND 5 SIG TEMP 6 SIG WIND
008005 METEOROLOGICAL ATTRIBUTE SIGNIFICANCE
0 Automatic 1 STORM CENTRE 2 STORM EDGE OR OUTER LIMIT 3 MAXIMUM WIND
008007 DIMENSIONAL SIGNIFICANCE
0 POINT 1 LINE 2 AREA 3 VOLUME
008021 TIME SIGNIFICANCE
0 1 TIME SERIES 2 TIME AVERAGE 3 ACCUMULATED 4 FORECAST 5 F/C TIME SER 6 F/C TIME AVE 7 F/C ACCUM 8 ENSEMBLE MEAN 9 9-15 ARE AS 1-7 FOR ENSEMBLE MEAN 10 11 12 13 14 15 16 ANALYSED 17 START OF PHENOMENON 18 SONDE LAUNCH 19 ORBIT START 20 ORBIT END 21 ASC NODE 22 WIND SHIFT 23 Monitoring period 24 Agreed limit for report reception 25 Nominal reporting time 26 Last known position time 27 FIRST GUESS 28 START OF SCAN 29 END OF SCAN
008040 CBS Flight Level Significance
0 High resolution data sample 1 Within 20hPa of surface 2 <10hPa 3 Base pressure level for stability index 4 Begin T,ht doubtful 5 Begin missing data (all elements) 6 Begin RH missing 7 Begin T missing 8 Highest level reached before balloon descent 9 End T,ht doubtful 10 End missing data (all elements) 11 End RH missing 12 End T missing 13 0C crossing for RADAT 14 Std pressure 15 Operator added level 16 Operator deleted level 17 Balloon reascended beyond previous highest level
Representing WAFS Significant Weather (SIGWX) Data in BUFR – Version 4.3 (November 2013) - 32 -
18 Sig RH 19 No more RH 20 Surface 21 Sig T 22 Mandatory T 23 Flight termination 24 Tropopause 25 Aircraft report 26 Interpolated level 27 Mandatory wind 28 Sig wind 29 Max wind 30 Increm wind 31 Increm height 32 Wind termination 33 100-110hPa 40 Inversion 41 Sig RH (NCDC criteria) 42 Sig T (NCDC) 60 80kt FL above jet (flight level of 80-knot isota ch) 61 80kt FL below jet (flight level of 80-knot isota ch)
011030 – EXTENDED DEGREE OF TURBULENCE
Code figure
0 Nil 1 Light in cloud 2 Moderate 3 Severe 4 Nil 5 Light in clear air 6 Moderate 7 Severe 8 Nil 9 Light cloud/clear not specified 10 Moderate 11 Severe 12 Extreme, in clear air 13 Extreme, in cloud 14 Extreme, cloud/clear air not specified 15 Light ISOL MOD 16 Light OCNL MOD 17 Light FRQ MOD 18 MOD ISOL SEV 19 MOD OCNL SEV 20 MOD FRQ SEV 21 SEV ISOL EXTREME 22 SEV OCNL EXTREME 23 SEV FRQ EXTREME
0 NONE 1 LIGHT 2 LIGHT (CLOUD 3 LIGHT (PRECP 4 MOD 5 MOD (CLOUD) 6 MOD (PRECIP) 7 SEV 8 SEV (CLOUD) 9 SEV (PRECIP) 10 TRACE 11 TRACE (CLOUD) 12 TRACE (PRECIPITATION)
Representing WAFS Significant Weather (SIGWX) Data in BUFR – Version 4.3 (November 2013) - 35 -
12 CONTACT DETAILS
WAFC London can provide a consultancy service to assist individual clients or States in the construction of WAFS visualisation software that is fully compliant with ICAO Annex 3 and the software criteria that has been constructed by the ICAO SADIS Operations Group. Please contact WAFC London via the contact details below for further information.
WAFC London
Chris Tyson SADIS Manager and International Aviation Analyst Met Office, Fitzroy Road, Exeter, Devon, EX1 3PB, United Kingdom Tel: +44(0)1392 884892 Fax: +44(0)1392 885681 E-mail: [email protected] WAFC Washington
Matt Strahan Chief, International Operations Branch Aviation Weather Center, 7220 NW 101st Terrace, Room 101, Kansas City, Missouri 64153-2371, United States Phone: +1 (816) 584 7203 Fax: +1 (816) 880 0650 Email: [email protected]
Representing WAFS Significant Weather (SIGWX) Data in BUFR – Version 4.3 (November 2013) - 36 -
ANNEX 1 – SYMBOLS FOR SIGNIFICANT WEATHER (Extract from Appendix 1 to ICAO Annex 3, Eighteent h Edition, applicable November 2013)
IMPORTANT NOTE: The symbols used on the WAFS SIGWX charts are a subset of the symbols in Appendix 2 to ICAO Annex 3.