Reprint 1182 Blending of Extrapolated Radar Reflectivity with Simulated Reflectivity from NWP for a Seamless Significant Convection Forecast up to 6 Hours P. Cheung, P.W. Li & W.K. Wong The 17th Conference on Aviation, Range, and Aerospace Meteorology, 4-8 January 2015, Phoenix, Arizona, USA.
Transcript
Reprint 1182
Blending of Extrapolated Radar Reflectivity with Simulated
Reflectivity from NWP for a Seamless Significant
Convection Forecast up to 6 Hours
P. Cheung, P.W. Li & W.K. Wong
The 17th Conference on Aviation, Range, and Aerospace
Meteorology, 4-8 January 2015, Phoenix, Arizona, USA.
1
BLENDING OF EXTRAPOLATED RADAR
REFLECTIVITY WITH SIMULATED REFLECTIVITY
FROM NWP FOR A SEAMLESS SIGNIFICANT
CONVECTION FORECAST UP TO 6 HOURS
P. Cheung, P. W. Li and W. K. Wong Hong Kong Observatory, Hong Kong, China
1. INTRODUCTION
Conventional radar-based nowcasting system,
consisting of a tracking scheme to retrieve radar echoes’ motion and an extrapolation algorithm to predict the future location of weather cells, normally fails beyond 3 hours. This is because most of these systems assume constant intensity in time. In reality, except for extensive and persistent systems, typical time scale for the growth and dissipation of thunderstorm cells is just about an hour or so, which makes the above assumption invalid. To improve that, blending with high resolution non-hydrostatic numerical weather prediction model is one of the viable approaches as model can provide system evolution information and thus address a major limitation of simple extrapolation scheme, namely storm growth and decay [1].
We have developed an algorithm to generate simulated
radar reflectivity data from prognostic variables of different water species in a high resolution NWP model. These simulated radar parameters, are blended with the radar-based nowcasting system to generate a seamless product on significant convection for the next 0-6 hours.
Significant convection is vital information for pilots and
air traffic controllers in inclement weather situations. The seamless significant convection nowcast would be useful for generating the trajectory-based convection forecast and for estimating the impact of the significant convection on the planned flight path in support of the ASBU Block 1 and 3 of the Global Air Navigation Plan development which has been adopted by ICAO for the next generation of civil aviation initiative in the next 15 or more years.
This paper presents the experimental blending algorithm
that merges the extrapolated and model simulated radar reflectivity. Preliminary performance of this blending method will also be show-cased.
2. NOWCASTING SYSTEM
The Hong Kong Observatory (HKO) developed an
Aviation Thunderstorm Nowcasting System (ATNS) to inform Air Traffic Control (ATC) on the movement of thunderstorms near the Hong Kong International Airport (HKIA) and neary by airspaces in the next 1 hour [2]. ATNS was based on HKO’s renowned nowcasting system, the Short-range Warnings of Intense Rainstorm in Localized System (SWILRS).
* Corresponding author address: P. Cheung, Hong Kong Observatory, 134 A Nathan Road, Kowloon, Hong Kong, China. Email: [email protected]
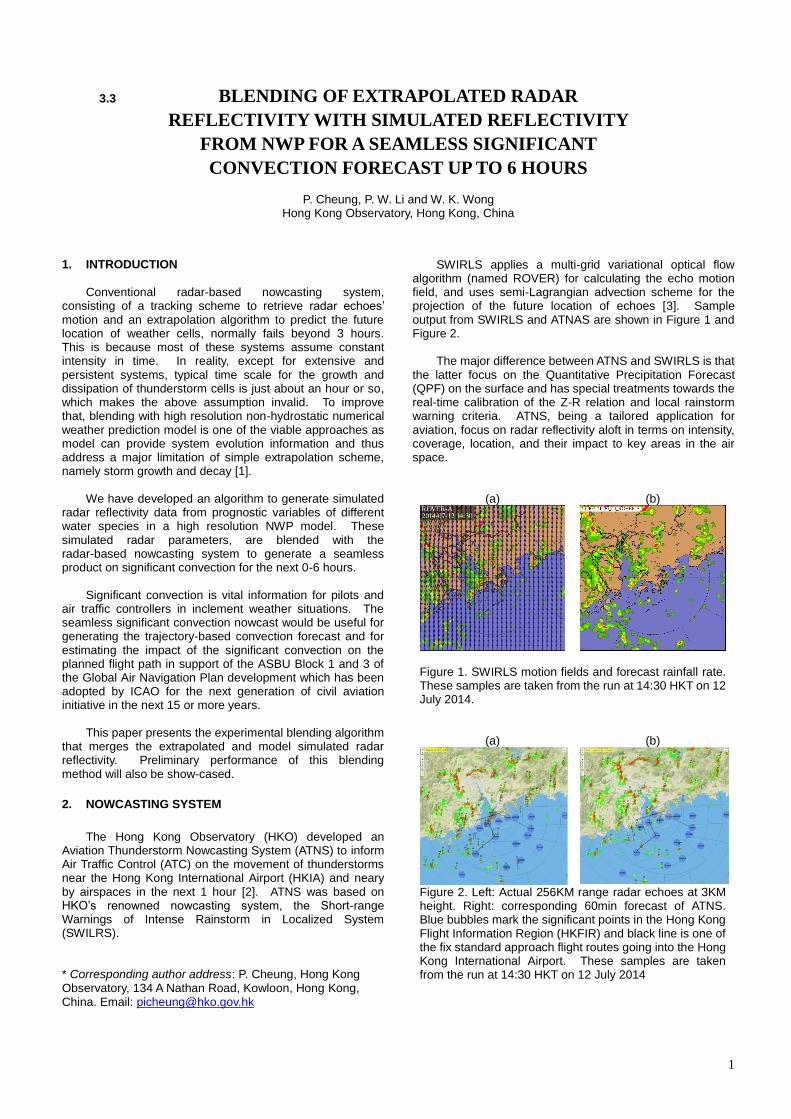
SWIRLS applies a multi-grid variational optical flow
algorithm (named ROVER) for calculating the echo motion field, and uses semi-Lagrangian advection scheme for the projection of the future location of echoes [3]. Sample output from SWIRLS and ATNAS are shown in Figure 1 and Figure 2.
The major difference between ATNS and SWIRLS is that
the latter focus on the Quantitative Precipitation Forecast (QPF) on the surface and has special treatments towards the real-time calibration of the Z-R relation and local rainstorm warning criteria. ATNS, being a tailored application for aviation, focus on radar reflectivity aloft in terms on intensity, coverage, location, and their impact to key areas in the air space.
(a)
(b)
Figure 1. SWIRLS motion fields and forecast rainfall rate. These samples are taken from the run at 14:30 HKT on 12 July 2014.
(a)
(b)
Figure 2. Left: Actual 256KM range radar echoes at 3KM height. Right: corresponding 60min forecast of ATNS. Blue bubbles mark the significant points in the Hong Kong Flight Information Region (HKFIR) and black line is one of the fix standard approach flight routes going into the Hong Kong International Airport. These samples are taken from the run at 14:30 HKT on 12 July 2014
3. SIMULATED REFLECTIVITY FROM HIGH RESOLUTION NWP MODEL
The new NWP system operating at HKO since 2010 is
called the Atmospheric Integrated Rapid-cycle (AIR) forecast model [4]. It is based on JMA’s Non-Hydrostatic Model (NHM) [5]. AIR model domains and its configurations are shown in Table 1 and Figure 3. In support of aviation weather services, the larger domain, namely the Meso-NHM is mainly for upper air wind and turbulence forecast, whereas the small, inner domain (RAPIDS-NHM) is for supporting the visibility and significant convection forecast [6].
Figure 3. Domains of HKO’s Meso-NHM and RAPIDS-NHM (white square)
In RAPIDS-NHM, radar reflectivity data, and doppler
radar derived wind fields at different heights are ingested into the 3DVAR data assimilation scheme. Therefore, it needs a relatively shorter time for so called model “spin up”.
Meso-NHM RAPIDS-NHM
Horizontal resolution 10km 2km
Vertical levels 50 60
Update cycle 3hr 1hr
Forecast range 72hr 15hr
Boundary condition ECMWF Meso-NHM
Data assimilation 3DVAR 3DVAR
Table 1. Model configuration of AIR forecast system operating at HKO.
Owning to its high horizontal resolution, convective
parameterisation is turned off. With the availability of prognostic cloud microphysical variables of water species in full, one is able to apply directly the radar equation below to get the reflectivity factor (Z).
𝑍 = 𝑍𝑟 + 𝑍𝑠 + 𝑍𝑔
where the total reflectivity factor is the sum of three
contributing species, namely rain (r), snow (s) and graupel (g) calculated respectively from the following equations:
𝑍𝑟 = 720𝑁𝑟
𝜆𝑟7
𝑍𝑠 = 720|𝐾𝑖|
2
|𝐾𝑤|2
𝜌𝑠2
𝜌𝑖2
𝑁𝑜𝑠
𝜆𝑠7
𝑍𝑔 = 720|𝐾𝑖|
2
|𝐾𝑤|2
𝜌𝑔2
𝜌𝑖2
𝑁𝑜𝑔
𝜆𝑔7
For the above equations, the values of various
constants and prognostic variables are extracted directly from the RAPIDS-NHM model.
Figure 4 below shows a sample of the simulated radar
reflectivity.
(a)
(b)
(c)
Figure 4. Left: Simulated CAPPI radar reflectivity at 3KM from RAPIDS-NHM; Middle: Actual 256KM range radar 3KM CAPPI image on 14:30 HKT, 12 July 2013; Right: corresponding RAPIDS-NHM 1hr surface rainfall. The 8-hour forecast is shown for both (a) and (c).
4. BLENDING ALGORITHM AND ALERTING CRITERIA
At HKO, the nowcasting-NWP blending technology has
emerged as early as 2005 [7, 8]. However, the blending had to operate on rainfall because it is the only commonly available variable in both systems. As pointed out earlier, pilots concerns more on echoes in the air rather than surface precipitation so the approach was not ideal. Now, using the equation described in section 3, we are able to obtain forecast reflectivity from NWP model, and perform direct blending on it.
When developing the algorithm in this paper, a number
of questions need to be answered. First one was the suitable horizontal scale to use. Considering the uncertainties in the echo location forecast in both nowcasting the NWP systems, direct merging of the output on the “pixel-by-pixel” scale will likely to produce undesirable outcome. We therefore set the radius of interest to 20NM, based on two considerations below. One consideration is on the forecast capability of the RAPIDS-NHM model. Based on a previous study [9] which used Fractions Skill Score (FSS) to demonstrate the performance of the NWP model on different scales, it revealed that +/-20 grid boxes (40km for 2km model, or 20NM) would yield a reasonable FSS of around 0.3. The other consideration is on the usage of airspace inside the Hong Kong Flight Information Region (HKFIR). As indicated in Figure 5, typically, the holding patterns allocated for arrivals flights to the Hong Kong International Airport (HKIA) is 20NM in radius.
3
Figure 5. Flights into the Hong Kong International Airport and holding zones associated with arrival routes.
The second question was how to define the relevant
thresholds for aviation users on the impact of convection to flight operation. Aviation impacts depend on multiple factors including echo intensity, coverage, the usage of the airspace, air traffic condition …etc. In this study, we defined two levels of severity by making reference to the previous endeavour to develop the significant convection forecast time series for air traffic flow management [10]. These thresholds were also consistent with HKO’s study that analyses aircraft weather avoidance action in the HKFIR [11]. Levels of severity are defined by percentage coverage of high return cells in the area of interest, where “high return” is chosen to be 33dBZ for medium impact, and 41dBZ for large impact. Two level alerts have been designed as
(i) Amber: 10% coverage of 33dBZ over the holding area
(i.e. 20NM radius within the holding point)
(ii) Red: 5% coverage of 41dBZ over the holding area The last question was what to blend and how. Since
we are concerned about a certain key locations in the air space with known severity thresholds, the blending variable was taken to be the percentage coverage of convections in those areas. Such a choice somehow relieved the problem of “intensity and location mismatch” between output from the nowcast system and NWP model since direct pixel to pixel blending is avoided. Finally, to incorporate the model-based growth/decay information while noting there could be model “spin-up” issue, the blending is conducted on the trend of the blended variable instead of using the absolution value. A relatively linear weighting factor for NWP varied from 0 for the first hour lead time to unity at 6 hour lead time was used.
The actual procedure is outlined as follows: • The nowcasting system (ATNS of HKO) generates
up to 6 hours forecast of radar reflectivity covering 256km range;
• NWP (RAPIDS-NHM of HKO) output the corresponding forecast simulated reflectivity;
• Both outputs convert to a time series of severity (i.e. percentage coverage of 33/41dBZ over the holding areas of interest;
• Calculate nowcast and forecast trend time series for those areas of interest;
• Blend in NWP trend time series with a parameter (w) that takes a linear form increase from 0 to 1 between 1 and 6 hours;
• Blend in nowcast trend time series using (1-w); • Output forecast percentage coverage by adding the
time-weighted trend to actual percentage observed on radar.
Similar approache to deal with trending instead of
absolute values of the forecast variable was adopted by the Canadian Airport Nowcasting System [12]. For the current algorithm, the trend is used in view to mitigating the problem of model spin-up when the absolute values of the simulated reflectivity could not be used directly.
5. CASE STUDY of 1 October 2014
To illustrate the potential gain of the proposed blending
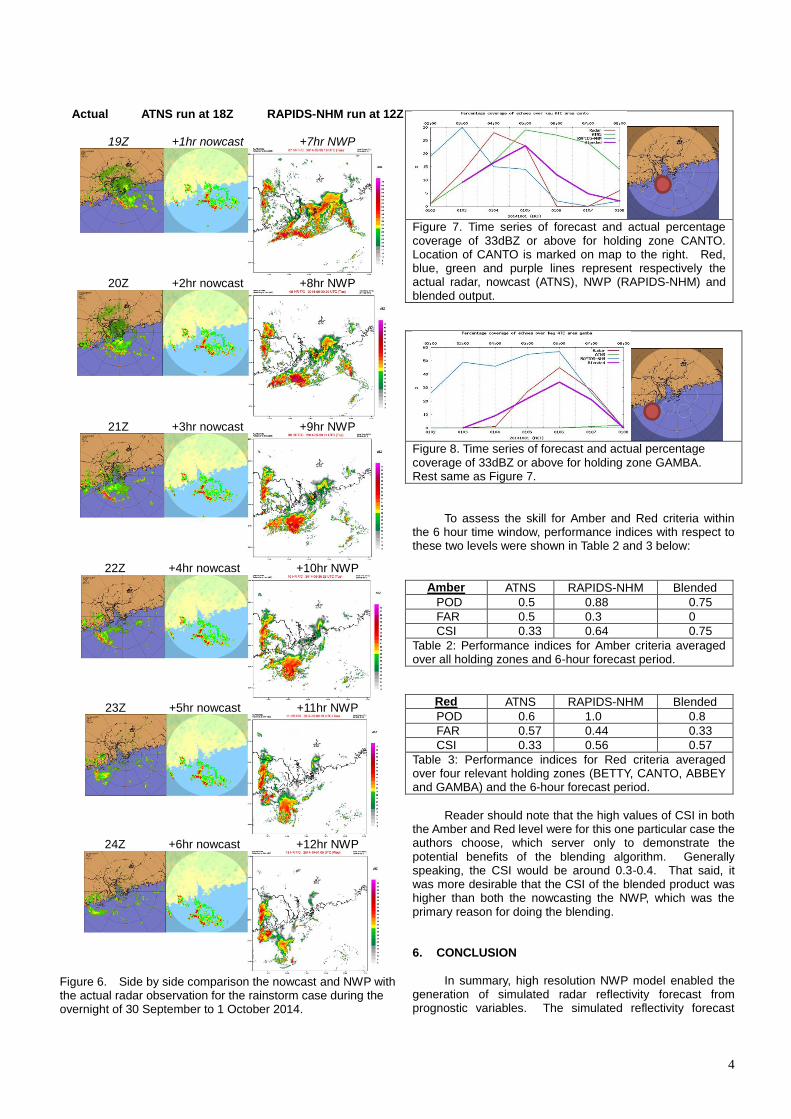
method, a rainstorm case on the morning of 1 October, 2014, the Chinese National Day, was selected. The coastal area of Guangdong was under the influence of disturbed easterlies. A band of intense echoes swept across the territory from the east to the west in the early morning and the airspace was affected from around 18Z to 00Z. In order to examine the skill of blended convection forecast up to 6 hours ahead, the NWP model run forecast at 12UTC 30 September 2014 was used, whereas the initial time for the nocasting system was chosen to be 18UTC 30 September 2014. The actual radar imagery and the forecasts at the corresponding valid time are tabulated in Figure 6.
It can be seen from Figure 6 that due to errors in the speed and direction estimation in the motion field, the extrapolated echoes in ATNS were rather slow with Southward bias. The slowness problem became more prominent when the band of echoes started to accelerate a little at around 20Z. On the other hand, the NWP model could reasonably reproduce the evolution of the system both in terms of its movement and the dissipation process.
The time series of percentage coverage of 33dBZ
(a.k.a Amber criteria) over two selected zones (i.e. CANTO and GAMBA) were plotted in Figure 7 and Figure 8 respectively. From the figures it was clear that the blended output rightfully reproduced the profile of convection within the holding areas.
4
Actual
ATNS run at 18Z RAPIDS-NHM run at 12Z
19Z +1hr nowcast +7hr NWP
20Z +2hr nowcast +8hr NWP
21Z +3hr nowcast +9hr NWP
22Z +4hr nowcast +10hr NWP
23Z +5hr nowcast +11hr NWP
24Z +6hr nowcast +12hr NWP
Figure 6. Side by side comparison the nowcast and NWP with the actual radar observation for the rainstorm case during the overnight of 30 September to 1 October 2014.
Figure 7. Time series of forecast and actual percentage coverage of 33dBZ or above for holding zone CANTO. Location of CANTO is marked on map to the right. Red, blue, green and purple lines represent respectively the actual radar, nowcast (ATNS), NWP (RAPIDS-NHM) and blended output.
Figure 8. Time series of forecast and actual percentage coverage of 33dBZ or above for holding zone GAMBA. Rest same as Figure 7.
To assess the skill for Amber and Red criteria within
the 6 hour time window, performance indices with respect to these two levels were shown in Table 2 and 3 below:
Amber ATNS RAPIDS-NHM Blended
POD 0.5 0.88 0.75
FAR 0.5 0.3 0
CSI 0.33 0.64 0.75
Table 2: Performance indices for Amber criteria averaged over all holding zones and 6-hour forecast period.
Red ATNS RAPIDS-NHM Blended
POD 0.6 1.0 0.8
FAR 0.57 0.44 0.33
CSI 0.33 0.56 0.57
Table 3: Performance indices for Red criteria averaged over four relevant holding zones (BETTY, CANTO, ABBEY and GAMBA) and the 6-hour forecast period.
Reader should note that the high values of CSI in both the Amber and Red level were for this one particular case the authors choose, which server only to demonstrate the potential benefits of the blending algorithm. Generally speaking, the CSI would be around 0.3-0.4. That said, it was more desirable that the CSI of the blended product was higher than both the nowcasting the NWP, which was the primary reason for doing the blending. 6. CONCLUSION
In summary, high resolution NWP model enabled the
generation of simulated radar reflectivity forecast from prognostic variables. The simulated reflectivity forecast
5
was then blended with extrapolated radar reflectivity from nowcasting systems to generate a seamless convection forecast up to 6 hours ahead. Main characteristics of the blending algorithm were that it used a suitable horizontal scale (20nm in radius), it defined objective severity based on percentage coverage of significant radar reflectivity (33/41 dBZ), and that it operated on the trend of forecast variable.
Besides simulated radar reflectivity, the RAPIDS-NHM
is able to output Vertically Integrated Ice (VII) and isothermal reflectivity as well. These could be useful in lightning forecast which is also of great importance to aviation safety. Further study into this area will continue. On the other hand, frequent output of simulated reflectivity will be explored to increase temporal sampling rate to avoid missing the event in between hourly intervals. In addition, ensemble nowcasting system and NWP will be tested for generating probabilistic forecasts in the future.
REFERENCES
[1] Ambrosetti Paolo, Statement of Guidance for Nowcasting and Very Short Range Forecasting, available at : (http://www.wmo.int/pages/prog/www/OSY/SOG/SoG-Nowcasting-VSRF.pdf) [2] Li, P.W. 2009: Development of a thunderstorm nowcasting system for Hong Kong International Airport, AMS Aviation, Range, Aerospace Meteorology Special Symposium on Weather-Air Traffic Management Integration, Phoenix, Arizona, 11-15 Jan 2009. [3] YEUNG H.Y. and P. Cheung, Application of optical-flow technique to significant convection nowcast for terminal areas in Hong Kong, The 3rd WMO International Symposium on Nowcasting and Very Short-Range Forecasting (WSN12), Rio de Janeiro, Brazil, 6-10 August 2012 [4] Wong W.K., Development of Operational Rapid Update Non-hydrostatic NWP Model and Data Assimilation System in the Hong Kong Observatory, Technical Reports of the Meteorological Research Institute No. 65: International Research for Prevention and Mitigation of Meteorological Disasters in Southeast Asia, December 2011, p.87-100 [5] Saito, K., T. Fujita, Y. Yamada, J. Ishida, Y. Kumagai, K. Aranami, S. Ohmori, R. Nagasawa, S. Kumagai, C. Muroi, T. Kato, H. Eito and Y. Yamazaki, 2006: The Operational JMA Nonhydrostatic Mesoscale Model. Mon. Wea. Rev.,134, 1266-1298. [6] Wong W.K., P.W. Chan & C.K. Ng, Aviation Applications of a New Generation of Mesoscale Numerical Weather Prediction System of the Hong Kong Observatory, The 24th Conference on Weather and Forecasting/20th Conference on Numerical Weather Prediction, American Meteorological Society, Seattle, USA, 24-27 January 2011 [7] Wong M.C., W.K. Wong, & S.T. Lai , From SWIRLS to RAPIDS : Nowcast Applications Development in Hong Kong, WMO PWS Workshop on Warnings of Real-Time Hazards by
Using Nowcasting Technology, Sydney, Australia, 9-13 October 2006 [8] Li P.W., W.K. Wong, Development of an Advanced Aviation Nowcasting System by Including Rapidly Updated NWP Model in Support of Air Traffic Management,14th Conference on Aviation, Range, and Aerospace Meteorology, American Meteorological Society, Atlanta, Georgia, USA, 17-21 Jan 2010 [9] Wong WK, Verification Method to account for Spatial Errors in Precipitation Forecast from Numerical Weather Prediction Model, 28th Guangdong-Hong Kong-Macao Seminar on Meteorological Science and Technology, Hong Kong, 13-15 January 2014. [10] Cheung P, C. C. Lam, Development of Significant Convection Forecast Product and Service for Air Traffic Flow Management in Hong Kong, The Second Aviation, Range and Aerospace Meteorology Special Symposium on Weather-Air Traffic Management Integration" 23-27 January 2011 in Seattle, WA. [11] Tse, S. M., P. Cheung, P. W. Li, W. S. Chan, Automatic Quantification of Weather Impact to Aircraft Operations due to Significant Convection Using Radar Parameters, to be published. [12] George A. Isaac, Monika Bailey, Faisal S. Boudala, William R. Burrows, Stewart G. Cober, Robert W. Crawford, Norman Donaldson, Ismail Gultepe, Bjarne Hansen, Ivan Heckman, Laura X. Huang, Alister Ling, Jocelyn Mailhot, Jason A. Milbrandt, Janti Reid and Marc Fournier, The Canadian Airport Nowcasting System (CAN-Now), Meteorological Applications Special Issue: Developments in aviation meteorology,Volume 21, Issue 1, pages 30–49, January 2014