We compared the efficacy of activity monitor (which displays exercise intensity and number of steps) versus that of pedometerin exercise therapy for patients with type 2 diabetes. The study subjects were divided into the activity monitor group (𝑛 = 92)and pedometer group (𝑛 = 95). The primary goal was improvement in hemoglobin A1c (HbA1c). The exercise target was set at8,000 steps/day and 20 minutes of moderate-intensity exercise (≥3.5 metabolic equivalents). The activity monitor is equipped witha triple-axis accelerometer sensor capable of measuring medium-intensity walking duration, number of steps, walking distance,calorie consumption, and total calorie consumption.The pedometer counts the number of steps. Blood samples for laboratory testswere obtained during the visits. The first examination was conducted at the start of the study and repeated at 2 and 6 months. Asignificant difference in the decrease in HbA1c level was observed between the two groups at 2 months.The results suggest that theuse of activity level monitor that displays information on exercise intensity, in addition to the number of steps, is useful in exercisetherapy as it enhances the concept of exercise therapy and promotes lowering of HbA1c in diabetic patients.
1. Introduction
Diet and exercise therapy form the basis of treatment of type2 diabetes mellitus (T2DM). These two approaches are wellknown to improve blood glucose control [1]. Exercise therapyhas also been reported to be effective in improving bloodglucose control and quality of life (QOL) [2, 3]. However,reduction of fat and improvement in insulin resistance arelimited with diet modification alone [4].
As such, even while the effects of exercise therapy are wellknown, in reality, evenwhendiet therapy is followednearly byall patients, the percentage of patients who adhere to exercisetherapy is only about 40% [5]. The reasons for this low rateare that exercise therapy is not easy to implement in patientswith no physical training background, time restrictions, andinability to maintain motivation. Another reason is that theactual techniques and goals of exercise therapy are oftendifficult to understand by both the patient and the instructor.
Target indicators for exercise therapy include both thenumber of steps and strength [5], and moderate-intensity
training is considered particularly effective. While 3–6metabolic equivalents (METs) are proposed for exercisetherapy of moderate intensity [5, 6], in actuality, checking theintensity level during training sessions is often difficult. Foreffective exercise therapy, the activity level should be appro-priately increased bymonitoring and being aware of the exer-cise intensity. Development of a simple and useful tool towardthis end would help improve the outcome of treatment ofT2DM. Using a conventional device that measures the num-ber of steps (pedometer) and another device that measuresthe number of steps and exercise intensity and amount (activ-ity monitor), the present study was designed to evaluate theeffects of exercise therapywith awareness of training intensitywith regard to improvement in blood glucose control.
2. Materials and Methods
2.1. Patients and Methods. The subjects were 200 adultpatients with T2DM who visited our division at Tokai
Hindawi Publishing CorporationJournal of Diabetes ResearchVolume 2016, Article ID 5043964, 7 pageshttp://dx.doi.org/10.1155/2016/5043964
2 Journal of Diabetes Research
Red line (moderate intensity)
Memory Set Mode
Steps
min
km
kcal
Total consumptionday before
(a)
Goal achievement sign(“banzai character”)
Steps
min
km
kcal
(b)
Measurement of HbA1cClinical laboratory tests
Activity monitorgroup
Pedometergroup
0 months
Instructions on exercises
Collection of record notebooks
After 2 months
Reporting of the number of activitiesInstructions on exercises
Reporting of the number of stepsInstructions on exercises
Measurement of HbA1cClinical laboratory tests
Measurement of HbA1cClinical laboratory tests
After 6 months
Instructions on exercises
Collection of record notebooks
(c)
Figure 1: (a) On the activity monitor, for exercise of moderate intensity of 3 METs or higher, the intensity is displayed when the indicatorexceeds the red line. (b) If the daily goal of moderate-intensity exercise of 20 minutes or longer and at least 8,000 steps is set and achieved,the user is notified that the goal has been achieved through a sign on the screen (a “banzai character”). (c) Study design.
University Hospital between March and April 2012 and werejudged by their physicians as fit to receive exercise therapy.In addition, at the beginning of the study, the methodsand purpose of the research and the voluntary nature ofcooperation were explained verbally and in writing, andwritten agreement was obtained from all patients. This studywas registered as a clinical trial (UMIN000018694), with theinspection and approval of the institutional review board forclinical research of Tokai University Hospital.
The number of steps and amount of physical activitywere recorded digitally using an activitymonitor (modelMT-KT01, Terumo, Tokyo, Japan) with a triaxial speed sensor thatmeasures the number of steps and the time spent walking ata moderate-intensity level. Another device, a modified MT-KT01, was used as a pedometer to count the number of stepsduring walking/exercise.
After randomly assigning 100 subjects each to the activitymonitor group and the pedometer group, a target was setfor the pedometer group, which was walking exercise ofmoderate intensity (3 METs or higher) for least 20 minutes aday and 8,000 steps. The same target of at least 3 METs (at orabove the achievement line indicator in the activity monitor;Figure 1(a)) for a minimum of 20 minutes a day of exerciseand 8,000 steps was also set for the activity monitor group.Both the pedometer and activity monitor were hung from astrap around the user’s neck during waking hours.
The achievement of the target exercise was signaled bya display of the goal achievement sign (Figure 1(b)) on theactivity monitor. The patients were asked to manually recordthe data of their activity monitor and pedometer in recordsheets, which were collected during the outpatient visits.Clinical data measurements, including HbA1c level, wereperformed during the outpatient visits, with evaluation of thenumber of steps and target achievement ratio in the secondmonth and final evaluation in the sixth month (Figure 1(c)).
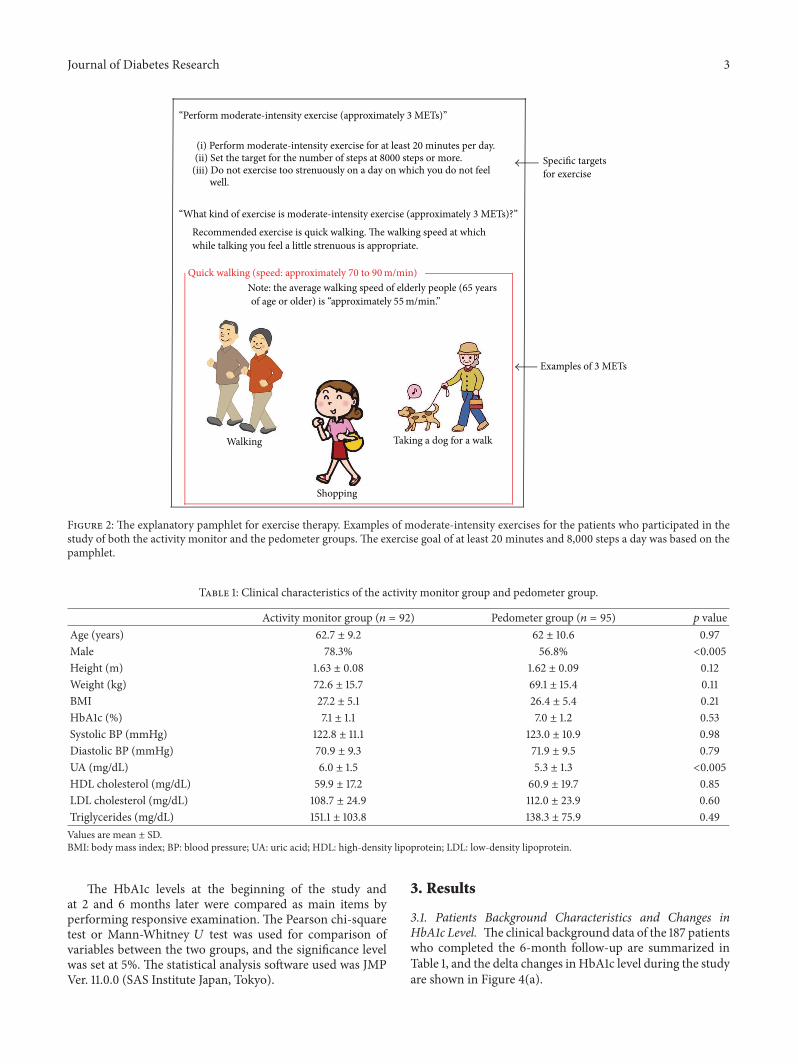
Instructions were provided regarding the exercise on apamphlet handed to each patient (Figure 2) at the beginningof the study. At 2 months after the start of training, thesubjects were asked to report the number of steps and amountof exercise, as well as whether they had achieved the settargets. Those who self-reported that they had achieved thegoals were instructed to continue, while those who had notdone so were again provided information described in thepamphlet without any new intervention.
2.2. Statistical Analysis. The 187 patients who completedtheir 6-month follow-up were the subjects of the analysis(Figure 3). The pedometer and activity monitor data werecompared, as well as changes in medications. Concerningcontinuation of exercise and achievement of targets, theanalysis defined those with at least 80% of day count data andat least 80% of target exercise amounts as meeting the goals.
(i) Perform moderate-intensity exercise for at least 20 minutes per day.(ii) Set the target for the number of steps at 8000 steps or more.
(iii) Do not exercise too strenuously on a day on which you do not feel well.
“What kind of exercise is moderate-intensity exercise (approximately 3 METs)?”
Recommended exercise is quick walking. The walking speed at which while talking you feel a little strenuous is appropriate.
Note: the average walking speed of elderly people (65 years
Taking a dog for a walk
Shopping
Walking
Quick walking (speed: approximately 70 to 90 m/min)
of age or older) is “approximately 55m/min.”
Figure 2: The explanatory pamphlet for exercise therapy. Examples of moderate-intensity exercises for the patients who participated in thestudy of both the activity monitor and the pedometer groups. The exercise goal of at least 20 minutes and 8,000 steps a day was based on thepamphlet.
Table 1: Clinical characteristics of the activity monitor group and pedometer group.
The HbA1c levels at the beginning of the study andat 2 and 6 months later were compared as main items byperforming responsive examination. The Pearson chi-squaretest or Mann-Whitney 𝑈 test was used for comparison ofvariables between the two groups, and the significance levelwas set at 5%. The statistical analysis software used was JMPVer. 11.0.0 (SAS Institute Japan, Tokyo).
3. Results
3.1. Patients Background Characteristics and Changes inHbA1c Level. Theclinical background data of the 187 patientswho completed the 6-month follow-up are summarized inTable 1, and the delta changes in HbA1c level during the studyare shown in Figure 4(a).
4 Journal of Diabetes Research
Process of selection of target patients
200 patients:Number of subjects enrolled into our hospital from March to October 2012
187 patients: Completed 6 months of follow-up
13 patients: Discontinued or transferred to another hospital
55 patients:Patients for whom the data of the records of the activity monitor or the pedometer were not available.
73 patients: Failed to achieve the exercise target
30 patients: Changed antidiabetes drugs during 6 months before and after the start. 28 patients:
Did not change medications during 6 months before and after the start
Table 2, Figure 4(b)
Table 1, Figure 4(a)
Figure 3: Patient selection process. After excluding those patients who cancelled, transferred to other hospitals, or dropped out, the data of187 patients were subjected to analysis. After excluding patients with insufficient exercise therapy record data, unachieved exercise goals, andchanges in medications in the 6 months before and after the start of the study period, data of 28 patients of each group were compared andstudied.
−0.50
−0.40
−0.30
−0.20
−0.10
0.00
0.10
0.20
0 2 6
ΔH
bA1c
(%)
Pedometer group (n = 95)Activity monitor group (n = 92)
NS
NS
NS: not significant
(months)
p < 0.05
7857.3 steps/day
8023.7 steps/day
∗p < 0.001 versus 0 months
−0.31 ± 0.48∗−0.24 ± 0.39∗
−0.08 ± 0.42
−0.37 ± 0.57∗
(a)
−0.50
−0.40
−0.30
−0.20
−0.10
0.00
0.10
0.20
Pedometer group (n = 14)Activity monitor group (n = 14)
NS
NS
NS: not significant
ΔH
bA1c
(%)
0 2 6(months)
p < 0.05
10847 steps/day
10314 steps/day
∗∗p < 0.05 versus 0 months
∗p < 0.001 versus 0 months
−0.08 ± 0.29
−0.28 ± 0.50∗∗−0.24 ± 0.16∗
−0.01 ± 0.23
(b)
Figure 4: (a) Changes in HbA1c level after daily walking exercise for 2 and 6 months in the pedometer and activity monitor groups and all187 patients. (b) Changes in HbA1c level after daily walking exercise for 2 and 6 months in 28 patients of the pedometer and activity monitorgroups who achieved their goals and recorded no changes in medications throughout the study.
Based on the background characteristics of all the 187patients, no clear difference was found between the twogroups other than a significant preponderance of men in theactivity monitor group and the value of uric acid in the bloodbeing significantly low in the pedometer group (Table 1).
With regard to changes in HbA1c level, significant reduc-tions in HbA1c level at 2 and 6 months after the start of thestudy were observed in the activity monitor group, compared
to that before the start of study. Comparison of data of the twodevice groups showed a significant difference in the level ofreduction in HbA1c level at 2 months between the pedometerand activity monitor groups (pedometer group: 0.08±0.42%,activitymonitor group: 0.24±0.39%).However, no significantdifference was observed between the two groups at 6 months.
Changes in HbA1c at 2 and 6months were also comparedaccording to sex and uric acid level. There was no significant
Journal of Diabetes Research 5
0
0.1
0.2
0.3
0.4
0.5M
ale
Fem
ale
Hig
h UA
Low
UA
Mal
e
Fem
ale
Hig
h UA
Low
UA
Redu
ctio
n in
HbA
1c (%
)
NS NS
NS NS
UA: uric acidNS: not significant
6months2months
0.31 ± 0.60
0.44 ± 0.52
0.20 ± 0.74
0.42 ± 0.50
0.19 ± 0.54
0.25 ± 0.35 0.25 ± 0.420.22 ± 0.37
Figure 5: Comparison of the levels of reduction in HbA1c at 2 and6 months according to sex and serum uric acid.
difference in HbA1c between males and females (Figure 5).After dividing the patients into those with high and low uricacid levels, using themedian uric acid level as the cutoff value,we found no difference between the two groups (Figure 5).
Next, we excluded the data of 55 subjects with physicalactivity data less than 80% of those recorded at 6 monthsand 73 subjects with physical activity data less than 80%of the exercise target achievement rate. Thus, 59 patientscontinued the exercise therapy for 6 months, including 36 ofthe activity monitor group and 23 of the pedometer group.The continuation rate was 37.9% and 25.0%, respectively. Theexercise therapy continuation rate of the activity monitorgroup was significantly better than that of the pedometergroup (𝑝 = 0.0282).
Since no limitation was imposed in the present study onthe use and changes in medications, the effects of the drugswere excluded. Formeaningful analysis, however, we selectedthose patients inwhomno changes inmedicationsweremade6 months before and after the start of the study (i.e., for 1year) and analyzed their data for the effects of exercise therapyonly. The results showed that changes in HbA1c level purelydue to exercise were noted in 14 subjects from each group(Figure 4(b)).
Significant reductions in HbA1c level from the timebefore to the time after the start of the study were observed inthe activity monitor group but not in the pedometer groupboth at 2 and at 6 months. The decrease in HbA1c levelat 2 months was significantly larger in the activity monitorgroup (0.24 ± 0.16%) compared with the pedometer group(0.01±0.23%). A similar trendwas noted at 6months, thoughthe difference was not significant.
4. Discussion
The US guidelines recommend 150 minutes of exercise perweek as appropriate exercise therapy. However, a recent studyindicated that 90 minutes per month of low to moderate
exercise is beneficial in Asians [7]. Thus, fast walking,which can be easily achieved on a daily basis, is consideredmoderately intense exercise inAsia. For this reason, this studywas conducted by selecting walking exercise as the exercisetherapy, which is considered the easiest to perform.This studywas plannedwith a hypothesis that, as a resolution to the issueof “I do not have time to exercise,” changing the daily activityitself to a level of moderate intensity is a sufficient exercisetherapy, even if one just cannot take time to exercise, andthat activity monitors have better results than pedometers asa measure of exercise efficacy.
The target activity was set in the present study at 3 METs,although moderately intensive exercise is effective in exercisetherapy in T2DM patients [8]. Unconditionally speaking,even for moderate-intensity exercise, the exercise burdenshould be adjusted according to age. For those patients aged≥65 years (constituting the majority of our patients and repre-senting the majority of patients with T2DM in Japan), the 3-MET level is considered of moderate intensity [6]. We there-fore set 3 METs and higher as the target activity in this study.
Our results showed reduction of HbA1c level in bothgroups when the patients of both groups exercised whilebeing aware of the 3-MET target. These results confirmedthat exercise therapy, at least for 6 months, contributed to theimprovement inHbA1c in patientswithT2DM. Furthermore,patients who wore the activity monitor, which provided feed-back about their exercise intensity, also showed reduction inHbA1c level, which was significantly better at 2 months com-pared with the pedometer group.This difference was thoughtto be due to the motivation to exercise at a moderate level,combined with feedback from checking exercise intensity,with resultant more beneficial effects in the activity monitorgroup than the pedometer group. Considered together, theseresults suggest that the use of activity monitor seems toenhance the reduction in HbA1c level.
As shown in Figure 4(b), in the study that excludedthe effects of medications, the decrease in HbA1c level wasinterestingly larger in the activity monitor group than inthe pedometer group at both 2 and 6 months. This findingsuggests that using an activity monitor is important inexercise therapy, as it provides information about exerciseintensity, and that suchmonitor is particularly effective in thesimple exercise therapy of walking as part of daily activities.
Furthermore, the most noteworthy result of this studywas the difficulty of continuing the exercise therapy in the6-month study period. Thus, the percentage of patients whocontinued exercise therapy for 6 months at ≥80% of theexercise therapy was less than 40% in both groups: 37.9% ofthe activitymonitor group and 25.0%of the pedometer group,indicating the difficulty in continuing exercise therapy itself.Based on these results, we emphasize the need for motivatingT2DM patients to continue exercise.
With regard to the provision of instructions or guidanceto the patients regarding exercise therapy, in addition toits usefulness in maintaining motivation through the abilityto recognize exercise intensity levels, even in patients whoreceived instructions through the pamphlet only, checkingthat the target of 3 METs has been achieved during walk-ing is useful in learning the appropriate walking speed.
6 Journal of Diabetes Research
Table 2: Clinical background of patients in whom medications were not changed throughout the study.
Therefore, this is possible not only by a physician but alsothrough instruction provided by other medical staff. Thisdemonstrates that the mere act of presenting exercise goalsto patients before using activity monitors and incorporatingmoderate to high-level movement into their daily activitiesseemed to contribute to the efficacy of exercise therapy.
The present study has certain limitations. The reductionin HbA1c level at 6 months coincided with the summerseason (from the fourth month after the start of the study).People tend to stay less outside for reasons such as to avoidheatstroke. Due to potential reduced physical activity andthe effects of increased intake of glucose-rich sports drinks,further studies of longer duration are needed, especially stud-ies that take seasonal variations into consideration. Table 1shows that the percentage of males was significantly higherin the activity monitor group than in the pedometer group.This could contribute to selection bias. For this reason, wecompared the extent of reduction inHbA1c at 2 and 6monthsbetween males and females and between patients with highand low uric acid (Figure 5). We also analyzed backgroundcharacteristics and HbA1c changes in 28 patients who didnot change their medications during the 6-month period(Table 2). Another limitation of the present study is that itcompared only the number of steps but not other parametersthat could be used to evaluate whether the use of activitymonitors actually increased the total amount of physicalactivity (e.g., walking duration, walking distance, and totalcalorie expenditure) in the two groups. Unfortunately, suchdata could not be stored in the pedometer device.
The only available explanation for the continuation ofexercise by patients who did not achieve the exercise goalswas the second explanation of the pamphlet provided duringthe consultation in the second month. However, it is difficultto say that this is completely the same as instructions givenabout exercise therapy in daily clinical consultation. Furtherstudies are needed to select the best follow-up regimen andits relationship with the achievement of exercise targets inpatients with T2DM.
5. Conclusions
Wehave demonstrated in the present study the importance ofexercise therapy for patients with T2DM.The results showedthat awareness of the level of exercise intensity through theuse of an activity monitor that provides information aboutexercise intensity, not a pedometer, improved HbA1c levelin the initial period of exercise. The results suggest thatthe use of devices with functions that allow verificationof goal achievement in concrete terms contributes to thecontinuation of exercise therapy among patients.
Competing Interests
The authors declare no competing interests regarding thisstudy.
Acknowledgments
The authors thank Wakana Miura and Mayumi Kuriyamafor their help in the completion of this study. This studywas sponsored by theDivision ofNephrology, Endocrinologyand Metabolism, Department of Internal Medicine, TokaiUniversity School of Medicine, Japan (Grant no. 14F188139).
References
[1] American Diabetes Association, “Standards of medical care indiabetes—2011,” Diabetes Care, vol. 34, supplement 1, pp. S11–S61, 2011.
[2] A. Nicolucci, S. Balducci, P. Cardelli et al., “Relationshipof exercise volume to improvements of quality of life withsupervised exercise training in patients with type 2 diabetes ina randomised controlled trial: the Italian Diabetes and ExerciseStudy (IDES),” Diabetologia, vol. 55, no. 3, pp. 579–588, 2012.
[3] V. H. Myers, M. A. McVay, M. M. Brashear et al., “Exercisetraining and quality of life in individuals with type 2 diabetes,”Diabetes Care, vol. 36, no. 7, pp. 1884–1890, 2013.
Journal of Diabetes Research 7
[4] Y. Tamura, Y. Tanaka, F. Sato et al., “Effects of diet andexercise on muscle and liver intracellular lipid contents andinsulin sensitivity in type 2 diabetic patients,” Journal of ClinicalEndocrinology and Metabolism, vol. 90, no. 6, pp. 3191–3196,2005.
[5] Y. Sato,Diabetes ExerciseTherapy InstructionManual, Nankodo,2011.
[6] C. E. Garber, B. Blissmer, M. R. Deschenes et al., “Quantity andquality of exercise for developing and maintaining cardiorespi-ratory, musculoskeletal, and neuromotor fitness in apparentlyhealthy adults: guidance for prescribing exercise,”Medicine andScience in Sports and Exercise, vol. 43, no. 7, pp. 1334–1359, 2011.
[7] C. P. Wen, J. P. M. Wai, M. K. Tsai et al., “Minimum amountof physical activity for reduced mortality and extended lifeexpectancy: a prospective cohort study,” The Lancet, vol. 378,no. 9798, pp. 1244–1253, 2011.
[8] American Diabetes Association, “Physical activity/exercise anddiabetes,” Diabetes Care, vol. 27, supplement 1, pp. S58–S62,2004.