Research on Bituminous Pavements Using the Sand Equivalent Test R.H. CLOUGH and J. E. MARTINEZ, respectively, Dean, College of Engineerii^, and Associate Professor, Department of Civil Engineering, University of New Mexico •THIS PAPER describes a program of research on the sand equivalent test and on the correlation of sand equivalent number with asphaltie concrete performance which was performed at the University of New Mexico under a contract with the New Mexico State Highway Department. To obtain the widesi possible range of test values, the Highway Department furnished samples of hot-mix asphaltie concrete and hot-mix ag- gregate from projects located m every corner of the state. The first portion of the program involved a detailed study of the sand equivalent test itself. Included were investigations to determine the influence of significant factors such as the type of fine material, amount of fine material, and washing of the a^regate. Also included was an extensive program of testing directed at the correlation of sand equivalent values of an aggregate, before the addition of asphalt and after its extraction. The second part of the research program was devoted to the study of performance characteristics of asphaltie mixtures and their relationship to the sand equivalent values of the aggregates used for these mixtures. Performance of the asphaltie mixtures was measured in terms of Marshall stability and flow values after simulated weathering by soaking, by the swell characteristics of the mixtures, by the loss in weight caused by abrasion, and by visual examination of the stripping characteristics of the mixes. USE OF SAND EQUIVALENT TEST The sand equivalent test was designed to measure, on a volumetric basis, the amount and type of soil fines present in an aggregate in a manner which would indicate the detrimental effect of the fine material on the action of the aggregate under service conditions. The sand equivalent test has the advantages that it is quick to perform, requires only simple equipment which can be used with a minimum of training or ex- perience, and has seemingly yielded good results where it has been adopted as a specification test. On the basis of his extensive studies on the sand equivalent test, Hveem (2^) recom- mends that specifications prescribe the following minimum sand equivalent numbers: Minimum Sand Materials Equivalent Numbers Crusher run or gravel base materials 30 Aggregates and selected materials for road 35 mix bituminous treatment 35 Aggregates for plant mix bituminous surface 45 Aggregates for asphaltie concrete or Class 55 A plant mix 55 Concrete sand 80 The Arizona Highway Department evaluated the sand equivalent test on the basis of their own test methods and specifications; that is, screen analysis and plasticity index.
Transcript
Research on Bituminous Pavements Using the Sand Equivalent Test R.H. CLOUGH and J. E. MARTINEZ, respectively, Dean, College of Engineerii^, and Associate Professor, Department of Civil Engineering, University of New Mexico
•THIS PAPER describes a program of research on the sand equivalent test and on the correlation of sand equivalent number with asphaltie concrete performance which was performed at the University of New Mexico under a contract with the New Mexico State Highway Department. To obtain the widesi possible range of test values, the Highway Department furnished samples of hot-mix asphaltie concrete and hot-mix aggregate from projects located m every corner of the state.
The f i rs t portion of the program involved a detailed study of the sand equivalent test itself. Included were investigations to determine the influence of significant factors such as the type of fine material, amount of fine material, and washing of the a^regate. Also included was an extensive program of testing directed at the correlation of sand equivalent values of an aggregate, before the addition of asphalt and after its extraction.
The second part of the research program was devoted to the study of performance characteristics of asphaltie mixtures and their relationship to the sand equivalent values of the aggregates used for these mixtures. Performance of the asphaltie mixtures was measured in terms of Marshall stability and flow values after simulated weathering by soaking, by the swell characteristics of the mixtures, by the loss in weight caused by abrasion, and by visual examination of the stripping characteristics of the mixes.
USE OF SAND EQUIVALENT TEST The sand equivalent test was designed to measure, on a volumetric basis, the amount
and type of soil fines present in an aggregate in a manner which would indicate the detrimental effect of the fine material on the action of the aggregate under service conditions. The sand equivalent test has the advantages that i t is quick to perform, requires only simple equipment which can be used with a minimum of training or experience, and has seemingly yielded good results where i t has been adopted as a specification test.
On the basis of his extensive studies on the sand equivalent test, Hveem (2̂ ) recommends that specifications prescribe the following minimum sand equivalent numbers:
Minimum Sand Materials Equivalent Numbers
Crusher run or gravel base materials 30 Aggregates and selected materials for road
35 mix bituminous treatment 35 Aggregates for plant mix bituminous surface 45 Aggregates for asphaltie concrete or Class
55 A plant mix 55 Concrete sand 80
The Arizona Highway Department evaluated the sand equivalent test on the basis of their own test methods and specifications; that is, screen analysis and plasticity index.
Results from tests on a large number of base and mineral aggregate samples were summarized by O'Harra (5), as follows:
Sand Equivalent Quality of Materials 0 - 1 4 Unsatisfactory
" 24 Doubtful but usually unsatisfactory 2° - 34 Doubtful but usually satisfactory II - °4 Almost always satisfactory 55 - 99 Satisfactory
O'Harra also observed that sand equivalent values are affected by factors other than plasticity and gradation. He cited angularity, surface texture, and grain size of the minus No. 200 fraction as factors which can influence sand equivalent numbers. The conclusion reached by the Arizona study was that the sand equivalent test was useful in detecting the presence of excessive amounts of minus No. 200 material.
AGGREGATES USED The tests of this study were performed on a wide variety of New Mexico aggregates.
For convenience in the laboratory work, the aggregates tested and their asphaltic mixtures were divided into four categories. Aggregates lA through 9A (Table 1) were obtained from the hot bins of paving jobs in progress. Group IB through lOB (Table 2)
lOB 21 were aggregates taken f rom pits and stoclq)iles. Aggregates A and B were all separated into fractions and re-combined to satisfy the specification requirements of the particular paving projects where the aggregates were used. Materials IC through 7C (Table 3) were special aggregates. Number IC was a concrete sand and Nos. 2C through 7C were soil fines (minus No. 200) of varying activity and fineness which were used in the manufacture of the special D-series a^regates. Aggregates ID through 12D (Table 4) were artificially manufactured by mixing the same specially prepared coarse aggregate (plus No. 200) with different mixtures and amounts of fines (Nos. 2C through 7C). The specially prepared coarse aggregate was obtained by washing aggregate 2A on the No. 200 sieve, separating the retained material into fractions, and recombining as given in Table 4.
Went. No.
TABLE 3 AGGREGATE MATERIALS TESTED, SPECIAL AGGREGATES
Description Sand Equiv.
Value IC Concrete sand 92 2C Limestone dust, non-plastic
(minus No. 200) Limestone dust, non-plastic
(minus No. 200) 5 30 Rock flour, high-silica
(minus No. 200) 5 4C Red brick clay (minus No. 200) 0 5C Bentonite (ramus No. 200) 0 6C Rio Grande silty clay (minus
No. 200) 0 7C Rio Puerco silty clay (minus
No. 200) 0
TABLE 4 SPECIALLY MANUFACTURED AGGREGATE'
Percent Fines Ident. Soil Fine by Wt Sand Equiv. No. A ^ . (-No. 200) Value ID 4C 6.8 25 2D 5C 5.1 22 3D 2C 8.0 57 4D 3C 6.9 56
Sand Equivalent Test The several hundred sand equivalent determinations made during this study were
all performed in accordance with Hveem's "Suggested Method of Test for California Sand Equivalent" (6), and as used by The California State Department of Public Works (3). After dry sieving the aggregate through the No. 4 screen, test samples were obtained by the method of quartering.
Asphaltic Mixtures Asphalt mixtures lA through 9A were obtained directly from contractors' pugmills
at various New Mexico State Highway projects. It is to be noted again that the designation of asphaltic mixtures uses the same identifying numbers as the aggregates from which they were made. Asplialtic mixes IB through lOB were prepared in the laboratory using a mechanical mixer. Asphaltic mixtures ID through 12D were also prepared in the laboratory, a gradation being used which conformed to a U. S. Corps of Engineers specification for dense-graded surface course asphaltic concrete. Aggregates for mixtures ID through 12D were wetted and thoroughly mixed before heating and adding the asphalt so as to obtain a complete dispersal of fines and to allow them to reach a reasonably natural state of coating on the coarse particles. An 85-100 penetration asphalt cement was used for all asphaltic mixtures, both field and laboratory mixed.
Immersion-Stability Tests Nine briquettes of each asphaltic mix were molded by the Marshall method using
the specified procedure for heating, mixing, and compacting as described in Chapter n, Ref. 4. The briquettes, 2/4 in. high by 4 in. in diameter, were compacted by a meclianically driven hammer using 50 blows per side and using a mixture temperature of 275 F ± 5 F . These briquettes were then allowed to cure in air at room temperature for 24 hours. Three specimens from each mix were subjected to the standard Marshall stability test, including immersion in a 140 F water bath for not less than 20 nor more tlian 30 minutes before testing.
After curing, three briquettes of each mix were immersed in water at 120 F + 2 F for four days. At the end of this period the i^ecimens were weighed, soaked for 20 to 30 minutes in a 140 F bath, and then tested for Marshall stability. The final three samples of each mixture were immersed in water at room temperature (72 F to 82 F) for 14 days. At the end of this period the specimens were weighed, soaked for 20 to 30 minutes in a 140 F bath, and then tested for Marshall stability. These immersion tests were an adaptation of ASTM: D1075-54 (8), and of the immersion-stability test outlined by Swanberg and Hindermann (7).
Al l briquettes were weighed in air and weighed while immersed in water one day after molding. Again, after soaking but prior to testing for stability, the specimens were weighed in air in a wet (surface-dry) condition and while suspended in water.
Cold Water Abrasion Test This test was adapted from information given by Swanberg and Hindermann (7).
Eight briquettes, 2 in. in diameter by 2 in, in height, were molded from each mixture at 275 F f 5 F in Hubbard-Field molds. The quantity of material used for each briquette was computed in advance so tliat the density obtained would be the same as the average density obtained with the Marshall specimens used in the immersion-stability tests. Each briquette was formed by static conq)action to the desired height. Following compaction, the briquettes were allowed to cure in air at room temperature for a period of 24 hours, after which time the eight briquettes for each mix were weighed as a unit.
The briquettes were then immersed in a water bath at 120 F for four days, then weighed again in a wet (surface-dry) condition. The briquettes were then Immersed in water at 35 F for one hour after which they were placed in the cylinder of a Deval abrasion machine. The cylinder was filled with water at 35 F and the abrasion test run for 30 minutes at 33̂ /3 rpm. No steel balls were used, the tumbling of the briquettes themselves providing the only abrasive action. The temperature at the end of the tests ranged from 37 F to 42 F. The eight abraded briquettes of each mix were then weighed as a unit in a wet (surface-dry) condition. The percentage of weight loss due to abrasion was expressed in terms of the original weight.
Swell Tests The swell tests performed on the asphaltie mixes were conducted in accordance
with Method A of AASHO: TlOl-42 (1).
Stripping Tests This test was adapted from procedures used by the U. S. Corps of Engineers. About
1,000 grams of each asphaltie mixture was cured at room temperature for 24 hours. A Va-gallon jar was then filled not more than Vs ful l with the loose, uneompacted mix. The jar was then filled with distilled water and allowed to stand for 24 hours. The jar and contents were then moderately shaken for a 15-min period after which the water was poured off and the sample placed in a pan to dry. A visual qualitative examination was then made of the stripping that had occurred.
DATA AND RESULTS Sand Equivalent Investigations
An extensive program of tests was conducted to investigate the correlation of sand equivalent values of different aggregates before the addition of asphalt and after its extraction. For this study aggregates were used which displayed a maximum range of sand equivalent values. Samples of each aggregate were split into two fractions. At least six sand equivalent values were obtained by two different operators on the f i r s t portion. The second portion of the aggregate was mixed with asphalt, compacted into Marshall briquettes, and cured in air for 24 hours. These briquettes were then heated, broken apart, and the asphalt removed by the use of a solvent in a rotary extractor. Sand equivalent values were then obtained for the separated aggregates.
In studyii^ the variation between the values obtained before and after extraction, many different solvents and combinations of solvents were used. Benzene, methanol alcohol, acetone, ether, chloroform, tri-chlorethylene, detergent, carbon tetrachloride, carbon disulfide, xylene, sodium bicarbonate, and others were used with varying degrees of success in getting the extracted values to check closely with the raw values. No attempt is made to present all of the voluminous data obtained in these studies, but Table 5 gives a representative listing of these values which are of principal interest. Figure 1 also shows this information.
TABLE 5 SAND EQinVALENT V A L U E S B E F O R E AND A F T E R EXTRACTION OF ASPHALT
Extracted with benzene. Extracted with benzene, rinsed with methanol. ^Extracted with benzene, rinsed with acetone and sodium bicarbonate.
6
The initial extraction tests were performed in accordance with ASTM: D1097-54T (9). As Table 5 shows, the use of benzene solvent yielded a very poor comparison between raw and extracted sand equivalent values. At f i rs t i t was thought that a possible explanation for this might be the loss of fines which occurs during a rotary extraction, these fines being hurled out of the bowl and retained by the filter paper. To check this, a series of tests was performed on aggregates lA and 2A in which varying percentages of the minus No. 200 fraction of each aggregate were removed by dry sieving. The results of this investigation are shown in Figure 2. In obtaining the data for the two solid curves in Figure 2, minus No. 200 material was removed by sieving only. It is to be noted that information is also included concerning aggregates lA and 2A after being washed over the No. 200 sieve.
An additional study of this type was made in which the specially prepared coarse aggregate (plus No. 200) used for the D-aggregate series was mixed with varying amounts of aggregates 2C through 70 (minus No. 200). Figure 3 shows a plot of sand equivalent values versus percent of minus No. 200 fines by weight, in terms of the minus No. 4 material. Immersion-Stability Tests
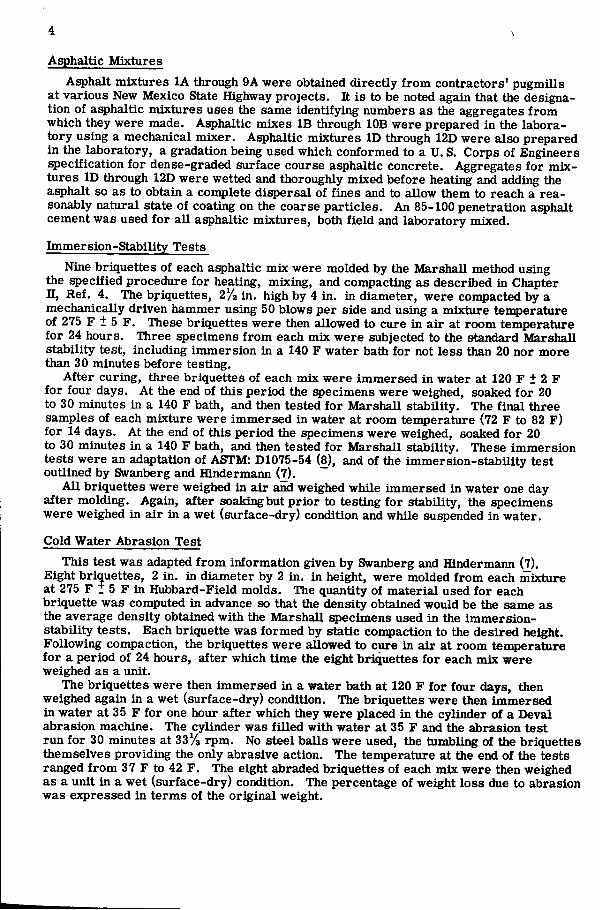
A summary of the results of the immersion-stability tests is given in Table 6 and is shown in Figures 4, 5, 6, and 7. Sand equivalent values for each aggregate are compared to the percent of Marshall stability retained after immersion at 120 F for 4 days, and to percent stability retained after immersion at room temperature for 14 days. Comparison is also made between sand equivalent numbers and percent increase in Marshall flow after immersion at 120 F for 4 days, and to precent increase in flow after immersion for 14 days at room temperature.
Data of the asphaltic mix designs used for the immersion-stability tests are given in Table 7. Density, voids, and asphalt content data were computed for each briguette
o
A
A
A
A * o
o ^ ^
LEGEND o A EXTRA
O RINSE
• R INSE
SOI
L INE
CTEO WITH B E N Z E N E
> IN METHANOL
} IN A C E T O N E AND
}IUM B I C A R B O N A T E
A EXTRA
O RINSE
• R INSE
SOI
L INE OF P E R F E C T COR R E L A T I O N
<9 %
a bJ (-o <
X
m
20 30 4 0 50 6 0 7 0 8 0 9 0
SAND EQUIVALENT NUMBER ( S T O C K P I L E AND HOTBIN AGGREGATE)
Figiire 1. Sand equivalent number of extracted aggregate.
ffi z
3
a z < 10
THIS POINT R E P R E S E N T S
A G G R E G A T E S lA AND
A F T E R W A S H I N G ON
Na 2 0 0 S I E V E
OBTAINED BY MIXING MINUS NO 2 0 0 MATERIAL
L I D B T A I N E D BY S I E V I N G ) WITH WASHED SAMPLE
AGGREGATE 2A
( ^ A G G R E G A T E
NOTES AGGREGATE 2A MINUS_Np 200 MATERIAL EQUALED
9 7 % OF MINUS NO 4 FRACTION
AGGREGATE lA MINUS NO 200 MATERIAL EQUALED
10 9 % OF MINUS NO 4 FRACTION
20 40 60 80 100
P E R C E N T OF THE MINUS NO 200 FRACTION RETAINED IN SAMPLE
Figure 2. Sand equivalent number compared to percent of minus No. 200 material retained in sample.
and were used for control and comparative purposes. These data are not included, herein, however.
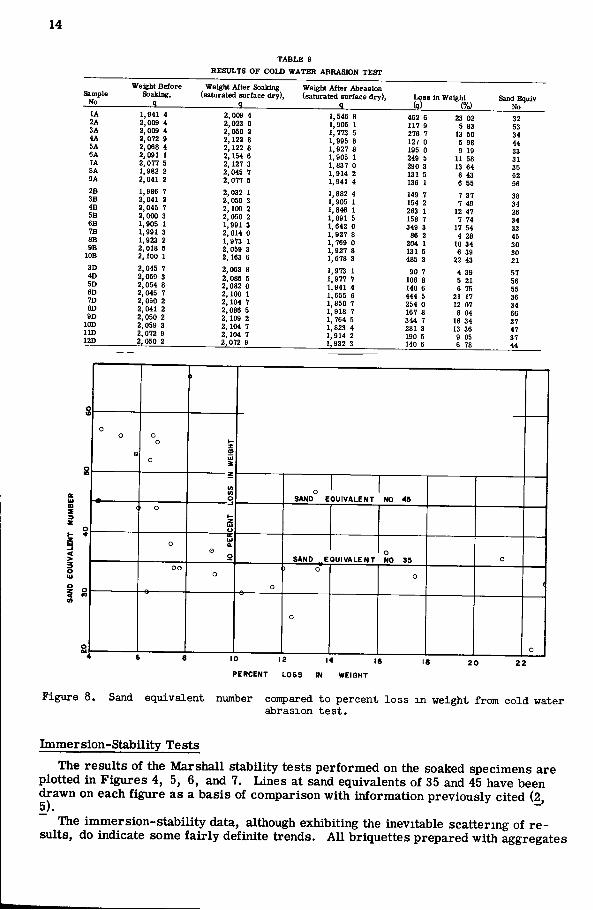
Cold Water Abrasion Tests Table 8 gives a summary of the results of the cold water abrasion tests. Figure 8
shows a plot of aggregate sand equivalent numbers against percent loss in weight from abrasion. As previously described, the asphaltic mixtures used in these tests were identical with those used in the immersion-stability tests, the only variation being the size of briquettes used.
Swell Tests Results of the swell tests are given in Table 9. Figure 9 shows these data with
sand equivalent number plotted E^ainst percent swell. As described under test procedures, the asphaltic mixtures used in the swell tests were the same as those used in the immersion-stability tests.
Stripping Tests Table 10 gives the results of the stripping tests. Aggregate 2A showed the least
amount of stripping of the samples tested. There was a small amount of stripping on the coarse fraction of aggregate 2A but a negligible amount on the fine portion. Aggregate 6A stripped extensively, especially in the minus No. 10 fraction. A considerable amount of stripping occurred in the coarse fraction of aggregate 3A with some of the larger particles being completely stripped. The fines in aggregate 3A were also severely stripped.
LEGEND F I L L E R MATER I
LIMESTONE OUST ROCK FLOUR RED BRICK CLAY BENTONITE RIO GRANDE SILTY CLAY RIO PUERCO S ILT AND CLAY S E NO. OF WASHED AGGREGATE
PERCENT OF FILLER (BY WEIGHT) TO MINUS NO 4 MATERIAL
Figure 3. Sand equivalent number for special coarse aggregate (+200) combined with various f i l l e r materials (-200).
TABLE 6 SUMMARY OF RESULTS OF IMMERSION, STABILITY TESTS
lOD 47 79.6 92.8 I ID 37 98.0 96.1 i?jr> 44 93.9 89.0
4 Days
Percent Increase in Flow,
Soakii^ Period 14 Days
81.5 14.3 25.0 42.8 13.9 66.7 0.0
36,7 44.4 36.4 12.1 25.0 6.8
65.8 20.9 64.3 -2.3 68.2
8.8 10.5 0.0
47.1 26.4 18.2 46.9 14.3 -5.4 8.3
129.6 25.0 37.5 21.4 19.4 60.0 8.8
40.0 55.5 66.7 6.1
37.5 2.3
81.6 11.6 54.8 4.6
43.2 112.9 139 35
5 0
11.8 10.5 -3.0 34.4 28.6 2.7
30.6
DISCUSSION OF RESULTS
Correlation of Sand Equivalent Values As given in Table 5, the use of benzene alone for asphalt extraction produced a
poor correlation between the extracted and raw sand equivalent values. The extracted values were invariably greater than for the ordinal aggregate. The amount of variation between the two values depended on the aggregate, the spread being large for low sand equivalent values and negligible for those aggregates with high values. The use of methanol as a rinse after the benzene extraction was found to improve the correlation, although the spread of values between the raw and extracted aggregates remained substantial. The data obtained using benzene and methanol were used to derive an approximate relationshq) between extracted and raw values as follows:
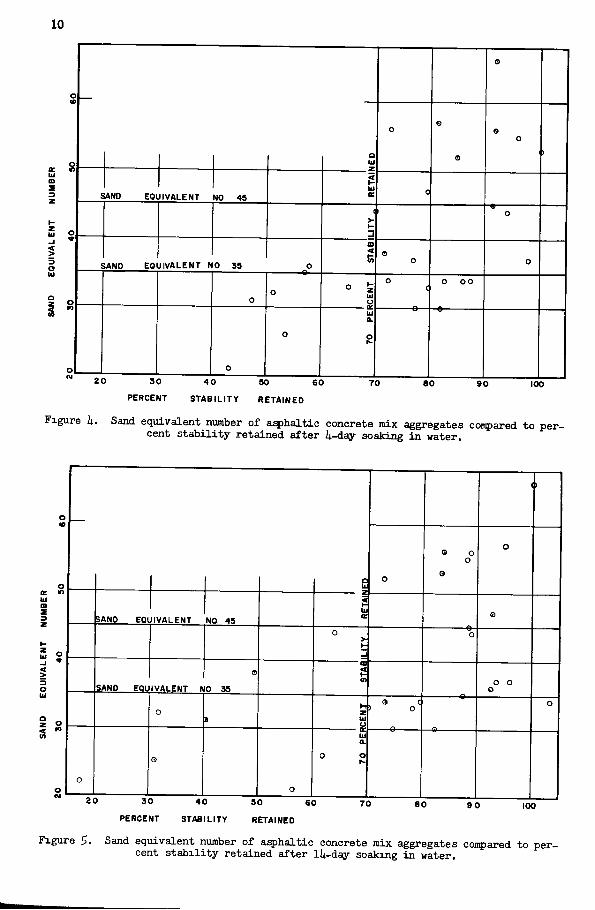
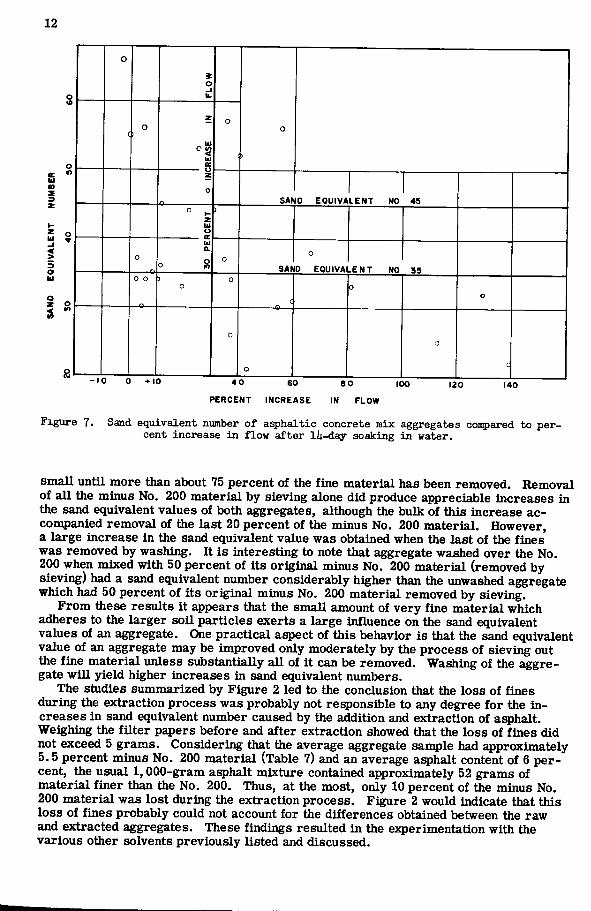
Figure 6. Sand equivalent number of asphaltic concrete mix aggregates compared to percent increase i n flow after U-day soaking in water.
In tests where methanol was used, the aggregate was soaked for about one hour in this chemical which was then removed by rotary extraction. The aggregate was then air dried at room temperature until the alcohol had all evaporated.
As previously mentioned, many chemicals in several combinations were tried in an attempt to secure a better correlation between raw and extracted sand equivalent values. Of these, only the use of acetone and sodium bicarbonate wi l l be discussed because this combination proved to yield the best results. Although the gap between sand equivalent values was never entirely eliminated, extraction with benzene followed by a rinsing with acetone and sodium bicarbonate did achieve a reasonably good check (Table 5). After extraction with benzene, the ^gregates were soaked approximately one hour in a mixture of acetone and a water solution of sodium bicarbonate. This solvent was then removed by the rotary extractor, and the aggregate was allowed to air dry at room temperature. It is to be noted that close duplication of results using the benzene, acetone, and sodium bicarbonate proved to be difficult with some scattering of values being in evidence.
Variation of Sand Equivalent Number with Amoimt of Minus No. 200 Material Present
Because the extracted sand equivalent values were always higher than the original raw numbers, i t was believed at f i r s t that this might be a result of the loss of fines from the aggregate during the rotary extraction process. This led to the studies summarized in Figures 2 and 3. Figure 2 summarizes the results obtained from a series of tests which determined the sand equivalent values of two aggregates during a process of varyi i^ the amounts of minus No. 200 material present.
From Figure 2 i t is noted that the increase in sand equivalent value is relatively
12
IE 111 a
0
FL
OW
c o
1
:REA
SE
IN
o o
z
0
o SA^ D E Q U I V A L E N T NO 45
0
RC
EN
T )
o
&
iij a.
8 0 SAK
o
0 EOUIVA L E N T NO 35 0 0
— o —
3 0
0
<
0 o
0
o
0
c
P E R C E N T I N C R E A S E IN FLOW
Figure 7. Sand equivalent number of asphaltic concrete mix aggregates compared to percent increase in flow after lli-day soaking in water.
small until more than about 75 percent of the fine material has been removed. Removal of all the minus No. 200 material by sieving alone did produce appreciable increases in the sand equivalent values of both aggregates, although the bulk of this increase accompanied removal of the last 20 percent of the minus No. 200 material. However, a large increase in the sand equivalent value was obtained when the last of the fines was removed by washing. I t is interesting to note that aggregate washed over the No. 200 when mixed with 50 percent of its original minus No. 200 material (removed by slevii^) had a sand equivalent number considerably higher than the unwashed a^regate which had 50 percent of its original minus No. 200 material removed by sieving.
From these results i t appears that the small amount of very fine material which adheres to the larger soU particles exerts a large influence on the sand equivalent values of an aggregate. One practical aspect of this behavior is that the sand equivalent value of an aggregate may be improved only moderately by the process of sieving out the fine material unless substantially all of i t can be removed. Washing of the aggregate wi l l yield h^her increases in sand equivalent numbers.
The studies summarized by Figure 2 led to the conclusion that the loss of fines during the extraction process was probably not responsible to any degree for the increases in sand equivalent number caused by the addition and extraction of asphalt. Weighing the filter papers before and after extraction showed that the loss of fines did not exceed 5 grams. Considering that the average aggregate sample had approximately 5.5 percent minus No. 200 material (Table 7) and an average asphalt content of 6 percent, the usual 1,000-gram a^halt mixture contained approximately 52 grams of material finer than the No. 200. Thus, at the most, only 10 percent of the minus No. 200 material was lost during the extraction process. Figure 2 would indicate that this loss of fines probably could not account for the differences obtained between the raw and extracted aggregates. These findings resulted in the experimentation with the various other solvents previously listed and discussed.
lOD 68.0 30.0 8.0 6.0 I ID 68.0 30,0 8.0 6.0 12D 68.0 30,0 8.0 6.0
^All aggregates: 100 percent passing 3A i n . j asphalt: 85-100 penetration A.C.
Influence of Type and Amount of Filler on Sand Equivalent Value The special coarse aggregate prepared for the D-series aggregates was used as
the basic material in this series of sand equivalent tests performed to determine the effect of type and amount of fine material (minus No. 200) on the sand equivalent value. Six different f i l ler materials were used, varying from extremely active ben-tonite to an inert rock flour consisting of crusher dust. Figure 3 shows the large variation in sand equivalent values of a given coarse material when mixed with different f i l lers . From Figure 3 i t is apparent that the sand equivalent number is not only dependent on the type of fine material, but also on the relative amount present. It wi l l be noted that only about 2 percent, by weight, of bentonite reduced the sand equivalent value to 35, whereas approximately 12 percent of either the Rio Grande or Rio Puerco silty clay was required to accomplish the same reduction. Less than 2 percent of bentonite reduced the sand equivalent to 45, yet i t required about 17 percent of limestone dust to produce the same change.
14
T A B L E 8
R E S U L T S O F C O L D W A T E R ABRASION T E S T
Figure 8. Sand equivalent number compared to percent loss m weight from cold water abrasion tes t .
Immersion-Stability Tests
The results of the Marshall stability tests performed on the soaked specimens are plotted in Figures 4, 5, 6, and 7. Lines at sand equivalents of 35 and 45 have been drawn on each figure as a basis of comparison with information previously cited (2, 5).
The immersion-stability data, although exhibiting the inevitable scattermg of results, do indicate some fair ly definite trends. Al l briquettes prepared with aggregates
having sand equivalent values of 45 or higher retained a relatively high percentage of stability (70 percent or higher) after being subjected to the action of the water. The retained strength value of 70 percent is used here merely as a guide. A. T. Gioldbeck (7) suggests that 70 percent of retained strength in the immersion-stability tests would probably be indicative of satisfactory performance in the field. Only two aggregates with sand equivalent numbers of 35 or higher retained less than 70 percent of stability. More than one-half of the aggregates with sand equivalent values between 30 and 35 retained 70 percent or more of their stability after immersion. No aggregates with numbers below 30 retained as much as 70 percent of their stability.
Although a trend is mdicated by the Marshall flow data, i t is difficult to establish criteria in terms of flow or percent increase in flow which wil l act as dividing lines between satisfactory and unsatisfactory performance. A line at 30 percent increase in flow as a result of immersion has been drawn for comparative purposes. From Figures 6 and 7 it may be seen that approximately 25 percent of the asphalt briquettes prepared from aggregates with sand equivalent numbers 45 or higher exhibited more than a 30 percent increase in flow. Similarly, about 50 percent of the aggregates with sand equivalent numbers between 35 and 45 showed a flow increase of 30 percent or
more, and approximately 55 percent of the a^regates with sand equivalents less than 35 had a flow increase of more than 30 percent. Although no supporting data are available, i t is suggested that a maximum increase in Marshall flow of 30 is a reasonable measure of satisfactory performiance of an asphaltic mixture with regard to resistance to water effects.
Cold Water Abrasion Tests The data of the cold water abrasion
tests (Fig. 8), illustrate the same general trend as did the data of the immersion-stability tests (Figs, 4, 5, 6, and 7). Both the immersion-stability and the cold water abrasion tests showed that asphalt briquettes made from ^^regates
with sand equivalent values of 45 or h^her possessed good performance characteristics. A line is drawn on Figure 8 at 10 percent loss in weight. This line does not represent a recommended value but is used, rather, for a comparison of test values. A study of Figure 8 shows that the percentage of the asphaltic mixtures showing than a 10 percent loss in weight increases as the sand equivalent values decrease. For sand equivalent values of 45 or higher, about 11 percent of the mixtures exhibited a loss in weight greater than 10 percent. This percentage is approximately 43 percent for sand equivalent numbers between 35 and 45, and about 65 percent for sand equivalent values less than 35.
Swell Tests The amounts of swell indicated in Figure 9 are small for all mixtures tested. In
general, however, asphaltic* mixtures prepared from aggregates with higher sand equivalent values exhibited less swell than those from aggregates with lower sand equivalent values. Al l briquettes whose sand equivalent values were 35 or higher indicated less than 0.25 percent. In Figure 9 a line is drawn along a swell of 0.25 percent for comparative purposes.
Strippii^ Tests
The results of the stripping tests (Table 10) showed an almost direct correlation between sand equivalent value and resistance to stripping. High values exhibited the most pronounced resistance to stripping. It is recognized that an insufficient number of stripping tests were performed and not enough different aggregates were used to justify any general conclusions. Within the limitations of the data presented, however, the correlation is very pronounced and could have great practical significance. Because of time limitations on the studies, no tests were made on the various aggregates to determine their hydrophobic or hydrophyllic characteristics.
CONCLUSIONS The data of this program of tests would suggest that Hveem's recommended minimum
sand equivalent values for asphaltic mixtures may be somewhat conservative. In combination with gradation and other specification requirements, there is little doubt that Hveem's minimum values wi l l insure the use of high quality materials. However, this study would indicate that adherence to Hveem's values would rule out the use of many New Mexico aggregates whose performance seems to be very acceptable accordii^ to these research findings. It is probable that this same situation would be encountered in other areas of the United States.
These studies also provided an extraction process which yielded a reasonably good correlation between sand equivalent values of an aggregate before and after the extraction of asphalt. No studies were made of the correlation of other factors such as plasticity index, but on the basis of a few tests which are not reported herein, i t is believed that extraction by benzol and rinsing with acetone and sodium bicarbonate would yield a reasonably good check. This extraction procedure does make i t possible to determine f rom an ai^haltic mixture sample a reasonably accurate indication of the sand equivalent value of the aggregate actually used.
ACKNOWLEDGMENT It is desired to acknowledge the efforts and contributions of John P, Boyd, Delmar
E, Calhoun, and James L, Cramer who conducted most of the experimental work and assembled the data reported herein.
REFERENCES 1. "Highway Materials, Tests, Part H . " AASHO (1955). 2. Hveem, F. N . , "Sand-Equivalent Test for Control of Materials During Con
struction." HRBProc , 32:238-250 (1953). 3. "Materials Manual, Volume L " Test Method No. Calif. 217-C State of California,
Dept. of Public Works, Division of Highways. 4. "Mix Design Methods for Hot-Mix Asphalt Paving," First Ed,, The Asphalt In
stitute (April 1956), 5. O'Harra, W,G,, "Evaluation of the California Sand-Equivalent Test," HRB Proc.,
34:297-300 (1955), 6. "Procedures for Testing Soils." ASTM {April 1958). 7. "Symposium on Accelerated Durability Testing of Bituminous Materials." S^ec.
Tech. Publ. No. 94, ASTM (Feb. 1950). 8. "Effect of Water on Cohesion of Compacted Bituminous Mixtures," ASTM: D1075-54. 9. "Bitumen Content of Paving Mixtures by Centrifuge." ASTM: D1097-54T.


![Study of Bituminous Intersection Pavements in Texasonlinepubs.trb.org/Onlinepubs/trr/1991/1300/1300-006.pdf · Study of Bituminous Intersection Pavements in Texas ]OE w. BUTTON, DARIO](https://static.documents.pub/doc/80x56/5b28a87c7f8b9a3c0c8b49f6/study-of-bituminous-intersection-pavements-in-study-of-bituminous-intersection.jpg)


