Research progress on cryogenic mixed-gases Joule-Thomson refrigeration in TIPC of CAS Maoqiong GONG Technical Institute of Physics and Chemistry (TIPC) Chinese Academy of Sciences (CAS) Email: [email protected]Tel/Fax: 86-10-82543728
Transcript
Research progress on cryogenic
mixed-gases Joule-Thomson refrigeration
in TIPC of CAS
Maoqiong GONG
Technical Institute of Physics and Chemistry (TIPC)
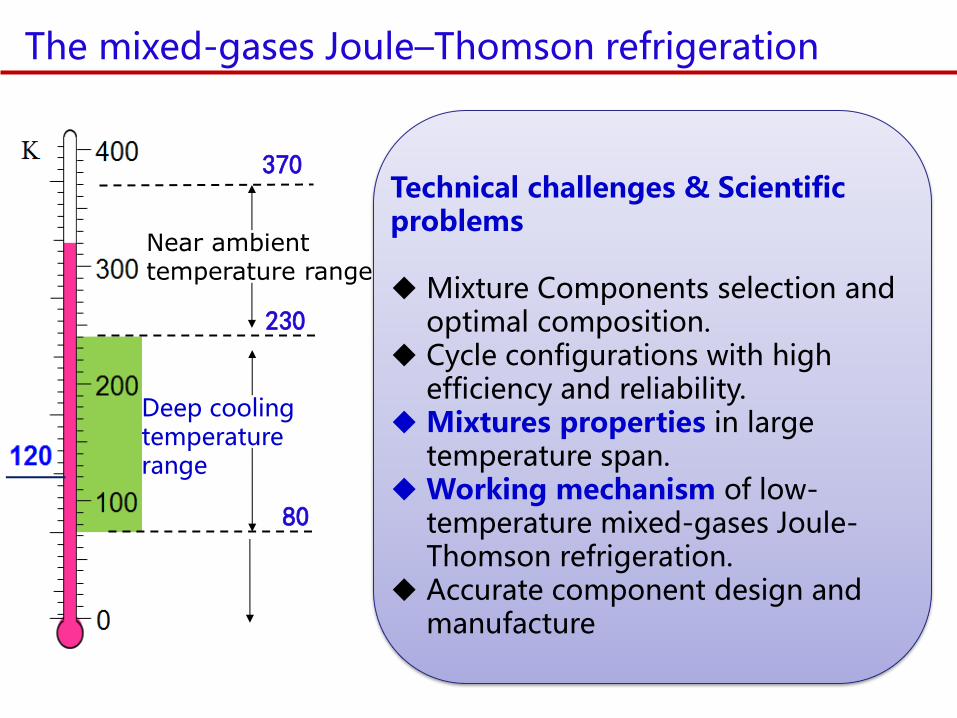
Influence of pressures and temperatures on pure substance throttling effects
Isothermal J-T effect
50
100
150
200
250
T(K)
0
0.5
1
1.5
2
P(MPa)
0
1,000
2,000
3,000
4,000
5,000
6,000
7,000
0
1,000
2,000
3,000
4,000
5,000
6,000
7,000
50
100
150
200
250
T(K)
0
0.5
1
1.5
2
P(MPa)
0
10
20
30
40
50
60
70
0
10
20
30
40
50
60
70
50 100 150 200 250 300
T(K)
-10
0
10
20
30
40
50
60
70
80
inte
gra
ted
JT
eff
ec
t (K
)
mix.1
mix.2
mix.3
50 100 150 200 250 300
T(K)
-2,000
0
2,000
4,000
6,000
8,000
10,000
12,000
14,000
iso
the
rma
l J
T e
ffe
ct(
J/m
ol)
mix.1
mix.2
mix.3
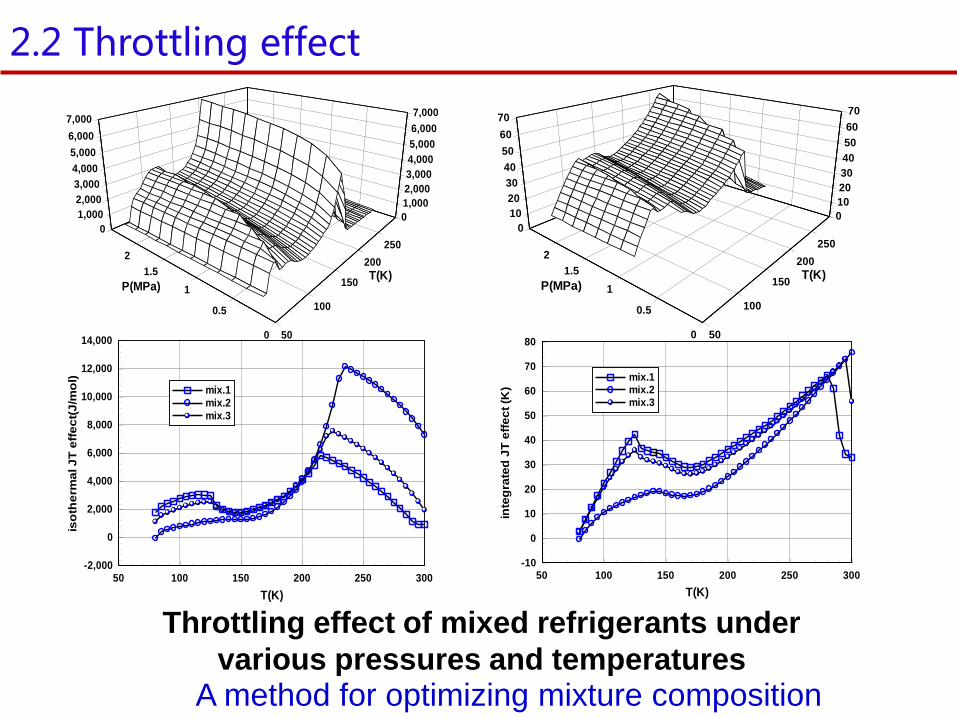
A method for optimizing mixture composition
Throttling effect of mixed refrigerants under
various pressures and temperatures
2.2 Throttling effect
The minimum isothermal throttling effect of the
optimized mixture in the whole temperature range is
larger than that of any pure component, which is the
reason that mixed refrigerants could increase the
thermal efficiency of the MJTR cycle.
2.2 Throttling effect
90 120 150 180 210 240 270 3000
5
10
15
20
25 iC5H
12
iC4H
10
C3H
8
C2H
6
CF4
CH4
N2
pH=2.0 MPa
pL=0.1 MPa
h
T (
kJ/m
ol)
T (K)
mixture
A)
90 120 150 180 210 240 270 300 330 3600
10
20
30
40
50
60
70
80
90
100
N2
CH4
CF4
C2H
6
C3H
8
iC4H
10
iC5H
12
pH=2.0 MPa
pL=0.1 MPa
T
h (
K)
T (K)
mixture
B)
2.3 Components selection
Selecting component to make their effective throttle effect
temperature range cover each other (relaying) in
temperatures ranging from ambient to the target.
Physical and chemical stability, impact on the environment
(ODP, GWP), as well as economic factor, etc.
No. Components Boiling points(K) Temperature zone
1 He, Ne 4.2, 27.0 Low temperature zone
2 N2, Ar 77.4, 87.3 Normal temperature zone
3 CH4 111.7 Low-medium temperature zone
4 CF4 145.2 Low-medium temperature zone
5 C2H4, C2H6 169.4, 184.6 Medium temperature zone
6 C3H8, C3H6, iC4H10 231.04, 225.53, 261.4 Medium-high temperature zone
7 iC5H12 300.98 High temperature zone
Components selection for liquid nitrogen temperature refrigeration
3. Behaviors of the recuperative heat exchangers and two-phase
heat transfer study
Vapor Compression
Recuperator
Evaporator
After
cooler
Recuperative heat exchanger is a critical component of mixed-refrigerant J-T refrigerator.
Recuperative heat exchanger is the biggest difference between mixed-gases J-T refrigeration cycle and the vapor compression cycle in terms of hardware.
3.1 Experimental research on the operation features of tube-in-tube recuperative heat exchanger
3.1 Experimental research on the operation features of tube-in-tube recuperative heat exchanger
0 1 2 3 4 5150
175
200
225
250
275
300
A)
B)
TL
_A
TH
_A
TL
_B
TH
_B
T (
K)
lx (m)
1 2 3 4 5 6 7 8 9 100
300
600
900
1200
n
HT
C (
W/m
2K
) /
HE
AT
(W
)
HTC
HEAT
0
2
4
6
8
10
12
14
A)
AL
MT
D (
K)
ALMTD
1 2 3 4 5 6 7 8 9 100
300
600
900
1200
1500
B)
n
HT
C (
W/m
2K
) / H
EA
T(W
) HTC
HEAT
0
5
10
15
20
ALM
TD
(K
)
ALMTD
Built a special HX with 10
sections to measure:
temperature and
pressure distribution
Overall heat transfer
coefficients
The locations of pinch points. The distribution of heat load versus the temperature.
0 1 2 3 4 550
100
150
200
250
300
A3
pH
pL
T (
K)
lx (m)
0 1 2 3 4 5100
150
200
250
300
A4
pH
pL
T (
K)
lx (m)
1 2 3 4 5 6 7 8 9 100
60
120
180
240
300
A3
n
HT
C (
W/m
2K
) /
Q (
W) HTC
Q
0.0
3.2
6.4
9.6
12.8
16.0
AL
MT
D (
K)
ALMTD
1 2 3 4 5 6 7 8 9 100
140
280
420
560
700
A4
nH
TC
(W
/m2K
) /
Q (
W)
HTC
Q0
3
6
9
12
15
18
AL
MT
D (
K)
ALMTD
The mixture composition determines:
3.1 Experimental research on the operation features of tube-in-tube recuperative heat exchanger
Complicated heat and mass transfer process in the recuperator.
Flow-boiling
Flow-condensation
3.2 Researches on two-phase heat transfer of mixed-refrigerants
0 2 4 6 8 100
2
4
6
8
10
Palen&Small [22]
Jungnickel et. al [23]
Thomes&Shakir [24]
Fujita&Tsutsui [25]
Inoue et. al [26]
Calc
ula
ted r
esults (
kW
m-2
K-1)
Measured data(kW m-2K-1)
-25%
+25%
3.2 Researches on two-phase heat transfer Pool-boiling
Refrigerant tank
Keithley
2700
GC
1
2
5
4
3
Vacuum
pump
Cold lightHigh speed
camera
DC regulator
Compressor
DC regulator
scale
Computer
Pool-boiling experiments.
Covering 80~300 K.
Components of natural gas,
pure substances and mixtures.
Cooling
loop
Δp
DC Regulator 1
ΔppT
T
DC Regulator 2
Preheater
Vacume pump
T T T
pCharging port
Heat
exchanger
Liquid
reservoir
Throttling
valve
C
Maganetic
gear pump
Sight glass
Heat transfer test section
Adiabatic pressure drop test section
Vacume chamber
Sight glass
SENSORS
C:coriolis mass flow meter
T: resistances thermometer
p: absolute pressure sensor
Δp: differential pressure sensor
Throttling
valve
Researches on two-phase flow boiling heat transfer and flow characteristics.
Covering 100~300 K.
Components of natural gas,
pure substances and mixtures.
3.2 Researches on two-phase heat transfer Flow-boiling
0.875 0.714 0.230Re ( ) 0.92 0.45Ltp
kh BoK Co
D
New correlation of flow boiling
heat transfer coefficients:
0 3 6 9 120
3
6
9
12
R290
R152a
R170
Pre
dic
ted h (
kW
.m-2
.K-1)
Experimental h (kW.m-2.K
-1)
+20%
-20%
In the literature (Cryogenics
57,2013,18-25) on LNG heat
transfer, our correlation was proven
the best one with the smallest
deviation.
…the best correlation…
3.2 Researches on two-phase heat transfer Flow-boiling
Δp
ΔppT
T T T T
p
C
T T
p
TT
Vacume pump
Vacume chamber
Cooling
loop 2
Cooling
loop 1Heat
exchanger
Magnetic-
driven pump
Throttling
valve
Reservoir
DC Regulator
Preheater Sight glass Sight glass
Heat transfer test section
Adiabatic pressure drop section
SENSORS
C:Coriolis mass flow meter T: resistances thermometer
(1) Compression, throttling and evaporation processes Higher high-boiling component fraction leads to a smaller compressibility factor and a lower compressor inlet temperature, reducing the compression power consumption. Lower temperature before throttling results in smaller exergy loss
(2)Recuperative process
When the fraction of one component gets larger, the intrinsic temperature difference in the relevant temperature zone would increase, as well as the exergy loss.
0 5 10 15 20100
150
200
250
300
PL
PH
T (
K)
QHX
(kJ/mol)
0 5 10 15 20100
150
200
250
300
PL
PH
T (
K)
QHX
(kJ/mol)
More high-boiling components Optimized Composition More low-boiling and middle-
boiling components
0 3 6 9 12 15 18100
150
200
250
300
PL
PH
T (
K)
QHX
(kJ/mol)
Optimization results: The single-stage mixed-gases J-T cycle could achieve a theoretical cycle efficiency of 63% (relative Carnot efficient).
Various configurations of mixed refrigerant J-T cycle
4.2 The influence of cycle configuration
DEACDEHX2DEJT1DBLEND
DEHX3DEJT2DEEVCEF
One phase separator Relative Carnot efficiency of 62.5%
DEAC
DEJT1
DEJT2
DEHX1
DEHX2
DEHX3
DBLEND1
DBLEND
DEJT3
DEEV
CEF
Two phase separators Relative Carnot efficiency of 61.5%
4.2 The influence of cycle configuration
DEAC
DEHX
DEJT
DEEV
CEF
63%
10%
9.5%
8.5%
9%
No phase separator Relative Carnot efficiency of 63%
Conclusions of thermodynamic analysis
Different cycle configurations could reach close performances under each optimal conditions, while the single-stage cycle with the most simple structure could achieve the best performance in the thermodynamic point of view .
Cycle configuration is the external factor while mixture is internal factor. Effective refrigeration could be achieved by matching the external and internal factors.
5. Composition shift
5.1 Composition shift characteristics of mixed refrigerants
0 10 20 30 40 50 60 70 80 90 100-100
-50
0
50
100
150
200
250
R
N2
CH4
C2H
6
C3H
8
iC4H
10
iC5H
12
T=300 K
p=101.3 kPa
Roil
, %
Rj,
%
0
25
50
75
100
R,
%
Composition shift characteristics of mixtures.
Circulation concentration changes from the original charged data in MJTRs
Two factors: liquid holdup and solution with oil
5.2 Composition shift caused by liquid holdup
1 2 3 4 5 6 7 8-100
-50
0
50
100
150
200
250
300
N2
CH4
C2H6
C3H8
iC4H10
Sampling Point
R /
%
120
150
180
210
240
270
300
T /
K
140 160 180 200 220-70
-60
-50
-40
-30
-20
-10
0
10
20
30
40
50
R /
%T /K
N2
CH4
C2H6
C3H8
iC4H10
Oil-free compressor liquid holdup
5.3 Composition shift caused by solubility in lubricants
21
11
nn
nx
PTv
v
PTv
VV
PTv
V
PTv
V
PTv
V
n
v
gasabs
v
cellcell
pump
v
pump
endend
v
begbeg
v
,1
,,,,
1
,
1
,2
11
bottle
1
bottle
1
Solubility:
Gas-liquid phase equilibria
Composition shift caused by the solubility in lubricants.
5.4 Composition shift characteristics
Problems caused by composition shift
Decreasing the concentration of high-boiling components
Reduce cycle performance.
Measures to reduce or eliminate the influences 1) The deep oil separation in compressor unit 2) Increasing volume ratio for warm to cold sections 3) Increasing charging quantity
6. Performance and application of cryogenic MJTR
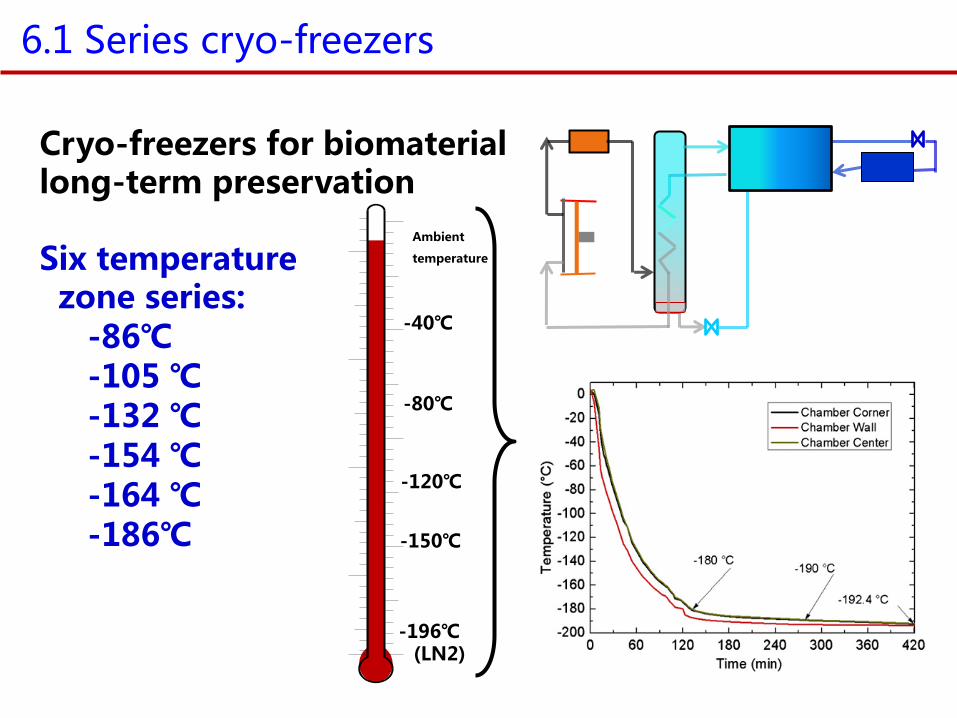
6.1 Series cryo-freezers
Ambient
temperature
-40℃
-80℃
-150℃
-196℃ (LN2)
-120℃
Cryo-freezers for biomaterial long-term preservation Six temperature zone series: