26
Research Report No. 2004-4 Understanding What SAT Reasoning Test ™ Scores Add to High School Grades: A Straightforward Approach Brent Bridgeman, Judy Pollack, and Nancy Burton

Research Report No. 2004-4
Understanding What SAT Reasoning Test™ Scores Add to High School Grades: A Straightforward Approach
Brent Bridgeman, Judy Pollack, and Nancy Burton

College Entrance Examination Board, New York, 2004
College Board Research Report No. 2004-4ETS RR-04-40
Brent Bridgeman, Judy Pollack, and Nancy Burton
Understanding What SAT Reasoning Test™
Scores Add to High School Grades:
A Straightforward Approach
Brent Bridgeman is principal research scientist at Educational Testing Service.
Judy Pollack is director, research at Educational Testing Service.
Nancy Burton is senior research scientist at Educational Testing Service.
Researchers are encouraged to freely express their professional judgment. Therefore, points of view or opinions stated in College Board Reports do not necessarily represent official College Board position or policy.
The College Board: Connecting Students to College Success
The College Board is a not-for-profit membership association whose mission is to connect students to college success and opportunity. Founded in 1900, the association is composed of more than 4,500 schools, colleges, universities, and other educational organizations. Each year, the College Board serves over three million students and their parents, 23,000 high schools, and 3,500 colleges through major programs and services in college admissions, guidance, assessment, financial aid, enrollment, and teaching and learning. Among its best-known programs are the SAT®, the PSAT/NMSQT®, and the Advanced Placement Program® (AP®). The College Board is committed to the principles of excellence and equity, and that commitment is embodied in all of its programs, services, activities, and concerns.
For further information, visit www.collegeboard.com.
Additional copies of this report (item #040481304) may be obtained from College Board Publications, Box 886, New York, NY 10101-0886, 800 323-7155. The price is $15. Please include $4 for postage and handling.
Copyright © 2004 by College Entrance Examination Board. All rights reserved. College Board, Advanced Placement Program, AP, SAT, and the acorn logo are registered trademarks of the College Entrance Examination Board. Connect to college success and SAT Reasoning Test are trademarks owned by the College Entrance Examination Board. PSAT/NMSQT is a registered trademark of the College Entrance Examination Board and National Merit Scholarship Corporation. Other products and services may be trademarks of their respective owners. Visit College Board on the Web: www.collegeboard.com.
Printed in the United States of America.
AcknowledgmentsWe are very grateful for the hard work of the staff in the colleges who collected and organized the grade information for the database used in this study. Thanks also to staff at the College Board, especially Amy Schmidt, who supported this massive effort from its inception.

Contents
Abstract . . . . . . . . . . . . . . . . . . . . . . . . . . . . . . . . . . . . . 1
Introduction . . . . . . . . . . . . . . . . . . . . . . . . . . . . . . . . . 1
Method . . . . . . . . . . . . . . . . . . . . . . . . . . . . . . . . . . . . . 1
Sample . . . . . . . . . . . . . . . . . . . . . . . . . . . . . . . . . . . 1
Analysis Categories . . . . . . . . . . . . . . . . . . . . . . . . . 2
College selectivity level . . . . . . . . . . . . . . . . . . . . 2
Academic intensity . . . . . . . . . . . . . . . . . . . . . . . 3
High school grade point average . . . . . . . . . . . . 3
SAT® scores. . . . . . . . . . . . . . . . . . . . . . . . . . . . . . 4
Results and Discussion . . . . . . . . . . . . . . . . . . . . . . . . . 4
Predictors of Success in the Freshman Year . . . . . . 4
Predictors of Success Over Four Years in College. . . . . . . . . . . . . . . . . . . . . . . . . . . . . . . . . 5
Effects of Using Narrower SAT Score Bands for Predicting Freshman CGPA . . . . . . . . . . . . 8
Conclusions . . . . . . . . . . . . . . . . . . . . . . . . . . . . . . . . . . 9
References . . . . . . . . . . . . . . . . . . . . . . . . . . . . . . . . . .10
Appendix . . . . . . . . . . . . . . . . . . . . . . . . . . . . . . . . . . .11
Tables 1. Participating Colleges by College
Selectivity Level. . . . . . . . . . . . . . . . . . . . . . . . . . . . 2
2. Percent of Students at Each Academic Intensity Level for Each College Level. . . . . . . . . 3
3. Percent of Students at Each HSGPA Category for Each College Level . . . . . . . . . . . . . . . . . . . . . . 3
4. Percent of Students at Each SAT Level for Each College Level . . . . . . . . . . . . . . . . . . . . . . . . . 4
5. Freshman Success Rates in Level 1 Colleges by SAT Score Level for Students in the Same HSGPA Category and Academic Intensity Level . . . . . . . . . . . . . . . . . . . . . . . . . . . . . . . . . . . . . 4
6. Freshman Success Rates in Level 1 Colleges by SAT Score Level (and Sublevels) for Students in the Same HSGPA Category and Academic Intensity Level . . . . . . . . . . . . . . . . . . . . . . . . . . . . . 9
7. Range of Freshman Success at Four Levels of College Selectivity. . . . . . . . . . . . . . . . . . . . . . . . . . 9
A1. Number and Percent Achieving a 3.5 or a 2.5 CGPA at the End of Freshman Year by College Level, HSGPA Category, Academic Intensity, and SAT Level . . . . . . . . . . 11
A2. Number and Percent Achieving a 3.5 or a 2.5 CGPA at the End of Senior Year by College Level, HSGPA Category, Academic Intensity, and SAT Level . . . . . . . . . . 16
Figures 1. Level 1 colleges: Percent of class with
freshman CGPA of 2.5 or higher . . . . . . . . . . . . . 5
2. Level 1 colleges: Percent of freshmen with CGPA of 2.5 or higher by the first two levels of academic intensity, HSGPA, and SAT score . . . . . . . . . . . . . . . . . . . . . . . . . . . . . 6
3. Level 1 colleges: Percent of class with freshman CGPA of 3.5 or higher . . . . . . . . . . . . . 6
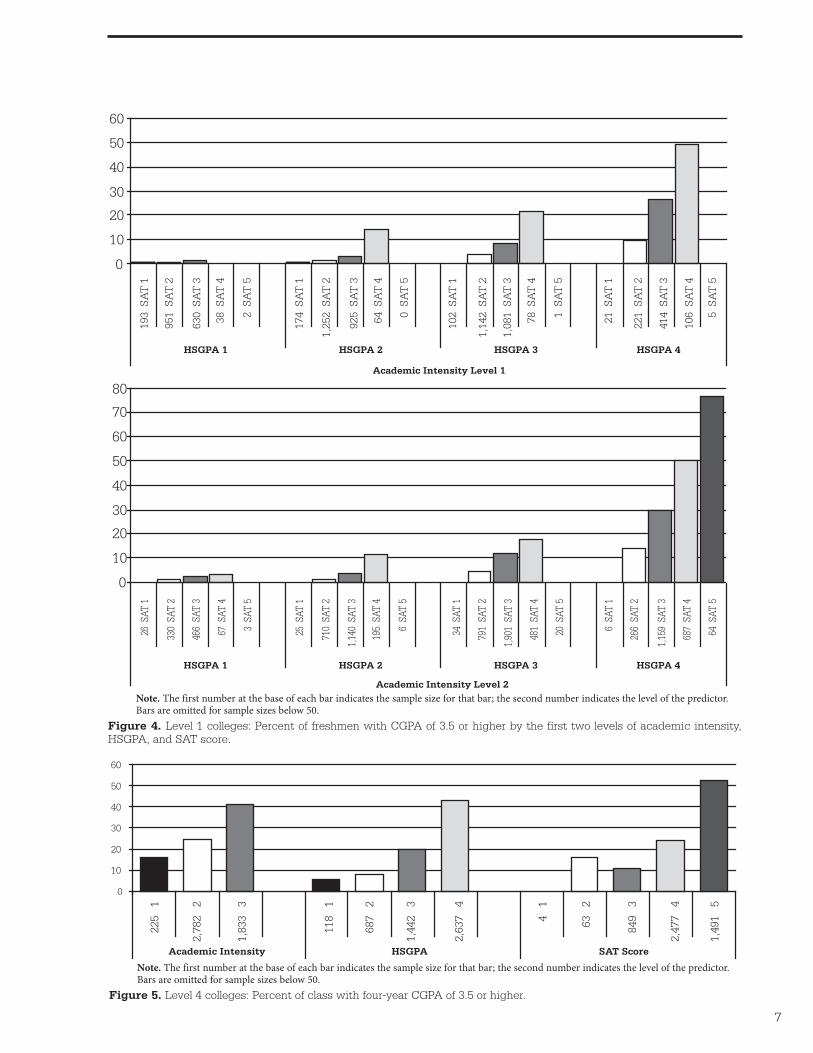
4. Level 1 colleges: Percent of freshmen with CGPA of 3.5 or higher by the first two levels of academic intensity, HSGPA, and SAT score . . . . . . . . . . . . . . . . . . . . . . . . . . . . . . . . . . . . . 7
5. Level 4 colleges: Percent of class with four-year CGPA of 3.5 or higher . . . . . . . . . . . . . 7
6. Level 4 colleges: Percent of students with four-year CGPA of 3.5 or higher by the highest two levels of academic intensity, HSGPA, and SAT score . . . . . . . . . . . . . . . . . . . . . 8


1
AbstractAlthough a number of large-scale studies have demonstrated an increase in predictive validity when SAT® scores are added to high school grades, this increment is often described in terms of a seemingly very small increase in explained variance. This may have led to the erroneous belief among test critics and others that students with low SAT scores would perform, on average, almost as well in college as students with high SAT scores. Using a sample of 41 colleges, the current study shows substantial differences in the percent of students who succeed (defined by a 2.5 or 3.5 college grade point average [CGPA] at the end of one year or four years in college) by SAT score level, even when intensity of the high school curriculum and high school grades are taken into account.
IntroductionLarge-scale studies, combining data over several colleges and universities, have been used to demonstrate the validity of the SAT Reasoning Test™ (formerly known as the SAT I: Reasoning Test), or its predecessor, the Scholastic Aptitude Test, for predicting freshman grade point average (e.g., Ramist, Lewis, and McCamley-Jenkins, 1994; Bridgeman, McCamley-Jenkins, and Ervin, 2000; Geiser and Studley, 2001). Typically, such studies use multiple regression methods to show the improvement in prediction when SAT scores are added to the high school grade point average (HSGPA). The improvement is frequently described in terms of the additional variance in college grades that can be “explained” by the test scores. The additional explained variance attributable to the test is typically less than 10 percent. Testing critics suggest that such an apparently minuscule improvement is not worth the bother. The National Center for Fair and Open Testing (FairTest), for example, simply states, “the SAT I has little value in predicting future college performance” (FairTest, 2003). Kidder and Rosner (2002) question the value of the SAT, citing data from a University of California study showing that “the SAT only adds 5.4 percent to the variance explained by HSGPA alone” (p. 193). Unfortunately, “explained variance” is a very difficult concept to understand, and multiple regression, although well understood by statisticians and admissions professionals, may be obscure to the layman interested in testing issues. This study seeks to show the value of grades and test scores for predicting success in college while requiring the reader to understand only the meaning of percent. Thus, this study shows the percent of students in various HSGPA and test score categories who are successful in college.
We define success in college at two levels. The lower level defines success as achieving a college grade point average (CGPA) of 2.5 (B‒/C+) or better; the upper level defines success as a CGPA of 3.5 (A‒/B+) or better on the typical grade scale from F=0.0 to A=4.0. Because grading standards may differ over colleges, we also separate colleges into four levels based on average SAT scores in the college.
In order to go beyond just the grade point average to describe the high school academic experience, we include a rough measure of the academic intensity of the curriculum taken by the student. Longitudinal data from the High School and Beyond database suggests that an index of the kind of courses taken in high school is a better predictor of college graduation than either test scores or HSGPA (Adelman, 1999).
Briefly, then, this study is an attempt to determine how many students at different levels of SAT score reach different criteria of success in college, after controlling on the selectivity of the college, the academic intensity of the students’ high school curriculum, and the students’ high school grades. We were interested to see whether, for example, students in selective colleges who took a moderately demanding high school curriculum and who got high grades in high school still differed markedly in their level of success depending on their SAT scores.
MethodSampleThe sample consisted of 41 colleges that had agreed to participate in a multiyear validity study by submitting course grades that would follow a single cohort of students over four or five years, then provide the same data for a cohort of students beginning the following year, and again for a third cohort. The current study used data only from the first cohort of students that began college in 1995. The sample was geographically diverse, included public and private institutions, and covered a fairly broad range of ability levels, though all colleges in the sample were somewhat selective (no college had a combined SAT average of less than 965, and most were well over 1000). All used SAT scores as part of the admissions process. (Although most would accept either ACT or SAT scores, the final sample included only institutions in which the majority of students submitted SAT scores.) Based on the course grades submitted, we computed a CGPA for the end of the freshman year and for each subsequent year. If the CGPA we computed for an individual differed by more than 0.5 grade points from the CGPA provided by the college, and we could not understand why, we dropped the person from the sample. In some cases we could explain discrepancies between the college-supplied CGPA and our computed CGPA by such college policies as

2
not counting a failed course in the CGPA if it was retaken later and passed. For such cases, we used the CGPA we computed that would include grades for both the passed and failed course. The grade data supplied by the colleges was merged with files at ETS that included SAT scores, Advanced Placement Program® (AP®) scores, and scores on the Student Descriptive Questionnaire (SDQ) that students complete when they register to take the SAT.
Analysis CategoriesThe analysis strategy was to determine how much the intensity of the high school curriculum, the high school GPA, and SAT scores contribute to predicting success in college, and whether SAT scores make any difference after accounting for the high school measures. Though not used as a predictor, a fourth variable that is likely to contribute to a student’s success is the selectivity of the college attended. More selective colleges have, for example, fewer dropouts, a higher proportion of graduates, and
tend to award higher grades (see, for example, Bowen and Bok, 1998). The exact definitions of the four analysis categories follow.
College selectivity level. To define a rough measure of each college’s selectivity, we summed the SAT verbal and math scores for each person. When a person had taken the test more than once, we used the sum of the highest math score and the highest verbal score. We then aver-aged these sums within colleges and used these averages to divide the colleges into four levels. Level 1 colleges had mean combined SAT scores between 965 and 1093; Level 2 ranged from 1110 to 1195; Level 3 ranged from 1201 to 1249 and consisted exclusively of large, highly selective state universities; Level 4 scores ranged from 1256 to 1406. Note that even the least selective col-leges in the study enrolled students whose average SAT total (around 1000) is equal to the national average. Table 1 shows the public/private and geographical mix
Table 1Participating Colleges by College Selectivity Level
Level 1 (SAT 965–1093) Level 2 (SAT 1110–1195)
Public/Private Region Number Public/Private Region Number
Public Middle States 873 Public New England 939
Public Middle States 731 Public Middle States 1,788
Public Middle States 1,088 Public Middle States 1,993
Public Middle States 1,041 Public West 1,919
Public Middle States 1,087 Public West 3,211
Public Middle States 837 Private New England 4,046
Public South 792 Private Middle States 1,487
Public South 1,718 Private Midwest 502
Public Southwest 1,178 Private Midwest 292
Public Southwest 2,757 Private Southwest 5,030
Public West 1,659 Private Southwest 167
Private Middle States 1,092 Private West 371
Private South 635 Private West 376
Private South 367
Private West 298
Private West 382
Total N 16,535 Total N 22,121
Level 3 (SAT 1201–1249) Level 4 (SAT 1256–1406)
Public/Private Region Number Public/Private Region Number
Public Middle States 1,483 Public South 2,035
Public South 3,105 Private New England 857
Public Midwest 3,222 Private Middle States 926
Public Southwest 5,580 Private South 1,132
Public West 3,436 Private Midwest 221
Private Midwest 283
Private Southwest 622
Total N 16,826 Total N 6,076

3
of colleges within each level, and shows the sample size for each college (i.e., number of students with valid high schools grades, college grades, and SAT scores).
Academic intensity. First, we defined separate high school academic intensity variables for math/science courses and for humanities/social science courses. Each of these scales had four levels. The math/science intensity variable was defined as follows:• 3 if two or more Advanced Placement Program (AP)
Exams taken in a math/science field (biology, chemistry, physics, calculus, statistics, computer science, or environmental science)
• 2 if one AP Exam taken in a math/science field• 1 if at least 3 years of study in lab science and math
course in trigonometry, precalculus, or calculus• 0 otherwise The humanities/social science intensity variable was defined as follows:• 3 if two or more AP Exams taken in any history,
English, foreign language, economics, or psychology• 2 if one AP Exam from above list• 1 if at least three years study in a foreign language,
four years study in English, four years study in social science and/or history, and honors in at least one of these course categories
• 0 otherwiseAlthough planned future analyses will focus separately on college courses in the math/science and humanities/social science areas, the current analysis focused on overall CGPA. Therefore, we created an overall academic intensity variable with three levels by adding the scores from the math/science and humanities/social science variables. If the sum was 0, then the score on the combined variable was 1; if the sum was 1–4, then the score on the combined variable was 2; if the sum was 5–6, then the combined variable score was 3. A student with no AP courses could qualify for Level 2 with strong course work in either math/science or humanities/social science. In order to clearly delineate a group with a very rigorous high school curriculum, we set the standard for Level 3 quite high. For a Level 3 classification, the student would have to take at least two AP courses in one area (math/science or humanities/social science) and one AP course in the other area. The percent of students in each intensity classification by college level is shown in Table 2.
Across the four college levels, 52 to 68 percent of the students were in intensity Level 2, but there was wide variation across college levels in the percents in intensity Levels 1 and 3. At Level 1 colleges, almost half of the students were in intensity Level 1 with only 2 percent in
intensity Level 3. At the Level 4 colleges the picture was reversed, with only 5 percent in intensity Level 1 and 35 percent in the very rigorous Level 3.
High school grade point average. Although all colleges in the sample submitted some indicator of success in high school for their students, some submitted class rank or some indicator other than the traditional A–F (4–0) HSGPA scale. In these 24 cases, we substituted the self-reported HSGPA from the SDQ. Such self-reports are not as precise as transcript-based grades, but they are adequate for roughly ranking students (Freeberg, Rock, and Pollack, 1989). We then defined four HSGPA categories. These categories are shown in Table 3. Very few students had averages below a B‒ (2.70). On the other hand, half of the students in the Level 3 and 4 colleges had high school averages in the top category (above A‒ [3.70]). An interesting anomaly in the table is that at Level 3 colleges only 10 percent have HSGPAs below 3.3 while at Level 4 colleges 20 percent of the enrolled freshman students are in the bottom two cat-egories. This might be related to more formula-driven admissions procedures in the large state universities in Level 3, or Level 4 colleges may draw more heavily on high schools with especially rigorous grading standards; additional analyses will be needed to fully understand this phenomenon.
Table 2Percent of Students at Each Academic Intensity Level for Each College Level
College Level
Academic Intensity Total1
(low)2 3 4
(high)
3 (high) 14 2 9 26 35
2 62 52 68 64 59
1 (low) 23 46 22 10 5
Table 3
Percent of Students at Each HSGPA Category for Each College Level
College Level
HSGPA Total 1 2 3 4
4 (higher than 3.70) 36 20 34 51 50
3 (3.30–3.70) 38 35 41 40 31
2 (2.71–3.29) 18 28 19 8 17
1 (2.70 and below) 7 17 6 2 3

4
SAT scores. Student SAT score levels are defined in Table 4. These score levels are necessarily related to col-lege level as college levels were defined in terms of mean SAT scores. Though there are nominally five levels, note that only one percent of the students are in the first level (combined scores from 400 to 800) in this sample of selective colleges.
Results and DiscussionTables showing the percent of students exceeding a CGPA of 2.5 and 3.5 at the end of the freshman year by college level, HSGPA category, academic intensity, and SAT level are in appendix Table A1. Table A2 presents comparable results for four-year CGPAs. Rows containing no people were omitted. For example, there were no students in any Level 1 college who were in HSGPA Category 3 (3.3–3.7), intensity Level 3 (at least two AP courses in one area and one in another area), and SAT Level 1 (combined scores below 800), so there is no line for this combination in the table. If the total N for a row was less than 50, we shaded the row to indicate that the percent succeeding (last two columns) should be interpreted cautiously.
The shadings follow a sensible pattern. There are relatively few students with high academic intensity levels or SAT scores in Level 1 colleges; those few
students in Level 1 colleges with high academic intensity and high school GPA also tend to have high SAT scores. Both high and low SAT scores are uncommon in Level 2 colleges. Low-intensity high school curricula are uncommon in Level 3 colleges unless compensated for by high HSGPA, high SAT scores, or both. Students at Level 3 colleges rarely have either low HSGPAs or low SAT scores. Students at Level 4 colleges almost never have low academic intensity high school curricula. They seldom have SAT scores at the two lowest levels. At all colleges, there is a tendency for students with high-intensity high school curricula to also have good HSGPAs and high SAT scores. In the analyses that follow, we will concentrate on those patterns of curricula, grades, and test scores that have substantial numbers of students at a given college level.
Predictors of Success in the Freshman Year Table 5 replicates five rows from Table A1 to illustrate the added value of considering SAT scores when identifying who will be successful in the freshman year of college.Specifically, the table shows success rates for students in Level 1 colleges who are relatively homogeneous with respect to high school grades (3.7 or higher) and academic intensity (Level 2). Knowing that SAT scores add only slightly to the explained variance might lead to the expectation that success rates would be only a few percentage points higher for students at high SAT levels compared to students at low SAT levels. This is clearly not the case. Fewer than 14 percent of the students with SAT scores of 1000 or lower completed their freshman year with a CGPA of 3.5 or higher. Over half of the students with SAT scores over 1200, and 77 percent of the students with SAT scores over 1400, reached this high standard. The difference between 14 percent and 77 percent does not seem to be minuscule. Although most students with this level of accomplishment in high school met the 2.5 success criterion in college, there were still differences by SAT score levels from less than 77 percent at the lower levels to over 93 percent at the higher levels.
Table 4Percent of Students at Each SAT Level for Each College Level
College Level
SAT (V+M) Total 1 2 3 4
5 (1410–1600) 7 1 4 8 28
4 (1210–1400) 34 12 34 49 52
3 (1010–1200) 42 49 49 36 19
2 (810–1000) 16 35 13 6 2
1 (400–800) 1 4 1 0 0
Table 5Freshman Success Rates in Level 1 Colleges by SAT Score Level for Students in the Same HSGPA Category and Academic Intensity Level
Academic Intensity
HSGPA Category
StudentSAT Level
TotalN
NCGPA>=3.5
N CGPA>=2.5
%CGPA >= 3.5
%CGPA >= 2.5
2 4 1 (<800) 6 0 3 0.0 50.0
2 4 2(800–1000) 266 37 204 13.9 76.7
2 4 3(1010–1200) 1,159 345 1,001 29.8 86.4
2 4 4 (1210–1400) 687 348 642 50.7 93.4
2 4 5 (>1400) 64 49 62 76.6 96.9

5
Numerous interesting trends can be gleaned from the tables, but they are easier to comprehend graphically. Figure 1 shows the percent of students in Level 1 colleges with freshman CGPAs of 2.5 or higher for each of the three indicators (academic intensity, HSGPA, and SAT) separately. The number of students in each column is given at the bottom of the column.
When presented in this manner, it is clear that all three measures are strongly related to success in college. Although relatively few students in Level 1 colleges were in academic intensity Level 3 (AP courses in two different areas), these students were about twice as likely to finish the freshman year with a 2.5 CGPA as students in the lowest intensity level. In the bottom category of HSGPA and in the bottom level of SAT, only about 25 percent of the students finished the year with a 2.5; in the highest categories, over 80 percent reached this level. This analysis shows that each measure predicts success in college separately. The next analysis is designed to show whether the SAT predicts over and above the high school measures.
Figure 2 indicates success levels for Level 1 colleges when the measures are fully crossed (SAT score level within HSGPA category within academic intensity level). Bars are omitted for categories containing fewer than 50 students. Academic intensity Level 3 is not graphed because there were so few students in this category in these Level 1 schools. The graph makes it clear that both high school grades and SAT scores matter as indicators of who will do well in college. Consider the 2,404 students at academic intensity Level 1 who had a B+ average in high school (HSGPA Category 3 [3.3 to 3.7]); the percent of successful students in SAT Level 4 was twice as great as the percent in SAT Level 1, and SAT Level 3 was nearly 20 percentage points above Level 2. But high school
grades also clearly matter. For example, at SAT Level 3 (1010–1200) and academic intensity Level 1, about 30 percent of the students at HSGPA Category 1, 40 percent at HSGPA Category 2, 60 percent at HSGPA Category 3, and 80 percent at HSGPA Category 4 finished the freshman year at Level 1 colleges with a CGPA of 2.5 or higher. The pattern is almost identical at academic intensity Level 2 at these colleges.
Figures 3 and 4 show comparable information for the freshman CGPA of 3.5 or higher success level in Level 1 colleges. Figure 4 indicates that for HSGPA Categories 1–3, success is fairly low regardless of SAT score. For HSGPA Category 4, success improves dramatically as the SAT level increases.
Predictors of Success Over Four Years in CollegeThe same trends that are evident throughout Table A1 for predicting freshman grades are also evident in Table A2 in which the success criterion is based on grades earned over four years in college. For example, for a four-year college CGPA of 3.5 or higher in Level 4 colleges, among students in HSGPA Category 4 and academic intensity Level 2, 13 percent of the students at SAT Level 3 were successful compared to 54 percent at SAT Level 5.
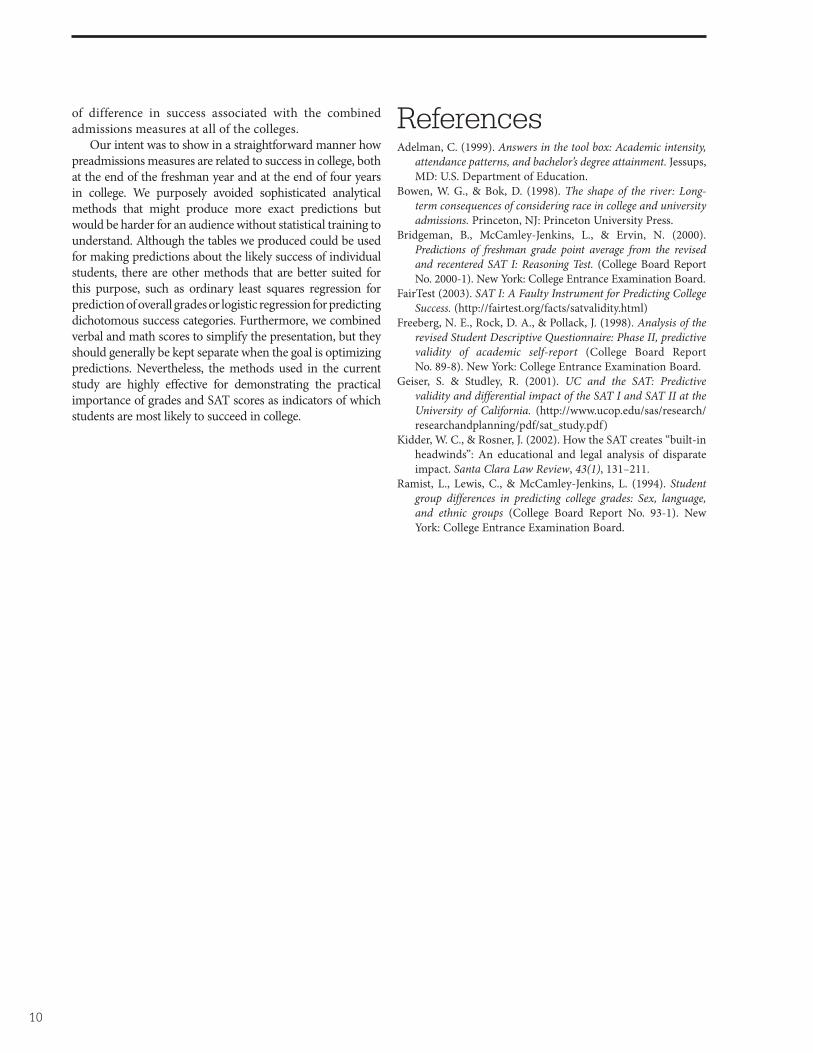
Figures 5 and 6 illustrate differences in the most selective colleges using the criterion of CGPAs of 3.5 or higher after four years of college. Figure 6 omits academic intensity Level 1 because of the small number of people in this group. Indeed, the graph would have no bars because within HSGPA and SAT levels all groups contained fewer than 50 people. Figure 5 should shatter the notion that preadmission measures predict only freshman grades.
�
��
��
��
��
��
��
��
��
��
���
����
�����
����
�����
�������
����
�����
����
�����
����
�����
����
�����
�������
����
�����
����
�����
����
�����
�������
������������������ ����� ���������
Note. The first number at the base of each bar indicates the sample size for that bar; the second number indicates the level of the predictor.Figure 1. Level 1 colleges: Percent of class with freshman CGPA of 2.5 or higher.

6
Note. The first number at the base of each bar indicates the sample size for that bar; the second number indicates the level of the predictor. Figure 3. Level 1 colleges: Percent of class with freshman CGPA of 3.5 or higher.
�
��
��
��
��
��
��
���������
���������
�������
���������
���������
���������
���������
�������
���������
���������
���������
�������
������������������ ����� ���������
Note. The first number at the base of each bar indicates the sample size for that bar; the second number indicates the level of the predictor. Bars are omitted for sample sizes below 50.
Figure 2. Level 1 colleges: Percent of freshmen with CGPA of 2.5 or higher by the first two levels of academic intensity, HSGPA, and SAT score.
�
��
��
��
��
��
��
��
��
��
�������������
����������
����������
�����
����
��������
����������
������������
����������
�����
����
��������
����������
������������
������������
�����
����
��������
�����
����
����������
����������
����������
��������
������� ������� ������� ���������������������������������
�
��
��
��
��
��
��
��
��
��
���
�����
����
����������
����������
�����
����
��������
�����
����
����������
������������
����������
��������
�����
����
����������
������������
����������
�����
����
��������
����������
������������
����������
�����
����
������� ������� ������� ���������������������������������
7
�
��
��
��
��
��
��
����������
����������
����������
�����
����
��������
����������
������������
����������
�����
����
��������
����������
������������
������������
�����
����
��������
�����
����
����������
����������
����������
��������
������� ������� ������� �������
��������������������������
������� ������� ������� �������
��������������������������
�
��
��
��
��
��
��
��
��
�����
����
��������
��
��������
��
�����
����
������
��
�����
����
��������
��
����
������
��
��������
��
������
��
�����
����
��������
��
����
������
��
��������
��
�����
����
������
��
��������
��
����
������
��
��������
��
�����
����
Note. The first number at the base of each bar indicates the sample size for that bar; the second number indicates the level of the predictor. Bars are omitted for sample sizes below 50.
Figure 4. Level 1 colleges: Percent of freshmen with CGPA of 3.5 or higher by the first two levels of academic intensity, HSGPA, and SAT score.
Note. The first number at the base of each bar indicates the sample size for that bar; the second number indicates the level of the predictor. Bars are omitted for sample sizes below 50.
Figure 5. Level 4 colleges: Percent of class with four-year CGPA of 3.5 or higher.
�
��
��
��
��
��
��
�������
����
�����
����
�����
�������
�������
����
�����
����
�����
�����
������
�������
����
�����
����
�����
������������������ ����� ���������

8
Figure 6 indicates that most of the highly successful students in these highly selective institutions had earned A averages in high school, and many of them had done it in a very demanding curriculum that included at least two AP courses in one area and another course in a different area (i.e., academic intensity Level 3). Within this very accomplished group, there might seem to be little room for SAT scores to make any difference. Nevertheless, there are still substantial differences in success rates by SAT scores, from under 20 percent at SAT Level 3 to over 60 percent at Level 5.
Effects of Using Narrower SAT Score Bands for Predicting Freshman CGPAGiven the large differences in the percent of successful students by SAT score category, even within intensity
and HSGPA categories, it may be difficult to understand why the contribution of SAT scores is not more widely recognized. Part of the problem might be that some people give too much attention to small differences in SAT scores. We used score bands with a range of 190 points in each level from 2 to 5 (and a 400-point range in Level 1), and differences would be less pronounced with narrower bands. To illustrate this point, Table 6 parallels Table 5, but divides levels 3 and 4 into four sublevels each. The range of points in each sublevel is 40 points. (3A = 1010–1050; 3B = 1060–1100…; 4D = 1360–1400).
As before, we focus on the success criterion of a CGPA of 3.5 or higher. Although there are still some noticeable jumps even within sublevels (e.g., 10.3 percentage points from 3A to 3B, and 16.6 points from 4B to 4C), some sublevels are separated by only a few percentage points (e.g., less than 4 points from 3D to 4A and from 4A to 4B). It may be
�
��
��
��
��
��
����������
��������
���������
���������
��������
��������
���������
����������
����������
���������
��������
��������
����������
����������
����������
��������
���������
����������
����������
����������
������� ������� ������� �������
��������������������������
�
��
��
��
��
��
��
��������
��������
��������
��������
��������
��������
��������
���������
���������
���������
��������
��������
���������
����������
����������
��������
��������
���������
����������
����������
������� ������� ������� �������
��������������������������
Note. The first number at the base of each bar indicates the sample size for that bar; the second number indicates the level of the predictor. Bars are omitted for sample sizes below 50.
Figure 6. Level 4 colleges: Percent of students with four-year CGPA of 3.5 or higher by the highest two levels of academic intensity, HSGPA, and SAT score.

9
obvious that large differences in SAT scores could translate to large differences in success percentages, and small score differences would translate to small success differences, but it is less obvious that a 40-point range in SAT scores is indeed small. The SAT scale goes from 200 to 800 (or 400 to 1600 for the combined scores), but the last digit is always zero, so the combined scale could be said to go from 40 to 160 and is thus a 121-point scale. The 40-point range then would be merely a 4-point range out of a possible 121-point range. A 40-point difference may be even more clearly seen as a small difference in terms of a number correct score. Getting just one or two more items correct on the 78-question verbal scale and one or two more items correct on the 60-question math scale can increase the combined scaled score by 40 points. It is unreasonable to expect a few more items answered correctly to translate into large differences in success percentages. Larger differences in success on the SAT can and do translate into differences in success in college.
ConclusionsIt should be noted that even using these rather coarse categories of academic intensity, HSGPA, and SAT score levels, it is still possible to identify a range of academic talent at colleges at all four levels of selectivity. Tables A1 and A2 have many unshaded lines, populated by students with quite different patterns of accomplishment. Table 7 summarizes the range of incoming achievement at all four college levels, and shows the percent of students at the highest and lowest achievement levels who attain a 2.5 or higher first year average (and a 3.5 or higher). Level 1 colleges lack students with the highest SAT scores, but otherwise have students with high academic intensity and high HSGPA. All other colleges have students at the highest level on all three measures. The minimum level of attainment differs somewhat, and is associated with lower percents of success as the selectivity of the college declines. However, there is clearly a great range
Table 6Freshman Success Rates in Level 1 Colleges by SAT Score Level (and Sublevels) for Students in the Same HSGPA Category and Academic Intensity Level
AcademicIntensity
HSGPACategory
StudentSAT Level
TotalN
NCGPA>=3.5
N CGPA>=2.5
%CGPA >= 3.5
%CGPA >= 2.5
2 4 1 (<800) 6 0 3 0.0 50.0
2 4 2 (800–1000) 266 37 204 13.9 76.7
2 4 3A (1010–1050) 218 36 186 16.5 85.3
2 4 3B (1060–1100) 295 79 241 26.8 81.7
2 4 3C (1110–1150) 312 99 279 31.7 89.4
2 4 3D (1160–1200) 334 131 295 39.2 88.3
2 4 4A (1210–1250) 286 123 265 43.0 92.7
2 4 4B (1260–1300) 199 193 183 46.7 92.0
2 4 4C (1310–1350) 128 81 125 63.3 97.7
2 4 4D (1360–1400) 74 51 69 68.9 93.2
2 4 5 (>1400) 64 49 62 76.6 96.9
Table 7Range of Freshman Success at Four Levels of College Selectivity
College Level (N)
Student Achievement
Level at Admission
Academic Intensity HSGPA Category
Student SAT Level N % CGPA >= 2.5 % CGPA >= 3.5
1 Lowest 1 1 1 193 13 1
(N=15,000) Highest 3 4 4 125 94 65
2 Lowest 1 1 2 143 29 1
(N=22,000) Highest 3 4 5 255 97 72
3 Lowest 1 2 2 79 34 0
(N=17,000) Highest 3 4 5 617 98 67
4 Lowest 1 2 3 54 41 0
(N=6,000) Highest 3 4 5 844 96 51
10
of difference in success associated with the combined admissions measures at all of the colleges.
Our intent was to show in a straightforward manner how preadmissions measures are related to success in college, both at the end of the freshman year and at the end of four years in college. We purposely avoided sophisticated analytical methods that might produce more exact predictions but would be harder for an audience without statistical training to understand. Although the tables we produced could be used for making predictions about the likely success of individual students, there are other methods that are better suited for this purpose, such as ordinary least squares regression for prediction of overall grades or logistic regression for predicting dichotomous success categories. Furthermore, we combined verbal and math scores to simplify the presentation, but they should generally be kept separate when the goal is optimizing predictions. Nevertheless, the methods used in the current study are highly effective for demonstrating the practical importance of grades and SAT scores as indicators of which students are most likely to succeed in college.
ReferencesAdelman, C. (1999). Answers in the tool box: Academic intensity,
attendance patterns, and bachelor’s degree attainment. Jessups, MD: U.S. Department of Education.
Bowen, W. G., & Bok, D. (1998). The shape of the river: Long-term consequences of considering race in college and university admissions. Princeton, NJ: Princeton University Press.
Bridgeman, B., McCamley-Jenkins, L., & Ervin, N. (2000). Predictions of freshman grade point average from the revised and recentered SAT I: Reasoning Test. (College Board Report No. 2000-1). New York: College Entrance Examination Board.
FairTest (2003). SAT I: A Faulty Instrument for Predicting College Success. (http://fairtest.org/facts/satvalidity.html)
Freeberg, N. E., Rock, D. A., & Pollack, J. (1998). Analysis of the revised Student Descriptive Questionnaire: Phase II, predictive validity of academic self-report (College Board Report No. 89-8). New York: College Entrance Examination Board.
Geiser, S. & Studley, R. (2001). UC and the SAT: Predictive validity and differential impact of the SAT I and SAT II at the University of California. (http://www.ucop.edu/sas/research/researchandplanning/pdf/sat_study.pdf)
Kidder, W. C., & Rosner, J. (2002). How the SAT creates “built-in headwinds”: An educational and legal analysis of disparate impact. Santa Clara Law Review, 43(1), 131–211.
Ramist, L., Lewis, C., & McCamley-Jenkins, L. (1994). Student group differences in predicting college grades: Sex, language, and ethnic groups (College Board Report No. 93-1). New York: College Entrance Examination Board.

11
AppendixTable A1Number and Percent Achieving a 3.5 or a 2.5 CGPA at the End of Freshman Year by College Level, HSGPA Category, Academic Intensity, and SAT Level
College Level
Academic Intensity
HSGPA Category
Student SAT Level
Total N
N CGPA>=3.5
N CGPA>=2.5
% CGPA>= 3.5
% CGPA>= 2.5
1 1 1 1 193 1 25 1 13
1 1 1 2 951 5 222 1 23
1 1 1 3 630 9 177 1 28
1 1 1 4 38 3 12 8 32
1 1 1 5 2 0 1 0 50
1 1 2 1 174 1 39 1 23
1 1 2 2 1252 16 461 1 37
1 1 2 3 925 28 397 3 43
1 1 2 4 64 9 41 14 64
1 1 3 1 102 0 32 0 31
1 1 3 2 1142 42 556 4 49
1 1 3 3 1081 86 700 8 65
1 1 3 4 78 17 57 22 73
1 1 3 5 1 0 0 0 0
1 1 4 1 21 3 14 14 67
1 1 4 2 221 21 143 10 65
1 1 4 3 414 109 345 26 84
1 1 4 4 106 52 97 50 92
1 1 4 5 5 4 4 80 80
1 2 1 1 26 0 9 0 35
1 2 1 2 330 5 92 2 28
1 2 1 3 466 11 146 2 31
1 2 1 4 67 2 24 3 36
1 2 1 5 3 0 2 0 67
1 2 2 1 25 0 9 0 36
1 2 2 2 710 11 269 2 38
1 2 2 3 1140 44 528 4 46
1 2 2 4 195 22 99 11 51
1 2 2 5 6 1 4 17 67
1 2 3 1 34 0 15 0 44
1 2 3 2 791 37 449 5 57
1 2 3 3 1901 225 1341 12 71
1 2 3 4 481 87 368 18 77
1 2 3 5 20 3 17 15 85
1 2 4 1 6 0 3 0 50
1 2 4 2 266 37 204 14 77
1 2 4 3 1159 345 1001 30 86
1 2 4 4 687 348 642 51 93
1 2 4 5 64 49 62 77 97
1 3 1 3 5 0 3 0 60
1 3 1 4 1 0 1 0 100

12
Table A1Number and Percent Achieving a 3.5 or a 2.5 CGPA at the End of Freshman Year by College Level, HSGPA Category, Academic Intensity, and SAT Level
College Level
Academic Intensity
HSGPA Category
Student SAT Level
Total N
N CGPA>=3.5
N CGPA>=2.5
% CGPA>= 3.5
% CGPA>= 2.5
1 3 1 5 1 0 0 0 0
1 3 2 1 1 0 0 0 0
1 3 2 2 4 0 1 0 25
1 3 2 3 13 1 8 8 62
1 3 2 4 13 1 8 8 62
1 3 2 5 1 0 1 0 100
1 3 3 2 4 0 2 0 50
1 3 3 3 35 5 23 14 66
1 3 3 4 38 6 32 16 84
1 3 3 5 3 2 3 67 100
1 3 4 2 5 1 4 20 80
1 3 4 3 59 25 52 42 88
1 3 4 4 125 81 118 65 94
1 3 4 5 29 20 27 69 93
2 1 1 1 11 0 4 0 36
2 1 1 2 143 1 41 1 29
2 1 1 3 259 5 86 2 33
2 1 1 4 47 0 24 0 51
2 1 2 1 37 1 21 3 57
2 1 2 2 490 8 212 2 43
2 1 2 3 671 30 372 5 55
2 1 2 4 161 11 102 7 63
2 1 2 5 4 1 3 25 75
2 1 3 1 28 0 11 0 39
2 1 3 2 517 22 295 4 57
2 1 3 4 243 25 170 10 70
2 1 3 5 10 2 9 20 90
2 1 4 1 6 0 5 0 83
2 1 4 2 155 8 103 5 67
2 1 4 3 568 99 445 17 78
2 1 4 4 231 76 203 33 88
2 1 4 5 7 4 7 57 100
2 2 1 1 4 0 0 0 0
2 2 1 2 117 1 41 1 35
2 2 1 3 394 8 171 2 43
2 2 1 4 224 32 128 14 57
2 2 1 5 18 5 12 28 67
2 2 2 1 5 0 2 0 40
2 2 2 2 325 7 160 2 49
2 2 2 3 1390 57 784 4 56
2 2 2 4 720 70 476 10 66
2 2 2 5 42 11 31 26 74
2 2 3 1 21 0 5 0.0 24
(Continued)

13
Table A1Number and Percent Achieving a 3.5 or a 2.5 CGPA at the End of Freshman Year by College Level, HSGPA Category, Academic Intensity, and SAT Level
College Level
Academic Intensity
HSGPA Category
Student SAT Level
Total N
N CGPA>=3.5
N CGPA>=2.5
% CGPA>= 3.5
% CGPA>= 2.5
2 2 3 2 662 27 360 4 54
2 2 3 3 3370 248 2230 7 66
2 2 3 4 2088 340 1618 16 78
2 2 3 5 109 35 98 32 90
2 2 4 1 5 0 2 0 40
2 2 4 2 280 16 159 6 57
2 2 4 3 2212 408 1793 18 81
2 2 4 4 2405 844 2146 35 89
2 2 4 5 326 194 309 60 95
2 3 1 3 11 3 4 27 36
2 3 1 4 24 6 20 25 83
2 3 1 5 4 1 3 25 75
2 3 2 2 3 0 1 0 33
2 3 2 3 34 2 25 6 74
2 3 2 4 113 22 90 20 80
2 3 2 5 15 8 13 53 87
2 3 3 2 11 1 6 9 55
2 3 3 3 182 30 128 17 70
2 3 3 4 387 97 335 25 87
2 3 3 5 85 43 79 51 93
2 3 4 2 4 0 3 0 75
2 3 4 3 153 34 119 22 78
2 3 4 4 634 294 600 46 95
2 3 4 5 255 183 247 72 97
3 1 1 1 6 0 1 0 17
3 1 1 2 37 2 14 5 38
3 1 1 3 33 1 15 3 46
3 1 1 4 7 1 4 14 57
3 1 2 1 5 0 1 0 20
3 1 2 2 79 0 27 0 34
3 1 2 3 133 6 65 5 49
3 1 2 4 33 2 18 6 55
3 1 3 1 12 1 5 8 42
3 1 3 2 167 5 61 3 37
3 1 3 3 446 34 239 8 54
3 1 3 4 162 22 111 14 69
3 1 3 5 5 1 5 20 100
3 1 4 1 3 0 2 0 67
3 1 4 2 73 3 36 4 49
3 1 4 3 288 36 208 13 72
3 1 4 4 124 36 106 29 86
3 1 4 5 8 4 7 50 88
3 2 1 1 3 0 1 0 33
(Continued)

14
Table A1Number and Percent Achieving a 3.5 or a 2.5 CGPA at the End of Freshman Year by College Level, HSGPA Category, Academic Intensity, and SAT Level
College Level
Academic Intensity
HSGPA Category
Student SAT Level
Total N
N CGPA>=3.5
N CGPA>=2.5
% CGPA>= 3.5
% CGPA>= 2.5
3 2 1 2 31 3 7 10 23
3 2 1 3 89 0 33 0 37
3 2 1 4 41 3 18 7 44
3 2 1 5 5 1 3 20 60
3 2 2 1 4 0 2 0 50
3 2 2 2 105 3 44 3 42
3 2 2 4 318 30 208 9 65
3 2 2 5 26 2 19 8 73
3 2 3 1 9 1 5 11 56
3 2 3 2 309 11 153 4 50
3 2 3 3 1885 160 1172 9 62
3 2 3 4 2036 378 1612 19 79
3 2 3 5 167 48 136 29 81
3 2 4 2 193 10 102 5 53
3 2 4 3 1969 307 1474 16 75
3 2 4 4 2620 865 2298 33 88
3 2 4 5 342 191 321 56 94
3 3 1 3 5 0 2 0 40
3 3 1 4 6 1 5 17 83
3 3 1 5 2 0 1 0 50
3 3 2 2 4 0 2 0 50
3 3 2 3 42 4 28 10 67
3 3 2 4 95 16 72 17 76
3 3 2 5 21 6 19 29 91
3 3 3 2 21 0 10 0 48
3 3 3 3 248 19 168 8 68
3 3 3 4 876 209 733 24 84
3 3 3 5 184 57 165 31 90
3 3 4 2 1 0 0 0 0
3 3 4 2 18 0 7 0 39
3 3 4 3 455 82 366 18 80
3 3 4 4 1736 686 1621 40 93
3 3 4 5 617 411 602 67 98
4 1 1 1 2 0 0 0 0
4 1 1 2 9 0 2 0 22
4 1 1 3 10 0 4 0 40
4 1 1 4 9 1 3 11 33
4 1 1 5 1 1 1 100 100
4 1 2 2 12 0 4 0 33
4 1 2 3 54 0 22 0 41
4 1 2 4 43 3 19 7 44
4 1 2 5 2 0 1 0 50
4 1 3 1 1 0 1 0 100
(Continued)

15
Table A1Number and Percent Achieving a 3.5 or a 2.5 CGPA at the End of Freshman Year by College Level, HSGPA Category, Academic Intensity, and SAT Level
College Level
Academic Intensity
HSGPA Category
Student SAT Level
Total N
N CGPA>=3.5
N CGPA>=2.5
% CGPA>= 3.5
% CGPA>= 2.5
4 1 3 2 8 0 5 0 63
4 1 3 3 47 2 27 4 57
4 1 3 4 53 5 41 9 77
4 1 3 5 3 2 3 67 100
4 1 4 2 4 2 3 50 75
4 1 4 3 27 5 23 19 85
4 1 4 4 25 9 23 36 92
4 1 4 5 5 2 5 40 100
4 2 1 1 2 0 0 0 0
4 2 1 2 5 0 2 0 40
4 2 1 3 39 1 15 3 39
4 2 1 4 72 1 33 1 46
4 2 1 5 4 0 2 0 50
4 2 2 2 17 1 6 6 35
4 2 2 3 232 3 105 1 45
4 2 2 4 443 31 233 7 53
4 2 2 5 40 4 26 10 65
4 2 3 2 13 1 4 8 31
4 2 3 3 342 27 174 8 51
4 2 3 4 707 88 485 12 69
4 2 3 5 149 40 131 27 88
4 2 4 2 15 1 11 7 73
4 2 4 3 257 34 178 13 69
4 2 4 4 821 234 705 29 86
4 2 4 5 423 205 395 49 93
4 3 1 3 1 0 0 0 0
4 3 1 4 11 1 9 9 82
4 3 1 5 3 0 2 0 67
4 3 2 3 16 0 2 0 13
4 3 2 4 97 5 54 5 56
4 3 2 5 30 3 21 10 70
4 3 3 2 1 0 1 0 100
4 3 3 3 42 6 31 14 74
4 3 3 4 296 30 215 10 73
4 3 3 5 175 55 155 31 89
4 3 4 3 68 9 46 13 68
4 3 4 4 535 168 468 31 88
4 3 4 5 844 430 806 51 96
(Continued)

16
Table A2Number and Percent Achieving a 3.5 or a 2.5 CGPA at the End of Senior Year by College Level, HSGPA Category, Academic Intensity, and SAT Level
College SAT Level
Academic Intensity
HSGPA Category
Student SAT Level
Total N
N CGPA>=3.5
N CGPA>=2.5
% CGPA >= 3.5
% CGPA >= 2.5
1 1 1 1 78 1 30 1 39
1 1 1 2 481 7 237 2 49
1 1 1 3 299 6 168 2 56
1 1 1 4 15 0 10 0 67
1 1 2 1 71 1 33 1 47
1 1 2 2 688 16 446 2 65
1 1 2 3 517 28 384 5 74
1 1 2 4 34 6 28 18 82
1 1 3 1 41 1 26 2 63
1 1 3 2 691 35 537 5 78
1 1 3 3 684 91 567 13 83
1 1 3 4 42 9 36 21 86
1 1 4 1 9 1 8 11 89
1 1 4 2 142 21 127 15 89
1 1 4 3 286 90 268 32 94
1 1 4 4 71 38 70 54 99
1 1 4 5 4 4 4 100 100
1 2 1 1 14 0 6 0 43
1 2 1 2 159 5 96 3 60
1 2 1 3 243 8 141 3 58
1 2 1 4 27 2 18 7 67
1 2 1 5 2 0 2 0 100
1 2 2 1 10 0 8 0 80
1 2 2 2 443 13 293 3 66
1 2 2 3 649 44 472 7 73
1 2 2 4 114 10 85 9 75
1 2 2 5 3 2 2 67 67
1 2 3 1 15 0 12 0 80
1 2 3 2 538 48 413 9 77
1 2 3 3 1272 201 1110 16 87
1 2 3 4 301 70 267 23 89
1 2 3 5 14 2 12 14 86
1 2 4 1 2 0 2 0 100
1 2 4 2 171 44 156 26 91
1 2 4 3 857 304 796 36 93
1 2 4 4 491 249 474 51 97
1 2 4 5 47 36 45 77 96
1 3 1 3 4 0 2 0 50
1 3 1 4 1 0 1 0 100
1 3 2 2 3 0 1 0 33
1 3 2 3 9 1 6 11 67
1 3 2 4 5 1 5 20 100

17
Table A2Number and Percent Achieving a 3.5 or a 2.5 CGPA at the End of Senior Year by College Level, HSGPA Category, Academic Intensity, and SAT Level
College SAT Level
Academic Intensity
HSGPA Category
Student SAT Level
Total N
N CGPA>=3.5
N CGPA>=2.5
% CGPA >= 3.5
% CGPA >= 2.5
1 3 2 5 1 0 1 0 100
1 3 3 2 4 1 2 25 50
1 3 3 3 27 4 19 15 70
1 3 3 4 25 3 24 12 96
1 3 3 5 2 1 2 50 100
1 3 4 2 3 0 2 0 67
1 3 4 3 41 19 39 46 95
1 3 4 4 101 67 97 66 96
1 3 4 5 21 14 18 67 86
2 1 1 1 7 0 5 0 71
2 1 1 2 84 1 47 1 56
2 1 1 3 148 3 91 2 62
2 1 1 4 28 2 20 7 71
2 1 1 5 1 1 1 100 100
2 1 2 1 22 0 17 0 77
2 1 2 2 280 3 196 1 70
2 1 2 3 418 32 324 8 78
2 1 2 4 109 10 91 9 84
2 1 2 5 2 0 2 0 100
2 1 3 1 16 0 13 0 81
2 1 3 2 359 21 280 6 78
2 1 3 3 779 67 644 9 83
2 1 3 4 169 28 144 17 85
2 1 3 5 5 2 5 40 100
2 1 4 1 6 1 5 17 83
2 1 4 2 116 9 96 8 83
2 1 4 3 434 95 399 22 92
2 1 4 4 171 60 163 35 95
2 1 4 5 6 4 6 67 100
2 2 1 1 1 0 0 0 0
2 2 1 2 82 2 44 2 54
2 2 1 3 245 8 172 3 70
2 2 1 4 137 25 115 18 84
2 2 1 5 15 4 13 27 87
2 2 2 1 5 0 2 0 40
2 2 2 2 204 5 153 3 75
2 2 2 3 938 62 733 7 78
2 2 2 4 479 69 403 14 84
2 2 2 5 24 7 22 29 92
2 2 3 1 16 0 10 0 63
2 2 3 2 469 19 354 4 76
2 2 3 3 2485 226 2092 9 84
(Continued)

18
Table A2Number and Percent Achieving a 3.5 or a 2.5 CGPA at the End of Senior Year by College Level, HSGPA Category, Academic Intensity, and SAT Level
College SAT Level
Academic Intensity
HSGPA Category
Student SAT Level
Total N
N CGPA>=3.5
N CGPA>=2.5
% CGPA >= 3.5
% CGPA >= 2.5
2 2 3 4 1582 282 1400 18 89
2 2 3 5 77 32 70 42 91
2 2 4 1 2 0 2 0 100
2 2 4 2 205 13 158 6 77
2 2 4 3 1822 401 1644 22 90
2 2 4 4 1986 751 1882 38 95
2 2 4 5 267 157 250 59 94
2 3 1 3 6 1 6 17 100
2 3 1 4 18 6 18 33 100
2 3 1 5 4 1 4 25 100
2 3 2 2 2 1 1 50 50
2 3 2 3 24 0 17 0 71
2 3 2 4 88 22 81 25 92
2 3 2 5 12 7 11 58 92
2 3 3 2 10 0 7 0 70
2 3 3 3 132 23 109 17 83
2 3 3 4 317 85 291 27 92
2 3 3 5 62 34 59 55 95
2 3 4 2 3 0 3 0 100
2 3 4 3 119 30 98 25 82
2 3 4 4 526 249 507 47 96
2 3 4 5 216 150 213 69 99
2 3 4 1 1 0 0 0 0
3 1 1 1 7 0 4 0 57
3 1 1 2 35 1 12 3 34
3 1 1 3 30 1 14 3 47
3 1 1 4 7 0 5 0 71
3 1 2 1 5 0 2 0 40
3 1 2 2 69 2 41 3 59
3 1 2 3 112 4 75 4 67
3 1 2 4 26 2 22 8 85
3 1 3 1 14 1 9 7 64
3 1 3 2 133 2 86 2 65
3 1 3 3 369 43 296 12 80
3 1 3 4 123 21 102 17 83
3 1 3 5 5 1 5 20 100
3 1 4 1 3 1 3 33 100
3 1 4 2 58 4 42 7 72
3 1 4 3 247 50 215 20 87
3 1 4 4 108 34 99 32 92
3 1 4 5 8 7 8 88 100
3 2 1 1 3 0 1 0 33
(Continued)

19
Table A2Number and Percent Achieving a 3.5 or a 2.5 CGPA at the End of Senior Year by College Level, HSGPA Category, Academic Intensity, and SAT Level
College SAT Level
Academic Intensity
HSGPA Category
Student SAT Level
Total N
N CGPA>=3.5
N CGPA>=2.5
% CGPA >= 3.5
% CGPA >= 2.5
3 2 1 2 21 0 13 0 62
3 2 1 3 67 1 35 2 52
3 2 1 4 30 3 19 10 63
3 2 1 5 3 0 2 0 67
3 2 2 1 4 0 1 0 25
3 2 2 2 82 1 49 1 60
3 2 2 3 300 18 215 6 72
3 2 2 4 246 29 202 12 82
3 2 2 5 23 3 21 13 91
3 2 3 1 6 0 3 0 50
3 2 3 2 253 10 175 4 69
3 2 3 3 1514 146 1172 10 77
3 2 3 4 1685 361 1481 21 88
3 2 3 5 140 49 128 35 91
3 2 4 2 145 7 106 5 73
3 2 4 3 1621 275 1359 17 84
3 2 4 4 2197 793 2037 36 93
3 2 4 5 273 158 256 58 94
3 3 1 3 4 0 2 0 50
3 3 1 4 7 1 3 14 43
3 3 1 5 1 0 1 0 100
3 3 2 2 4 0 4 0 100
3 3 2 3 37 5 29 14 78
3 3 2 4 77 7 57 9 74
3 3 2 5 17 5 16 29 94
3 3 3 2 14 0 10 0 71
3 3 3 3 210 23 157 11 75
3 3 3 4 725 178 648 25 89
3 3 3 5 154 52 141 34 92
3 3 4 2 15 0 11 0 73
3 3 4 3 365 70 323 19 89
3 3 4 4 1421 584 1343 41 95
3 3 4 5 480 310 470 65 98
4 1 1 1 1 0 0 0 0
4 1 1 2 5 0 0 0 0
4 1 1 3 5 0 4 0 80
4 1 1 4 7 0 4 0 57
4 1 1 5 1 0 1 0 100
4 1 2 2 9 1 6 11 67
4 1 2 3 35 4 26 11 74
4 1 2 4 29 4 22 14 76
4 1 2 5 1 0 1 0 100
(Continued)

20
Table A2Number and Percent Achieving a 3.5 or a 2.5 CGPA at the End of Senior Year by College Level, HSGPA Category, Academic Intensity, and SAT Level
College SAT Level
Academic Intensity
HSGPA Category
Student SAT Level
Total N
N CGPA>=3.5
N CGPA>=2.5
% CGPA >= 3.5
% CGPA >= 2.5
4 1 3 1 2 0 1 0 50
4 1 3 2 9 1 6 11 67
4 1 3 3 32 3 27 9 84
4 1 3 4 36 7 33 19 92
4 1 3 5 1 1 1 100 100
4 1 4 2 3 1 3 33 100
4 1 4 3 24 7 22 29 92
4 1 4 4 20 6 20 30 100
4 1 4 5 5 1 5 20 100
4 2 1 1 1 0 0 0 0
4 2 1 2 4 1 2 25 50
4 2 1 3 24 0 19 0 79
4 2 1 4 48 2 33 4 69
4 2 1 5 2 2 2 100 100
4 2 2 2 12 2 6 17 50
4 2 2 3 156 6 106 4 68
4 2 2 4 292 24 213 8 73
4 2 2 5 29 5 21 17 72
4 2 3 2 7 1 6 14 86
4 2 3 3 248 31 184 13 74
4 2 3 4 541 95 458 18 85
4 2 3 5 123 41 114 33 93
4 2 4 2 12 3 10 25 83
4 2 4 3 206 26 172 13 84
4 2 4 4 693 245 657 35 95
4 2 4 5 384 206 373 54 97
4 3 1 3 2 0 2 0 100
4 3 1 4 9 1 7 11 78
4 3 1 5 1 0 1 0 100
4 3 2 3 11 0 3 0 27
4 3 2 4 73 5 55 7 75
4 3 2 5 23 2 19 9 83
4 3 3 3 35 5 27 14 77
4 3 3 4 248 41 202 17 82
4 3 3 5 148 56 141 38 95
4 3 4 3 54 10 43 19 80
4 3 4 4 456 165 427 36 94
4 3 4 5 773 468 755 61 98
(Continued)

www.collegeboard.com 040481304


