11
Research – UK Film Consumption Isobel and Jack
| Date post: | 10-Aug-2015 |
| Category: |
Data & Analytics |
| Upload: | jackcooper2310 |
| View: | 54 times |
| Download: | 0 times |

Research – UK Film Consumption
Isobel and Jack
What is the overall trend in film consumption?
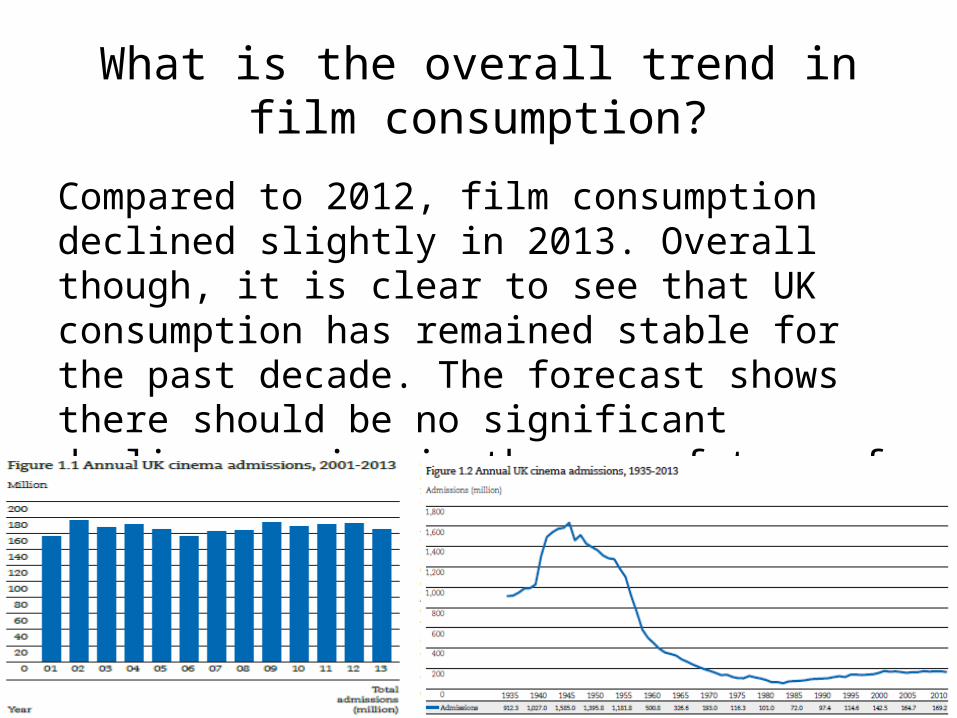
Compared to 2012, film consumption declined slightly in 2013. Overall though, it is clear to see that UK consumption has remained stable for the past decade. The forecast shows there should be no significant decline or rise in the near future of UK film consumption.
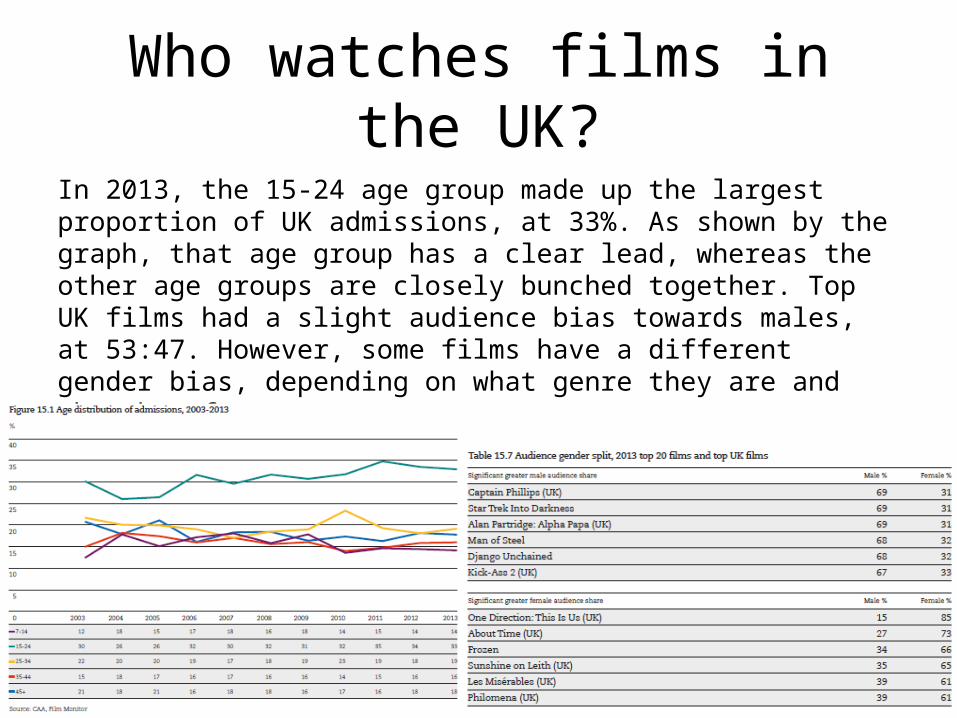
Who watches films in the UK?In 2013, the 15-24 age group made up the largest proportion of UK admissions, at 33%. As shown by the graph, that age group has a clear lead, whereas the other age groups are closely bunched together. Top UK films had a slight audience bias towards males, at 53:47. However, some films have a different gender bias, depending on what genre they are and who they feature.

Who watches films in the UK?
UK films were popular among all social groups, often attracting a significant above-average audience share. Dramas, biopics, musicals and comedies appealed most to the AB social group. In the C, D and E groups, the films were more biased towards action genre films.
Where/ how do people watch films?
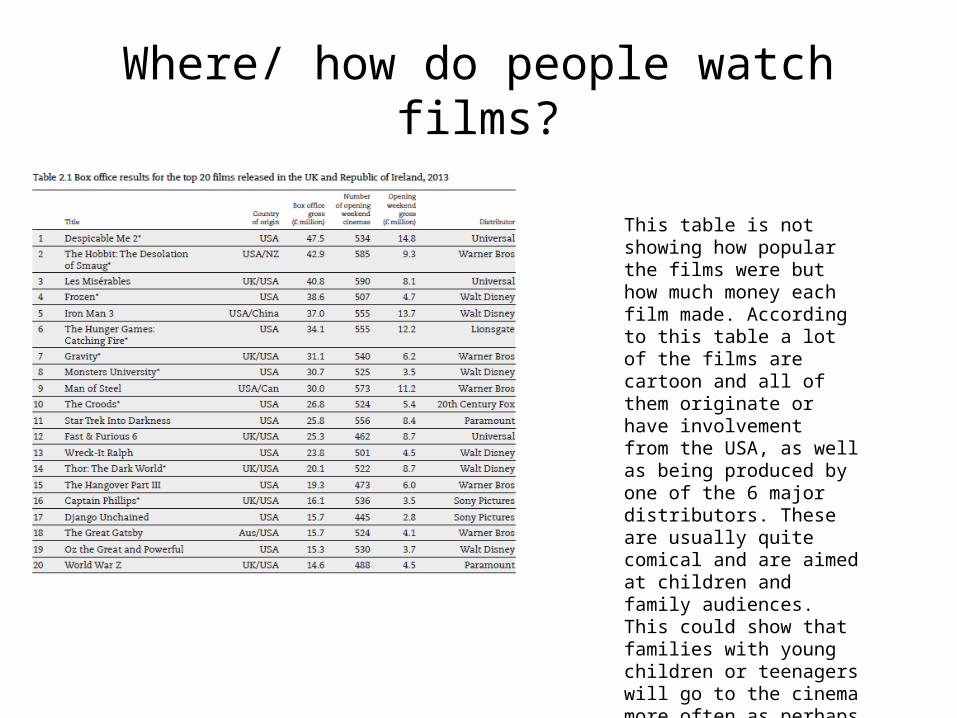
This table is not showing how popular the films were but how much money each film made. According to this table a lot of the films are cartoon and all of them originate or have involvement from the USA, as well as being produced by one of the 6 major distributors. These are usually quite comical and are aimed at children and family audiences. This could show that families with young children or teenagers will go to the cinema more often as perhaps a family outing. This could be due to the fact that cinemas offer discount tickets for families as well as children.

Where/ how do people watch films?
This graph represents the amount of people as well as the amount of money made from video sales between 1999-2013. Between 1999 and 2008 the films sold on video increased by almost thrice the amount. Meaning that more of the public were viewing films through retail video. However after 2008 the amount started to decrease with the introduction of other ways to consume video. For example things such as Video On Demand or streaming/downloading apps such as Netflix or LoveFilm.
What type of films are the most popular?
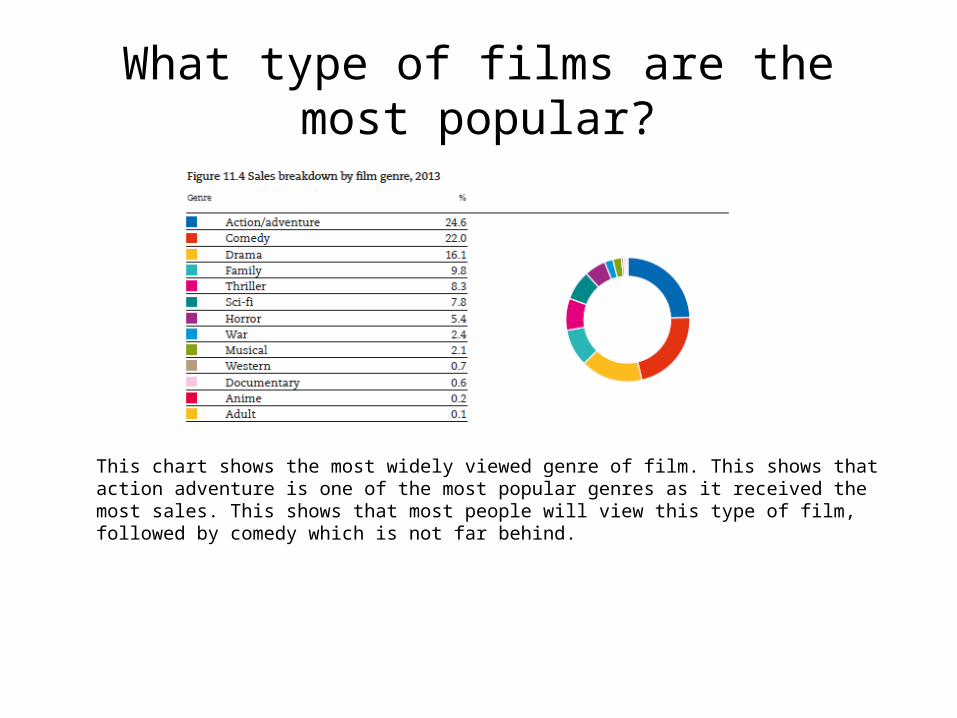
This chart shows the most widely viewed genre of film. This shows that action adventure is one of the most popular genres as it received the most sales. This shows that most people will view this type of film, followed by comedy which is not far behind.

What role does technology have?
This graph shows that in 2012 technologies like laptops were very popular and played a large role in the consumption of films. We can tell this because providers were YouTube, iTunes and Amazon were the most popular. These are usually used via the internet on a laptop or computer. However there was a change in 2013 when other apps such as Netflix, Sky Go and lovefilm were introduced. These are typically used on tablets, iPhones, iPads which are forms of new technology. These technologies play a large role in the consumption because more people are viewing films at home rather than Box Offices.

Questions– From this research I have found that being a film producer in this age
it is important to consider all types of technology when making a film. Technologies are expanding yearly and many people are deciding rather than going to the cinema they would rather consume the media through online applications or other easy accessible technologies such as phones and tablets. As you can see from this graph if you were a film producer you would think more about producing your film in a form that can be viewed on TV or online.
Which audience groups are under-represented in the figures?
From the information collected, females are slightly more under-represented than males in terms of people who go to the cinema overall. This is shown through the 53% male gender bias. However, it is not always females who are under-represented, as it depends on the genre and the cast of the movie; this can be seen with ‘One Direction: This is Us’, which has an 85% female gender bias. The 7-14 age group was also under-represented by a small margin in 2013. This could be because that a lot of films are unavailable to this age range, so they are restricted in the type of films they are allowed to watch. However, it is worth noting that the 7-14 age range is very closely followed by the 35-44 age group, and so as a result, 7-14 year olds do not consistently remain the most under-represented age range.

Which audience is the most lucrative?
It is clear that the most lucrative audience in the UK film industry are the age range of 15-24 year olds, with a slight bias to males. The gender difference was small but the age difference was quite large, which suggests that it would be a good idea to make productions appeal to a younger audience. This can be achieved through including younger characters and using relatable aspects of life, such as a group of friends. This will help achieve the appeal of the younger audience, allowing the movie to achieve its highest target audience possible.


