105
ResearchIR 4 User’s Guide Document Number: 29354-000 Revision: 3 Issue Date: February 10, 2015
ResearchIR 4 User’s Guide
Document Number: 29354-000 Revision: 3 Issue Date: February 10, 2015

ResearchIR User’s Guide 2
Copyright
© FLIR Systems, Inc., 2001-2015. All rights reserved worldwide. No parts of the software including source code may be reproduced, transmitted, transcribed or translated into any language or computer language in any form or by any means, electronic, magnetic, optical, manual or otherwise, without the prior written permission of FLIR Systems.
This manual must not, in whole or part, be copied, photocopied, reproduced, translated or transmitted to any electronic medium or machine readable form without prior consent, in writing, from FLIR Systems.
Names and marks appearing on the products herein are either registered trademarks or trademarks of FLIR Systems and/or its subsidiaries. All other trademarks, trade names or company names referenced herein are used for identification only and are the property of their respective owners.
FLIR Systems, Inc.
Customer Support: 800-GO-INFRA (464-6372) flir.custhelp.com
Service: 866-FLIR-911 (354-7911)
www.flir.com

ResearchIR User’s Guide 3
Table of Contents 1 Revision History ....................................................................................................... 7
1 Introduction .............................................................................................................. 8
2 Installation .............................................................................................................. 10
2.1 Software and GigE Driver Installation .............................................................. 10
2.2 Software License Activation ............................................................................ 13
2.2.1 License Activation Process ...................................................................... 13
2.2.1.1 Online Activation ............................................................................... 13
2.2.1.2 30-day Trial (Evaluation) ................................................................... 13
2.3 Installation Issues............................................................................................ 14
2.3.1 Firewalls ................................................................................................... 14
2.3.2 Adding Firewall Exceptions ...................................................................... 14
2.3.3 Troubleshooting steps for USB-Video cameras ........................................ 16
2.4 Configuring Pleora Drivers .............................................................................. 16
2.5 PC’s with multiple network interfaces .............................................................. 17
3 Getting Started ....................................................................................................... 18
3.1 Connecting to a camera .................................................................................. 18
3.2 Recording a file ............................................................................................... 19
3.3 Playing back the recorded file ......................................................................... 20
4 User Interface ........................................................................................................ 22
4.1 Title Bar .......................................................................................................... 23
4.2 Main Image Window ........................................................................................ 23
4.3 Image Enhancement Tool ............................................................................... 24
4.3.1 Scale Limits.............................................................................................. 24
4.3.2 AGC Algorithm ......................................................................................... 24
4.4 Color Bar ......................................................................................................... 25
4.4.1 Isotherm ROIs .......................................................................................... 26
4.5 Analysis Toolbar ............................................................................................. 27
4.6 Units and display controls ............................................................................... 28
4.6.1 Units Selector ........................................................................................... 28
4.6.2 “Info” Button ............................................................................................. 29
4.6.3 Image Invert/Revert [Max] ........................................................................ 29
4.6.4 Saturation/Clipping On/Off ....................................................................... 29
4.7 Plot and Acquisition Toolbar ............................................................................ 30
4.7.1 Plot Tools ................................................................................................. 31
4.7.1.1 Statistics Viewer ................................................................................ 32
ResearchIR User’s Guide 4
4.7.1.1.1 Stats Toolbar ..............................................................................................................32 4.7.1.1.2 Stats Table .................................................................................................................32 4.7.1.1.3 Measurement Functions [Max] ...................................................................................33 4.7.1.1.4 Adding and Editing Measurement functions ...............................................................34
4.7.1.2 Profile Plot [Max] ............................................................................... 34
4.7.1.3 Temporal Plot.................................................................................... 35
4.7.1.4 Histogram Plot [Max] ......................................................................... 36
4.7.1.5 Oscilloscope Plot [Max] ..................................................................... 36
4.7.1.6 Opening a plot ................................................................................... 37
4.7.1.7 Managing docked plots ..................................................................... 39
4.7.1.8 Plot Toolbar ...................................................................................... 40 4.7.1.8.1 Plot Cursors [Max] ......................................................................................................41 4.7.1.8.2 Plot Legend ................................................................................................................42
4.7.1.9 Plot Properties .................................................................................. 42
4.7.2 Bad Pixel Tool [Max] ................................................................................ 42
4.7.3 Acquisition Tools ...................................................................................... 44
4.7.3.1 Record Settings ................................................................................ 44
4.7.3.2 Record Mode .................................................................................... 45 4.7.3.2.1 Record to Memory Mode [Max] ..................................................................................45 4.7.3.2.2 Record to Disk Mode ..................................................................................................45 4.7.3.2.3 Periodic Recording .....................................................................................................46
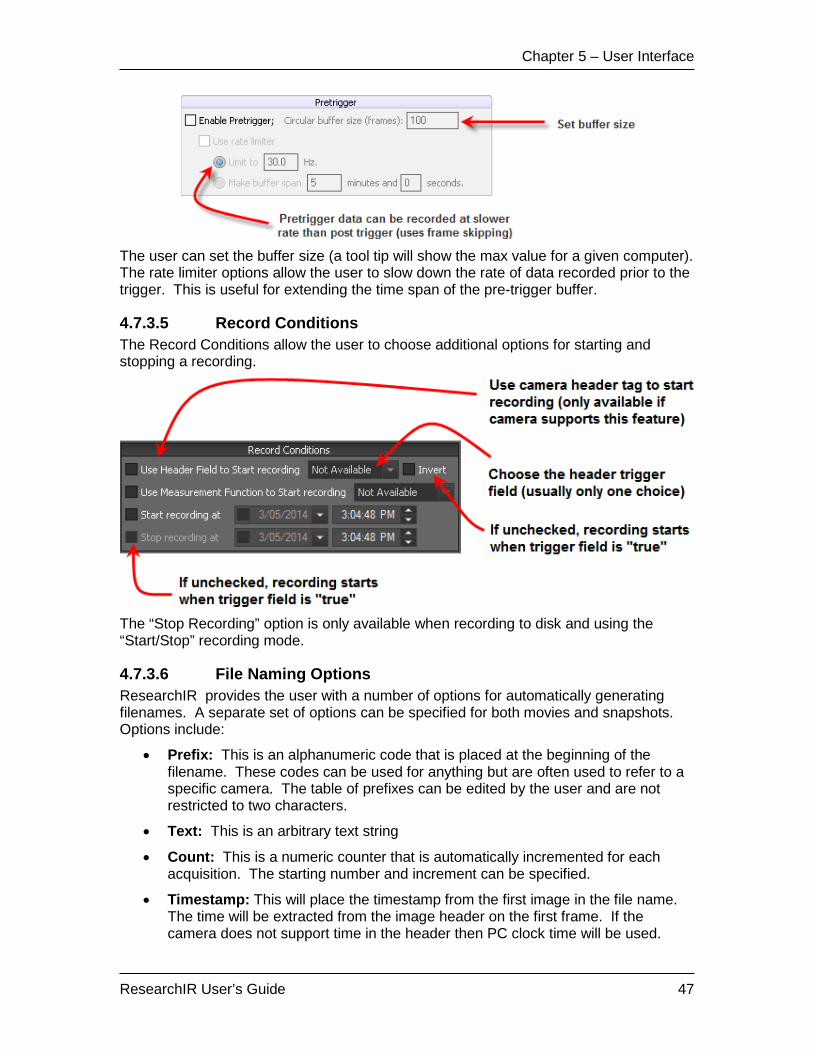
4.7.3.3 Record Options ................................................................................. 46
4.7.3.4 Pre-Trigger Recording Options [Max] ................................................ 46
4.7.3.5 Record Conditions ............................................................................ 47
4.7.3.6 File Naming Options .......................................................................... 47
4.7.4 Preset Selector [Max] ............................................................................... 48
4.8 Toolboxes [Max] .............................................................................................. 49
4.8.1 Object Parameters Toolbox ...................................................................... 50
4.8.2 Camera Control Toolbox .......................................................................... 51
4.8.3 Source Information Toolbox ..................................................................... 51
4.8.4 Minimap Toolbox ...................................................................................... 51
4.8.5 Segmentation Toolbox [Max] .................................................................... 52
4.8.6 Filters Toolbox [Max] ................................................................................ 52
4.8.6.1 MATLAB Filter ................................................................................... 54
4.8.7 HSDR Toolbox [Max+] ............................................................................. 54
4.8.7.1 First-time Setup ................................................................................. 54
4.8.7.2 Pairing............................................................................................... 55
4.8.7.3 Movie Recording ............................................................................... 55
4.8.7.4 Movie Playback ................................................................................. 56
4.8.7.5 Movie Extraction ............................................................................... 56

ResearchIR User’s Guide 5
4.8.8 File Toolbox ............................................................................................. 56
4.9 Main Menu Bar ................................................................................................ 58
4.9.1 File Menu ................................................................................................. 58
4.9.1.1 Export Dialog .................................................................................... 58
4.9.1.2 Extract Dialog [Max+] ........................................................................ 62
4.9.1.3 Batch Extract Dialog [Max+] .............................................................. 62
4.9.2 Edit Menu ................................................................................................. 62
4.9.2.1 Spatial Calibration [Max] ................................................................... 63
4.9.2.2 Preferences Dialog ........................................................................... 64
4.9.3 Camera Menu .......................................................................................... 65
4.9.3.1 Camera Selector ............................................................................... 65
4.9.3.2 Camera Control ................................................................................. 67
4.9.3.3 User Calibration [Max] ....................................................................... 67 4.9.3.3.1 Load Calibration .........................................................................................................68 4.9.3.3.2 Save Calibration .........................................................................................................68 4.9.3.3.3 Perform Calibration ....................................................................................................68
4.9.3.3.3.1 Wizard Modes .....................................................................................................69 4.9.3.3.3.2 Standard Calibration Wizard ...............................................................................70 4.9.3.3.3.3 Review Calibration Coefficients ..........................................................................79 4.9.3.3.3.4 Calibration Plots ..................................................................................................80
4.9.3.4 PC Side Correction (Max Only) ......................................................... 81
4.9.3.5 Creating a PC-Side NUC in ResearchIR ........................................... 83
4.9.4 View Menu ............................................................................................... 86
4.9.4.1 Zoom Menu ....................................................................................... 86
4.9.4.2 Palette Menu ..................................................................................... 86
4.9.4.3 Edit Palette Dialog ............................................................................ 87
4.9.4.4 Startup Dialog ................................................................................... 87
4.9.5 Tools Menu .............................................................................................. 88
4.9.5.1 Color Bar ........................................................................................... 89
4.9.5.2 Flying Spot Meter .............................................................................. 89
4.9.5.3 File Operation ................................................................................... 89
4.9.5.4 Make Self Viewing File [Max] ............................................................ 90
4.9.6 Hotkeys .................................................................................................... 91
4.9.7 Help Menu ............................................................................................... 91
4.10 Metadata display ............................................................................................. 92
4.10.1 Time in ResearchIR ................................................................................. 92
4.10.1.1 Time Source ..................................................................................... 92
4.10.1.2 Time Reference ................................................................................ 93
5 Camera Control ...................................................................................................... 94

ResearchIR User’s Guide 6
5.1 A20/A40/S45/S65 Controllers ......................................................................... 95
5.2 A320/A325/SC3xx/SC6xx Controller ............................................................... 97
5.3 SC640/SC660 Controller ................................................................................. 98
5.4 SC4000/6000/8000 Controller ......................................................................... 99
5.5 SC2500/5000/7000 (Vircam Controller) ......................................................... 100
5.5.1 Setup Page ............................................................................................ 100
5.5.2 Advanced page ...................................................................................... 101
6 Other Utilities ....................................................................................................... 103
6.1 REdit ............................................................................................................. 103
6.2 CalibratIR ...................................................................................................... 103
6.3 File AbatIR .................................................................................................... 103
6.3.1 User Interface ........................................................................................ 103
6.3.2 Output Types ......................................................................................... 104
6.4 CNUC Manager ............................................................................................ 104
7 Acknowledgements .............................................................................................. 105
ResearchIR User’s Guide 7
1 Revision History
Version Date Initials Notes
A FEB 14 2014 RIM V4.0 beta release
1 MAR 05 2014 RIM V4.0 release
2 JUL 1 2014 RIM V4.10 release
3 FEB 10 2015 RIM V4.20 release

Chapter 2 – Introduction
ResearchIR User’s Guide 8
1 Introduction
ResearchIR is a thermographic data acquisition and analysis application designed for the R&D environment.
Some of the key features of ResearchIR include:
Easy to use, customizable workspaces Supports factory and user calibrations Supports factory and user Non-Uniformity Correction (NUC) Supports all FLIR R&D cameras Supports high-speed data acquisition (HSDR) Supports SEQ, SAF, PTW, ATS, FCF and RJPG file formats Supports Windows XP/Vista/Win7/Win8 (32-bit and 64-bit, except XP 64-bit) A combination of traditional and new capabilities designed to provide a complete
solution for the R&D user
Recommended Minimum Hardware/Software: OS: Windows7 (32-bit or 64-bit)
Processor: Intel Pentium 4 2.0 Ghz or faster
RAM: at least 2GB
Hard Disk Free Space: 1GB (free space)
Network Adapter: Gigabit Ethernet
USB: One USB 1.1 (or higher) port for the license dongle, USB 2.0 required for cameras that support USB video.

Chapter 2 – Introduction
ResearchIR User’s Guide 9
End User License Agreement (EULA) Computer Software License Agreement for FLIR Systems, Inc.
NOTICE TO USER: This is a Contract.
FLIR is willing to license the Software identified as ResearchIR to You only on the condition that You accept all of the terms and conditions contained in this License Agreement. Please read the terms and conditions carefully before installing or using the software. By installing or using the software, You are indicating Your acceptance of this Agreement. If You do not agree to the terms of this Agreement, FLIR is unwilling to license the software to You. In that event, You should not install or use the Software.
1. Scope of Permitted Use: In this Agreement, "Software" shall mean the machine readable software programs and associated files identified as ResearchIR, any modified version, upgrades or other copies of such programs and files, and any associated media and printed materials. You have the nonexclusive right to install and use the Software on a single central processing unit. Only one copy of Your licensed Software may be made by and for You for backup purposes. You may not make or distribute any other copies of the Software, nor does this license permit You to allow multiple users access to a single copy of the Software via a computer network. You may not resell or redistribute the Software.
2. Proprietary Rights: The Software is owned by FLIR and/or its suppliers and You acknowledge that the structure, organization and/or code to the Software is/are the valuable trade secret(s) of FLIR. You agree to hold such trade secret(s) in confidence. You further agree not to translate, decompile, disassemble, modify, reverse engineer, or otherwise attempt to discover the source code of the Software, in whole or in part. The Software is protected by United States Copyright Law and International Treaty provisions.
3. No Other Rights: FLIR retains title and ownership to any and all copies of the Software whether transmitted electronically or recorded as diskette copies and all subsequent copies of the Software, regardless of the form or media in or on which the original and other copies may exist. Except as expressly stated, this Agreement does not grant You any rights to patents, copyrights, trade secrets, trademarks or any other rights with respect to the Software.
4. Term: The Agreement is effective until terminated. This Agreement shall terminate automatically upon failure by You to comply with any of its terms. FLIR also has the right to terminate Your license immediately at any time. Upon any such termination, You must destroy the original and any copies of the Software. However, any terms of this Agreement which can reasonably be construed to protect FLIR will survive its termination.

Chapter 3 – Installation
ResearchIR User’s Guide 10
2 Installation
FULL Administrator privileges are required to install ResearchIR and associated drivers. If you install ResearchIR on a computer managed by an IT department, please contact your System Administrator for assistance. After installation, ResearchIR can be run as a normal user.
2.1 Software and GigE Driver Installation The installation program will install the ResearchIR application. In addition, it will install necessary support software if it detects that they are not installed on you system. The support software includes:
• Pleora GigE (eBUS) drivers
• FLIR camera drivers
• Vircam SDK
• SafeNet software license support
In general, you can accept all defaults for any dialog you see during the install process. Some drivers may cause Windows to display a message that the driver is “unsigned”. This is normal. Choose the option to continue with the installation.
Important Note: If you have an ResearchIR dongle, please do not insert it until after you have installed the software.
Step 1: Launch the downloaded .EXE file. (If you downloaded the .ISO file, that can be used to create an install CD using most CD burner applications.) You will be guided through the installation wizard.

Chapter 3 – Installation
ResearchIR User’s Guide 11
Step 2: Accept the license agreement.
Step 4: Select any additional options.

Chapter 3 – Installation
ResearchIR User’s Guide 12
If this is an initial installation of ResearchIR , then you will have the option to install additional components. Components that are recommended for all users will be checked by default. If the component is already installed, it will be grayed out.
If you have used older versions of FLIR software (or have other GigE cameras, you may already have an existing installation of the Pleora driver software. ResearchIR supports many versions of the Pleora GigE drivers. However, not all versions are compatible with all cameras. The installer may indicate that certain cameras are not supported by your current version. If you need compatibility with these cameras you will need to uninstall the older Pleora software using Control Panel. Then run the ResearchIR installer again. If no Pleora software is installed you will have the option to install the latest supported version.
Uninstalling older Pleora Driver software STEP 1. Revert to Manufaturer’s NIC driver. Use the Driver Installation Tool to remove the High Performance or eBUS driver and revert back to the Manufacturer’s NIC driver. This will require a reboot.
STEP 2. Use Control Panel → Add/Remove Programs to uninstall the older Pleora software (see figure below). If you have Pleora 2.2 or newer you should remove iPORT Vision Suite, eBUS Driver Suite, and GEV Suite components from the Control Panel list. Then run the ResearchIR installation again and the latest supported version will be installed for you.
Step 5: ResearchIR will install drivers and libraries. The items displayed will vary depending on what components are already installed on the PC. A green check mark will appear next to each successfully installed component. If you see any red “x” indicators, contact FLIR support at http://flir.custhelp.com.
Step 6: Click “Finish”. ResearchIR installation is now complete.

Chapter 3 – Installation
ResearchIR User’s Guide 13
2.2 Software License Activation ResearchIR 4 requires a license key in order for the software to run. Prior to version 4.20, the license key was in the form of a USB dongle. Starting in version 4.20, the software can also be activated online by entering a provided product key. This method will require an internet connection for the activation process. (After the software is activated, an internet connection is no longer required.) Going forward, online activation will be the default method for license activation. (However, existing USB keys will continue to work and can be ordered if needed.)
2.2.1 License Activation Process When ResearchIR is first launched it will automatically search for a valid license. If multiple licenses are found (for example both software and USB key are found) then the highest level license will be used). If no license is detected then the user will see the Activation dialog. This window will present the use with three options:
1. Enter a Product Key 2. Insert a Hardware (USB) dongle 3. Start a 30-day trial (evaluation)
2.2.1.1 Online Activation If Option 1 is chosen, the user will be presented with a screen where product can be registered. User must enter the following:
1. Product Key 2. User’s name OR Company Name 3. Email address
2.2.1.2 30-day Trial (Evaluation) If you choose the 30-day trial you will have the option to try either the Max or Max+HSDR editions. The 30-day trial does not require an internet connection and the trial will start immediately. If you later activate a product key for a lower edition, the trial

Chapter 3 – Installation
ResearchIR User’s Guide 14
will continue to run until it expires and then the product key will take over. Trial periods cannot be renewed or extended. The trial time remaining can be viewed under the Help>>Gather Information menu item.
2.3 Installation Issues
2.3.1 Firewalls Firewalls will generally block connectivity to a camera. The ResearchIR installer will attempt to configure a firewall exception to the Windows firewall service. If you computer is using a third party firewall, this service may be disabled. This could cause the ResearchIR installation to abort and it will appear as if nothing was installed. To work around this issue, you will need to browse the installation CD and look for the “MSI” folder. Inside there are two msi install files (one for 32-bit and one for 64-bit). Run the appropriate file. This will run the install in a “verbose” mode. If the firewall service is disabled, you will see the error below. Click the “Ignore” button and the installation will continue normally. (NOTE: You may need to manually configure a firewall exception if you have trouble detecting and connecting to your camera.)
2.3.2 Adding Firewall Exceptions If you cannot turn off the firewall then you may need to manually add some “exceptions”. These exceptions will allow specific programs to get past the firewall. The “Vircam” exception applies to SC2500/5000/7000 series cameras. The EBservice” exception applies to SC2500/2600/5000/7000 series cameras.
The firewall is generally access through the Windows Control Panel.

Chapter 3 – Installation
ResearchIR User’s Guide 15
Choosing the option to allow a program through the firewall will present you with a list of current exceptions. If the “Allow another program…” button is disabled then you will need to click the “Change settings” button. If your computer is controlled by an IT dept you may not have permission to change these settings and you will have to get your IT person involved.
Once you get past this point you will see the “Add a Program” dialog.
Chapter 3 – Installation
ResearchIR User’s Guide 16
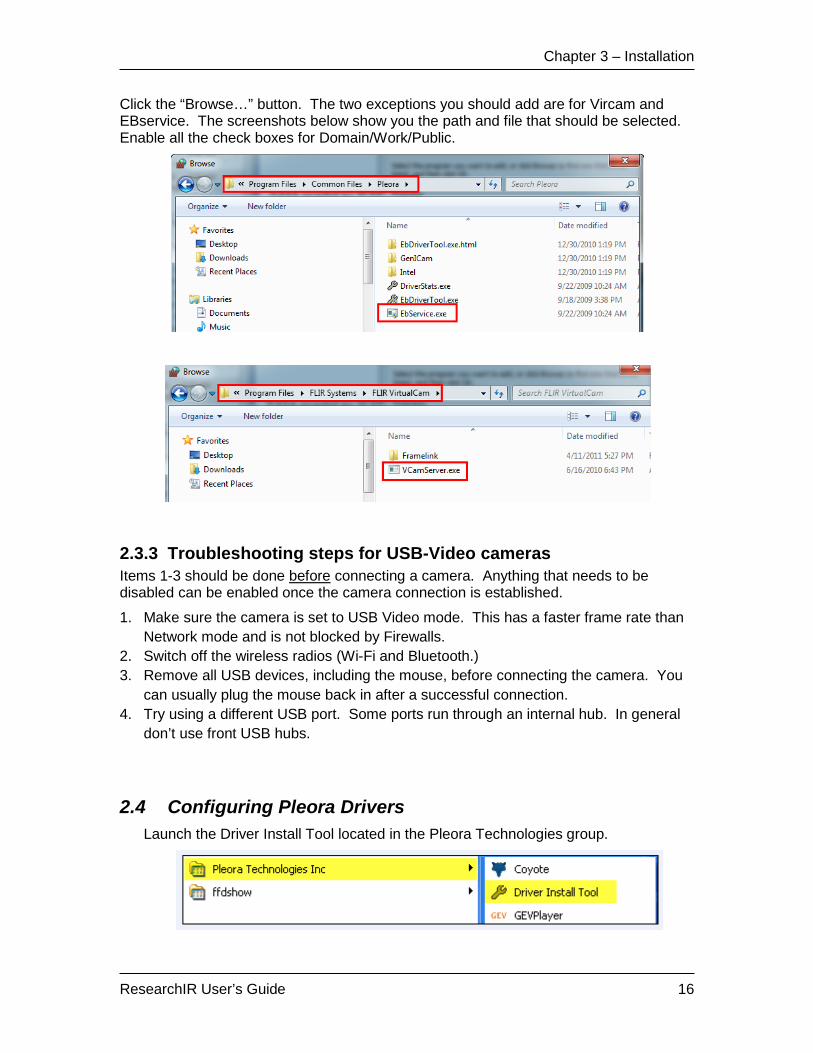
Click the “Browse…” button. The two exceptions you should add are for Vircam and EBservice. The screenshots below show you the path and file that should be selected. Enable all the check boxes for Domain/Work/Public.
2.3.3 Troubleshooting steps for USB-Video cameras Items 1-3 should be done before connecting a camera. Anything that needs to be disabled can be enabled once the camera connection is established.
1. Make sure the camera is set to USB Video mode. This has a faster frame rate than Network mode and is not blocked by Firewalls.
2. Switch off the wireless radios (Wi-Fi and Bluetooth.) 3. Remove all USB devices, including the mouse, before connecting the camera. You
can usually plug the mouse back in after a successful connection. 4. Try using a different USB port. Some ports run through an internal hub. In general
don’t use front USB hubs.
2.4 Configuring Pleora Drivers Launch the Driver Install Tool located in the Pleora Technologies group.

Chapter 3 – Installation
ResearchIR User’s Guide 17
Highlight the network adapter you want to configure and use the drop down list to select the eBUS Universal Driver. Click the Install button.
Once install is complete, the “Current Driver” field will be updated. Press the “Close” button to exit and reboot if prompted to do so.
If you need to configure more than one network adapter, it is recommended that you only configure one port at a time. See Sec 2.4 for more information on configuring PCs with multiple network interfaces.
2.5 PC’s with multiple network interfaces If your PC or laptop has multiple network interfaces (wired or wireless) there are some things to watch for that can cause issues with connecting to cameras.
It is important that both network adapters not be in the same network subnet. This is one reason that we recommend using static IP addressing because a DHCP derver will often give two consecutive addressed to the PC’s NICs. When this happens, the network routing can get confused in the Pleora driver, and traffic intended for the camera can get routed to the wrong port.
This can happen with static IP addressing if both addresses are in the same subnet. So if you have two ports, don’t set one to 192.168.10.1 and the other to 192.168.10.2. Those are in the same subnet and will cause problems. Instead use 192.168.10.1 and 192.168.11.1. Or use 192.168.10.1 for the wired port that is connected to the camera and set the wireless port to DHCP top work with your corporate network.
Chapter 5 – User Interface
ResearchIR User’s Guide 18
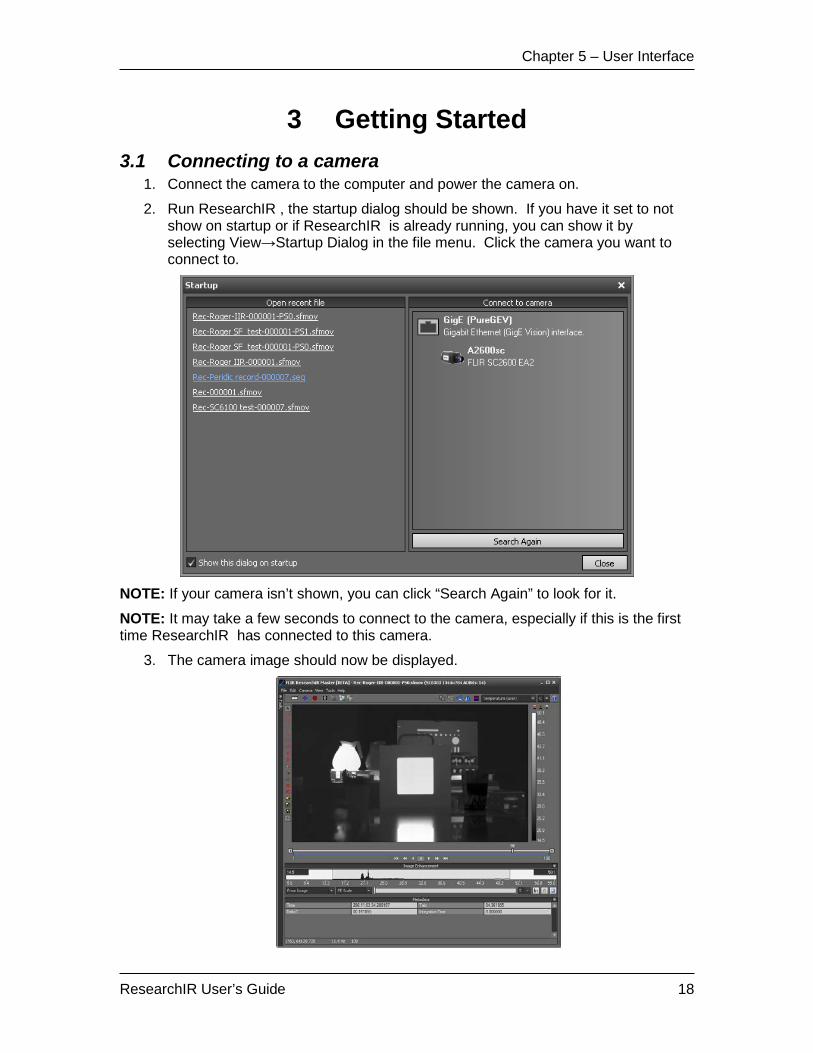
3 Getting Started 3.1 Connecting to a camera
1. Connect the camera to the computer and power the camera on.
2. Run ResearchIR , the startup dialog should be shown. If you have it set to not show on startup or if ResearchIR is already running, you can show it by selecting View→Startup Dialog in the file menu. Click the camera you want to connect to.
NOTE: If your camera isn’t shown, you can click “Search Again” to look for it.
NOTE: It may take a few seconds to connect to the camera, especially if this is the first time ResearchIR has connected to this camera.
3. The camera image should now be displayed.

Chapter 5 – User Interface
ResearchIR User’s Guide 19
3.2 Recording a file 1. Move your mouse over the record toolbar button and the click on the configure
icon.
2. Set the recording and file naming options you want and click “OK”.
3. Move your mouse over the record toolbar button and click the record button (or use F5 if that option was enabled).

Chapter 5 – User Interface
ResearchIR User’s Guide 20
4. ResearchIR will record a file. Wait for the status to display “Done” and the “Close” button to appear then click “Close”.
3.3 Playing back the recorded file 1. Make sure the File toolbox is visible by expanding the toolbox window and the
File toolbox if they are not already expanded. (NOTE: If you don’t have a dongle and are running ResearchIR Basic then you won’t have access to the Toolboxes. You will have to use the File Menu to access your recorded data.)
2. Click the show record folder button to display the record folder in the file toolbox then double click on the file you just recorded.

Chapter 5 – User Interface
ResearchIR User’s Guide 21
3. The file should now be displayed.
NOTE: Files can also be played back by opening them with File→Open in the File menu.

Chapter 5 – User Interface
ResearchIR User’s Guide 22
4 User Interface
The ResearchIR main window is comprised of ten main regions:
1. Title Bar (Sec. 4.1)
2. Main image window (Sec. 4.2)
3. Image Enhancement Tool (Sec. 4.3)
4. Colorbar (Sec. 4.4)
5. Analysis Toolbar (Sec. 4.5)
6. Unit and Display controls (Sec. 4.6)
7. Plot and Acquisition Toolbar (Sec. 4.7)
8. Toolboxes. (ResearchIR Max Only). (Sec. 4.8)
9. Main Menu Bar (Sec. 4.9)
10. Metadata display (Sec. 4.10)

Chapter 5 – User Interface
ResearchIR User’s Guide 23
4.1 Title Bar
Indicates what ResearchIR edition is running. There are three options:
• ResearchIR : indicates that the Standard edition is running.
• ResearchIR Max: indicates that all add-on modules except HSDR are enabled
• ResearchIR Max + HSDR: indicates that all add-on modules are enabled.
NOTE: This manual describes features for all three editions. Some features are not supported in all editions. Throughout the user manual a feature section heading may have a notation in [ ] brackets. This notation will indicate the minimum edition level that will support this feature. Your license key will indicate and control what edition level you have access to. If you wish to upgrade to a higher edition, please contact your sales representative for more information.
4.2 Main Image Window The Main Image Window displays either live imagery from a camera or stored images and movies. By default, the image size stretched as the application window is resized. This can be changes by selecting a different zoom factor in the View→Zoom menu. When a previously recorded movie is loaded, the movie player controls will be displayed at the bottom of the image window.
NOTE: The Start and End frame for the play limits are also used for the Extract feature discussed in Section 4.9.1.2.

Chapter 5 – User Interface
ResearchIR User’s Guide 24
4.3 Image Enhancement Tool This tool allows the user to control the scale limits and how the color palette is mapped to the data. A real-time histogram of the data is display for each image frame so that the user can see how the data values are distributed. This powerful tool can allow the user to see amazing detail even in low contrast imagery.
4.3.1 Scale Limits ResearchIR offers four choices for setting the scale limits.
Scale Limits From Description
Image ResearchIR looks at the entire image to determine the min and max values for the scale
Active ROI [Max] ResearchIR looks only at the values within the selected ROI to determine min and max values for the scale
Segmentation [Max] ResearchIR uses the limits in the Segmentation Toolbox to determine min and max values for the scale
Manual
The user manually sets the limits either by: (1) typing numbers in the boxes at the left and right
corners of the data histogram (2) using the mouse to drag the edges of the shaded
box on the histogram
4.3.2 AGC Algorithm ResearchIR offers three choices for AGC algorithms. These algorithms can improve image detail and contrast.
Algorithm Description
Linear Simple linear mapping. Evenly distributes the color in the palette across all count values.
Plateau Equalization (PE) Non-linear, histogram based algorithm. Provides good contrast for almost all scenes. The slider, next to the drop down controls the aggressiveness of the algorithm
Digital Detail Enhancement (DDE) [Max]
FLIR proprietary algorithm. Runs in addition to PE. Enhances image detail. The drop down next to the PE slider controls the aggressiveness of the DDE algorithm.

Chapter 5 – User Interface
ResearchIR User’s Guide 25
Algorithm Description
Advanced Plateau Equalization (APE) [Max]
FLIR proprietary algorithm. Enhances image detail. The drop down next to the PE slider controls the aggressiveness of the APE algorithm.
4.4 Color Bar The Color bar shows the relationship between the color palette and the data values in the currently selected units. The palette can be changed by using the View→Palette menu. The scale limits and the color distribution are controlled by the Image Enhancement Tool.
The current segmentation levels are also displayed on the color bar as full width shaded regions in the currently selected segmentation colors.
Active Isotherm ROIs are displayed as half width shaded regions. Isotherm limits can be adjusted by dragging the ROI on the color bar. Isotherms ROIs can be deleted by clicking the isotherm on the color bar and pressing the Delete key.

Chapter 5 – User Interface
ResearchIR User’s Guide 26
4.4.1 Isotherm ROIs Isotherm ROIs are added by using the buttons above the color bar.
There are three types:
Interval: User sets range by dragging on color bar
Above: User click on color bar to set lower limit
Below: User clicks on color bar to set upper limit
Endpoints can be adjusted by dragging the limits on the color bar. Right click to set properties.
Although there are tools to create Above/Below/Interval isotherms, any isotherm can be converted to any type using the min/max properties. Right click the isotherm and choose Properties from the pop up menu.
Above isotherms have the max box checked. Below isotherms have the min box checked. Interval isotherms have neither box checked.
The Track By option tells ResearchIR how to display the isotherm as the scene change over time.
Isotherm Track By: Description
Value Isotherm stays locked to the value limits. This is the most common setting.
Color Isotherm is locked to the color bar values. As the scene changes and the AGC adjusts the color assignments the isotherm numerical limits can change.

Chapter 5 – User Interface
ResearchIR User’s Guide 27
4.5 Analysis Toolbar The Analysis Toolbar allows the user to draw a Region of Interest (ROI) using a variety of drawing tools.
Icon Name Description
Select/Edit ROI
With this tool selected, the user can mouse over an ROI. The ROI can be dragged to move it or the user can grab a “handle” to resize the ROI
Box ROI Draw an arbitrary rectangular box.
Ellipse ROI [Max] Draw an arbitrary ellipse
Line ROI [Max] Draw a straight line
Bendable Line
ROI [Max]
Draw a multi-segment line. Each left click adds a vertex. Right click to stop adding points. Using the Edit ROI tool the vertex points can be moved individually.
Polygon ROI
[Max]
Draw a closed polygon. Left click to add a vertex. Right click to close the polygon. Using the Edit ROI tool the vertex points can be moved individually.
Freehand ROI
[Max]
Draw a freehand shape. Hold down the left mouse button and drag to draw. Release the left button to close the ROI.
Spot Cursor ROI
[Max] This ROI reads the value of a single pixel.
Measurement Cursor ROI
Reads the average of a 3x3 box of pixels. Standard practice in thermography is to use a 3x3 block of pixels for measurements.
Add/Remove Point [Max]
Add/remove vertex from Bendable Line or Polygon. Click on a vertex to deleted it or click on a line segment to add a vertex.
Rotate ROI [Max] With this tool selected, mouse over an ROI to activate the
“handles”. Drag the ROI to rotate it.
Select Next ROI Select next ROI. Use to select very small or overlapping
ROIs
Delete current
ROI Select an ROI and then click this button or press Delete key to remove it
Delete All ROIs Clears all ROIs
Load ROIs [Max] Load an ROI descriptor file
Merge ROIs [Max] Load ROIs from file and add to existing ROIs

Chapter 5 – User Interface
ResearchIR User’s Guide 28
Icon Name Description
Save ROIs [Max] Save an ROI descriptor file
Show/Hide ROIs Allows user to turn on/off the display of ROIs without having to delete and add them
Isotherm ROI
[Max] This tool is located above the color bar. See section 5.4.1
4.6 Units and display controls
4.6.1 Units Selector This dropdown allows the user to choose the data units. The units available depend on the type of calibration done with the camera.
Factory calibrated cameras typically allow:
• Counts [Max]
• Object Signal (N/A for SCx000 camera) [Max]
• Temperature (factory)
• Radiance (factory) [Max]
User calibrated cameras typically allow:
• Counts
• Radiance (user) [Max]
• Temperature (user) [Max]

Chapter 5 – User Interface
ResearchIR User’s Guide 29
Unit Description
Counts [Max] Digital value of pixel. Often referred to as “raw data” but can be NUC corrected. Cameras typically have a 14-bit A-D converter so the resulting values will be in the range of 0-16383
Object Signal [Max] Typically available only on handheld cameras. This NUC corrected but is proportional to radiance. Typically not of use to the user but used internally for diagnostic purposes.
Temperature If the camera is calibrated, the raw pixel counts can be converted to units of temperature.
Radiance [Max] Measure of IR power per unit area of the target. Units of Watts/(cm2-steradian).
4.6.2 “Info” Button The “Info” button gives the user a quick preview of file naming and acquisition settings. Hovering the mouse over the “i” will show the info panel. Clicking the “i” button will make the info panel a floating box that stays open until you close it.
4.6.3 Image Invert/Revert [Max]
The buttons will cause the image to be flipped vertically or horizontally. This flipping is done in software. Some cameras also have image flipping controls, but activating these will require the NUC to be updated. Flipping the image on the computer side will not affect the NUC.
4.6.4 Saturation/Clipping On/Off
With the , control “on”, the software will display color indicators on the image and colorbar to show if data in the image is exceeding calibration limits. Turning this control off suppress these visual indicators.

Chapter 5 – User Interface
ResearchIR User’s Guide 30
4.7 Plot and Acquisition Toolbar
This toolbar provides quick access to plotting and acquisition functions. The icon for the currently selected tool is displayed. When the mouse is placed over the current tool a drop down menu is displayed to show other available tools.
Icon Tool Description
Plot Tools
User can choose from a selection of plots for each ROI. Only the Stats table and Temporal plot are available in ResearchIR Basic.
Bad Pixel Tool [Max]
Allows user to manually add a bad pixel to the Bad Pixel Map (BPM). Click the reticle tool and use the mouse or arrow keys to place the reticle over the pixel to be marked. Click the +/- button to add or remove the pixel from the BPM
Acquisition Tools
Allows user to start or stop the acquisition, record a snapshot or movie and to set acquisition options.
Preset Selector [Max]
Allow user to select the displayed preset. Only available if camera supports Preset Sequencing (PS) and PS or Superframing must be active.
Arm Recording [Max]
This is optional for pre-trigger recordings. This button pre-allocates memory; otherwise, memory is allocated at the time the recording is triggered. When requesting a large memory buffer this can add a delay to the start of recording. If you are triggering off a header flag, then it is best to Arm the recording so you can be sure the first flagged frame is captured
Export Bitmap
This is a quick export option. It will capture a full image with no border and write a PNG image to the Picture>>FLIR Systems folder. IT DOES NOT USE THE NORMAL EXPORT OPTIONS

Chapter 5 – User Interface
ResearchIR User’s Guide 31
Icon Tool Description
Toggle File Operation [Max]
Use this button to easily turn the File Operation feature On and Off.
UltraMax File detected
This button will appear when an UltraMax file is opened. Click the button will show two options. (1) Upgrade and replace current file with UltraMax image or (2) Backup the existing file before upgrading the file. The file will be backed up to a folder within the current folder. [NOTE: once a file is upgraded it cannot be downgraded again.]
Apply PC-side NUC [Max]
Turns PC-side NUC on or off. Button only active is PC-side NUC has been done.
Apply PC-Side Bad Pixel Map [Max]
Turns PC-side BPM on or off. Button only active if PC-side BPM has been done.
4.7.1 Plot Tools This toolbar allows the user to choose from various plots. You can have one of each plot type per Region of Interest (ROI). Each of these plots can be free-floating or they can be “docked”. The available plot types include:

Chapter 5 – User Interface
ResearchIR User’s Guide 32
4.7.1.1 Statistics Viewer The Statistics Viewer allows the user to see a variety of statistic for all the ROIs currently drawn. It is divided into three main areas.
1. Stats table toolbar 2. Stats table 3. Measurement functions
4.7.1.1.1 Stats Toolbar
Pause the update of the stats. (While the image keeps updating). Click again to restart the update.
Save the current stats to a text file
Turn on/off the Image ROI. Creates a column in the table with stats for the whole image.
ROI Subtraction. Opens a dialog that allows the user to create an new column in the stats table that is a subtraction of two current ROIs.
4.7.1.1.2 Stats Table There will be one column in the table for each active ROI. The top line of each column shows the ROI name and it color.

Chapter 5 – User Interface
ResearchIR User’s Guide 33
These can be changed by right clicking on the ROI or its column in the table and choosing “Properties” from the menu.
NOTE: Emissivity must be a value between 0 and 1. If you enter a value outside this range the box will turn yellow to indicate an invalid entry.
4.7.1.1.3 Measurement Functions [Max] This tool allows the user to define mathematical expressions using ROI statistics. Any number can be defined. Once a function is defined you can view the expression by mousing over the function name. Measurement functions are managed using the toolbar at the top of the pane.
Add Function
Opens the function definition dialog. User can create a mathematical expression using constants, object parameters, ROI stats, and other measurement functions. An arbitrary name can be assigned to the function and will be displayed in the table.
Edit Function Opens the function definition dialog with the current
expression. Edit the expression and click OK to save.
Delete Function Deletes the highlighted function.
Delete All Functions Clears the Measurement Function table
Load Functions User can load a previous set of function from disk
Save Functions User can save a set of functions for later use
Temporal Plot User can create a temporal plot of a defined function.

Chapter 5 – User Interface
ResearchIR User’s Guide 34
4.7.1.1.4 Adding and Editing Measurement functions Choosing to add or edit a function will bring up the Measurement Function Editor.
The left area (1) allows the user to choose a an input variable. Possible choices include existing ROIs, data from the camera image header, or even other measurement functions. Click the arrows to expand the lists. The top are (2) allows the user to set the name nd reference color for the function. Area (3) shows the complete expression as a “formula”. These formulas can be a combination of inputs and math functions from the “calculator” area. Boolean functions (True, False, etc) can be used to evaluate the function and this state can be used to trigger the start of data recoding. (See Recording Conditions, Sec 5.7.3.5)
4.7.1.2 Profile Plot [Max] The Profile Plot creates a linear graph of the data along an ROI. If the ROI is a line (straight or bendable), this will be a traditional linear profile, where the actual data values (in the currently selected units) are plotted on an X-Y graph. If the ROI is an area (box, circle, polygon, freeform, or isotherm) then plot will be a “thick profile”. Think of a thick profile as drawing a line across an ROI and then computing a statistic (Mean, Max, etc). That will be one data point in the thick profile. You then scan the line across the ROI one pixel at a time. This will produce a series of data points. As shown in the picture below, the thick profile can horizontal or vertical.

Chapter 5 – User Interface
ResearchIR User’s Guide 35
If you open the plot tools by clicking the “<<” icon in the upper right corner of the plot, you can choose the direction and statistic for the thick profile.
4.7.1.3 Temporal Plot The Temporal plots allows the user to plot an ROI statistic versus time

Chapter 5 – User Interface
ResearchIR User’s Guide 36
4.7.1.4 Histogram Plot [Max] The Histogram Plot shows the user the distribution of values within an ROI.
4.7.1.5 Oscilloscope Plot [Max] The Oscilloscope Plot (O-scope) gives the user an “edge-on” view of the image. The O-scope can be thought of as a line profile with a profile for all the rows overlayed on top of each other. This allows the user to quickly identify regions of the image that are saturated. This plot can be very useful when setting up a camera for a user calibration to make sure that the integration time is set correctly.

Chapter 5 – User Interface
ResearchIR User’s Guide 37
4.7.1.6 Opening a plot 1. Select an ROI by clicking on it. The ROI color will change slightly and sizing
handles will appear to indicate that the ROI is selected.
2. If you want to open the plot to its default location, just click the plot button without
dragging.
3. If you want to open the plot and drag into a specific dock location, click and drag
the plot button into a dock location. The plot will be displayed as a translucent preview.
4. When a plot can be docked into a dock location the dock location will highlight
blue.

Chapter 5 – User Interface
ResearchIR User’s Guide 38
5. Release the left mouse button to dock the plot.
NOTE: Plots can be docked to the right and bottom of the initial ResearchIR layout. When a plot is docked, it creates a plot container. New plots can be docked to the top, left, bottom, right, and inside plot containers. In addition, there are two options for docking a plot inside a plot container. As shown in the figure below, selecting the left-
Chapter 5 – User Interface
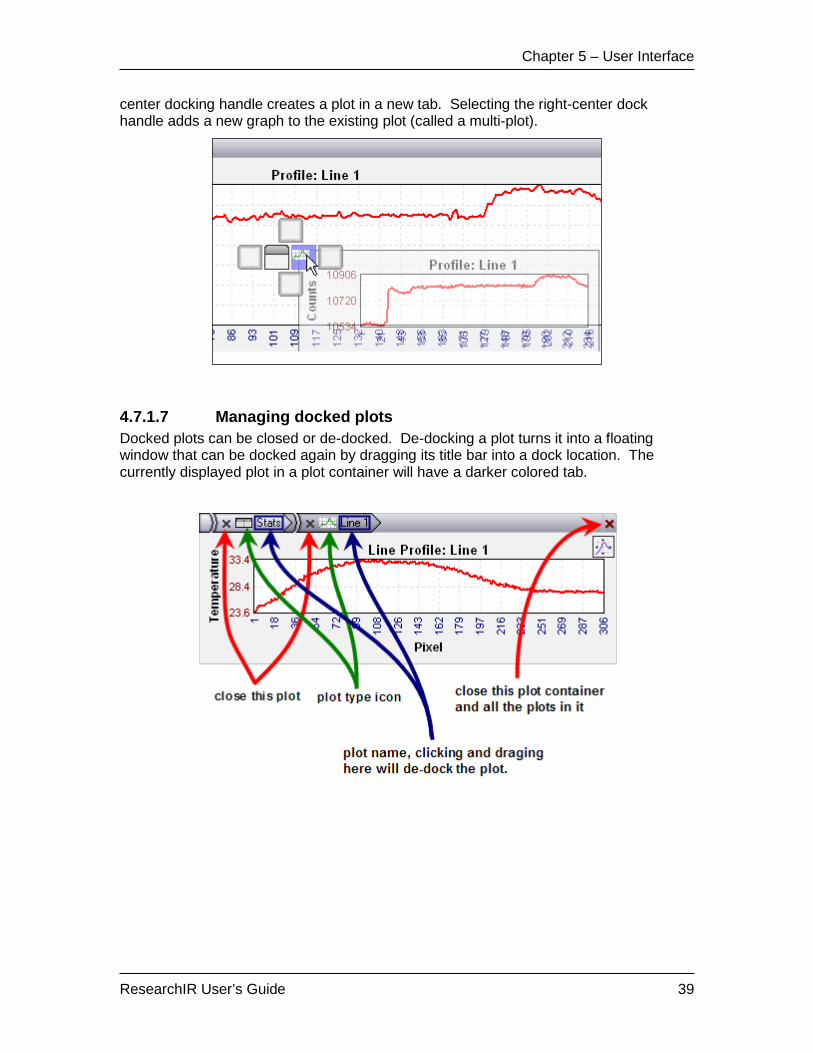
ResearchIR User’s Guide 39
center docking handle creates a plot in a new tab. Selecting the right-center dock handle adds a new graph to the existing plot (called a multi-plot).
4.7.1.7 Managing docked plots Docked plots can be closed or de-docked. De-docking a plot turns it into a floating window that can be docked again by dragging its title bar into a dock location. The currently displayed plot in a plot container will have a darker colored tab.

Chapter 5 – User Interface
ResearchIR User’s Guide 40
4.7.1.8 Plot Toolbar When the mouse cursor is hovering over the plot, the plot toolbar is activated and can be seen in the upper right corner of the plot window.
Clicking the “<<” opens the toolbar with all the available plot tools. Mousing over a tool will display a tooltip with the tool name. Not all tools are available for all plot types
The plot tools include:
Icon Tool Description
Reset Reset plot option to default values
Lock Scales Do not auto scale. This option may be activated in conjunction
with other tools such as zoom.
Pan Use mouse to move plot
Horizontal Box
Zoom Use mouse to click and drag horizontal. Captures full y-axis.
Vertical Box
Zoom Use mouse to click and drag vertical. Captures full x-axis.
Arbitrary Box
Zoom Use mouse to draw an arbitrary box
Horizontal Magnify Only zoom x-axis. Left click to zoom in. Right click to zoom out.
Vertical Magnify Only zoom y-axis. Left click to zoom in. Right click to zoom out.
Chapter 5 – User Interface
ResearchIR User’s Guide 41
Icon Tool Description
Arbitrary Magnify
Zoom both x and y-axis. Left click to zoom in. Right click to zoom out.
Cursor select
On/Off When enabled (blue), user can set cursor location.
Print Send plot capture to printer device
Save (BMP or
CSV) Save plot data to disk
Clear all plots Clear plots (temporal plot only)
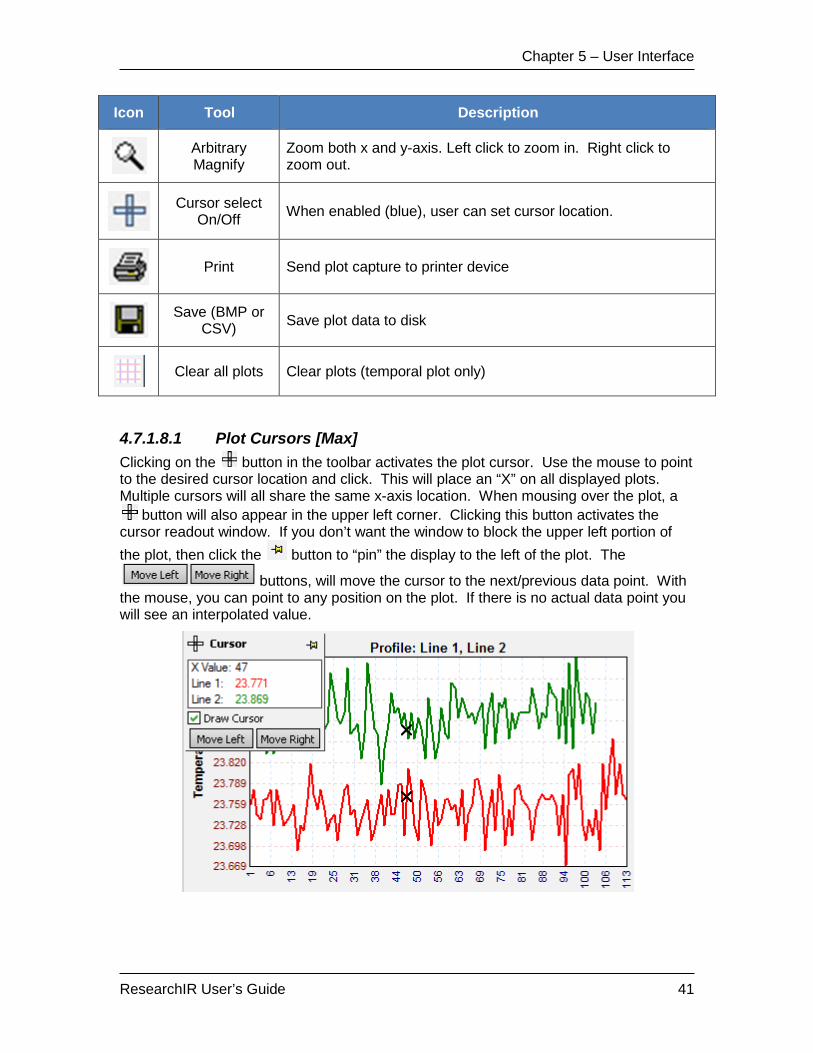
4.7.1.8.1 Plot Cursors [Max] Clicking on the button in the toolbar activates the plot cursor. Use the mouse to point to the desired cursor location and click. This will place an “X” on all displayed plots. Multiple cursors will all share the same x-axis location. When mousing over the plot, a
button will also appear in the upper left corner. Clicking this button activates the cursor readout window. If you don’t want the window to block the upper left portion of the plot, then click the button to “pin” the display to the left of the plot. The
buttons, will move the cursor to the next/previous data point. With the mouse, you can point to any position on the plot. If there is no actual data point you will see an interpolated value.

Chapter 5 – User Interface
ResearchIR User’s Guide 42
4.7.1.8.2 Plot Legend Under the toolbar is the interactive legend. The legend can be used to select the y-axis scale or delete a graph from a plot. To show a mini (non-interactive) legend when the tool bar is closed, right click on the plot and choose “Properties” from the menu. On the Legend tab there is an option to draw the legend.
4.7.1.9 Plot Properties Right-clicking on any plot window will bring up the plot properties dialog. This dialog allows the user to customize the plot appearance.
4.7.2 Bad Pixel Tool [Max] The Bad Pixel Tool allows the user to manually add bad pixels to the Bad Pixel Map (BPM) that was created when doing a PC-Side Non-Uniformity Correction (PC-NUC). Place the cursor over the bad pixel and click the add/remove button (or the Spacebar) to mark the pixel as bad. Pressing the button again will unmark the pixel. Once the pixel has been marked it will turn blue. Clicking the Bad Pixel tool again (see cursor in picture below) will turn off the tool and all blue pixels will be replaced with a nearest good pixel.

Chapter 5 – User Interface
ResearchIR User’s Guide 43
The program will search for a good replacement pixel using the pattern indicated below. It will start with the pixel to the upper left of the bad pixel. If that pixel is bad or invalid (pixel is in a corner) the algorithm will search other adjacent pixels. If none of those pixels are good then the algorithm will expand the search ring by one pixel.

Chapter 5 – User Interface
ResearchIR User’s Guide 44
4.7.3 Acquisition Tools The Acquisition Tools allow the user to start and stop the live display, record single images or movies and set recording options.
4.7.3.1 Record Settings Selecting the “Edit Recording Settings” Tool displays the following dialog. This dialog allows the user to choose the Record Mode (To Memory or To Disk) as well as Record Options and the location to store recorded data. Each section of this dialog is explained in more detail in the sections that follow.

Chapter 5 – User Interface
ResearchIR User’s Guide 45
4.7.3.2 Record Mode Allows user to choose option for recording to memory or disk
4.7.3.2.1 Record to Memory Mode [Max] Recording to PC memory is the fastest recording mode, but the time is limited by available physical RAM (does not use virtual RAM). When recording to PC memory the user can set either a specific number of frames to record or a time to record, in minutes or seconds.
When specifying time it is still necessary to specify a max frame limit. The frame limit can be much higher than the number of frames needed to record the specified time.
The thing to keep in mind for all recordings to memory is that the frame limit is used to allocate a RAM buffer. RAM allocated to this buffer will not be available to other applications running on the PC. If the number specified is more than can be from continuous PC RAM, the acquisition will not start properly. You will see the acquisition status dialog but the acquisition will terminate with zero frames acquired. If this happens, lower number of frames to record.
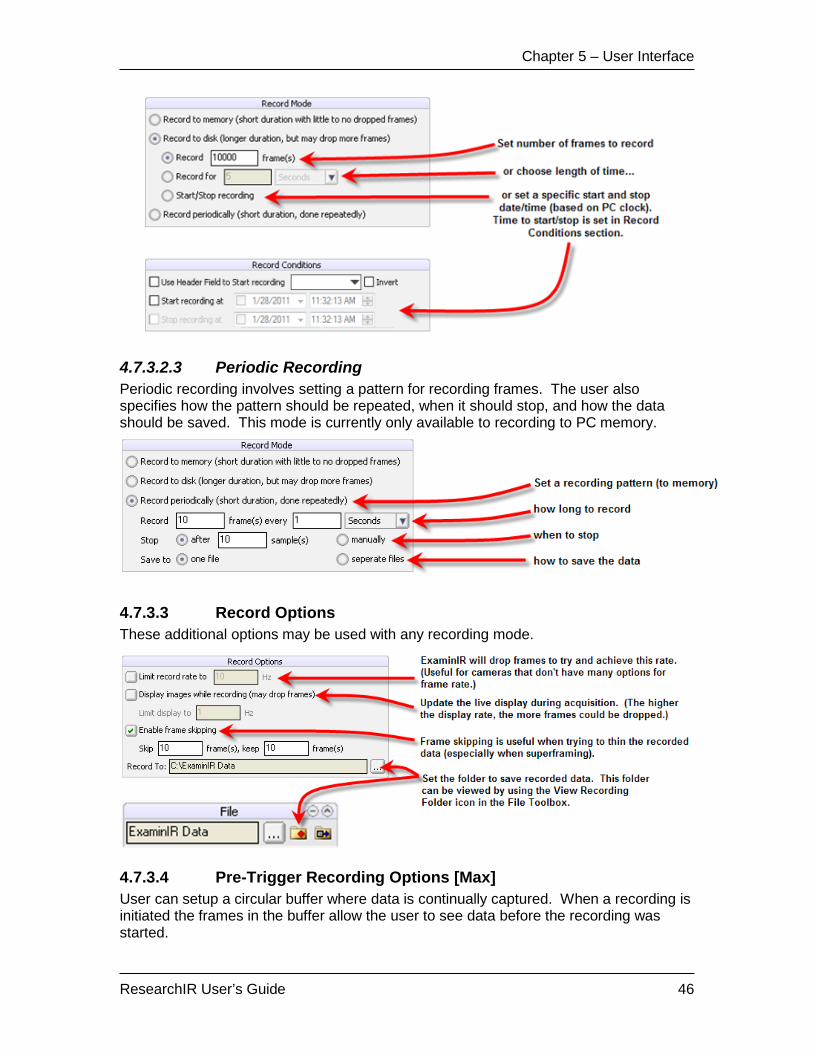
4.7.3.2.2 Record to Disk Mode Recording to disk can accommodate longer recording times, but at a slower rate. In addition to setting a number of frames or length of time for recording, the user can stop or start the recording with the F5 key or use the PC clock to start or stop the acquisition.
Chapter 5 – User Interface
ResearchIR User’s Guide 46
4.7.3.2.3 Periodic Recording Periodic recording involves setting a pattern for recording frames. The user also specifies how the pattern should be repeated, when it should stop, and how the data should be saved. This mode is currently only available to recording to PC memory.
4.7.3.3 Record Options These additional options may be used with any recording mode.
4.7.3.4 Pre-Trigger Recording Options [Max] User can setup a circular buffer where data is continually captured. When a recording is initiated the frames in the buffer allow the user to see data before the recording was started.
Chapter 5 – User Interface
ResearchIR User’s Guide 47
The user can set the buffer size (a tool tip will show the max value for a given computer). The rate limiter options allow the user to slow down the rate of data recorded prior to the trigger. This is useful for extending the time span of the pre-trigger buffer.
4.7.3.5 Record Conditions The Record Conditions allow the user to choose additional options for starting and stopping a recording.
The “Stop Recording” option is only available when recording to disk and using the “Start/Stop” recording mode.
4.7.3.6 File Naming Options ResearchIR provides the user with a number of options for automatically generating filenames. A separate set of options can be specified for both movies and snapshots. Options include:
• Prefix: This is an alphanumeric code that is placed at the beginning of the filename. These codes can be used for anything but are often used to refer to a specific camera. The table of prefixes can be edited by the user and are not restricted to two characters.
• Text: This is an arbitrary text string
• Count: This is a numeric counter that is automatically incremented for each acquisition. The starting number and increment can be specified.
• Timestamp: This will place the timestamp from the first image in the file name. The time will be extracted from the image header on the first frame. If the camera does not support time in the header then PC clock time will be used.

Chapter 5 – User Interface
ResearchIR User’s Guide 48
4.7.4 Preset Selector [Max] For cameras that support Preset Sequencing (also called Superframing or Multi-IT), the Preset Selector control allow the user to choose which preset to display. This feature is currently only available in SCx000 and RSx000 cameras.
Control Description
Tells ResearchIR to display all active presets in sequence. For general display purposes this mode is not very helpful because it can be quite “flashy” as the AGC adjusts from frame to frame. This mode is useful if you are trying to do a PC-side NUC with multiple presets. With this mode ResearchIR will NUC all active presets at the same time, using the same NUC scenes. Depending on the integration times being used this may or may not produce optimal results.
Tells ResearchIR to filter out a particular preset for display. If a chosen preset is not active in the camera, ResearchIR will display an message “Frame Not Available” in the image window.
Enables real-time Dynamic Range Extension (DRX). If a camera is calibrated (factory or user), with a different temperature range loaded in each preset, this option will apply the DRX algorithm. Using Preset Sequencing, DRX will take the best pixel data from each preset and combine the data to form a new image that spans all of the available calibration ranges. This allows the user

Chapter 5 – User Interface
ResearchIR User’s Guide 49
to span a much larger dynamic range than could typically be covered with one integration time. DRX works best for static scenes.
4.8 Toolboxes [Max]
Toolboxes are only available in ResearchIR Max. Toolboxes allow uses to access advanced program functions. Some toolboxes are available only if a certain add-on module is active, such as User Calibration, Export, or Dynamic Range Extension. Other toolboxes are only available for certain camera types. For example, the Object Parameters Toolbox is only available if a camera has a factory calibration.
The toolbox view can be customized to show only what the user wants to see. The program will remember the last settings the next time the program is started.

Chapter 5 – User Interface
ResearchIR User’s Guide 50
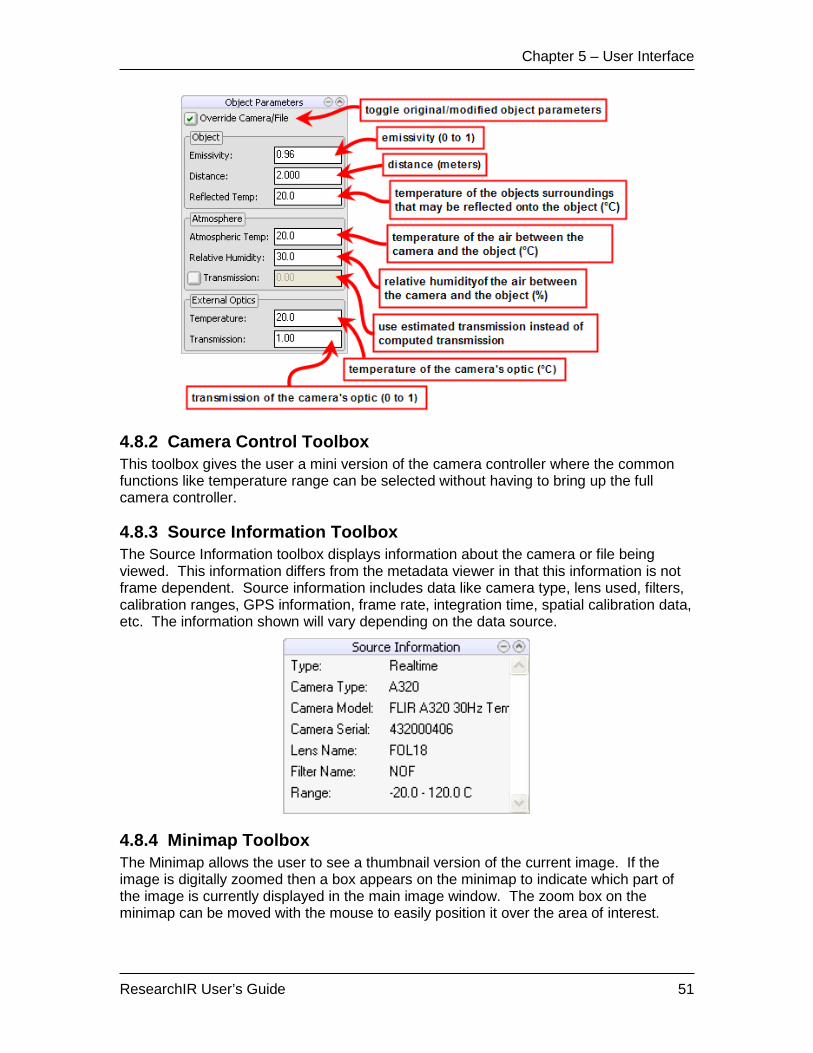
4.8.1 Object Parameters Toolbox Object Parameters are used to more accurately compute the temperature of an object. The object parameters toolbox displays the current object parameters as downloaded from the camera and allows you to edit them. Editing the values in the toolbox overrides the values coming from the camera but does not change the values for these parameters in the camera. (NOTE: For ResearchIR Basic users, this toolbox is available under the Tools menu.)
Chapter 5 – User Interface
ResearchIR User’s Guide 51
4.8.2 Camera Control Toolbox This toolbox gives the user a mini version of the camera controller where the common functions like temperature range can be selected without having to bring up the full camera controller.
4.8.3 Source Information Toolbox The Source Information toolbox displays information about the camera or file being viewed. This information differs from the metadata viewer in that this information is not frame dependent. Source information includes data like camera type, lens used, filters, calibration ranges, GPS information, frame rate, integration time, spatial calibration data, etc. The information shown will vary depending on the data source.
4.8.4 Minimap Toolbox The Minimap allows the user to see a thumbnail version of the current image. If the image is digitally zoomed then a box appears on the minimap to indicate which part of the image is currently displayed in the main image window. The zoom box on the minimap can be moved with the mouse to easily position it over the area of interest.

Chapter 5 – User Interface
ResearchIR User’s Guide 52
4.8.5 Segmentation Toolbox [Max] The Segmentation toolbox controls if and how segmentation is applied to the image data. Segmentation defines a range of values that are considered valid in the image. For instance, if the segmentation min and max are 7000 counts and 9000 counts respectively then only the pixels in the image that have a value between 7000 and 9000 are considered valid. All other pixels are segmented out (ignored). Pixels that are segmented out are not included when computing statistics. The Number of Pixels statistic will reflect the number of valid pixels in the ROI. Pixels below the segmentation minimum are show as blue and pixels above the segmentation maximum are show as red. The segmentation range can be defined in terms of counts, radiance, or temperature units.
4.8.6 Filters Toolbox [Max] The filters toolbox allows the user to apply a variety of operators to the entire image. Click “Add Filter” will display dialog where the user can choose available filters from a list. Multiple filters can be chosen and they will be applied sequentially.

Chapter 5 – User Interface
ResearchIR User’s Guide 53
Filter Name Operates on Description
Gain Pixel Multiply each pixel by the gain value
Offset Pixel Add the offset value to each pixel
Exponential Pixel Compute exp(pixel value)
Natual Logarithm Pixel Compute ln(pixel value)
Square root Pixel Compute square root (pixel value)
Gaussian Pixel Compute a Gaussian blur (smoothing) to the image
Window Average Pixel Make each pixel the average of the selected kernel
MATLAB Image Passes an image to a MATLAB script. See Sec 4.8.6.1 for more details.
Median Pixel Make each pixel the median of the selected kernel
Min – Continous Pixel Make each pixel the temporal minimum until reset
Min – Frame interval Pixel Make each pixel the temporal minimum over the last n frames
Max – Continuous Pixel Make each pixel the temporal maximum until reset
Max – Frame interval Pixel Make each pixel the temporal maximum over the last n frames
Frame Average Image Make current image the average of the last n frames. Relative mode shows the actual delta values. If this output will be fed into another filter that cannot accept negative numbers, the absolute mode will add the min value of the image in order to make all pixels >0
Sliding subtraction Image Subtract the previous nth frame from the current frame. Relative mode shows the actual delta values. If this output will be fed into another filter that cannot accept negative numbers, the absolute mode will add the min value of the image in order to make all pixels >0
HSM Mode Image Emulates the HSM mode found in GF-series cameras
Chapter 5 – User Interface
ResearchIR User’s Guide 54
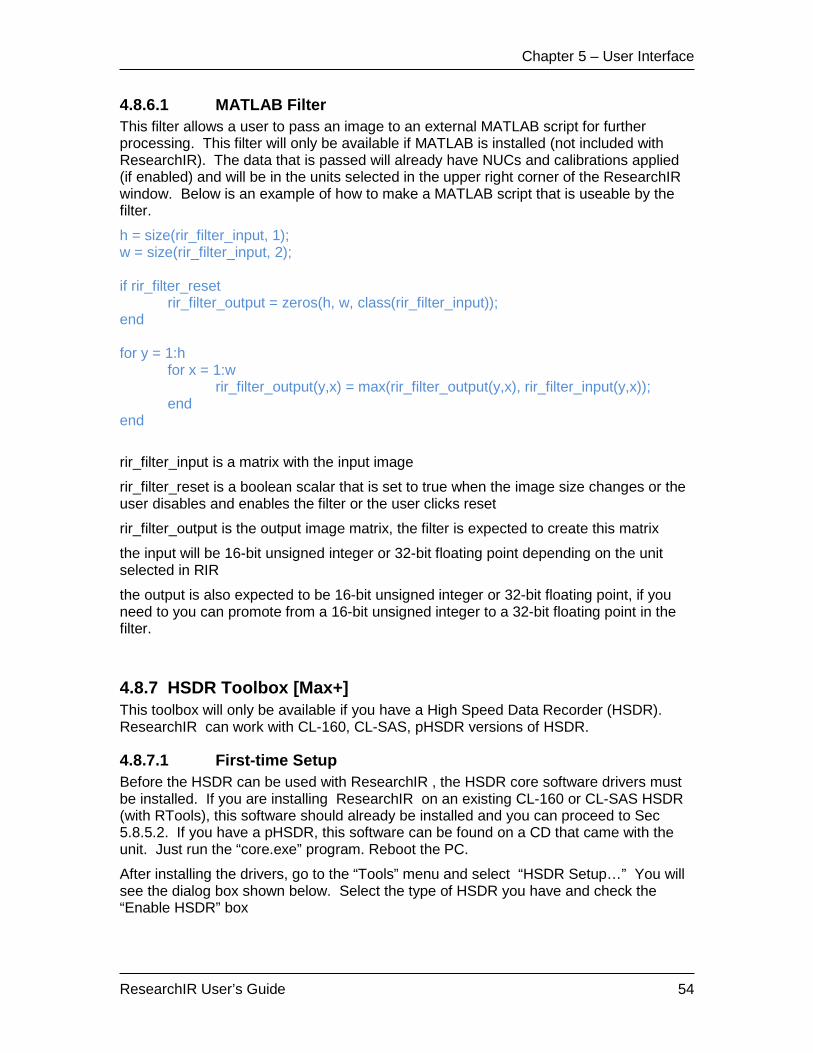
4.8.6.1 MATLAB Filter This filter allows a user to pass an image to an external MATLAB script for further processing. This filter will only be available if MATLAB is installed (not included with ResearchIR). The data that is passed will already have NUCs and calibrations applied (if enabled) and will be in the units selected in the upper right corner of the ResearchIR window. Below is an example of how to make a MATLAB script that is useable by the filter.
h = size(rir_filter_input, 1); w = size(rir_filter_input, 2); if rir_filter_reset rir_filter_output = zeros(h, w, class(rir_filter_input)); end for y = 1:h for x = 1:w rir_filter_output(y,x) = max(rir_filter_output(y,x), rir_filter_input(y,x)); end end
rir_filter_input is a matrix with the input image
rir_filter_reset is a boolean scalar that is set to true when the image size changes or the user disables and enables the filter or the user clicks reset
rir_filter_output is the output image matrix, the filter is expected to create this matrix
the input will be 16-bit unsigned integer or 32-bit floating point depending on the unit selected in RIR
the output is also expected to be 16-bit unsigned integer or 32-bit floating point, if you need to you can promote from a 16-bit unsigned integer to a 32-bit floating point in the filter.
4.8.7 HSDR Toolbox [Max+] This toolbox will only be available if you have a High Speed Data Recorder (HSDR). ResearchIR can work with CL-160, CL-SAS, pHSDR versions of HSDR.
4.8.7.1 First-time Setup Before the HSDR can be used with ResearchIR , the HSDR core software drivers must be installed. If you are installing ResearchIR on an existing CL-160 or CL-SAS HSDR (with RTools), this software should already be installed and you can proceed to Sec 5.8.5.2. If you have a pHSDR, this software can be found on a CD that came with the unit. Just run the “core.exe” program. Reboot the PC.
After installing the drivers, go to the “Tools” menu and select “HSDR Setup…” You will see the dialog box shown below. Select the type of HSDR you have and check the “Enable HSDR” box
Chapter 5 – User Interface
ResearchIR User’s Guide 55
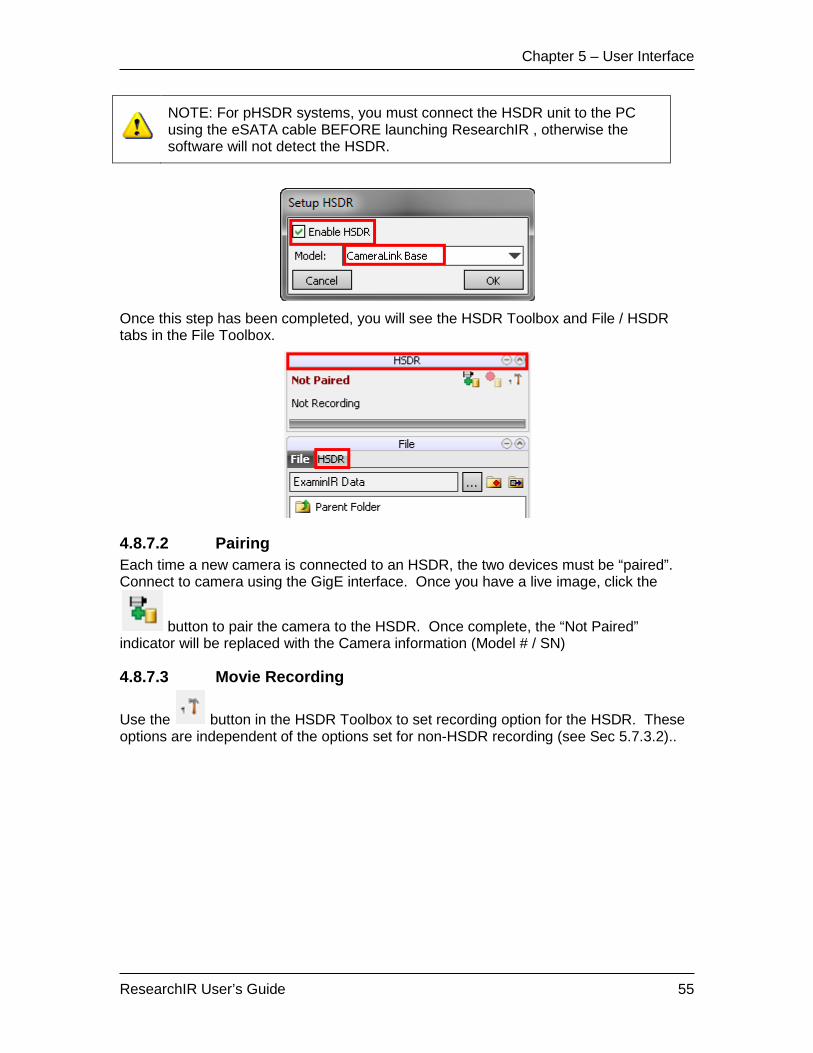
NOTE: For pHSDR systems, you must connect the HSDR unit to the PC using the eSATA cable BEFORE launching ResearchIR , otherwise the software will not detect the HSDR.
Once this step has been completed, you will see the HSDR Toolbox and File / HSDR tabs in the File Toolbox.
4.8.7.2 Pairing Each time a new camera is connected to an HSDR, the two devices must be “paired”. Connect to camera using the GigE interface. Once you have a live image, click the
button to pair the camera to the HSDR. Once complete, the “Not Paired” indicator will be replaced with the Camera information (Model # / SN)
4.8.7.3 Movie Recording
Use the button in the HSDR Toolbox to set recording option for the HSDR. These options are independent of the options set for non-HSDR recording (see Sec 5.7.3.2)..

Chapter 5 – User Interface
ResearchIR User’s Guide 56
The Record Mode options are similar to those available for non-HSDR recording. There
is an additional “Start/Stop” mode. Here you can use the and buttons to start and stop the recording when desired. After a recording is completed, a message will be displayed in the toolbox indicating the number of frames recorded, frame rate, recording time, and number of dropped frames (should be zero).
File name options are similar to those described in Sec. 5.7.3.5.
4.8.7.4 Movie Playback The HSDR tab in the File Toolbox allows the user to access data that has been recorded to the HSDR but has not been extracted to the PC hard drive. Just double-click the movie you wish to play.
4.8.7.5 Movie Extraction Use the Extract feature (Sec 5.9.1.2) to copy files from the HSDR drives to the regular PC hard drives. Once extracted, the movie will be displayed in the File tab of the File Toolbox. It is IMPORTANT that you extract data you want to keep as soon as possible. Certain actions such as pairing a new camera or changing the camera window size can trigger a reformat of the HSDR drives, possibly causing this data to be permanently lost.
4.8.8 File Toolbox The File toolbox displays files in the current directory that ResearchIR can open.

Chapter 5 – User Interface
ResearchIR User’s Guide 57
In addition to clicking the open button, you can double click on a file to open it.
NOTE: The “Show Record Folder” and “Show Export Folder” buttons only change the folder being viewed. It does not set the location for recording and exporting. To set the recording location use the “Edit Recording Settings” button described in Sec. 5.7.3.
Chapter 5 – User Interface
ResearchIR User’s Guide 58
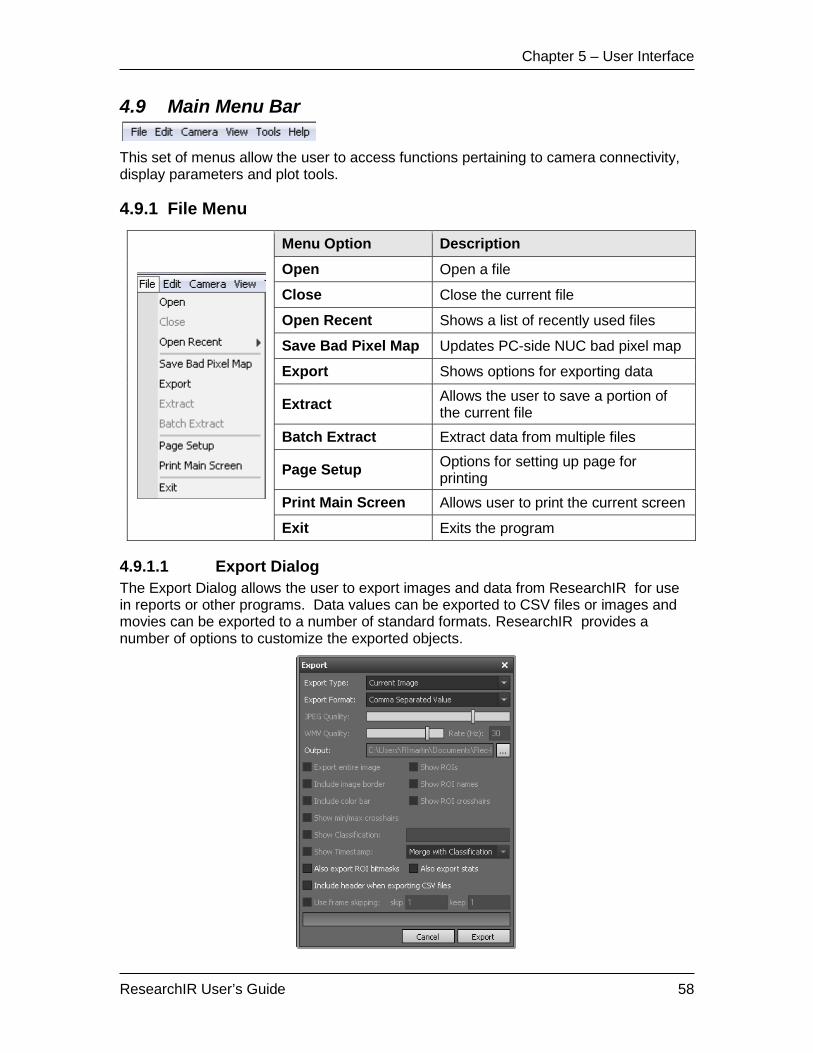
4.9 Main Menu Bar
This set of menus allow the user to access functions pertaining to camera connectivity, display parameters and plot tools.
4.9.1 File Menu
Menu Option Description Open Open a file
Close Close the current file
Open Recent Shows a list of recently used files
Save Bad Pixel Map Updates PC-side NUC bad pixel map
Export Shows options for exporting data
Extract Allows the user to save a portion of the current file
Batch Extract Extract data from multiple files
Page Setup Options for setting up page for printing
Print Main Screen Allows user to print the current screen
Exit Exits the program
4.9.1.1 Export Dialog The Export Dialog allows the user to export images and data from ResearchIR for use in reports or other programs. Data values can be exported to CSV files or images and movies can be exported to a number of standard formats. ResearchIR provides a number of options to customize the exported objects.
Chapter 5 – User Interface
ResearchIR User’s Guide 59
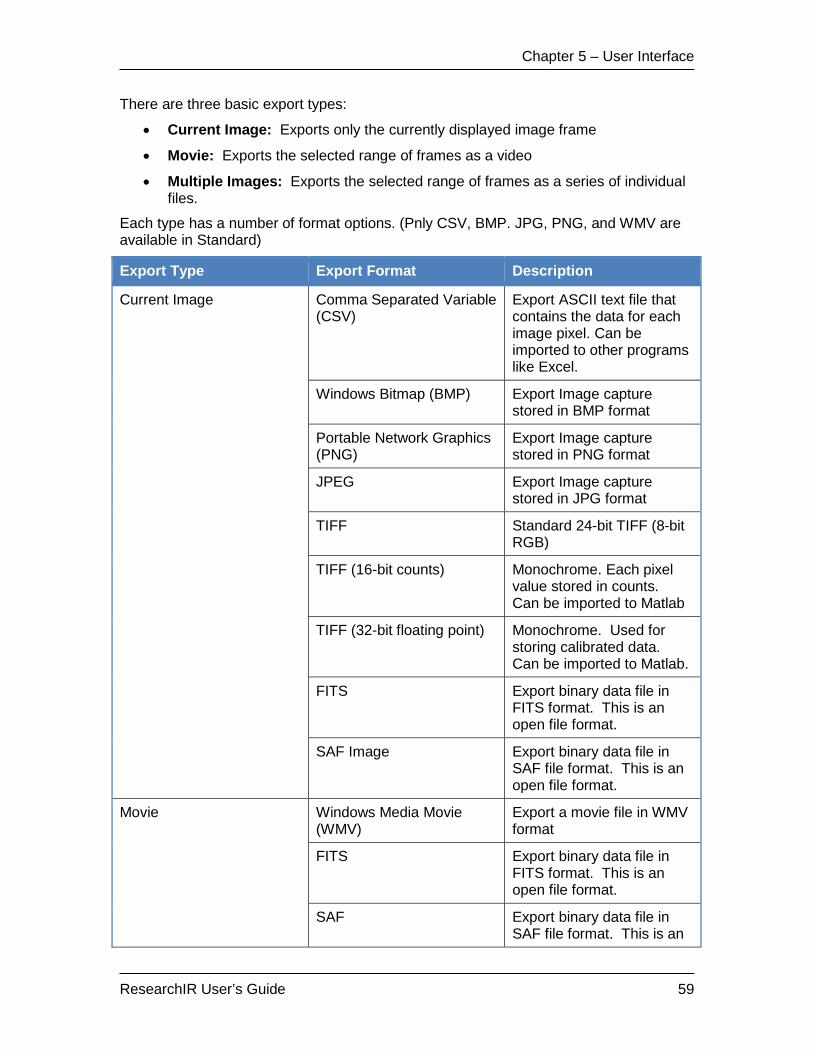
There are three basic export types:
• Current Image: Exports only the currently displayed image frame
• Movie: Exports the selected range of frames as a video
• Multiple Images: Exports the selected range of frames as a series of individual files.
Each type has a number of format options. (Pnly CSV, BMP. JPG, PNG, and WMV are available in Standard)
Export Type Export Format Description
Current Image Comma Separated Variable (CSV)
Export ASCII text file that contains the data for each image pixel. Can be imported to other programs like Excel.
Windows Bitmap (BMP) Export Image capture stored in BMP format
Portable Network Graphics (PNG)
Export Image capture stored in PNG format
JPEG Export Image capture stored in JPG format
TIFF Standard 24-bit TIFF (8-bit RGB)
TIFF (16-bit counts) Monochrome. Each pixel value stored in counts. Can be imported to Matlab
TIFF (32-bit floating point) Monochrome. Used for storing calibrated data. Can be imported to Matlab.
FITS Export binary data file in FITS format. This is an open file format.
SAF Image Export binary data file in SAF file format. This is an open file format.
Movie Windows Media Movie (WMV)
Export a movie file in WMV format
FITS Export binary data file in FITS format. This is an open file format.
SAF Export binary data file in SAF file format. This is an

Chapter 5 – User Interface
ResearchIR User’s Guide 60
Export Type Export Format Description
open file format.
TIFF (32-bit floating point) Monochrome. Used for storing calibrated data. Can be imported to Matlab.
YUV This is a near lossles format that can be read my many high-end video editing packages. If you need to encode you data in a specific codec, you can export in YUV and then use the video editing software to encode in the codec of your choice
Multiple Images Comma Separated Variable (CSV)
Export ASCII text file that contains the data for each image pixel. Can be imported to other programs like Excel.
Windows Bitmap (BMP) Export Image capture stored in BMP format
Portable Network Graphics (PNG)
Export Image capture stored in PNG format
JPEG Export Image capture stored in JPG format
TIFF RGB, 16-bit counts, or 32-bit floating point
FITS Export binary data file in FITS format. This is an open file format.
SAF Export binary data file in SAF file format. This is an open file format.
The JPEG Quality control adjusts the amount of compression. The further the slider is moved to the right, the better the image quality (larger the file size).
The Rate (Hz) control allows the user to set the playback rate. This is useful when the source data rate is much slower or much fast than normal.
Chapter 5 – User Interface
ResearchIR User’s Guide 61
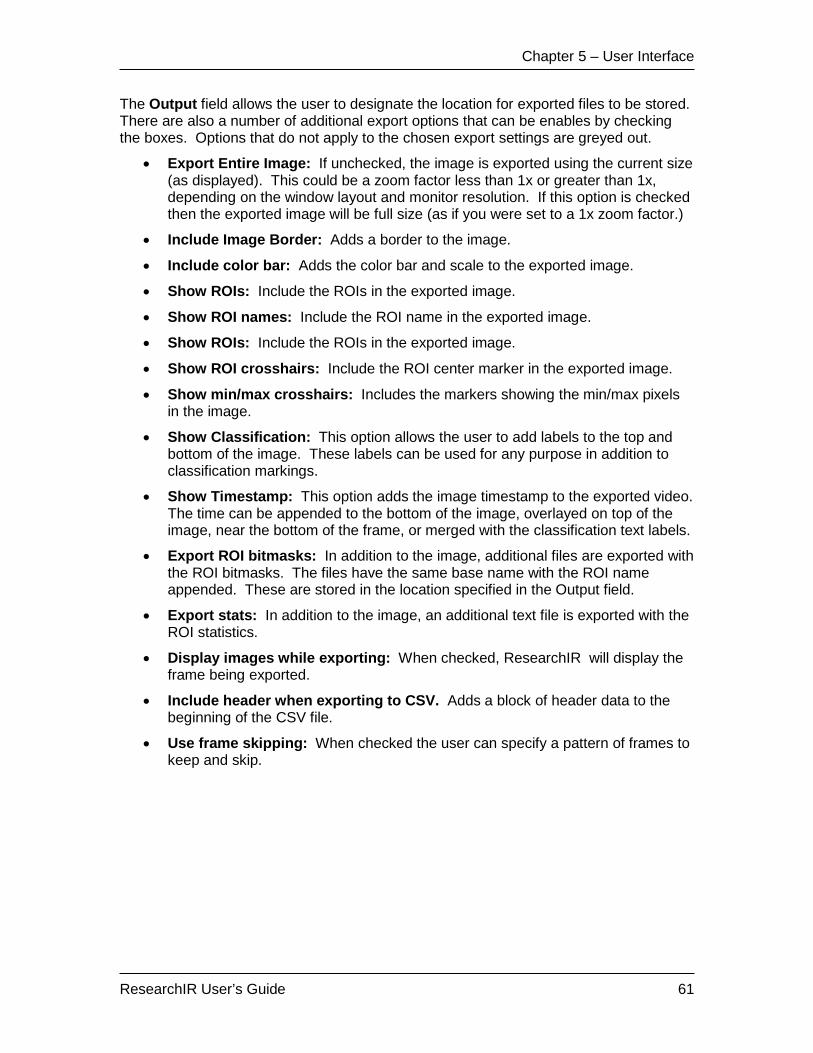
The Output field allows the user to designate the location for exported files to be stored. There are also a number of additional export options that can be enables by checking the boxes. Options that do not apply to the chosen export settings are greyed out.
• Export Entire Image: If unchecked, the image is exported using the current size (as displayed). This could be a zoom factor less than 1x or greater than 1x, depending on the window layout and monitor resolution. If this option is checked then the exported image will be full size (as if you were set to a 1x zoom factor.)
• Include Image Border: Adds a border to the image.
• Include color bar: Adds the color bar and scale to the exported image.
• Show ROIs: Include the ROIs in the exported image.
• Show ROI names: Include the ROI name in the exported image.
• Show ROIs: Include the ROIs in the exported image.
• Show ROI crosshairs: Include the ROI center marker in the exported image.
• Show min/max crosshairs: Includes the markers showing the min/max pixels in the image.
• Show Classification: This option allows the user to add labels to the top and bottom of the image. These labels can be used for any purpose in addition to classification markings.
• Show Timestamp: This option adds the image timestamp to the exported video. The time can be appended to the bottom of the image, overlayed on top of the image, near the bottom of the frame, or merged with the classification text labels.
• Export ROI bitmasks: In addition to the image, additional files are exported with the ROI bitmasks. The files have the same base name with the ROI name appended. These are stored in the location specified in the Output field.
• Export stats: In addition to the image, an additional text file is exported with the ROI statistics.
• Display images while exporting: When checked, ResearchIR will display the frame being exported.
• Include header when exporting to CSV. Adds a block of header data to the beginning of the CSV file.
• Use frame skipping: When checked the user can specify a pattern of frames to keep and skip.

Chapter 5 – User Interface
ResearchIR User’s Guide 62
4.9.1.2 Extract Dialog [Max+] The Extract feature allows the user to save a portion of a long video into another file to make a smaller file. If ResearchIR has recorded data to a High Speed Data Recorder (HSDR), the Extract dialog allows the user to move the data from the data recorder to the PC hard drive and to trim a file and save that portion to a new file.
When first opened this dialog displays the last folder used for extraction and the current filename. If you have been using the original data directory, you must change the location or filename as ResearchIR will not let you overwrite the original file.
4.9.1.3 Batch Extract Dialog [Max+] IF you have a lot of data that needs to be extracted from the HSDR, this can be a time consuming process. The batch extract dialog allows the user to setup a list of files to extract.
4.9.2 Edit Menu
Menu Option Description
Spatial Calibration… Enter data for computing lengths and areas of ROIs.
Preferences Set program preferences
Chapter 5 – User Interface
ResearchIR User’s Guide 63
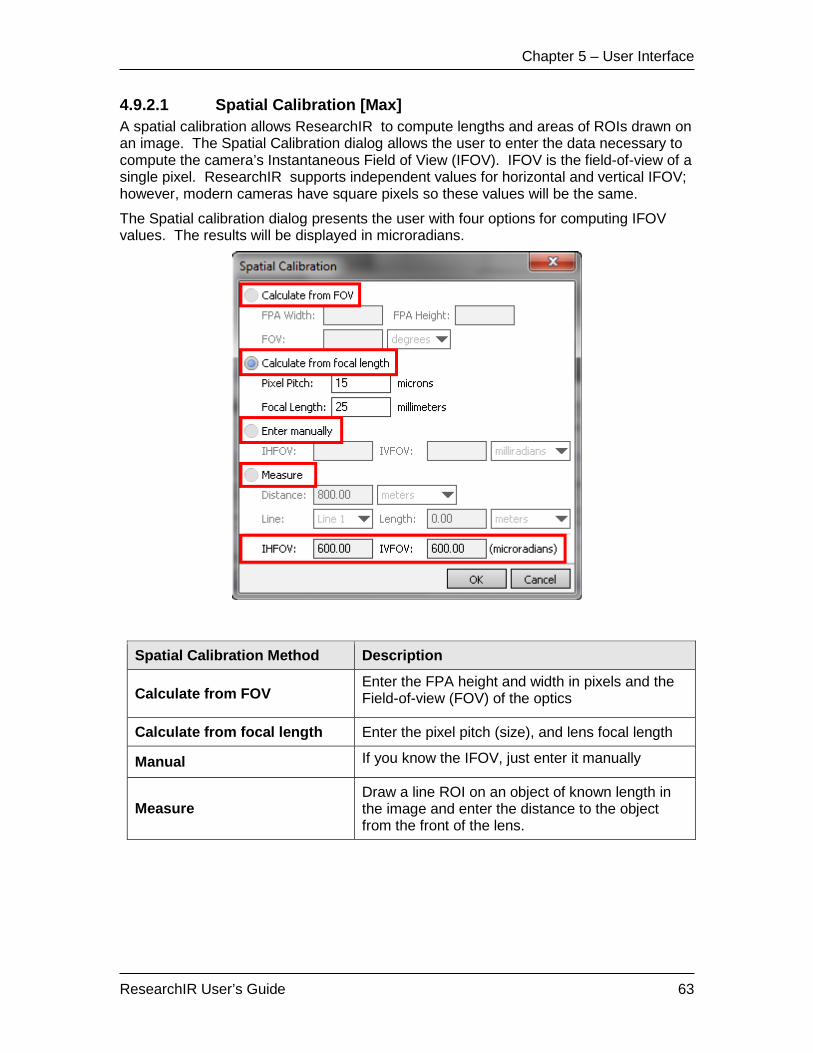
4.9.2.1 Spatial Calibration [Max] A spatial calibration allows ResearchIR to compute lengths and areas of ROIs drawn on an image. The Spatial Calibration dialog allows the user to enter the data necessary to compute the camera’s Instantaneous Field of View (IFOV). IFOV is the field-of-view of a single pixel. ResearchIR supports independent values for horizontal and vertical IFOV; however, modern cameras have square pixels so these values will be the same.
The Spatial calibration dialog presents the user with four options for computing IFOV values. The results will be displayed in microradians.
Spatial Calibration Method Description
Calculate from FOV Enter the FPA height and width in pixels and the Field-of-view (FOV) of the optics
Calculate from focal length Enter the pixel pitch (size), and lens focal length
Manual If you know the IFOV, just enter it manually
Measure Draw a line ROI on an object of known length in the image and enter the distance to the object from the front of the lens.
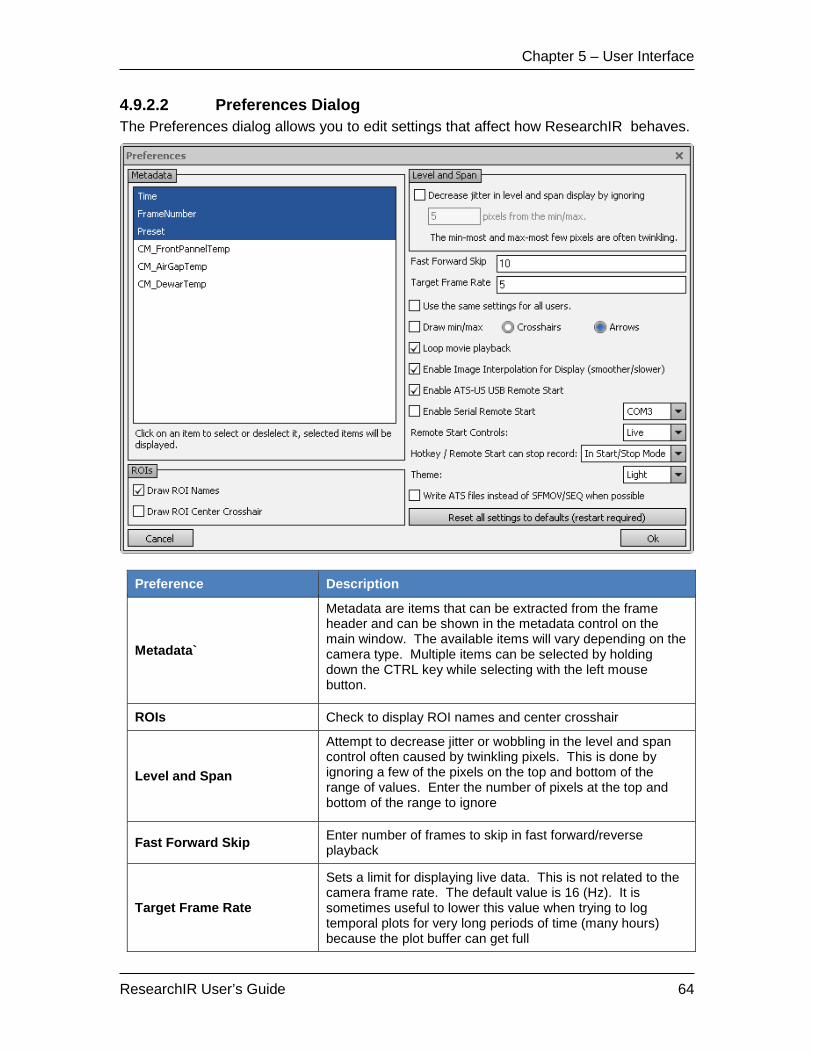
Chapter 5 – User Interface
ResearchIR User’s Guide 64
4.9.2.2 Preferences Dialog The Preferences dialog allows you to edit settings that affect how ResearchIR behaves.
Preference Description
Metadata`
Metadata are items that can be extracted from the frame header and can be shown in the metadata control on the main window. The available items will vary depending on the camera type. Multiple items can be selected by holding down the CTRL key while selecting with the left mouse button.
ROIs Check to display ROI names and center crosshair
Level and Span
Attempt to decrease jitter or wobbling in the level and span control often caused by twinkling pixels. This is done by ignoring a few of the pixels on the top and bottom of the range of values. Enter the number of pixels at the top and bottom of the range to ignore
Fast Forward Skip Enter number of frames to skip in fast forward/reverse playback
Target Frame Rate
Sets a limit for displaying live data. This is not related to the camera frame rate. The default value is 16 (Hz). It is sometimes useful to lower this value when trying to log temporal plots for very long periods of time (many hours) because the plot buffer can get full

Chapter 5 – User Interface
ResearchIR User’s Guide 65
Settings for all Users If unchecked, preferences will be per user
Draw Min/Max Check to display a “+” or arrow at the location of the min /max value in each ROI
Loop Movie Playback Check this to play movies in a continuous loop
Image Interpolation For lower resolution cameras (320x240 and below), this option can make the displayed image look less pixelated
Enable ATS-US USB remote start or Serial-USB remote start
ResearchIR supports two variants of USB Remote Start boxes. The older FLIR proprietary box or you can use a standard USB to RS-232 converter (must provide your own button) for switch closure only. Short pins 7/8 (CTS/RTS)
Remote Start Controls Remote Start can be set to trigger recording of Live (currently connected camera) or HSDR or both
Stop Recording When Hotkey / remote start can stop recording
Theme Two color themes are supported: Light or Dark
Reset Sets all Preferences to default values
4.9.3 Camera Menu
Menu Option Description
Connect Connects to last selected camera
Disconnect Disconnect from camera
Select Select a camera to connect to from a list of available cameras
Control Show camera controller for current connected camera
User Calibration Functions for performing, saving, and loading user calibrations
PC Side Correction Function for performing, loading, and saving PC side NUCs
4.9.3.1 Camera Selector ResearchIR has two methods of selecting a camera: Auto detection, and manual selection. If you select a camera with the Startup dialog (shown at startup or View->Startup Dialog menu), ResearchIR will try to auto detect the control interface. This is generally the recommended method. If you need to manually specify the connection interface you can use the Camera Selector.
The Camera Selector has two view modes: Standard and Custom. The Standard Mode automatically scans the computer and displays available cameras. The cameras are grouped by interface (Firewire or Ethernet). The Custom Mode allows you to manually choose the camera and connection interface

Chapter 5 – User Interface
ResearchIR User’s Guide 66
NOTE: You can run more than one instance of ResearchIR on the same PC. If one instance of ResearchIR is connected to a camera then that camera will not show up in the Camera Selector in other instances of the program. Once the camera has been disconnected, it will show up as an available camera.
Camera Selector (Standard View)
Camera Selector (Custom View)
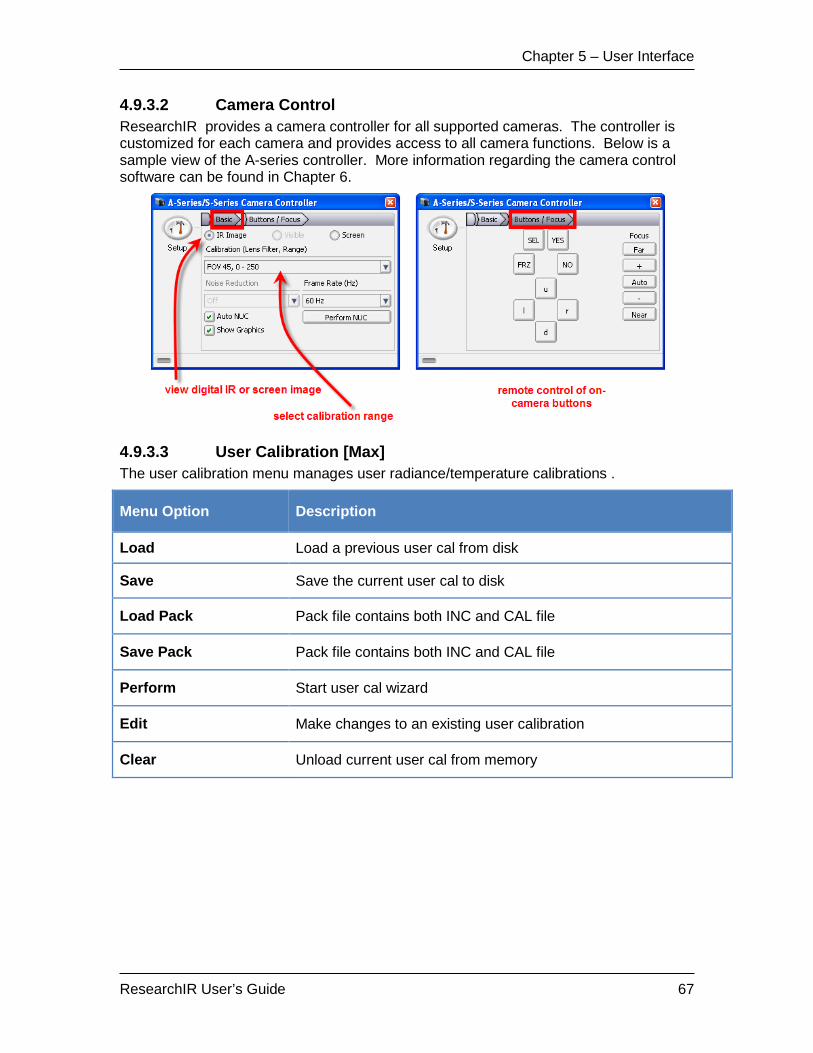
Chapter 5 – User Interface
ResearchIR User’s Guide 67
4.9.3.2 Camera Control ResearchIR provides a camera controller for all supported cameras. The controller is customized for each camera and provides access to all camera functions. Below is a sample view of the A-series controller. More information regarding the camera control software can be found in Chapter 6.
4.9.3.3 User Calibration [Max] The user calibration menu manages user radiance/temperature calibrations .
Menu Option Description
Load Load a previous user cal from disk
Save Save the current user cal to disk
Load Pack Pack file contains both INC and CAL file
Save Pack Pack file contains both INC and CAL file
Perform Start user cal wizard
Edit Make changes to an existing user calibration
Clear Unload current user cal from memory

Chapter 5 – User Interface
ResearchIR User’s Guide 68
4.9.3.3.1 Load Calibration Brings up a file dialog box and allows user to select a user calibration to be loaded into memory. The user calibration can then be applied to the data by choosing it with the Units Selector.
4.9.3.3.2 Save Calibration Brings up a file dialog box and allows user to save the current user calibration to disk. This will create two files: a .INC and a .CAL. These two files are part of the SAF format, which is fully described in a separate document.
4.9.3.3.3 Perform Calibration The Perform option starts the User Calibration Wizard. This wizard will walk the user through the steps required to calibrate a camera. You will need a calibrated blackbody source to complete this procedure. This section is only a discussion of how to input user calibration data into ResearchIR .
It is important to note that as a general rule, the User Calibration Wizard will generate a calibration in terms of apparent effective radiance. This means that the calibration is mapping the digital counts from the camera to what radiance the camera sees, not necessarily to radiance at the source. If you use only ideal response curves for spectral response and atmosphere, ResearchIR will compute theoretical source radiance based on Planck’s function and map the camera counts to that. Therefore, when you include data for spectral response and atmospheric path you are trying to reduce the theoretical radiance of the calibration source to the energy that the camera actually sees.
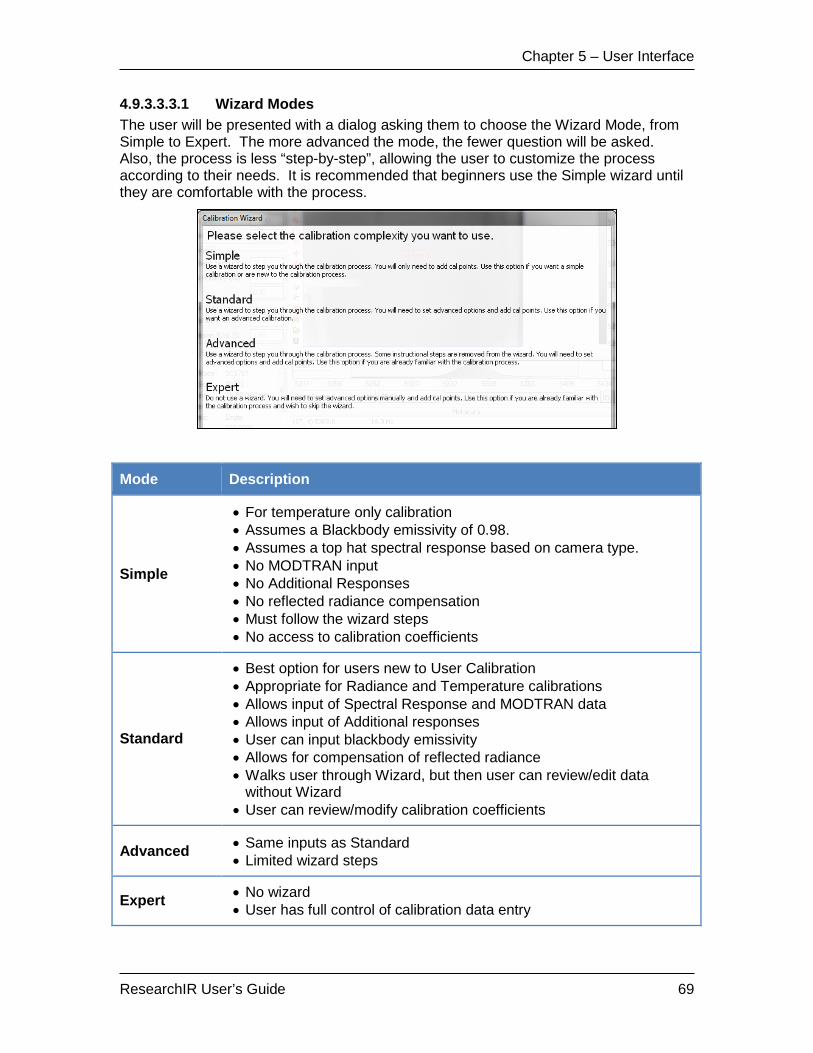
Chapter 5 – User Interface
ResearchIR User’s Guide 69
4.9.3.3.3.1 Wizard Modes The user will be presented with a dialog asking them to choose the Wizard Mode, from Simple to Expert. The more advanced the mode, the fewer question will be asked. Also, the process is less “step-by-step”, allowing the user to customize the process according to their needs. It is recommended that beginners use the Simple wizard until they are comfortable with the process.
Mode Description
Simple
• For temperature only calibration • Assumes a Blackbody emissivity of 0.98. • Assumes a top hat spectral response based on camera type. • No MODTRAN input • No Additional Responses • No reflected radiance compensation • Must follow the wizard steps • No access to calibration coefficients
Standard
• Best option for users new to User Calibration • Appropriate for Radiance and Temperature calibrations • Allows input of Spectral Response and MODTRAN data • Allows input of Additional responses • User can input blackbody emissivity • Allows for compensation of reflected radiance • Walks user through Wizard, but then user can review/edit data
without Wizard • User can review/modify calibration coefficients
Advanced • Same inputs as Standard • Limited wizard steps
Expert • No wizard • User has full control of calibration data entry

Chapter 5 – User Interface
ResearchIR User’s Guide 70
4.9.3.3.3.2 Standard Calibration Wizard This section will outline the steps in the Standard Calibration Wizard. The other Wizard modes will be variations of this mode.
STEP 1: Getting Started. Before starting a user calibration you will need to choose the desired integration time for the camera and you will need to perform a Non-Uniformity Correction (NUC). The NUC can either be done on the camera side or on the PC side. Most FLIR cameras support on-camera NUCs. (The SC8000 is an example of a camera that does not.) PC-Side NUCs are discussed in the next section. See your camera’s user’s manual for more information on camera-side NUCs.
STEP 2: Input Camera Spectral Response. The user can choose to use either an ideal “top hat” response or provide a file with an actual response curve. The graph will show the response curve that will be used.

Chapter 5 – User Interface
ResearchIR User’s Guide 71
An actual response file should be a peak-normalized power spectral response (not a photon response). A response file can be a simple tab-delimitted ASCII file with the wavelength in microns and normalized response values. Below is an example.
STEP 3: Input Atmospheric Path. This screen provides a place to input Atmospheric path data from MODTRAN. MODTRAN is a widely accepted model used to predict atmospheric transmission. The MODTRAN model has several output files. ResearchIR is setup to read the TOTAL TRANSMISSION and PATH THERMAL data from the MODOUT2 files. Once the MODTRAN data has been loaded, ResearchIR can plot the data.

Chapter 5 – User Interface
ResearchIR User’s Guide 72
STEP 4: Input Additional Responses: Additional responses can be used to account for other factors that can affect the path between the cal target and the camera that are not already accounted for by camera spectral response or atmospheric modeling. Such things might be a mirror reflectance curve or an additional filter. The values in this file are multiplied against the data.
More than one response curve can be added using the button.
Unwanted responses can be deleted using the button
The file format for an additional response file is a simple tab-delimited ASCII file. The first column should be the wavelength in microns and the second column should be the transmission (value from 0 to 1). The data increment does not have to be the same as the spectral response or atmospheric files. ResearchIR will automatically interpolate the values.

Chapter 5 – User Interface
ResearchIR User’s Guide 73
The Additional Response dialog can also be used to input a simple atmospheric path transmission if MODTRAN is not used. In this case only total transmission would be accounted for.

Chapter 5 – User Interface
ResearchIR User’s Guide 74
STEP 5: Set default blackbody emissivity and reflected radiance compensation options. This dialog allows the user to set the default emissivity value for the blackbody. If you are using more than one blackbody or the emissivity change with temperature, it is possible to override this value when you are taking the actual data.
The user can also set options to try and compensate for reflected energy in the scene that is not coming from the calibration source. Typically, this extra source is reflected solar energy. In almost all cases, you should not attempt to compensate for reflected radiance unless you have no other option. If at all possible you should arrange your calibration setup to provide clean, uncorrupted view of the calibration target. This will give you the best and most repeatable calibration.
STEP 6: Setup calibration source. This dialog box prompts the user to setup the camera to see the blackbody. Once the blackbody is setup, click “Next”.

Chapter 5 – User Interface
ResearchIR User’s Guide 75
STEP 7: Draw an ROI on the blackbody. This dialog box prompts the user to draw a Region of Interest (ROI) on the blackbody emitter. The ROI should be drawn so that it is large enough to get as many good pixels as possible but should not be drawn to close to the edge of the source. ResearchIR will take the spatial average of all the pixels in the ROI so any pixels that are off of the blackbody will cause errors. Not all blackbody sources are created equal and uniformity at the edges is usually the worst so It is better to have fewer pixels that you know are good. Sometimes it is hard to tell from looking at the image if the edges of the blackbody are uniform. Using the O-scope plot is a good way to tell if all of the pixels in the ROI are uniform.
STEP 8: Ready to Start Calibrating. The user is now ready to start adding points to the calibration table. The calibration wizard uses a linear curve fit so at least two points are required. However, more points are better. This dialog gives instructions and helpful tips for collecting good calibration data. Keep these in mind:
1. A calibration must have at least two points.
2. The calibration should cover the entire range of temperature you want to measure. Extrapolation is not a good practice. A good calibration will be very linear. If your curve has nonlinear characteristics there is generally something wrong with the calibration data.
Click “Next” to continue.

Chapter 5 – User Interface
ResearchIR User’s Guide 76
STEP 9: Add calibration point. This dialog is used to collect and plot the calibration data. The settings chosen here only affect this calibration point.

Chapter 5 – User Interface
ResearchIR User’s Guide 77
STEP 10: Review data and add more points. Once you have added a data point you will see a table summarizing all of the data taken. To add an additional
point, click the button. Below is a sample of a complete calibration. The summary table and graph allow the user to modify the data and assess the quality of the calibration.

Chapter 5 – User Interface
ResearchIR User’s Guide 78
STEP 11: Edit Misc Tab. The Misc tab allows the user to edit tags that will be part of the INC file.
Commonly used and recommended tags are located at the top of the dialog box. Check the boxes to enable the tags. These include:
Tag Description
TPFACT This parameter is a Multiplier to the computed radiance. It is generally a number >1. It is most often used to compensate for the effects of atmospheric attenuation or an ND filter that was not part of the original calibration.
Slant Range (m) This is the direct distance from the camera to the target. This parameter is used in conjunction with IFOV to compute the size and areas of objects in the image. Area is need to compute target intensity
IFOV
This is the field-of-view of a single pixel. If a Spatial Calibration (see Sec 5.9.2.1) has already been performed, the IFOV data will be imported to this dialog. The user cal also run the Spatial Calibration calculator by clicking the “Calculate” button.
Bandpass This is an option tag and is superseded by the spectral response data. If a spectral response is loaded, these fields will be populated with the 50% points of the response curve.
Additional (optional) tags can be entered at the bottom of the form. These can be tags that are defined as part of the SAF file format or they can be user-defined. Placing them in the “Global” tab means they are assigned to all presets; or they can be assigned only to a single preset. All tags entered on this tab will become part of the default INC file. As long as this calibration is loaded this

Chapter 5 – User Interface
ResearchIR User’s Guide 79
default INC will be used as a template to generate the INC file for each SAF movie that is recorded.
Click “Finish” to close the calibration wizard. To save the calibration data for future use click the button. To apply the calibration to the live data choose either a Radiance or Temperature (user) from the Units Selector.
4.9.3.3.3.3 Review Calibration Coefficients The “Coeffs” tab allows the user to review/edit the coefficients for computing radiance and temperature. The four ain sections are described in the table below.
Section Description
Counts to Radiance
Displays the coeffs used to convert digital counts to radiance. Order one is typical but higher orders can be selected using the dropdown. Order “-1” or “-2” can be chosen if doing an “offset correction”. R2 is a figure of merit for the quality of the curve fit. A value > 0.9995 is typical for a good calibration.
Lookup table
Controls the generation of the lookup table that converts radiance to temperature. In “Auto” mode, the table will use the min and max temperatures used in the table at the top of the dialog box. If “Auto” is unchecked, the user can manually set the limits and increment. It is generally best to leave the Emissivity field set to 1.

Chapter 5 – User Interface
ResearchIR User’s Guide 80
Section Description
Radiance to Temperature
Displays the coefficients used to convert radiance to temperature using a polynomial. This section can generally be ignored as this is a legacy method. The Lookup Table is the preferred method for computing temperature.
Check Allows the user to compute a value of counts, radiance, or temperature using the coefficients. Enter any values and the other two will be computed. Temperature is computed using the lookup table.
4.9.3.3.3.4 Calibration Plots By default, the calibration wizard will build a plot of counts vs. radiance. The user can build additional plots using the Add Graph and Edit Graph buttons. This will launch the Add/Edit Graph dialog.
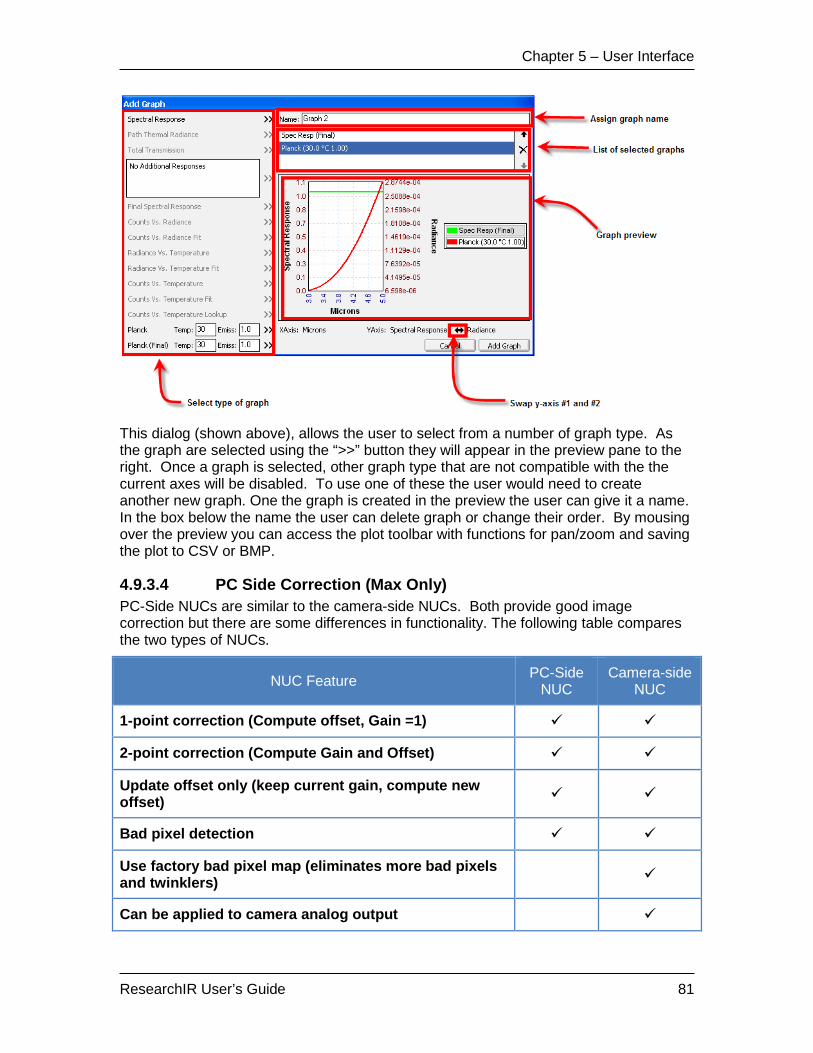
Chapter 5 – User Interface
ResearchIR User’s Guide 81
This dialog (shown above), allows the user to select from a number of graph type. As the graph are selected using the “>>” button they will appear in the preview pane to the right. Once a graph is selected, other graph type that are not compatible with the the current axes will be disabled. To use one of these the user would need to create another new graph. One the graph is created in the preview the user can give it a name. In the box below the name the user can delete graph or change their order. By mousing over the preview you can access the plot toolbar with functions for pan/zoom and saving the plot to CSV or BMP.
4.9.3.4 PC Side Correction (Max Only) PC-Side NUCs are similar to the camera-side NUCs. Both provide good image correction but there are some differences in functionality. The following table compares the two types of NUCs.
NUC Feature PC-Side NUC
Camera-side NUC
1-point correction (Compute offset, Gain =1)
2-point correction (Compute Gain and Offset)
Update offset only (keep current gain, compute new offset)
Bad pixel detection
Use factory bad pixel map (eliminates more bad pixels and twinklers)
Can be applied to camera analog output

Chapter 5 – User Interface
ResearchIR User’s Guide 82
NUC Feature PC-Side NUC
Camera-side NUC
Can use camera internal NUC flag
NUC data stored separately from raw digital data (NUC data can be changed in post-processing)
Manual bad pixel tool
NUC storage space unlimited limited
If desired, both types of NUCs can be used simultaneously. However, if you are using a factory calibration it is STRONGLY recommended that you not use a PC-Side NUC as this can affect the calibration accuracy.
One exception to this recommendation is using the Bad Pixel Tool to mark additional bad pixels that are not masked by the automatic bad pixel detection algorithm.
ResearchIR keeps track of the last PC-Side NUC done for each camera it connects to. If a PC-Side NUC is available then the NUC icons will appear next to the Units Selector.
A blue shading over the icons indicates that the NUC and Bad Pixel Map (BPM) are enabled.

Chapter 5 – User Interface
ResearchIR User’s Guide 83
4.9.3.5 Creating a PC-Side NUC in ResearchIR STEP 1: Choose the NUC Type. This dialog allows the user to select the NUC action to perform. Click Next to continue.
NUC Type Description
One Point Correction Compute Offset, set Gain=1. No automatic bad pixel detection.
Two Point Correction Compute both Offset and Gain. Optional automatic bad pixel detection.
Update Offset Keep current gain. Compute new offset.
Bad Pixel Detection Keep current Gain and Offset. Compute new Bad Pixel map.
Default Remove current PC-side NUC. Set Gain=1 and Offset=0.
STEP 2: Set NUC Options. This dialog allows the user to set the number of frames to average, and whether to detect bad pixels and twinkling pixels. The default values are good for most situations.

Chapter 5 – User Interface
ResearchIR User’s Guide 84
STEP 3: Collect NUC data. User will be prompted to fill the field of view with a uniform scene. One or two scenes (hot and cold) will be needed depending on the type of correction being performed. Once you have filled the field of view of the camera with a uniform scene, click “Next”. It does not matter which scene (hot or cold) is used first.
For the best results, the two scenes should be far enough apart in temperature to span as much of the A/D range as possible. If the real scene spans a large range of the A/D than the scenes used to generate the NUC then the NUC algorithm with attempt to extrapolate. This will generally lead to undesirable artifacts in the image.
NOTE: When choosing the hot and cold scenes for the NUC it is not always necessary or desirable to span the same temperature range as the scene. The NUC source is generally placed right up to the camera so in many cases a temperature that would not saturate the camera at a normal measurement distance may saturate the camera when NUCing. This is caused by the difference in atmospheric transmission. For this reason, when choosing scenes for a NUC it is better to think in terms of how many A/D counts the source produces rather than its temperature.
STEP 4: Accept or Discard Correction. A dialog will appear showing the number of bad pixels detected. Generally this will be a very low number. A high number usually indicates that one of the scenes was not uniform. If accepted, the new correction will be stored as the default PC-side NUC.

Chapter 5 – User Interface
ResearchIR User’s Guide 85
STEP 5: Enable the PC-Side NUC. Once you have accepted the NUC, you can apply it to the live image by using the NUC controls next to the Units Selector.
Below is the original scene before the NUC and with the NUC and bad pixel map applied.

Chapter 5 – User Interface
ResearchIR User’s Guide 86
4.9.4 View Menu
Menu Option Description Zoom Select image zoom level
Palette Choose image color palette
Preserve Aspect Ratio
Maintain image aspect ratio when resizing application window
Fullscreen Show image only in fullscreen mode
Startup Dialog Show the initial startup screen for selecting recent files and cameras
4.9.4.1 Zoom Menu
Menu Option Description Stretch Stretch the image to fill the space available.
1/4 Display the image at ¼ (25%) of its original size.
1/2 Display the image at ½ (50%) of its original size.
1x Display the image at its original size.
2x Display the image at twice (200%) its original size.
4x Display the image at four times (400%) its original size.
4.9.4.2 Palette Menu
Menu Option Description Invert Invert the colors in the current palette.
Load Load an external palette.
Edit Configure a given palette’s settings
1234, Blue, Glowbow, Grayscale, Green, Ironbow, Rainbow, Red, Sepia
Use the selected built-in palette.

Chapter 5 – User Interface
ResearchIR User’s Guide 87
4.9.4.3 Edit Palette Dialog The Edit Palette dialog allows the user to customize and create palettes. You cannot permanently modify a default palette but you can save a new file. New palette files do not show up in the menu list but can be loaded using the Palette>>Load menu option.
Control Points tell ResearchIR where to start and stop gradients. You can set the color and location of as many control points as you like. ResearchIR will make a gradient between those points. Control points do not have to be evenly spaced.
You can also specify some special purpose colors for Segmentation and Clipping. Clipping colors will be applied when a pixel falls outside of a calibration range.
4.9.4.4 Startup Dialog The Startup dialog allows you to quickly open a recent file or connect to an available camera. The startup dialog is shown when ResearchIR starts up by default. It can be set to not show when ResearchIR starts up with an option in the dialog.
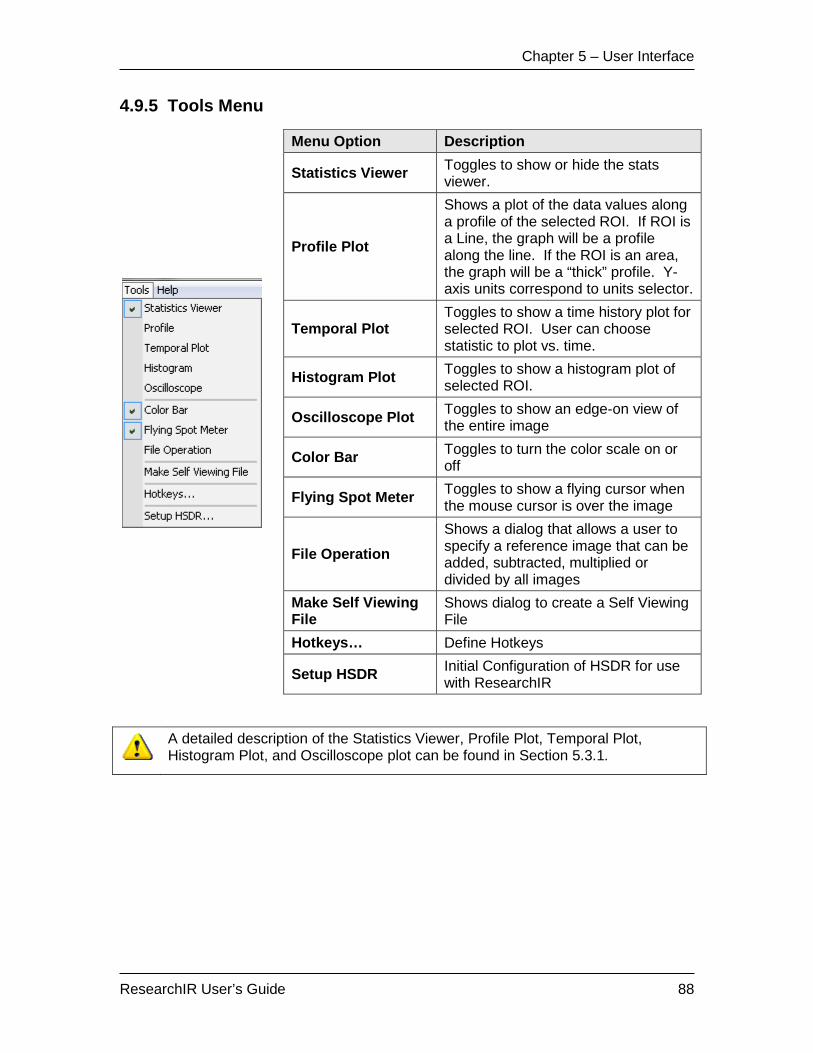
Chapter 5 – User Interface
ResearchIR User’s Guide 88
4.9.5 Tools Menu
Menu Option Description
Statistics Viewer Toggles to show or hide the stats viewer.
Profile Plot
Shows a plot of the data values along a profile of the selected ROI. If ROI is a Line, the graph will be a profile along the line. If the ROI is an area, the graph will be a “thick” profile. Y-axis units correspond to units selector.
Temporal Plot Toggles to show a time history plot for selected ROI. User can choose statistic to plot vs. time.
Histogram Plot Toggles to show a histogram plot of selected ROI.
Oscilloscope Plot Toggles to show an edge-on view of the entire image
Color Bar Toggles to turn the color scale on or off
Flying Spot Meter Toggles to show a flying cursor when the mouse cursor is over the image
File Operation Shows a dialog that allows a user to specify a reference image that can be added, subtracted, multiplied or divided by all images
Make Self Viewing File
Shows dialog to create a Self Viewing File
Hotkeys… Define Hotkeys
Setup HSDR Initial Configuration of HSDR for use with ResearchIR
A detailed description of the Statistics Viewer, Profile Plot, Temporal Plot, Histogram Plot, and Oscilloscope plot can be found in Section 5.3.1.

Chapter 5 – User Interface
ResearchIR User’s Guide 89
4.9.5.1 Color Bar The Color Bar shows the relationship between colors in the selected color palette and the data values in the currently selected units.
The current segmentation levels are also displayed on the color bar as full width shaded regions in the currently selected segmentation colors.
Active Isotherm ROIs are displayed as half width shaded regions. Isotherm limits can be adjusted by dragging the ROI on the color bar. Isotherms ROIs can be deleted by clicking the isotherm on the color
bar and pressing the Delete key.
4.9.5.2 Flying Spot Meter The Flying Spot Meter is a real-time data cursor that appears as the user runs the mouse cursor over the image. To the lower right of the cross-hairs is a tooltip that displays the cursor coordinate (in pixels) and the data value in the currently selected units.
4.9.5.3 File Operation The File Operation dialog allows the user to designate an operation and a reference image. Once selected, the reference image is applied on a pixel basis to the current image using the operator. For example, this can be used to subtract one image from another and only show the differences. If the reference file is a movie, you can specify the frame within the movie to be used. Using the “Frame” option you can specify a frame from the current movie or from live data.
You can use the Extract feature (Sec. 5.9.1.2) to pull a frame from a movie and use as the reference or you can use the Snapshot record function (Sec. 5.7.3) to grab a single frame.
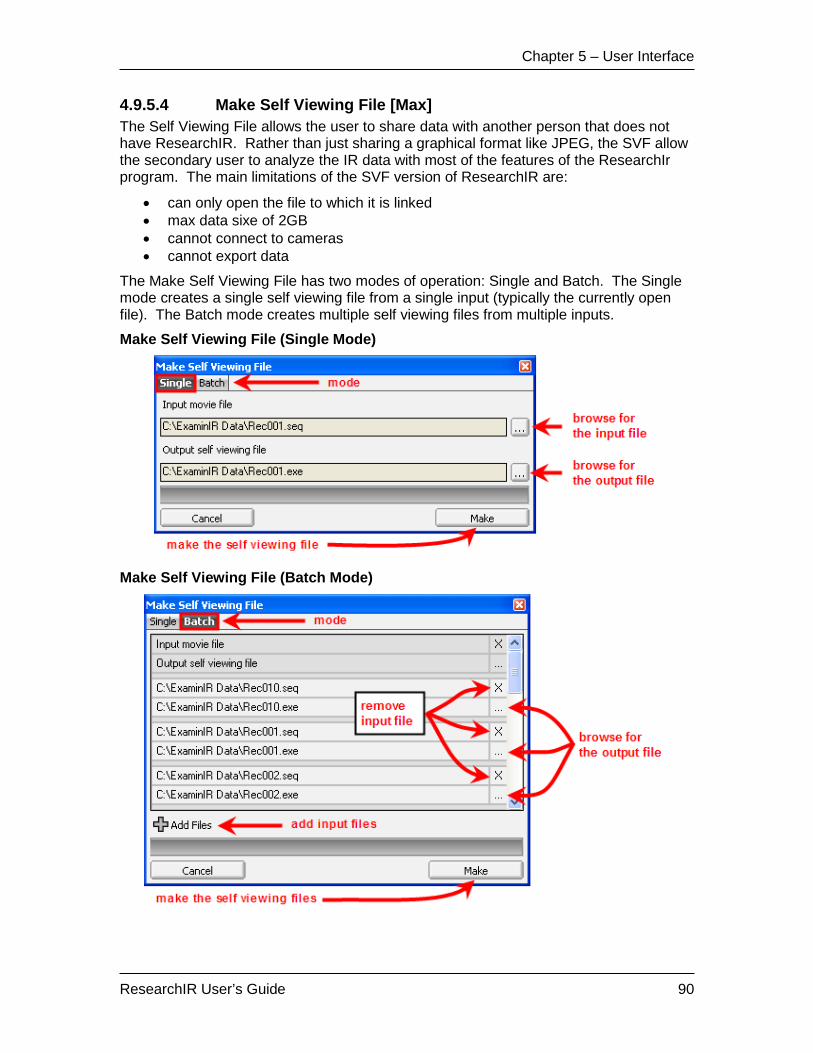
Chapter 5 – User Interface
ResearchIR User’s Guide 90
4.9.5.4 Make Self Viewing File [Max] The Self Viewing File allows the user to share data with another person that does not have ResearchIR. Rather than just sharing a graphical format like JPEG, the SVF allow the secondary user to analyze the IR data with most of the features of the ResearchIr program. The main limitations of the SVF version of ResearchIR are:
• can only open the file to which it is linked • max data sixe of 2GB • cannot connect to cameras • cannot export data
The Make Self Viewing File has two modes of operation: Single and Batch. The Single mode creates a single self viewing file from a single input (typically the currently open file). The Batch mode creates multiple self viewing files from multiple inputs.
Make Self Viewing File (Single Mode)
Make Self Viewing File (Batch Mode)
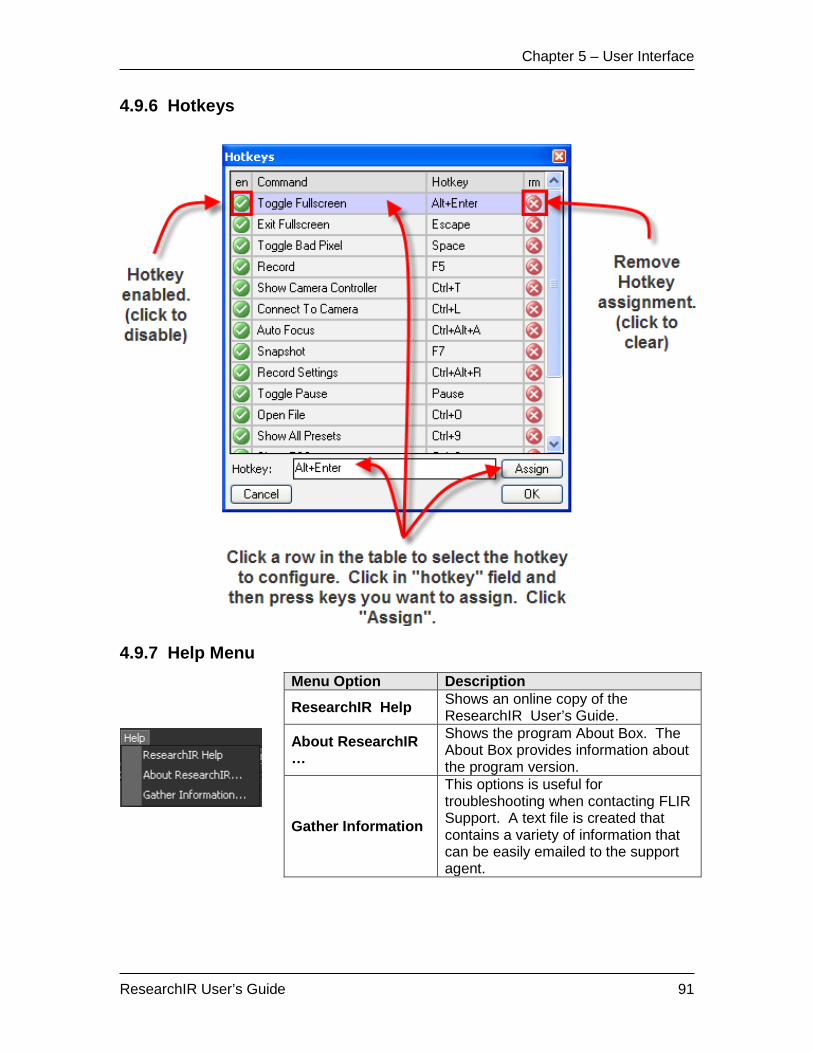
Chapter 5 – User Interface
ResearchIR User’s Guide 91
4.9.6 Hotkeys
4.9.7 Help Menu
Menu Option Description
ResearchIR Help Shows an online copy of the ResearchIR User’s Guide.
About ResearchIR …
Shows the program About Box. The About Box provides information about the program version.
Gather Information
This options is useful for troubleshooting when contacting FLIR Support. A text file is created that contains a variety of information that can be easily emailed to the support agent.

Chapter 5 – User Interface
ResearchIR User’s Guide 92
4.10 Metadata display The metadata display allows the user to see data embedded in the image header. The data available is camera dependent but typically can include things like image timestamp, camera settings, and camera status flags.
The View → Preferences dialog allows the user to choose which header items are displayed in the table. The items available will vary, depending on the camera model.
4.10.1 Time in ResearchIR The time displayed in the metadata can come from different sources, depending on the camera being used. Understanding the source time and the time reference are important when looking at the data at a future time
4.10.1.1 Time Source Time can either come from the camera or the PC clock. The most accurate (and precise) time is camera time. If the camera inserts a timestamp in the image header, ResearchIR will use that time. If camera time is not available, ResearchIR will fall back on the PC clock. The following table shows what time source ResearchIR will use for a given camera.
NOTE: When viewing RGB, Visible, and Screen modes, PC time is always used.
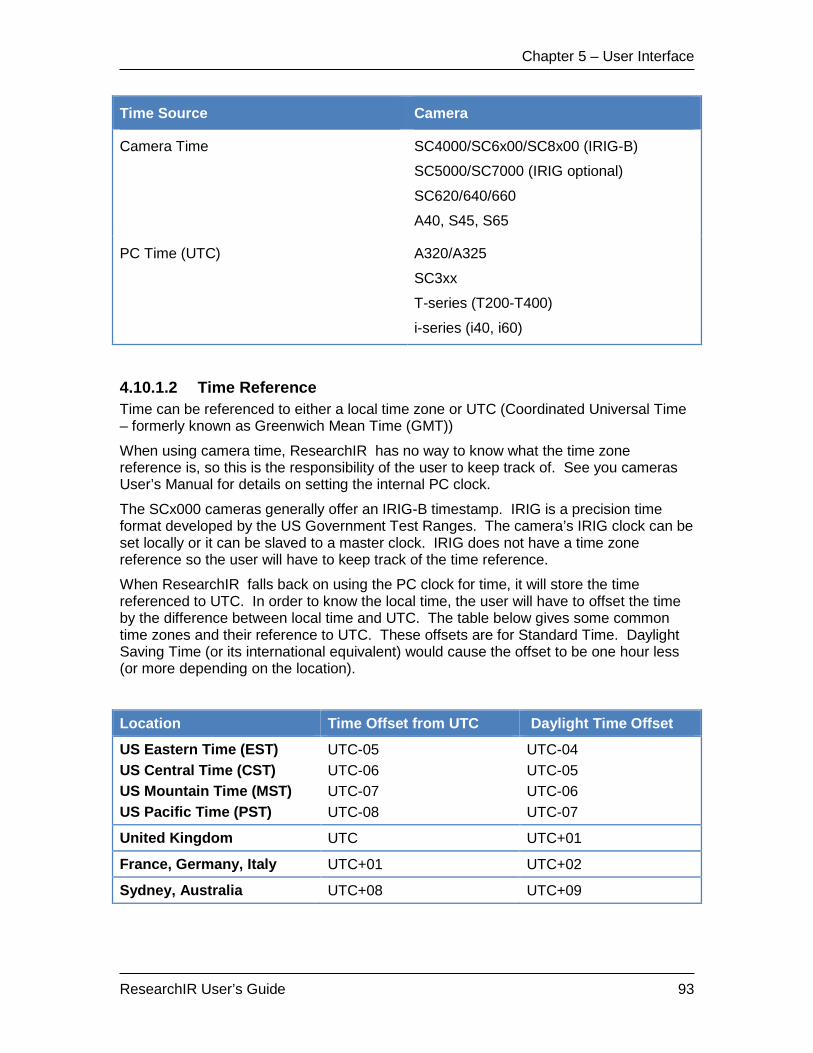
Chapter 5 – User Interface
ResearchIR User’s Guide 93
Time Source Camera
Camera Time SC4000/SC6x00/SC8x00 (IRIG-B)
SC5000/SC7000 (IRIG optional)
SC620/640/660
A40, S45, S65
PC Time (UTC) A320/A325
SC3xx
T-series (T200-T400)
i-series (i40, i60)
4.10.1.2 Time Reference Time can be referenced to either a local time zone or UTC (Coordinated Universal Time – formerly known as Greenwich Mean Time (GMT))
When using camera time, ResearchIR has no way to know what the time zone reference is, so this is the responsibility of the user to keep track of. See you cameras User’s Manual for details on setting the internal PC clock.
The SCx000 cameras generally offer an IRIG-B timestamp. IRIG is a precision time format developed by the US Government Test Ranges. The camera’s IRIG clock can be set locally or it can be slaved to a master clock. IRIG does not have a time zone reference so the user will have to keep track of the time reference.
When ResearchIR falls back on using the PC clock for time, it will store the time referenced to UTC. In order to know the local time, the user will have to offset the time by the difference between local time and UTC. The table below gives some common time zones and their reference to UTC. These offsets are for Standard Time. Daylight Saving Time (or its international equivalent) would cause the offset to be one hour less (or more depending on the location).
Location Time Offset from UTC Daylight Time Offset
US Eastern Time (EST) US Central Time (CST) US Mountain Time (MST) US Pacific Time (PST)
UTC-05 UTC-06 UTC-07 UTC-08
UTC-04 UTC-05 UTC-06 UTC-07
United Kingdom UTC UTC+01
France, Germany, Italy UTC+01 UTC+02
Sydney, Australia UTC+08 UTC+09

Chapter 6 – Camera Control
ResearchIR User’s Guide 94
5 Camera Control ResearchIR has a built-in camera controller for each of the supported cameras. Selecting the Camera→Control menu item will display the controller for the currently connected camera.
This section gives a summary of the controllers for some of the cameras supported. For detailed explanations of your cameras features please refer to you camera’s user manual.
For cameras like the A20, A40, S45, S65, SC640, and T-series that have on-camera controls, the ResearchIR controller will have a basic configuration screen where you can set temperature range and update the NUC. You can also select the image mode to display the IR image, visible camera (if available) or the screen image. There is also a button interface where you roughly have the same button layout and labels as are on the camera. Using the button interface along with the screen display makes it possible to remotely navigate the on-camera menus.

Chapter 6 – Camera Control
ResearchIR User’s Guide 95
Below is an example of ResearchIR displaying the IR image, visible and screen image from an S65.
NOTE: Thermal analysis can only be done on the IR image. The visible and screen display are RGB data streams. The analysis tools will still work but you will be analyzing the RGB values. You can analyze the individual RGB channels or the average of the three.
Calibrated IR image data will be recorded in an SEQ file format. Visible and Screen images can also be recorded but they will be stored in a SAF RGB movie.
5.1 A20/A40/S45/S65 Controllers The A40 Controller consists of a setup page and a button interface page. The setup page allows the user to select the image mode, temperature range, frame rate, or update the NUC. The button interface allows the user to remotely navigate the onscreen menus or control lens focus.

Chapter 6 – Camera Control
ResearchIR User’s Guide 96
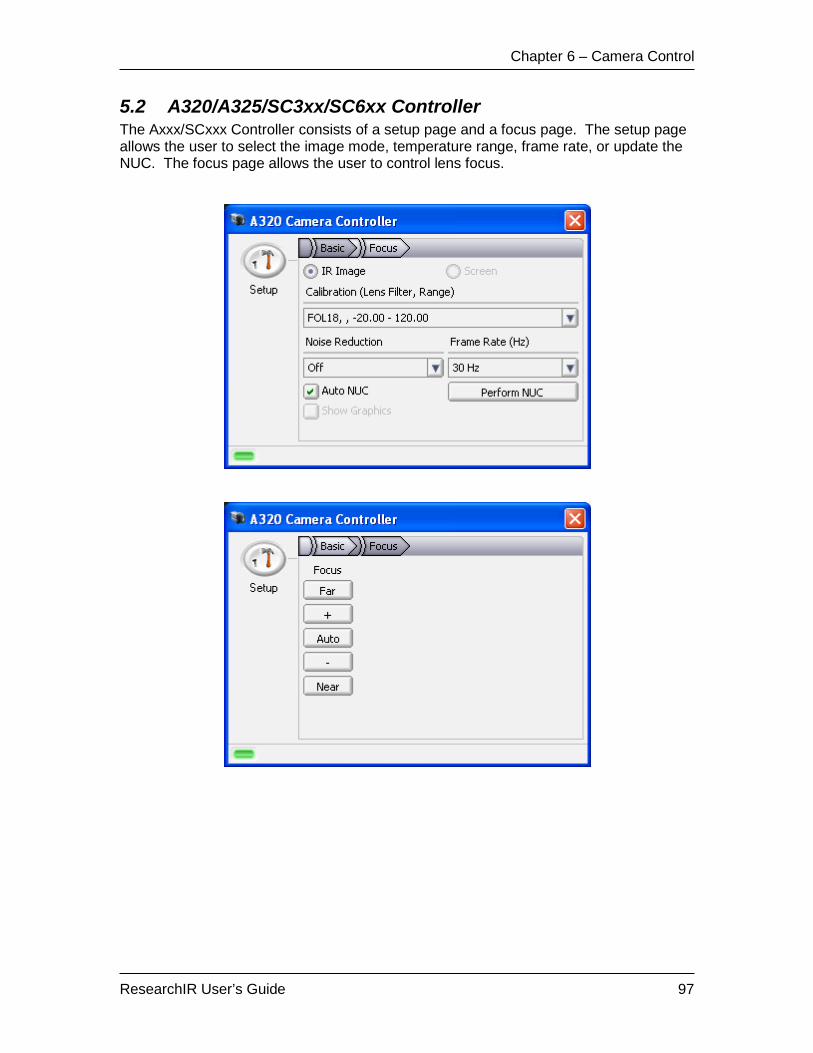
Chapter 6 – Camera Control
ResearchIR User’s Guide 97
5.2 A320/A325/SC3xx/SC6xx Controller The Axxx/SCxxx Controller consists of a setup page and a focus page. The setup page allows the user to select the image mode, temperature range, frame rate, or update the NUC. The focus page allows the user to control lens focus.

Chapter 6 – Camera Control
ResearchIR User’s Guide 98
5.3 SC640/SC660 Controller The SC640/SC660 Controller consists of a setup page and a button interface page. The setup page allows the user to select the image mode, temperature range, frame rate, or update the NUC. The button interface allows the user to remotely navigate the onscreen menus or control lens focus.

Chapter 6 – Camera Control
ResearchIR User’s Guide 99
5.4 SC4000/6000/8000 Controller NOTE: The standalone Camera Controller that came with the camera cannot be running at the same time as ResearchIR or there will be conflicts. Use the ResearchIR built-in controller.
The same controller is used for all variants of the SCx000.
The ResearchIR controller has almost the entire set of standalone controller functions so there are very few cases where the standalone controller is needed. In addition the ResearchIR controller has some advantages.
1. Offers both a Basic and Advanced mode
2. Compact GUI design makes it easier to see the imagery while controlling the camera.
3. Better support for factory calibrated cameras
For a detailed description of the controller functions, see the specific User Manual for your camera.

Chapter 6 – Camera Control
ResearchIR User’s Guide 100
5.5 SC2500/5000/7000 (Vircam Controller) The ResearchIR Vircam Controller is similar in functionality to the Cirrus controller that comes with the SC2500/5000/7000 cameras but the GUI is arranged to be more like the other SCx000 cameras.
The ResearchIR Vircam controller is designed primarily to work with cameras that have CNUC and Hypercal but should also support cameras that don’t have these features.
5.5.1 Setup Page In the Preset tab use the sliders to set the integration time and the corresponding temperature range is displayed. If the camera has Multi IT there will be checkboxes to enable individual presets.
If the camera was calibrated for multiple filters or lenses, the Range drop down will let the user select from cals available in camera memory.
The Window tab allows the user to select from available window options.
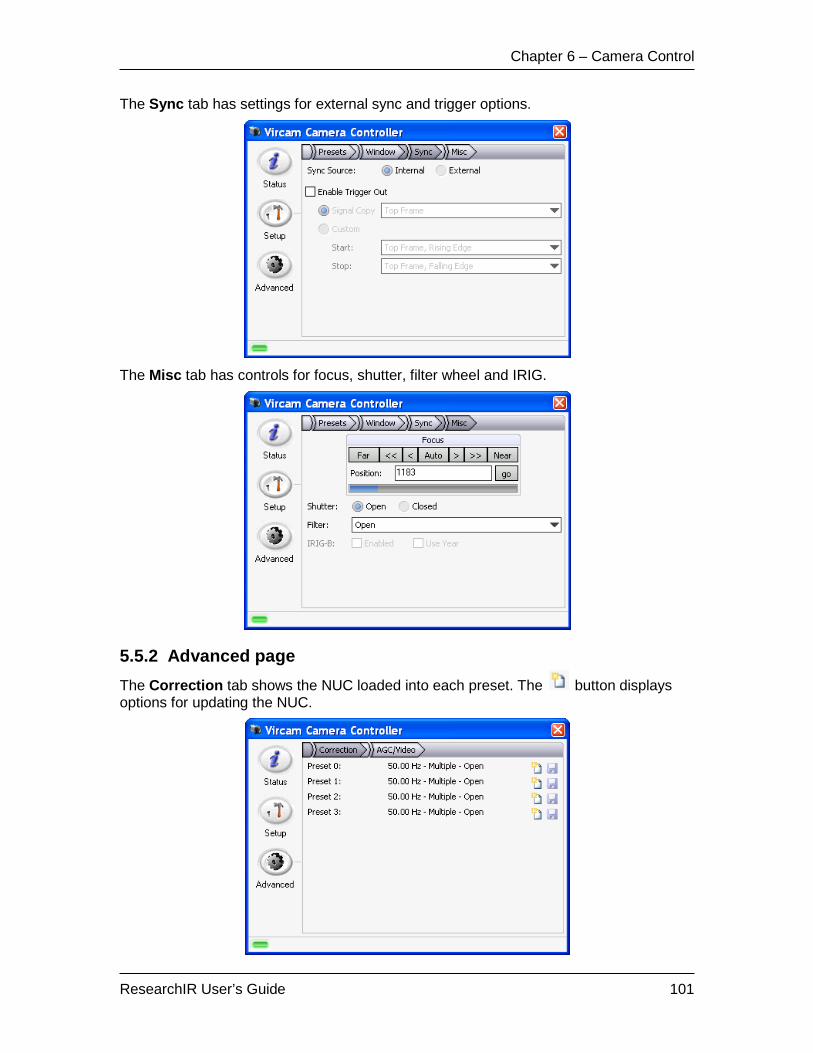
Chapter 6 – Camera Control
ResearchIR User’s Guide 101
The Sync tab has settings for external sync and trigger options.
The Misc tab has controls for focus, shutter, filter wheel and IRIG.
5.5.2 Advanced page The Correction tab shows the NUC loaded into each preset. The button displays options for updating the NUC.
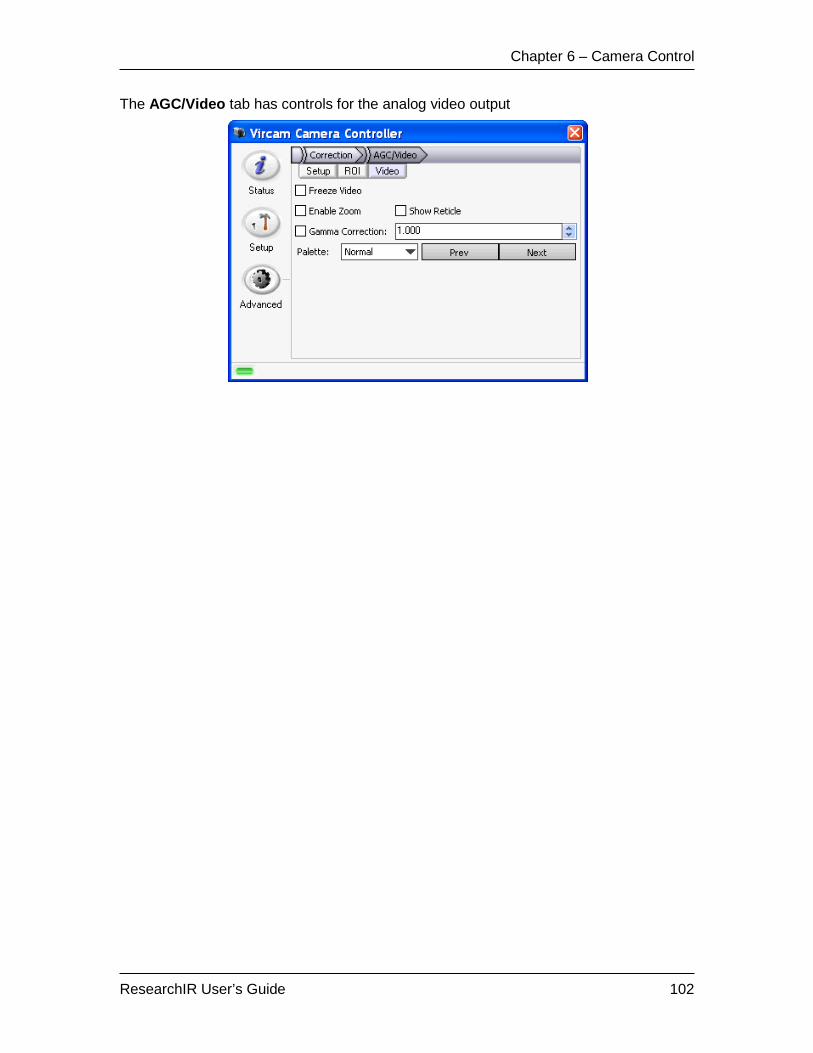
Chapter 6 – Camera Control
ResearchIR User’s Guide 102
The AGC/Video tab has controls for the analog video output

Chapter 7 – Infrared Primer
ResearchIR User’s Guide 103
6 Other Utilities In the Utilities folder there a number of external utilities provided. This section will explain their use and operation.
6.1 REdit This utility has been carried over directly from RTools. It allows users to edit the headers of SAF files. This utility has its own online help which can be accessed from the “About…” menu.
6.2 CalibratIR This is a standalone version of the User Calibration Wizard (see Sec 5.9.3.3.3.) With this utility a user can view/edit user calibration files with needing to run ResearchIR .
6.3 File AbatIR The File AbatIR utility is used to apply the DRX algorithm to recorded data in post-processing. This is similar to the algorithm applied in Section 5.7.4. File AbatIR works with SAF, SEQ, and PTW files. The File AbatIR utility differs from the Realtime DRX feature in several key ways.
• Rather than computing the DRX data on-the-fly, File AbatIR generates a completely separate “ABMOV” file.
• The user can control the order in which the presets are processed and the count threshold at which the next preset is used.
6.3.1 User Interface

Chapter 7 – Infrared Primer
ResearchIR User’s Guide 104
6.3.2 Output Types The table below explains the various options and their uses. “Editable” output types allow the user to change “Object Parameters” (i.e. emissivity), even after processing. Also, “higher” unit types can be derived. For example a counts (editable) file be used to generate radiance or temperature data. These files can only be viewed in ResearchIR . Non-editable types have fixed values.
Output Type Description
Counts (Editable) Useful to “pre-process” data so that the real-time DRX feature can display data at a faster rate. Radiance and temperature units can be generated in ResearchIR
Radiance (User, Editable) Output data is stored in radiance units but object parameters can still be changed in ResearchIR . Temperature units can be generated in ResearchIR
Radiance (User, Rescaled) Data has been rescaled (normalized) to hide the absolute values.
Radiance (User)
Output stored in radiance units. Computations based on user cal data. (This is the traditional output produced by the “FPAbater” utility in RTools). Temperature units cannot be generated from this data.
Temperature (User) Output stored in temperature units using user cal.
Radiance (Factory) Output stored in radiance units. Computations based on factory cal data. Temperature units cannot be generated from this data.
Temperature (Factory) Output stored in temperature units. Computations based on factory cal data. Radiance units cannot be generated from this data.
6.4 CNUC Manager If you have an SC5000 or SC7000 series camera with multiple CNUCs, this utility can be used to manage which CNUCs are loaded on the camera. This functionality is not integrated in to the ResearchIR camera controller for these cameras.

Chapter 9 – Acknowledgements
ResearchIR User’s Guide 105
7 Acknowledgements The authors would like to acknowledge the Independent JPEG Group for their JPEG library used by this software for JPEG file support. The authors would also like to acknowledge the ZLib and LibPNG projects for their libraries used by this software for PNG file support.
The authors would also like to acknowledge the libtiff project; this software uses libtiff (http://www.libtiff.org) for TIFF file support. libtiff is subject to the following copyright:
Copyright (c) 1988-1997 Sam Leffler
Copyright (c) 1991-1997 Silicon Graphics, Inc.
Permission to use, copy, modify, distribute, and sell this software and
its documentation for any purpose is hereby granted without fee, provided
that (i) the above copyright notices and this permission notice appear in
all copies of the software and related documentation, and (ii) the names of
Sam Leffler and Silicon Graphics may not be used in any advertising or
publicity relating to the software without the specific, prior written
permission of Sam Leffler and Silicon Graphics.
THE SOFTWARE IS PROVIDED "AS-IS" AND WITHOUT WARRANTY OF ANY KIND,
EXPRESS, IMPLIED OR OTHERWISE, INCLUDING WITHOUT LIMITATION, ANY
WARRANTY OF MERCHANTABILITY OR FITNESS FOR A PARTICULAR PURPOSE.
IN NO EVENT SHALL SAM LEFFLER OR SILICON GRAPHICS BE LIABLE FOR
ANY SPECIAL, INCIDENTAL, INDIRECT OR CONSEQUENTIAL DAMAGES OF ANY KIND,
OR ANY DAMAGES WHATSOEVER RESULTING FROM LOSS OF USE, DATA OR PROFITS,
WHETHER OR NOT ADVISED OF THE POSSIBILITY OF DAMAGE, AND ON ANY THEORY OF
LIABILITY, ARISING OUT OF OR IN CONNECTION WITH THE USE OR PERFORMANCE
OF THIS SOFTWARE.


