Analysis of the Revised Student Descriptive Questionnaire: Phase II Predictive Validity of Academic Self-Report Norman E. Freeberg Donald A. Rock Judith Pollack College Board Report No. 89-8 ETS RR No.89-49 College Entrance Examination Board, New York, 1989
Transcript
Analysis of the Revised Student Descriptive
Questionnaire: Phase II Predictive Validity of Academic Self-Report
Norman E. Freeberg Donald A. Rock Judith Pollack
College Board Report No. 89-8 ETS RR No.89-49
College Entrance Examination Board, New York, 1989
Norman E. Freeberg is a senior research psychologist at Educational Testing Service, Princeton. New Jersey.
Donald A. Rock is a principal research scientist at Educational Testing Service, Princeton, New Jersey.
Judith Pollack is an advanced research systems specialist at Educational Testing Service, Princeton, New Jersey.
Researchers are encouraged to express freely their professional judgment. Therefore, points of view or opinions stated in College Board Reports do not necessarily represent official College Board position or policy.
The College Board is a nonprofit membership organization committed to maintaining academic standards and broadening access to higher education. Its more than 2,600 members include colleges and universities, secondary schools, university and school systems. and education associations and agencies. Representatives of the members elect the Board of Trustees and serve on committees and councils that advise the College Board on the guidance and placement, testing and assessment, and financial aid services it provides to students and educational institutions.
Additional copies of this report may be obtained from College Board Publications, Box 886, New York, New York 10101. The price is $7.
Background and Purpose ........................................................ . Related Research ........................................................... .
Method Sample Description ......................................................... . Data Analysis .............................................................. .
Results and Discussion .......................................................... . Validity Based on School- versus Student-Reported High School Grade-Point Average ........................................................ . Validity Based on School- versus Student-Reported Class Rank .................. . Precision of Prediction ...................................................... . Validity of Self-Reported Grades for Separate Subject-Matter Areas .............. . Student Perception of Academic Ability in the Prediction of First-Year College Grade-Point Average ....................................... . Predictive Validity for Subgroups by High School Curriculum Concentration and Planned College Major ..................................... .
Summary and Conclusions
References
Tables
1. Validities (R's) and Standardized Regression Weights by Race, Sex, and Prediction
1
1 2
3 3 3
4
4 6 7 9
10
11
14
15
Model (School- and Student-Report) for Two "GPA Universities" . . . . . . . . . . . . . . . . . 5
2. Validities (R's) and Standardized Regression Weights by Race, Sex, and Prediction Model (School- and Student-Report) for Three "Class Rank Universities" . . . . . . . . . . 7
3a. Residual Values for Mean Signed Residual Error and Mean Absolute Error Indices (High School GPA Schools A and B) . . . . . . . . . . . . . . . . . . . . . . . . . . . . . . . . . . . . . . . . . . 8
3b. Residual Values for Mean Signed Residual Error and Mean Absolute Error Indices (High School Class Rank Schools C, D, and E) . . . . . . . . . . . . . . . . . . . . . . . . . . . . . . . . . . 8
4. Zero-Order Validities Between College GPA and Student-Reported Grades in Each of Six Subject-Matter Areas (Schools A and B) . . . . . . . . . . . . . . . . . . . . . . . . . . . . . . . . . . . . 9
5. Validities (R's) and Standardized Regression Weights for Each of Six Subject-Matter Areas (Schools A and B) . . . . . . . . . . . . . . . . . . . . . . . . . . . . . . . . . . . . . . . . . . . . . . . . . . . . . 10
8. Validities (R's) and Standardized Regression Weights for Four Subgroups Based on High School Curriculum Concentration and Intended College Major . . . . . . . . . . . . . . . 12
9. Mean Signed Errors of Prediction for Four High School Curriculum-by-College-Major Subgroups, for School- and Student-Report Prediction Models . . . . . . . . . . . . . . . . . . . . 13
ABSTRACT
An initial study phase dealing with the suitability of the revised (1985) Student Descriptive Questionnaire (SDQ) assessed the accuracy of student self-report for that instrument and found it to be of sufficient accuracy to fulfill its intended purposes. This second phase of study examines the adequacy of the revised SDQ in terms of the predictive validity of its student academic self-report information against a criterion of first-year college achievement (GPA).
Findings indicate that the validities are consonant with earlier study results using the original version of the SDQ, as well as with other similar self-report instruments used with college applicants. This was evident in overall magnitudes of the validities obtained, the precision of prediction in multiple regression equations, and in differences between validities for school-reported and student-reported high school academic achievement (as GPA and class rank). Multiple regression correlations and their associated regression weights were used to contrast validities for school- and student-report prediction models. These results indicated slight but consistent superiority for the school-reported information. In multiple prediction based on either school- or studentreported information, apparent differences were found: (1) in the relative contributions of the predictor variables (SAT-V, SAT-M, and high school academic achievement); (2) in the relative importance of the predictors for subgroups based on race and, to a lesser extent, on sex; and (3) in differing roles for high school GPA and class rank as academic predictor variables.
Other predictive validities were explored for SDQ information involving students' academic self-concept and student-reported grades in separate high school subject-matter areas. Differential validities based on groups defined by high school academic curriculum (i.e., math/science vs. non-math/science) in conjunction with intended choice of college academic major were also examined.
BACKGROUND AND PURPOSE
This report represents the second of two study phases dealing with the value of the information provided in the Student Descriptive Questionnaire (SDQ). Phase I dealt with the accuracy of student (SDQ) item response (Freeberg, 1988). Phase II assesses the validity of student academic self-report data in terms of the prediction of future (i.e., college) academic achievement.
The widely used SDQ, which is completed by applicants who enroll in the College Board's Admissions Testing Program (ATP), was initially incorporated in the ATP in 1971. It has since undergone significant
revisions, which are found in a version that was first administered in 1985 (College Board, 1985). Although prior research regarding the value of the original version of the questionnaire-as well as other similar student self-report instruments-has been extensive and well documented (Baird, 1976; Donlon, 1984), changes in SDQ content and format would dictate the need to assess the revised form in terms of its adequacy as a measurement tool and the comparability of any such results to previous research findings. In the first study phase, dealing with student response accuracy, it was found that for a set of SDQ items evidence for the veracity of the information provided was sufficient to conclude that the instrument is one that "'should be applicable to a number of educational purposes for which student biographical information has been used in the past" (Freeberg, 1988). That conclusion was based on two approaches to defining accuracy. One dealt with those items of student self-report for which verifying, external information sources were available (e.g., high school grades, race/ethnicity, parental income, citizenship status, and application for financial aid). The second approach examined internal response consistency for pairs of items dealing with logically comparable forms of information that would produce expected consistency, or similarity, of response (e.g., years of total coursework in a subject area should match the sum of years-reported elsewhere in the questionnaire--of specific courses taken within that same subject area).
Given the evidence for usable levels of student accuracy of self-report, as well as results that were generally comparable to previous research findings on the topic. an appropriate next step is to consider the adequacy of SDQ responses in terms of their predictive validity-specifically, the extent to which student report of academic information is of value for predicting future academic performance. The primary approach to examining predictive validity will. as in most prior research on this topic, deal with the role of studentreported high school academic performance (grades and class rank) as predictors of college achievement in the form of first-year college grade-point average (GPA). Within that approach, the study will consider: (1) the levels of prediction achieved using studentreported high school academic performance data in contrast to data obtained from school records; (2) the relative contribution to validity of high school academic performance data (school- and student-reported) when compared with standardized admission test scores in a multiple predictor model; and (3) the quality or accuracy of the prediction equations obtained.
In another segment of the study the predictive value of student academic report, within the multiple regression models, will be sought in an examination of the different validities obtained for self-reported high
school grades in separate subject-matter areas-that is, those ''components" that make up the overall studentreported high school GPA. Additional determinations of predictive validity, for a form of student academic report, will utilize several SDQ items that reflect the student's self-concept of academic ability. This presents an opportunity for comparisons between the SDQ validities obtained and a considerable amount of prior validity research with this type of construct. Finally, in an effort to understand and possibly enhance the bases of the validities obtained, the analysis will explore differential prediction for broad curriculum subgroupings of students who differ in terms of their self-reported high school course (curriculum) concentration and intended college major.
Related Research
Previous research, regarding self-reported high school grades as predictors of college academic achievement, has consistently sustained the finding that those validity levels are comparable to validities obtained for transcript (school-reported) data (Maxey, 1972; Hoyt and Munday, 1968; ACf, 1971). Based on a large number of studies carried out for the American College Testing Program, validity coefficients ranging between .40 and .60 have commonly been found when high school grades-whether school- or student-reported-are correlated with college grades (ACT, 1973). Validities falling within a similar range have been found for studies conducted by the College Board using student (SDQ)reported high school GPA and class rank as predictors (Donlon, 1984). For the most part, in both College Board and ACf samples the levels of predictive validity for student-reported high school GPA remain somewhat below that of the school-reported GPA as a predictor of college grades. As examples, mean correlations between SDQ-reported high school GPA and first-year college GPA were found to be .44, whereas the mean coefficients for school-reported GPA were .48. With high school class rank as predictor, the respective contrasts are r's of .43 and .49. Overall contrasts between high school class rank and high school grades as predictors (school- or student-reported) indicate that class rank is either as good as GPA in predicting college freshman GPA (Donlon, 1984) or only slightly poorer (Maxey, 1972).
Evidence has also been relatively consistent in support of the superiority of student-reported high school grades as predictors of college grades when contrasted with tests of academic aptitude (Baird, 1969; Cole, 1969; Hoyt and Munday, 1968; Richards and Lutz, 1968). The magnitudes of the differences between these two predictors were reflected in median r's, over anumber of schools, of .51 for student-reported high school
2
grades and .43 for ACT admission test scores (Richards, Holland, and Lutz, 1967). In addition to higher zeroorder r's, student-reported high school grades have, concomitantly, added more to college grade prediction in multiple prediction equations (i.e. , produced larger standardized regression weights) than did ACT test scores (Baird, 1976).
Group differences, based on sex or race, have not generally been highlighted in available studies aimed at contrasting predictive validity between student- and school-reported high school academic performance or in contrasts between student report of academic ability and standardized admissions tests. In one study, dealing primarily with comparisons between predictive validities for student self-reported high school grades and ACT admissions tests (Baird, 1969), results reported by sex show that validities obtained for females were uniformly higher than those obtained for males (whichever predictor is considered). Subgroup differences based on sex or race, in validity studies using student self-reported grades as predictors of college GPA, have also been touched upon occasionally in terms of accuracy of prediction for the various subgroups. Thus, on the basis of mean absolute errors (MAE's) in the prediction of college GPA, equations containing ACf scores for females were somewhat more accurate than those for males (Sawyer and Maxey, 1982). An "inference" of less predictive accuracy for black students was made from that same study, based on the finding that colleges with a higher proportion of black students show validities with higher MAE's (less prediction accuracy).
In addition to studies of the predictive value of high school academic record provided by students in formal self-report questionnaires, the use of self-reported academic assessment in the form of the student's selfperception of academic ability has yielded predictive validities of considerable magnitude against college grade criteria. Student ratings of their overall academic competence in relation to peers and of their ability levels in specific subject-matter areas have been utilized in multi-item self-concept scales such as the Brookover scale of academic self-concept (Brookover, 1962) and the Peterson motivation-for-grades scale (Furst, 1966). Use of such student self-concept scales in the prediction of college grades has proven impressive when compared with validities obtained for college admissions tests or high school grades and when utilized in combination with those predictors (Jones and Grieneeks, 1970; Sproull, 1969; Lindsay and Althouse, 1969). Levels of relationship between an academic self-concept scale and college-grades, when compared with a standardized college admissions test (ACT), resulted in an rof .54 for the self-concept scale and .45 for the admissions test in a sample obtained by Biggs and Tinsley ( 1970). In samples studied by Jones and Grieneeks (1970), there were
even greater disparities in favor of the academic selfconcept scale for both male and female samples (e.g., r = .49 for the scale versus .22 for the SAT in a sample of males). Even single-item student self-ratings of academic ability, similar to those found in the Brookover and other scales, are reported to be superior to measures of academic ability as predictors of college grades (Baird, 1969; Nichols and Holland, 1963). However, over a large number of studies in which a motivation-forgrades scale was incorporated in multiple regression equations (after SAT scores and high school grades had been included), the increment in multiple R averaged only .03 (Oppenheim, 1970).
Methodological attempts to enhance and better explain grade prediction, based on the types of academic self-report information just considered, have focused on differential prediction studies using samples of students with differing academic or curriculum backgrounds and expressed interests in their major fields of study or occupational choice (Holland and Lutz, 1968; Norris and Katz, 1970). Student ratings of academic interest in various subject areas, for example, provided greater differential validities than absolute (standard) validities in the prediction of grades obtained in high school senior year and college freshman year (Norris and Katz, 1970). Such enhanced prediction of relative success based on differentiation between important (relevant) aspects of student educational and other biographical or background experiences has been sought in a variety of differential validity studies (Lunneborg, 1966, 1968; Lunneborg and Lunneborg, 1966, 1969) and in moderator-variable approaches that seek to uncover those background variables that predict most efficiently for differing student subgroups (Ghiselli, 1960; Klein, Rock, and Evans, 1968; Rock, 1965). Based on some degree of success, such approaches have helped to explain more thoroughly the roles played by different background variables for differing categories of individuals in an academic prediction system.
METHOD
Sample Description
The sample available for assessing the predictive validity of SDQ-provided academic self-report information consists of 10,573 first-year college students who had entered five state universities in September of 1986 and had completed the newly revised (1985-86) version of the SDQ as part of the application process. These students represent a subsample of a larger original sample of 13,748 entering freshmen from these universities who were utilized in the initial (Phase I) study of SDQ accuracy and are also the ones for whom first-year col-
lege GPA scores could be obtained. 1 A detailed description of the original sample and the procedures for acquiring and assembling the data set are described in the first-phase study of SDQ response accuracy (Freeberg, 1988).
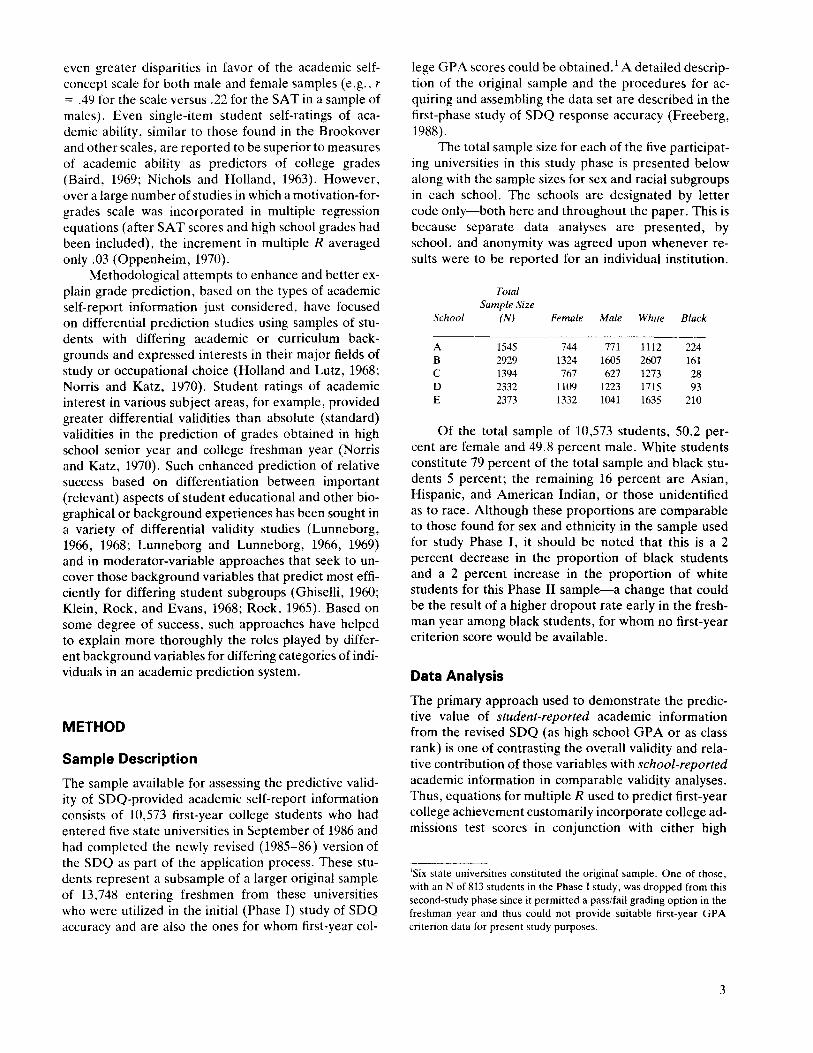
The total sample size for each of the five participating universities in this study phase is presented below along with the sample sizes for sex and racial subgroups in each school. The schools are designated by letter code only-both here and throughout the paper. This is because separate data analyses are presented, by school, and anonymity was agreed upon whenever results were to be reported for an individual institution.
Total Sample Size
School (N) Female Male
A 1545 744 771 B 2929 1324 1605 c 1394 767 627 D 2332 1109 1223 E 2373 1332 1041
White Black
1112 224 2607 161 1273 28 1715 93 1635 210
Of the total sample of 10,573 students, 50.2 percent are female and 49.8 percent male. White students constitute 79 percent of the total sample and black students 5 percent; the remaining 16 percent are Asian, Hispanic, and American Indian, or those unidentified as to race. Although these proportions are comparable to those found for sex and ethnicity in the sample used for study Phase I, it should be noted that this is a 2 percent decrease in the proportion of black students and a 2 percent increase in the proportion of white students for this Phase II sample-a change that could be the result of a higher dropout rate early in the freshman year among black students, for whom no first-year criterion score would be available.
Data Analysis
The primary approach used to demonstrate the predictive value of student-reported academic information from the revised SDQ (as high school GP A or as class rank) is one of contrasting the overall validity and relative contribution of those variables with school-reported academic information in comparable validity analyses. Thus, equations for multiple R used to predict first-year college achievement customarily incorporate college admissions test scores in conjunction with either high
'Six state universities constituted the original sample. One of those, with anN of 813 students in the Phase I study, was dropped from this second-study phase since it permitted a pass/fail grading option in the freshman year and thus could not provide suitable first-year GPA criterion data for present study purposes.
3
school (transcript)-reported grades or high schoolreported class rank. which is to be designated here as the "school-report model" (assumed to be based on a relatively error-free information source). The contrasting prediction model is one based on student-reported high school grades or class rank and is designated as the "student-report model"'-based on a source considered fallible and known from previous studies to deviate, to some extent, from the true data source as represented by school-reported information.
Of specific concern in what will be the first segment of the study analyses are not only the differences found in overall levels of validities (as multiple R's) and the relative contribution of predictor variables in each model but differences in the precision or quality of that prediction for first-year college GPA. These latter two forms of comparison are to be made on the basis of the weighted contribution of each of the variables in the different models (as standardized regression weights) and of prediction accuracy based on absolute and relative prediction errors in the multiple regression equations. Such contrasts between the models are to be examined for two racial subgroups (white and black students) and for male and female students. 2 A more detailed perspective on the predictive value of the student-reported high school record is provided in another segment of the analysis dealing with comparative validities for each of the subject-matter areas that, in effect, constitute the major components of the student-reported high school GPA. That is, separate validities will be computed for student-reported high school GPA in the subject-matter areas of arts and music, English, foreign language, math, natural science, and social science, along with the GPA as composite for these subject-matter areas.
A third segment of the analysis will define the extent to which available SDQ variables, reflecting the student's self-concept of academic ability, can add to the multiple prediction equations obtained in the first portion of the validity analyses. The added contribution to R of that construct will be based on three SDQ items analyzed separately and in a composite scale score. They are: (1) the student's highest degree goal, (2) advanced placement intentions, and (3) self-ratings of ability relative to peers in several subject-matter areas.
In a final study segment a brief analysis is undertaken that deals with differential validity in multiple prediction of college GPA for four student subgroups. These were defined on the basis of SDQ-reported course concentration in high school (math/science versus non-math/science), in conjunction with expressed intent to go on to a college major in the math/science
'Sample sizes for other racial/ethnic subgroups (Hispanic. Asian. and American Indian) were not sufficient in the five universities for useful multiple regression analysis.
4
versus non-math/science areas. Differences in the patterns of validities, regression weights, and precision of prediction for these subgroups can add to an understanding of influences on the overall validities identified in the earlier segments of the study.
In the conduct of the analyses it is important to note several points that, together. precluded combining all five schools into one overall sample. The first is that two of the five state universities could provide schoolreported high school GPA only (Schools A and B) because they do not ordinarily obtain school-reported high school class rank. Three of the five could provide only school-reported high school class rank (Schools C, D, and E) but not GPA. The consequence is that all analyses of school-report and student-report prediction models had to be carried out separately for the two "high school GPA" universities and the three "high school class rank" universities. Second, within each such analysis a decision was made to treat the schools as replicates and to repeat any analysis over more than one university sampled-sample sizes being sufficient in each school to permit such separate analyses. This decision to replicate analyses in order to examine the stability of results over at least two samples stemmed from: (1) doubts about pooling data from schools where there were broad differences in students' mean college admissions test scores (i.e., SAT-V and SAT-M); (2) the distinct possibility that scale qualities, on which each university's first-year GPA criterion measure is based, might vary markedly from school to school, thus making any interpretation of pooled results tenuous; and (3) the need to provide a basis for confirming comparative differences between subgroups, especially in regard to patterns of the relative contribution of predictor variables to multiple R's. For example, replication provides the primary justification for defining group differences where standardized regression weights are being considered.
RESULTS AND DISCUSSION
Validity Based on School- versus StudentReported High School Grade-Point Average
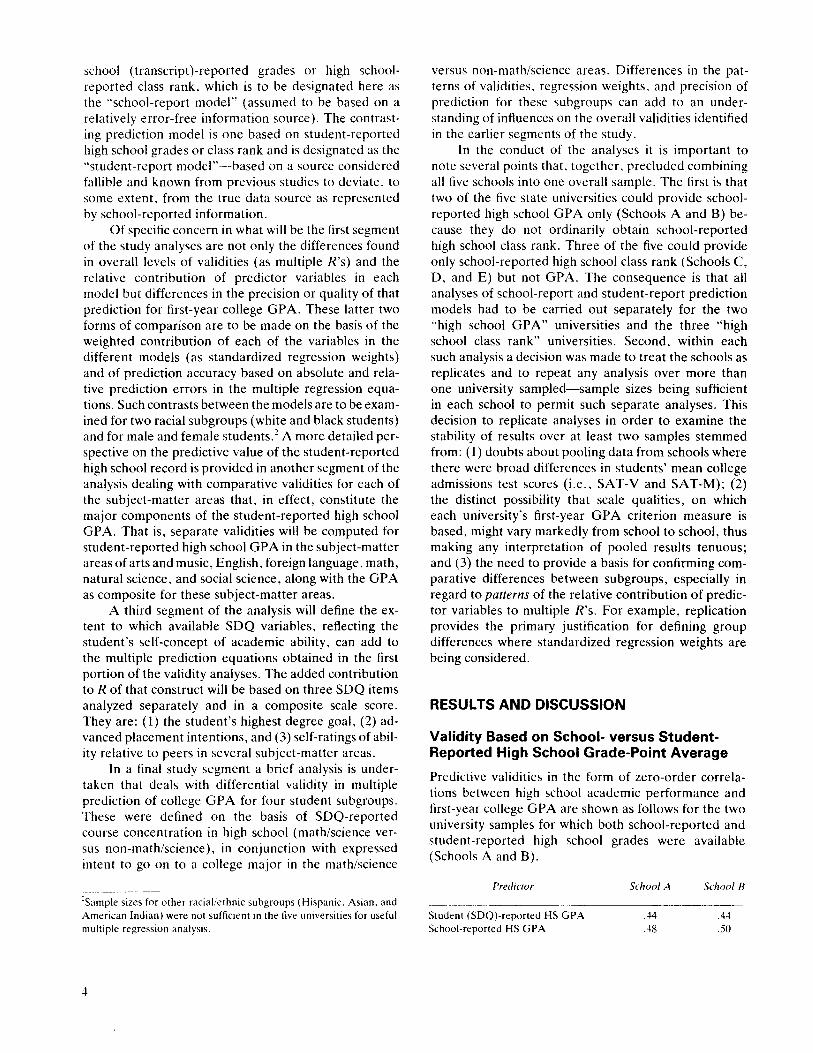
Predictive validities in the form of zero-order correlations between high school academic performance and first-year college GPA are shown as follows for the two university samples for which both school-reported and student-reported high school grades were available (Schools A and B).
These validities are highly similar to those found in previous contrasts between student- and schoolreported data based on the earlier version of the SDQ. Previous findings, derived from a large number of colleges (Donlon, 1984), resulted in mean r's of .44 as the validity for the student-reported high school GPA and .48 for the school-reported high school GPA. Schoolreported high school GPA thus shows a slight but consistent superiority to student-reported GPA. It can be noted that the differences favoring school-reported high school GPA as predictor in contrast to studentreported high school GPA may, in part, be attributable to differences in the number of scale intervals used in defining those two data sources. Thus the studentreported grade information is obtained from a 12-point GPA scale (SDQ item #10, with the GPA scores ranging from A+ to E or F), whereas school-reported GPA is on a more continuous scale from 0.00 to 4.00. The greater scale refinement for the school-reported data could be a factor in producing slightly higher R's for that predictor. However, it is the relative importance of these variables of academic grade performance, along with other academic ability predictors used in the admissions process, that is of primary interest for present study purposes-that is, based on multiple regression analyses that customarily combine standardized admissions test scores with high school grade performance. Those validities (R's) are presented for Schools A and B in Table 1, along with standardized regression weights (SRW's) that indicate the relative contribution of each of the three predictor variables (high school
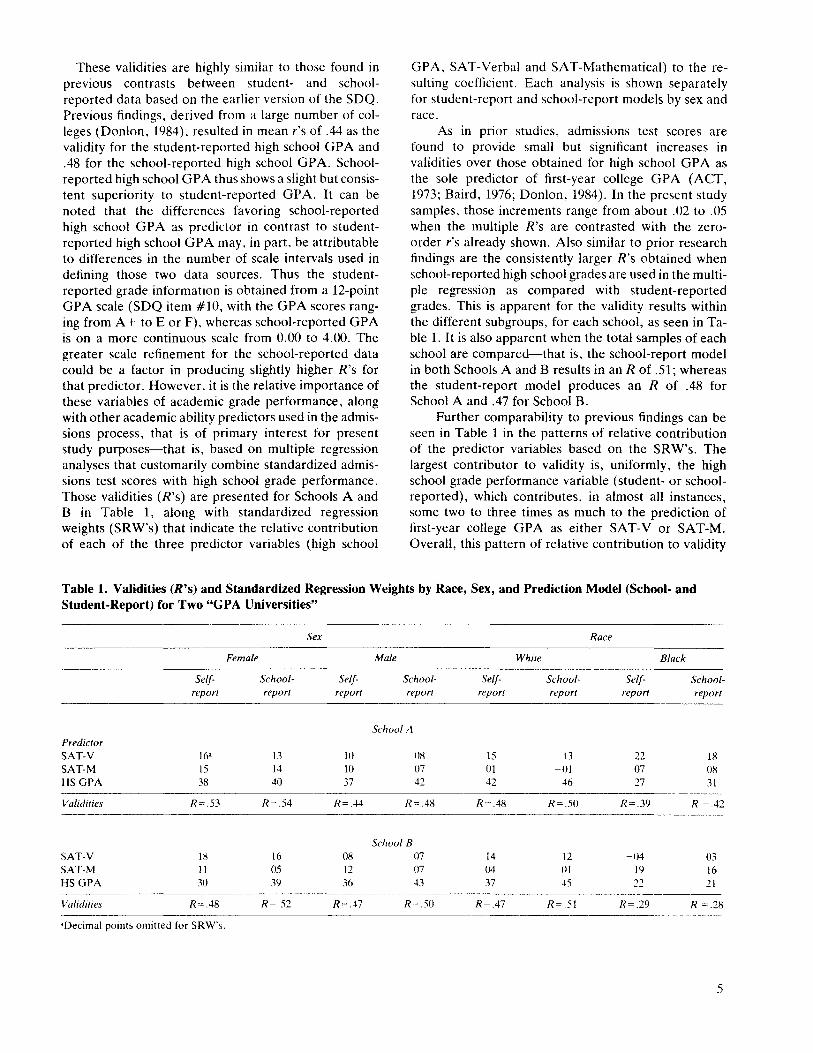
GPA, SAT-Verbal and SAT-Mathematical) to theresulting coefficient. Each analysis is shown separately for student-report and school-report models by sex and race.
As in prior studies, admissions test scores are found to provide small but significant increases in validities over those obtained for high school GPA as the sole predictor of first-year college GPA (ACT, 1973; Baird, 1976; Donlon, 1984). In the present study samples, those increments range from about .02 to .05 when the multiple R's are contrasted with the zeroorder r's already shown. Also similar to prior research findings are the consistently larger R's obtained when school-reported high school grades are used in the multiple regression as compared with student-reported grades. This is apparent for the validity results within the different subgroups, for each school, as seen in Table 1. It is also apparent when the total samples of each school are compared-that is, the school-report model in both Schools A and B results in an R of .51; whereas the student-report model produces an R of .48 for School A and .47 for School B.
Further comparability to previous findings can be seen in Table 1 in the patterns of relative contribution of the predictor variables based on the SRW's. The largest contributor to validity is, uniformly, the high school grade performance variable (student- or schoolreported), which contributes, in almost all instances, some two to three times as much to the prediction of first-year college GPA as either SAT-V or SAT-M. Overall, this pattern of relative contribution to validity
Table I. Validities (R's) and Standardized Regression Weights by Race, Sex, and Prediction Model (School- and Student-Report) for Two "GPA Universities"
Predictor SA T-V SAT-M HSGPA
Validities
SA T-V SAT-M HSGPA
Validities
Selfreport
16• 15 38
R=.53
18 11 30
R=.48
'Decimal points omitted for SRW's.
Female
Schoolreport
13 14 40
R=.54
16 05 39
R=.52
Sex
Selfreport
10 10 37
R=.44
08 12 36
R=.47
Male
Schoolreport
School A
08 07 42
R=.48
School B 07 07 43
R=.50
Selfreport
15 01 42
R=.48
14 04 37
R=.47
White
Schoolreport
13 -01
46
R=.50
12 01 45
R=.51
Race
Selfreport
22 07 27
R=.39
-04 19 22
R=.29
Black
Schoolreport
18 08 31
R =.42
-03 16 21
R =.28
5
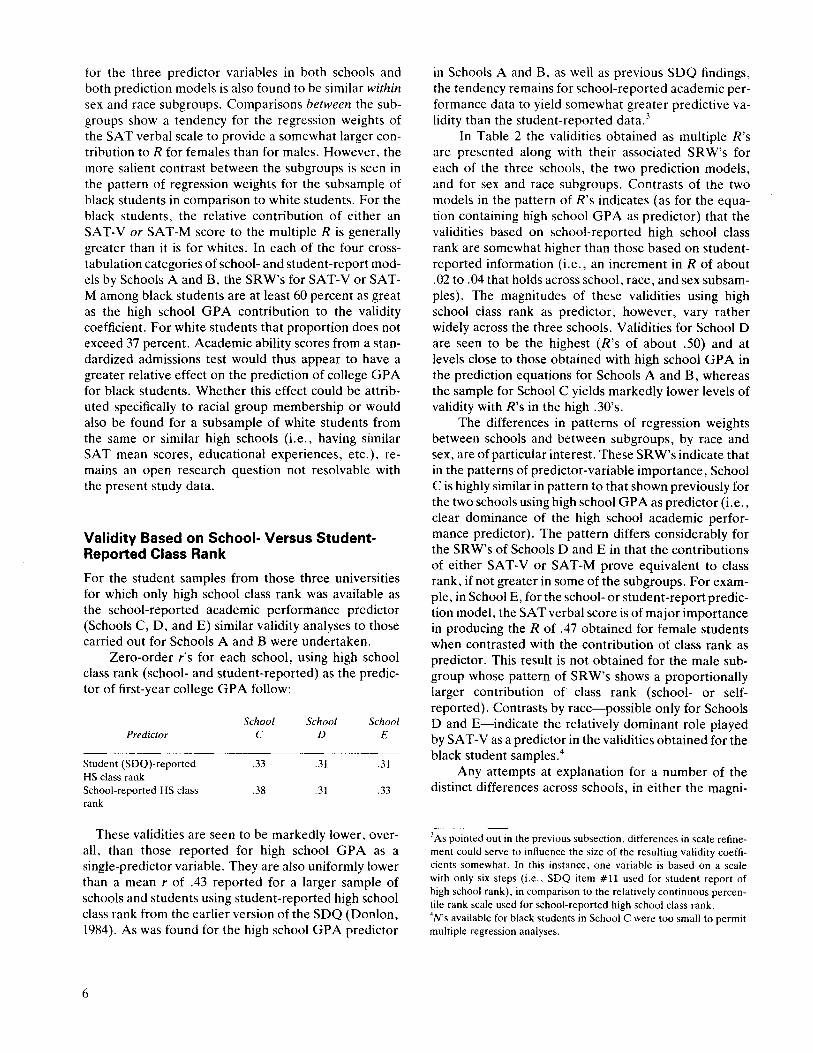
for the three predictor variables in both schools and both prediction models is also found to be similar within sex and race subgroups. Comparisons between the subgroups show a tendency for the regression weights of the SAT verbal scale to provide a somewhat larger contribution toR for females than for males. However, the more salient contrast between the subgroups is seen in the pattern of regression weights for the subsample of black students in comparison to white students. For the black students, the relative contribution of either an SAT-V or SAT-M score to the multiple R is generally greater than it is for whites. In each of the four crosstabulation categories of school- and student-report models by Schools A and B, the SRW's for SA T-V or SATM among black students are at least 60 percent as great as the high school GPA contribution to the validity coefficient. For white students that proportion does not exceed 37 percent. Academic ability scores from a standardized admissions test would thus appear to have a greater relative effect on the prediction of college GPA for black students. Whether this effect could be attributed specifically to racial group membership or would also be found for a subsample of white students from the same or similar high schools (i.e., having similar SAT mean scores, educational experiences, etc.), remains an open research question not resolvable with the present study data.
Validity Based on School- Versus StudentReported Class Rank
For the student samples from those three universities for which only high school class rank was available as the school-reported academic performance predictor (Schools C, D, and E) similar validity analyses to those carried out for Schools A and B were undertaken.
Zero-order r's for each school, using high school class rank (school- and student-reported) as the predictor of first-year college GPA follow:
School School School Predictor c D E
Student (SDQ)-reported .33 .31 .31 HS class rank School-reported HS class .38 .31 .33 rank
These validities are seen to be markedly lower, overall, than those reported for high school GPA as a single-predictor variable. They are also uniformly lower than a mean r of .43 reported for a larger sample of schools and students using student-reported high school class rank from the earlier version of the SDQ (Donlon, 1984). As was found for the high school GPA predictor
6
in Schools A and B, as well as previous SDQ findings, the tendency remains for school-reported academic performance data to yield somewhat greater predictive validity than the student-reported data. 3
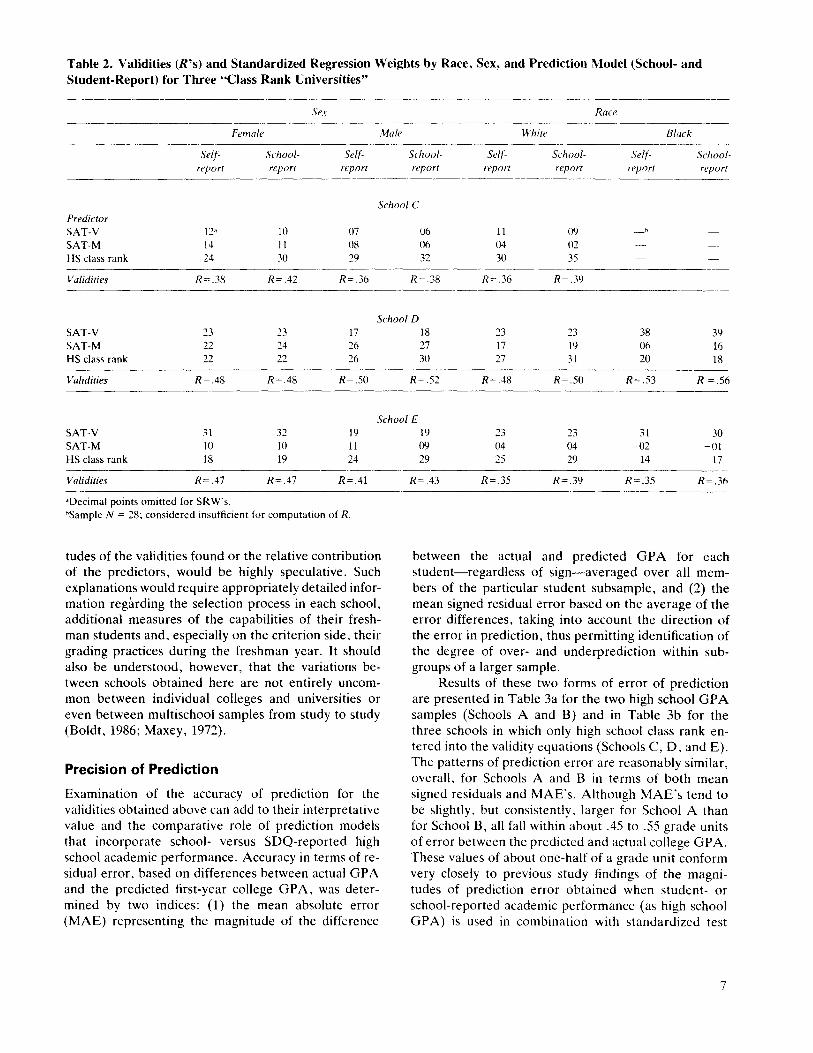
In Table 2 the validities obtained as multiple R's are presented along with their associated SRW's for each of the three schools, the two prediction models, and for sex and race subgroups. Contrasts of the two models in the pattern of R's indicates (as for the equation containing high school G P A as predictor) that the validities based on school-reported high school class rank are somewhat higher than those based on studentreported information (i.e., an increment in R of about .02 to .04 that holds across school, race, and sex subsamples). The magnitudes of these validities using high school class rank as predictor, however, vary rather widely across the three schools. Validities for School D are seen to be the highest (R's of about .50) and at levels close to those obtained with high school GP A in the prediction equations for Schools A and B, whereas the sample for School C yields markedly lower levels of validity with R's in the high .30's.
The differences in patterns of regression weights between schools and between subgroups, by race and sex, are of particular interest. These SRW's indicate that in the patterns of predictor-variable importance, School Cis highly similar in pattern to that shown previously for the two schools using high school G P A as predictor (i.e., clear dominance of the high school academic performance predictor). The pattern differs considerably for the SRW's of Schools D and E in that the contributions of either SAT-V or SAT-M prove equivalent to class rank, if not greater in some of the subgroups. For example, in School E, for the school- or student-report prediction model, the SAT verbal score is of major importance in producing the R of .47 obtained for female students when contrasted with the contribution of class rank as predictor. This result is not obtained for the male subgroup whose pattern of SRW's shows a proportionally larger contribution of class rank (school- or selfreported). Contrasts by race-possible only for Schools D and E-indicate the relatively dominant role played by SAT-Vas a predictor in the validities obtained for the black student samples. 4
Any attempts at explanation for a number of the distinct differences across schools, in either the magni-
3 As pointed out in the previous subsection, differences in scale refinement could serve to influence the size of the resulting validity coefficients somewhat. In this instance, one variable is based on a scale with only six steps (i.e., SDQ item #11 used for student report of high school rank), in comparison to the relatively continuous percentile rank scale used for school-reported high school class rank. 4N's available for black students in School C were too small to permit multiple regression analyses.
Table 2. Validities (R's) and Standardized Regression Weights by Race, Sex, and Prediction Model (School- and Student-Report) for Three "Class Rank Universities"
Selfreport
Female
Schoolreport
Sex
Selfreport
Male
Schoolreport
Selfreport
White
Schoolreport
Race
Selfreport
Black
Schoolreport
School C Predictor SA T-V 12' 10
SAT-M 14 II HS class rank 24 30
Validities R=.38 R=A2
07 06 08 06 29 32
R=.36 R=.38
11 04 30
R=.36
09 02 35
R=.39
_b
School D SA T-V 23 23 17 SAT-M 22 24 26 HS class rank 22 22 26
Validities R=.48 R=.48 R=.SO
18 27 30
R=.52
23 17 27
R=.48
23 19 31
R=.SO
38 06 20
R=.53
39 16 18
R =.56
School E SA T-V 31 32 19 SAT-M 10 10 11 HS class rank 18 19 24
Validities R=.47 R=.47 R=.41
'Decimal points omitted for SRW's. bSample N = 28; considered insufficient for computation of R.
tudes of the validities found or the relative contribution of the predictors, would be highly speculative. Such explanations would require appropriately detailed information regarding the selection process in each school, additional measures of the capabilities of their freshman students and, especially on the criterion side, their grading practices during the freshman year. It should also be understood, however, that the variations between schools obtained here are not entirely uncommon between individual colleges and universities or even between multischool samples from study to study (Boldt, 1986; Maxey, 1972).
Precision of Prediction
Examination of the accuracy of prediction for the validities obtained above can add to their interpretative value and the comparative role of prediction models that incorporate school- versus SDQ-reported high school academic performance. Accuracy in terms of residual error, based on differences between actual GPA and the predicted first-year college GPA, was determined by two indices: ( 1) the mean absolute error (MAE) representing the magnitude of the difference
19 23 23 31 30 09 -04 -()4 -02 -01 29 25 29 14 17
R=.43 R=.35 R=.39 R=.35 R=.36
between the actual and predicted G P A for each student-regardless of sign-averaged over all members of the particular student subsample, and (2) the mean signed residual error based on the average of the error differences, taking into account the direction of the error in prediction, thus permitting identification of the degree of over- and underprediction within subgroups of a larger sample.
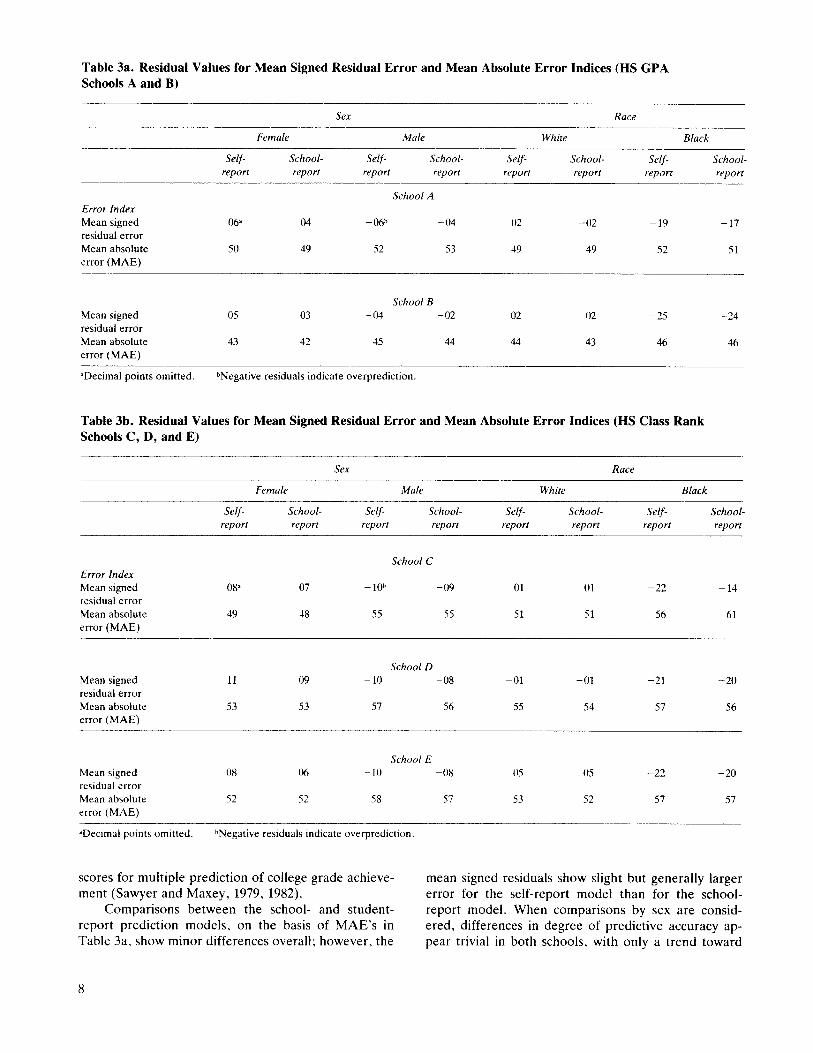
Results of these two forms of error of prediction are presented in Table 3a for the two high school GPA samples (Schools A and B) and in Table 3b for the three schools in which only high school class rank entered into the validity equations (Schools C, D, and E). The patterns of prediction error are reasonably similar, overall, for Schools A and B in terms of both mean signed residuals and MAE's. Although MAE's tend to be slightly, but consistently, larger for School A than for School B, all fall within about .45 to .55 grade units of error between the predicted and actual college GPA. These values of about one-half of a grade unit conform very closely to previous study findings of the magnitudes of prediction error obtained when student- or school-reported academic performance (as high school GPA) is used in combination with standardized test
7
Table 3a. Residual Values for Mean Signed Residual Error and Mean Absolute Error Indices (US GPA Schools A and B)
scores for multiple prediction of college grade achievement (Sawyer and Maxey, 1979, 1982).
Comparisons between the school- and studentreport prediction models, on the basis of MAE's in Table 3a, show minor differences overall; however, the
mean signed residuals show slight but generally larger error for the self-report model than for the schoolreport model. When comparisons by sex are considered, differences in degree of predictive accuracy appear trivial in both schools, with only a trend toward
8
slightly higher MAE's for males-a result entirely consistent with the comparative MAE findings, by sex, reported by Sawyer and Maxey (1979). Males also tend to show consistent overprediction (negative in sign) for mean signed residuals-that is, males are more likely to have achieved lower first-year college GPA scores than would be predicted from the equations. Comparative prediction errors for white and black students are the more pronounced, as seen in somewhat larger MAE's for black students and distinctly larger mean signed residuals reflecting consistent overprediction. Thus, to a comparatively greater degree than whites, black students achieve lower first-year college grades than would be predicted from the regression equations containing their high school GPA, in combination with their standardized admissions test scores.
The patterns of comparative findings for accuracy of prediction in the "class rank schools," Schools C, D, and E in Table 3b, are fairly similar to the accuracy findings for Schools A and B (in Table 3a). Thus: (1) results for prediction accuracy replicate well across the schools; (2) the school- and student-report prediction models continue to show results similar to one another; (3) sex differences remain essentially minor, with the trend toward poorer precision of prediction in the form of higher MAE's for males; and (4) MAE's for black students tend to be slightly larger than those for white students, whereas signed residuals continue to show consistent overprediction for blacks in contrast to whites. One plausible hypothesis for explaining differences in over- and underprediction for sex and race subgroups might focus on their disproportional involvement in different fields of study that may, in turn, have different effects on grading standards.
Validity of Self-Reported Grades for Separate Subject-Matter Areas
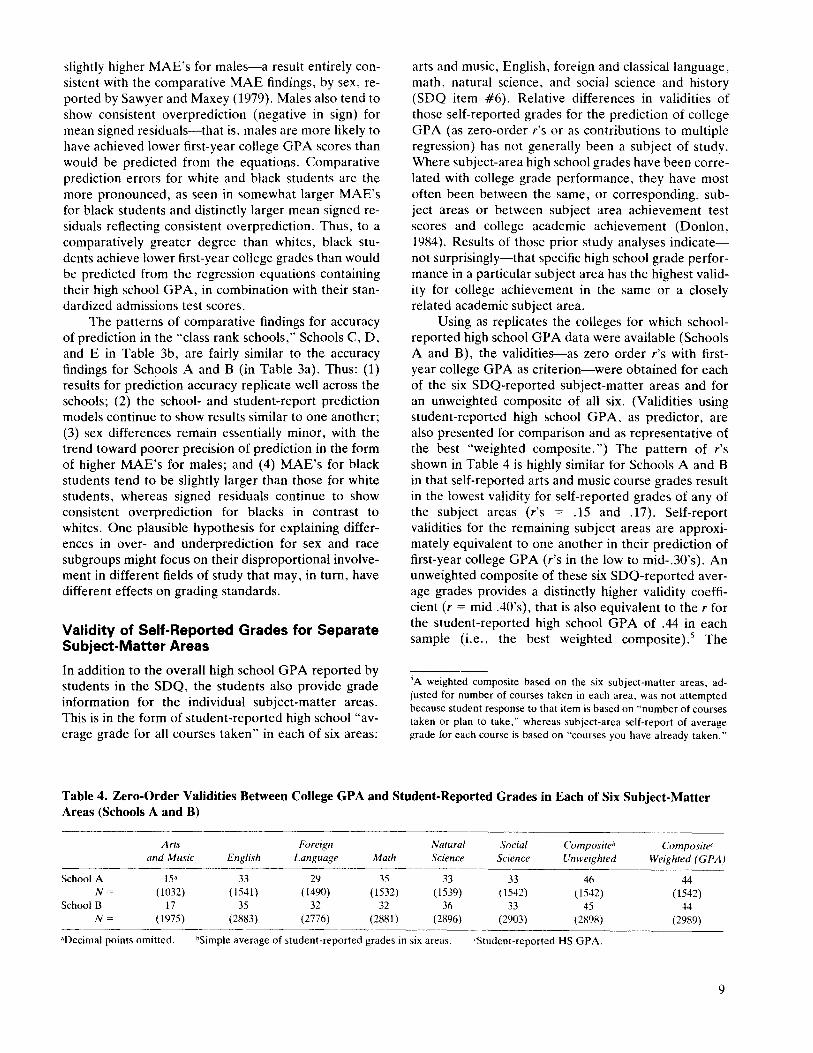
In addition to the overall high school GPA reported by students in the SDQ, the students also provide grade information for the individual subject-matter areas. This is in the form of student-reported high school "average grade for all courses taken" in each of six areas:
arts and music, English, foreign and classical language, math, natural science, and social science and history (SDQ item #6). Relative differences in validities of those self-reported grades for the prediction of college GPA (as zero-order r's or as contributions to multiple regression) has not generally been a subject of study. Where subject-area high school grades have been correlated with college grade performance, they have most often been between the same, or corresponding, subject areas or between subject area achievement test scores and college academic achievement (Donlon, 1984 ). Results of those prior study analyses indicatenot surprisingly-that specific high school grade performance in a particular subject area has the highest validity for college achievement in the same or a closely related academic subject area.
Using as replicates the colleges for which schoolreported high school GP A data were available (Schools A and B), the validities-as zero order r's with firstyear college GPA as criterion-were obtained for each of the six SDQ-reported subject-matter areas and for an unweighted composite of all six. (Validities using student-reported high school GPA, as predictor, are also presented for comparison and as representative of the best "weighted composite.") The pattern of r's shown in Table 4 is highly similar for Schools A and B in that self-reported arts and music course grades result in the lowest validity for self-reported grades of any of the subject areas (r's = .15 and .17). Self-report validities for the remaining subject areas are approximately equivalent to one another in their prediction of first-year college GPA (r's in the low to mid-.30's). An unweighted composite of these six SDQ-reported average grades provides a distinctly higher validity coefficient (r = mid .40's), that is also equivalent to the r for the student-reported high school GPA of .44 in each sample (i.e., the best weighted composite). 5 The
5 A weighted composite based on the six subject-matter areas, adjusted for number of courses taken in each area, was not attempted because student response to that item is based on "number of courses taken or plan to take," whereas subject-area self-report of average grade for each course is based on "courses you have already taken."
Table 4. Zero-Order Validities Between College GPA and Student-Reported Grades in Each of Six Subject-Matter Areas (Schools A and B)
Arts Foreign Natural Social Compositeb Composite< and Music English Language Math Science Science Unweighted Weighted (GPA)
School B 17 35 32 32 36 33 45 44 N= (1975) (2883) (2776) (2881) (2896) (2903) (2898) (2989)
•Decimal points omitted. hSimple average of student-reported grades in six areas. 'Student-reported HS GPA.
9
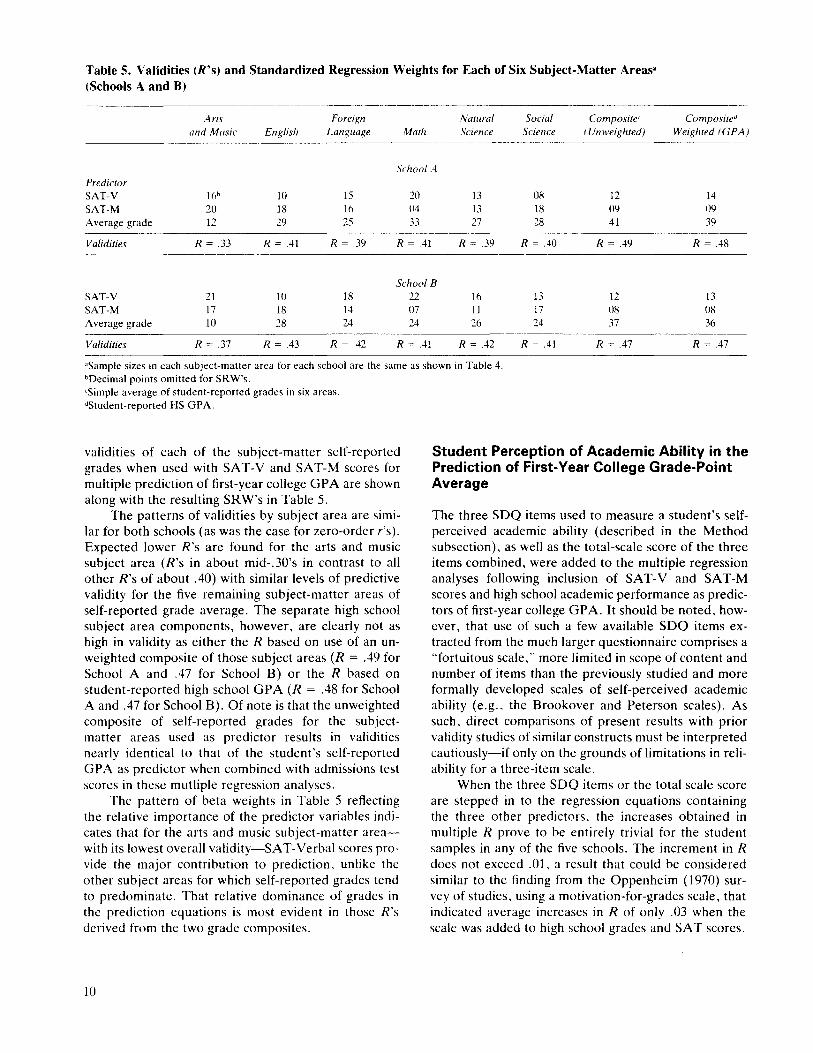
Table 5. Validities (R's) and Standardized Regression Weights for Each of Six Subject-Matter Areas• (Schools A and B)
Arts Foreign Natural Social Composite Com posited and Music English Language Math Science Science ( Unweighted) Weighced !GPA)
School A Predictor SA T-V 16b 10 15 20 13 08 12 14 SAT-M 20 18 16 04 13 18 09 09 Average grade 12 29 25 33 27 28 41 39
Validities R = .33 R = .41 R = .39 R = .41 R = .39 R = .40 R = .49 R = .48
School B SA T-V 21 10 18 22 16 13 12 13 SAT-M 17 18 14 07 11 17 08 08 Average grade 10 28 24 24 26 24 37 36
Validities R = .37 R = .43 R = .42 R = .41 R = .42 R = .41 R = .47 R = .47
•Sample sizes in each subject-matter area for each school are the same as shown in Table 4. bDecimal points omitted for SRW's. 'Simple average of student-reported grades in six areas. "Student-reported HS GPA.
validities of each of the subject-matter self-reported grades when used with SAT-V and SAT-M scores for multiple prediction of first-year college GPA are shown along with the resulting SRW's in Table 5.
The patterns of validities by subject area are similar for both schools (as was the case for zero-order r's). Expected lower R's are found for the arts and music subject area (R's in about mid-.30's in contrast to all other R's of about .40) with similar levels of predictive validity for the five remaining subject-matter areas of self-reported grade average. The separate high school subject area components, however, are clearly not as high in validity as either the R based on use of an unweighted composite of those subject areas (R = .49 for School A and .47 for School B) or the R based on student-reported high school GPA (R = .48 for School A and .47 for School B). Of note is that the unweighted composite of self-reported grades for the subjectmatter areas used as predictor results in validities nearly identical to that of the student's self-reported GPA as predictor when combined with admissions test scores in these mutliple regression analyses.
The pattern of beta weights in Table 5 reflecting the relative importance of the predictor variables indicates that for the arts and music subject-matter areawith its lowest overall validity-SAT-Verbal scores provide the major contribution to prediction, unlike the other subject areas for which self-reported grades tend to predominate. That relative dominance of grades in the prediction equations is most evident in those R's derived from the two grade composites.
10
Student Perception of Academic Ability in the Prediction of First-Year College Grade-Point Average
The three SDQ items used to measure a student's selfperceived academic ability (described in the Method subsection), as well as the total-scale score of the three items combined, were added to the multiple regression analyses following inclusion of SAT-V and SAT-M scores and high school academic performance as predictors of first-year college GPA. It should be noted, however. that use of such a few available SDQ items extracted from the much larger questionnaire comprises a "fortuitous scale," more limited in scope of content and number of items than the previously studied and more formally developed scales of self-perceived academic ability (e. g., the Brookover and Peterson scales). As such, direct comparisons of present results with prior validity studies of similar constructs must be interpreted cautiously-if only on the grounds of limitations in reliability for a three-item scale.
When the three SDQ items or the total scale score are stepped in to the regression equations containing the three other predictors, the increases obtained in multiple R prove to be entirely trivial for the student samples in any of the five schools. The increment in R does not exceed .01, a result that could be considered similar to the finding from the Oppenheim ( 1970) survey of studies, using a motivation-for-grades scale, that indicated average increases in R of only .03 when the scale was added to high school grades and SAT scores.
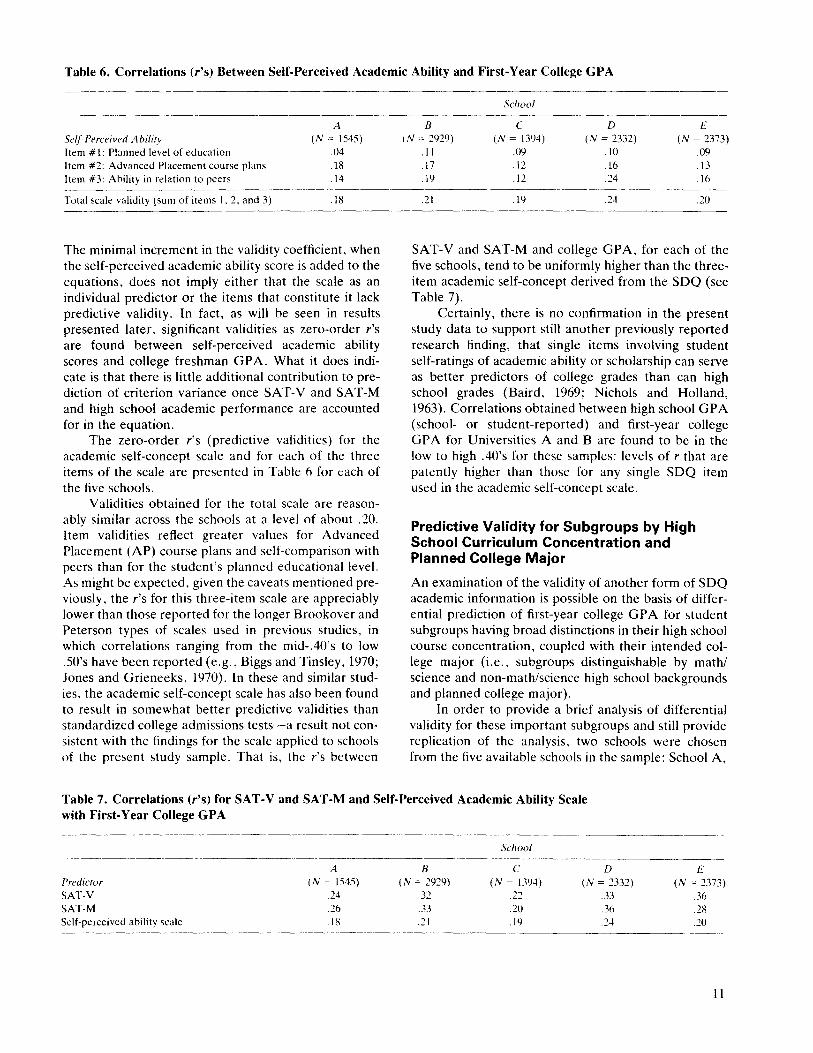
Table 6. Correlations (r's) Between Self-Perceived Academic Ability and First-Year College GPA
A Self-Perceived Ability (N = 1545) Item #1: Planned level of education .04 Item #2: Advanced Placement course plans .18 Item #3: Ability in relation to peers .14
Total scale validity (sum of items 1. 2, and 3) .18
The minimal increment in the validity coefficient, when the self-perceived academic ability score is added to the equations, does not imply either that the scale as an individual predictor or the items that constitute it lack predictive validity. In fact, as will be seen in results presented later, significant validities as zero-order r's are found between self-perceived academic ability scores and college freshman GPA. What it does indicate is that there is little additional contribution to prediction of criterion variance once SAT-V and SAT-M and high school academic performance are accounted for in the equation.
The zero-order r's (predictive validities) for the academic self-concept scale and for each of the three items of the scale are presented in Table 6 for each of the five schools.
Validities obtained for the total scale are reasonably similar across the schools at a level of about .20. Item validities reflect greater values for Advanced Placement (AP) course plans and self-comparison with peers than for the student's planned educational level. As might be expected, given the caveats mentioned previously, the r's for this three-item scale are appreciably lower than those reported for the longer Brookover and Peterson types of scales used in previous studies, in which correlations ranging from the mid-.40's to low .SO's have been reported (e.g., Biggs and Tinsley, 1970; Jones and Grieneeks, 1970). In these and similar studies, the academic self-concept scale has also been found to result in somewhat better predictive validities than standardized college admissions tests-a result not consistent with the findings for the scale applied to schools of the present study sample. That is, the r's between
School
B c D E (N = 2929) (N = 1394) (N = 2332) (N = 2373)
.11 .(19 .10 .(19
.17 .12 .16 .13
.19 .12 .24 .16
.21 .19 .24 .20
SA T-V and SAT-M and college GPA, for each of the five schools, tend to be uniformly higher than the threeitem academic self-concept derived from the SDQ (see Table 7).
Certainly, there is no confirmation in the present study data to support still another previously reported research finding, that single items involving student self-ratings of academic ability or scholarship can serve as better predictors of college grades than can high school grades (Baird, 1969; Nichols and Holland, 1963). Correlations obtained between high school GPA (school- or student-reported) and first-year college GPA for Universities A and B are found to be in the low to high .40's for these samples: levels of r that are patently higher than those for any single SDQ item used in the academic self-concept scale.
Predictive Validity for Subgroups by High School Curriculum Concentration and Planned College Major
An examination of the validity of another form of SDQ academic information is possible on the basis of differential prediction of first -year college G P A for student subgroups having broad distinctions in their high school course concentration, coupled with their intended college major (i.e., subgroups distinguishable by math/ science and non-math/science high school backgrounds and planned college major).
In order to provide a brief analysis of differential validity for these important subgroups and still provide replication of the analysis, two schools were chosen from the five available schools in the sample: School A,
Table 7. Correlations (r's) for SA T-V and SAT-M and Self-Perceived Academic Ability Scale with First-Year College GPA
School
A B c D E Predictor (N = 1545) (N = 2929) (N = 1394) (N = 2332) (N = .D73) SAT·V .24 .32 .22 .33 .36 SAT-M .26 .33 .20 .36 .28 Self-perceived ability scale .18 .21 .19 .24 .20
11
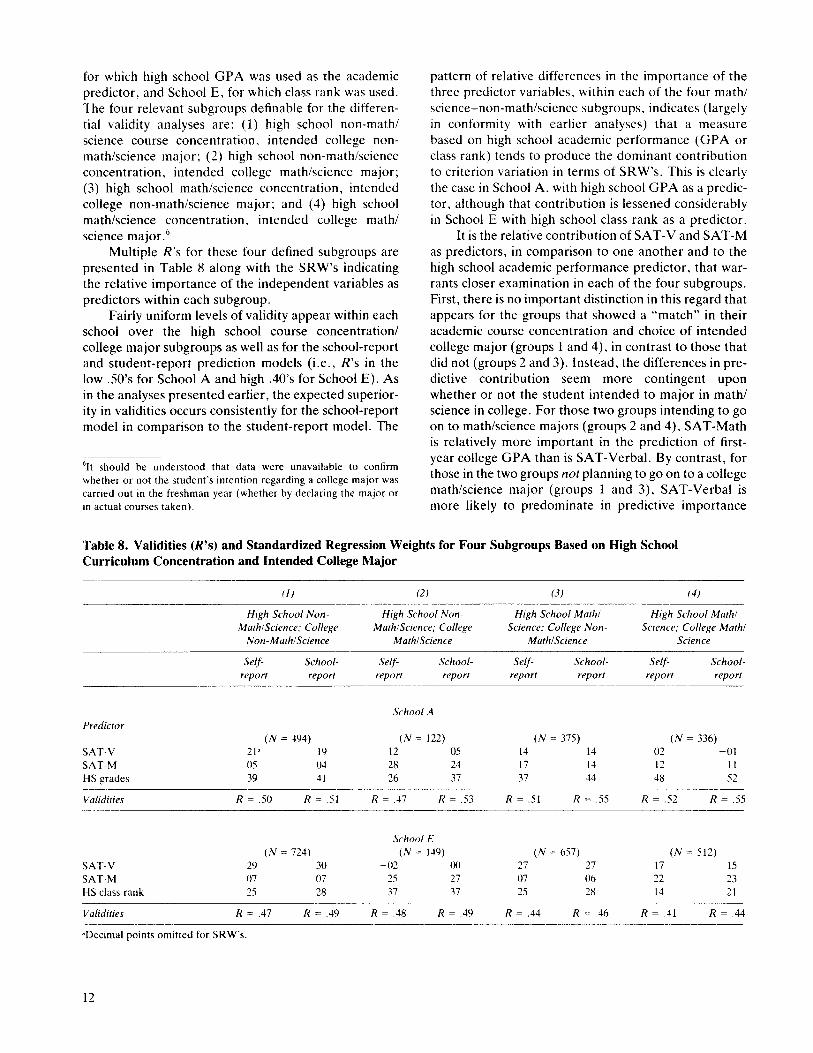
for which high school GPA was used as the academic predictor, and School E, for which class rank was used. The four relevant subgroups definable for the differential validity analyses are: (1) high school non-math/ science course concentration, intended college nonmath/science major; (2) high school non-math/science concentration, intended college math/science major; (3) high school math/science concentration, intended college non-math/science rna jor; and ( 4) high school math/science concentration, intended college math/ science major. 6
Multiple R's for these four defined subgroups are presented in Table 8 along with the SRW's indicating the relative importance of the independent variables as predictors within each subgroup.
Fairly uniform levels of validity appear within each school over the high school course concentration/ college major subgroups as well as for the school-report and student-report prediction models (i.e., R's in the low .50's for School A and high .40's for School E). As in the analyses presented earlier, the expected superiority in validities occurs consistently for the school-report model in comparison to the student-report model. The
'It should be understood that data were unavailable to confirm whether or not the studenrs intention regarding a college major was carried out in the freshman year (whether by declaring the major or in actual courses taken).
pattern of relative differences in the importance of the three predictor variables, within each of the four math/ science-non-math/science subgroups. indicates (largely in conformity with earlier analyses) that a measure based on high school academic performance (GPA or class rank) tends to produce the dominant contribution to criterion variation in terms of SRW's. This is clearly the case in School A, with high school GPA as a predictor, although that contribution is lessened considerably in School E with high school class rank as a predictor.
It is the relative contribution of SAT-V and SAT-M as predictors, in comparison to one another and to the high school academic performance predictor, that warrants closer examination in each of the four subgroups. First, there is no important distinction in this regard that appears for the groups that showed a "match" in their academic course concentration and choice of intended college major (groups 1 and 4), in contrast to those that did not (groups 2 and 3). Instead, the differences in predictive contribution seem more contingent upon whether or not the student intended to major in math/ science in college. For those two groups intending to go on to math/science majors (groups 2 and 4), SAT-Math is relatively more important in the prediction of firstyear college GPA than is SAT-Verbal. By contrast, for those in the two groups not planning to go on to a college math/science major (groups 1 and 3), SAT-Verbal is more likely to predominate in predictive importance
Table 8. Validities (R's) and Standardized Regression Weights for Four Subgroups Based on High School Curriculum Concentration and Intended College Major
Predictor
SA T-V SAT-M HS grades
Validities
SA T-V SAT-M HS class rank
Validities
{1)
High School NonMath/Science; College
Non-Math/Science
Self- School-report report
(N = 494) 21' 19 05 04 39 41
R =.50 R =.51
(N = 724) 29 30 07 07 25 28
R= .47 R = .49
•Decimal points omitted for SRW's.
12
(2)
High School NonMath/Science; College
Math/Science
Self- School-report report
School A
(N = 122) 12 05 28 24 26 37
R = .47 R =.53
School E (N = 149)
-02 ()()
25 27 37 37
R = .48 R = .49
(3)
High School Math/ Science; College Non
Math/Science
Selfreport
Schoolreport
(N = 375) 14 14 17 14 37 44
R =.51 R =.55
(N = 657) 27 27 07 06 25 28
R = .44 R = .46
(4)
High School Math/ Science; College Math/
Science
Selfreport
Schoolreport
(N = 336) 02 -01 12 11 48 52
R =.52 R =.55
(N = 512) 17 15 22 23 14 21
R = .41 R = .44
over SAT-Math. The finding is logical, based on the assumption that most of these students went on to their intended majors in college and, therefore, took a sufficient number of courses in their respective areas of intended study to affect the criterion and resulting patterns of predictor contribution.
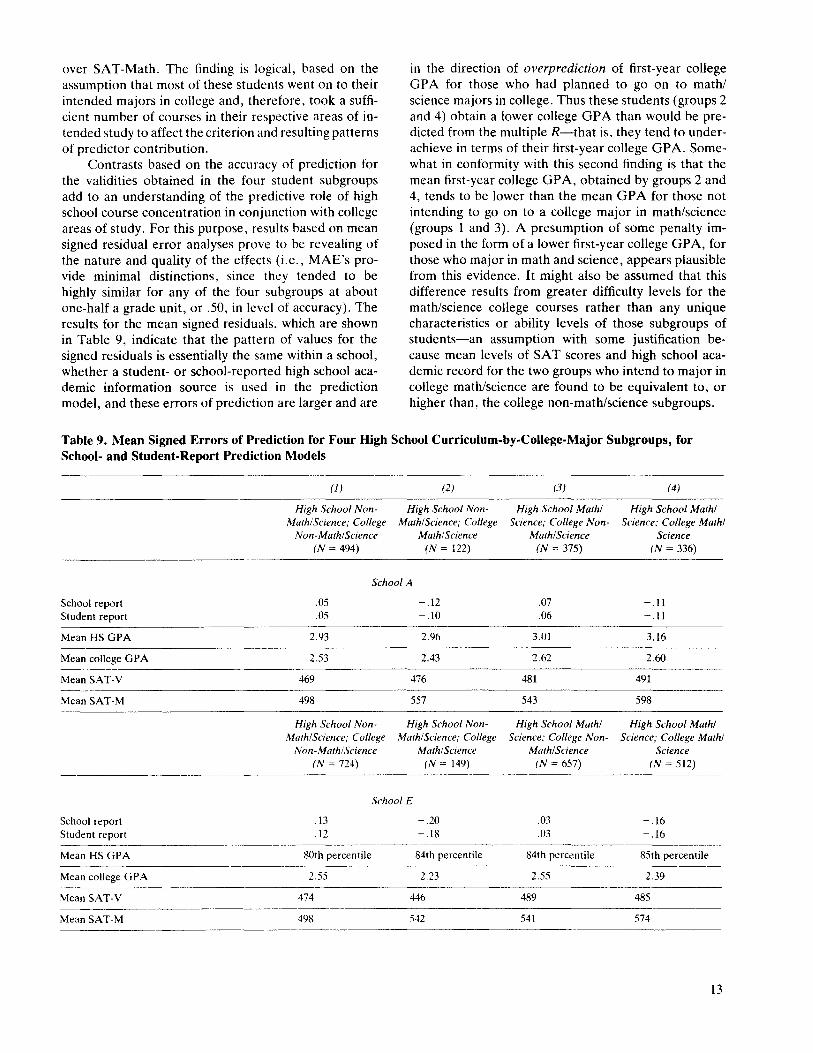
Contrasts based on the accuracy of prediction for the validities obtained in the four student subgroups add to an understanding of the predictive role of high school course concentration in conjunction with college areas of study. For this purpose, results based on mean signed residual error analyses prove to be revealing of the nature and quality of the effects (i.e., MAE's provide minimal distinctions, since they tended to be highly similar for any of the four subgroups at about one-half a grade unit, or .50, in level of accuracy). The results for the mean signed residuals, which are shown in Table 9, indicate that the pattern of values for the signed residuals is essentially the same within a school, whether a student- or school-reported high school academic information source is used in the prediction model, and these errors of prediction are larger and are
in the direction of overprediction of first-year college GPA for those who had planned to go on to math/ science majors in college. Thus these students (groups 2 and 4) obtain a lower college GPA than would be predicted from the multiple R-that is, they tend to underachieve in terms of their first-year college GP A. Somewhat in conformity with this second finding is that the mean first-year college GPA, obtained by groups 2 and 4, tends to be lower than the mean GPA for those not intending to go on to a college major in math/science (groups 1 and 3). A presumption of some penalty imposed in the form of a lower first-year college GPA, for those who major in math and science, appears plausible from this evidence. It might also be assumed that this difference results from greater difficulty levels for the math/science college courses rather than any unique characteristics or ability levels of those subgroups of students-an assumption with some justification because mean levels of SAT scores and high school academic record for the two groups who intend to major in college math/science are found to be equivalent to, or higher than, the college non-math/science subgroups.
Table 9. Mean Signed Errors of Prediction for Four High School Curriculum-by-College-Major Subgroups, for School- and Student-Report Prediction Models
School report Student report
Mean HS GPA
Mean college GPA
Mean SA T-V
Mean SAT-M
School report Student report
Mean HS GPA
Mean college GPA
Mean SA T-V
Mean SAT-M
(1) (2)
High School Non- High School Non-Math/Science; College Math/Science; College
Non-Math/Science Math/Science (N = 494) (N = 122)
School A
.05 -.12
.05 -.10
2.93 2.96
2.53 2.43
469 476
498 557
High School Non- High School Non-Math/Science; College Math/Science; College
Non-Math/Science M athl Science (N = 724) (N = 149)
School E
.13 -.20
.12 -.18
80th percentile 84th percentile
2.55 2.23
474 446
498 542
(3) (4)
High School Math/ High School Math/ Science; College Non- Science; College Math/
Math/Science Science (N = 375) (N = 336)
.07 -.11
.06 -.11
3.01 3.16
2.62 2.60
481 491
543 598
High School Math/ High School Math/ Science; College Non- Science; College Math/
M athl Science Science (N = 657) (N = 512)
.03 -.16
.03 -.16
84th percentile 85th percentile
2.55 2.39
489 485
541 574
13
SUMMARY AND CONCLUSIONS
This examination of the validity of academic self-report information, contained in the revised (1985-86) version of the SDQ, permitted both specific and general comparisons of study results obtained with the earlier version of this questionnaire and with other similar student self-report instruments. In addition, several aspects of validity were explored using approaches that might add to a better understanding of the role of the academic predictors and their value in conventional prediction models.
From the study findings it is evident that predictive validity for academic information from the revised SDQ generally conforms to earlier study results with the original SDQ, as well as other similar self-report instruments used with college applicants. This is seen in correlations with first-year college GPA for selfreported high school academic performance that are consistent with earlier findings-that is, Pearson's r's largely in the mid- to high .40's-and validities for school-reported academic high school record (grades or class rank) uniformly higher than the same information based on student report. That predictive superiority of school-reported academic information over studentreported information applies equally to multiple regression equations when those high school academic predictors are incorporated in separate prediction models. Validities (R's) obtained with the school-reported data in the model generally produced an increment of about .03 over that of the student-reported data. The results held fairly consistently for comparisons by sex, although they varied somewhat by racial subgroup (black and white students) and across the five schools that constituted the study samples.
The multiple regression analyses also provided an opportunity to examine differences in the relative contribution of the several predictor variables used in those validity models (i.e., high school record along with SAT-Verbal and Math scores). Although patterns of predictor contribution were broadly similar across schools for equations based on school- and studentreport of high school academic record, there were differences of note: (1) in the importance of the predictor variables relative to one another, (2) in the different patterns of that relative importance for racial subgroups, and (3) in the different role high school GPA and class rank play in the prediction equations. Specifically, the high school G P A predictor, for sex and race subgroups, proves to be of major importance in its contribution to the prediction of first -year college G P A, regardless of school, whereas high school rank is less dominant in that respect and more a function of the particular university sampled. Sex differences are fairly minor for the patterns of predictor contribution to multiple R within a given school. However, where slight dif-
14
ferences exist, the tendency is for SAT-Verbal to show a relatively larger contribution for females than for males. Contrasts based on race show a proportionally larger contribution of at least one of the two SAT scores-almost equivalent to that of high school rank or GPA-for black students in contrast to whites. This was characteristic of all schools sampled and whether the high school record was based on student-reported or school-reported data.
The quality, or precision, of prediction of the multiple regression validity coefficients was also examined on the basis of several indices: the mean absolute error or MAE (degree of prediction error regardless of sign), and mean signed residual error (prediction error taking direction into account). Results with these indices generally conform to results obtained in other studies in regard to the size of the MAE's (between .45 and .55 or about one-half of a G P A unit as the error of prediction) as well as their trend toward slightly larger magnitudes of error for males and for black students. Consistent differences in the signed residual errors occur primarily on the basis of race, such that the black students show a pattern of greater overprediction (i.e., they underachieve in terms of expected first-year college GPA based on R's obtained using SAT scores and high school academic record as predictors).
A more detailed appreciation of the predictive value of self-reported high school academic performance was attempted using those components that go into making up the student's self-reported high school GPA as a single index-that is, the individual high school subject-matter grades. For that purpose, validities of grade averages for each of six primary subject areas reported by students in the SDQ were computed as zero-order r's and were also incorporated in multiple regression analyses. Using separate (replicated) analyses for each of two universities in the sample, the high school grade average for the arts and music subject area produced the lowest validities-as zero-order r or multiple R-with the first-year college GPA criterion, whereas the five remaining subject-matter areas (foreign language, English, math, natural science, and social science) resulted in higher validities that were virtually the same as one another. An unweighted composite of the grades derived from the individual self-reported subjectmatter areas, when used as a predictor, results (as it logically should if the student self-reports are accurate) in an almost identical validity coefficient as that obtained with the students' self-report of the single high school GPA.
In an analysis of student academic self-concept as a predictor of college G P A, some validity was evident at modest levels (r = .20) for a short three-item scale derivable from the SDQ. However, the magnitudes of the validities for the scale, or its individual items, when contrasted with other predictors such as school grades
or admissions test scores--or when incorporated in a multiple prediction equation-are not impressive. Nor do the results obtained conform closely to prior research that has suggested greater predictive value for the academic self-report construct. A larger number of items available in the SDQ that might be used to form a more coherent and reliable scale would probably be required in order to achieve results comparable to earlier findings using longer, more formally developed, scales.
An assessment of predictive validity, based on student self-report of high school academic curriculum background in conjunction with future intention for college academic major, was undertaken briefly as a form of differential validation. Students whose high school academic focus was in math and science, who also planned to go on to math/science majors in college, might be expected to produce patterns of validities with contributions of predictor variables that arc quite different from students who have non-math/science high school curriculum backgrounds and plan non-math/ science college majors. And both groups, in turn, may differ in their validities from those who change from one academic focus in high school to another in college. The underlying assumption is that differential effects on both the predictors and the criterion for such subgroups may be produced by the differences in difficulty usually ascribed to math/science and non-math/science courses in high school and college.
Differences in predictor contribution to multiple regression validities and precision of prediction were found as a reflection of differences in course concentration and major field. Those who planned to (and presumably did in a majority of instances) go on to college math and science majors showed a proportionally larger predictive contribution of SAT-Math scores relative to high school academic record. This is unlike the result customarily shown for prediction equations wherein high school record, in undifferentiated curriculum samples (as seen in the other phases of this study), tends to predominate to a much greater extent. A logical corollary finding appeared for those who do not plan to go on to college math and science, in that SATVerbal performance was relatively more dominant as a predictor for those students. Even more revealing of the meaning of the differences was the precision of prediction shown on the basis of mean signed residual errors. Those students who planned to go on to college majors in math/science (regardless of whether their high-school curriculum focus had been in math/science or non-math/science) showed consistent overprediction, such that they obtained lower first-year college G P A's than would be predicted from their SAT-V, SAT-M, and high school record. This despite their equivalent or superior performance on these three predictors compared to the performances of those who did
not plan to go on to math/science majors in college (the latter groups showing slight but consistent underprediction). A reasonable presumption might be made of greater difficulty in math and science courses in college resulting in lower-than-predicted grades for those who major in those subjects.
REFERENCES
American College Testing Program. 1971. Your College Freshmen. Iowa City, Iowa: Author.
American College Testing Program. 1973. Assessing Students on the Way to College. Iowa City, Iowa: Author.
Baird, L.L. 1969. "Predicting Grades in Occupational and Academic Curricula in Two-Year Colleges," Journal of Educational Measurement, 6, 247-254.
Baird, L.L. 1976. Using Self-Reports to Predict Student Performance (Research Monograph 7). New York: College Entrance Examination Board.
Biggs, D.A., and D.J. Tinsley. 1970. "Student-made Academic Predictions," Journal of Educational Research, 63, 195-197.
Boldt. R.F. 1986. Generalization of SAT Validity across Colleges (College Board Report No. 86-3 and ETS RR No. 86-24). New York: College Entrance Examination Board.
Brookover, W.B. 1962. Self-Concept of Ability and School Achievement I (Cooperative Research Project No. 845). East Lansing, Michigan: Michigan State University, Office of Research and Publications.
Cole, N.S. 1%9. Differential Validity in the ACT Tests (ACT Research Report No. 30). Iowa City, Iowa: The American College Testing Program.
College Board. 1985. Registration Bulletin I985-86: SAT and Achievement Tests (Midwestern Edition). New York: College Entrance Examination Board.
Donlon, T.F. ed. 1984. The College Board Technical Handbook for the Scholastic Aptitude and Achievement Tests. New York: College Entrance Examination Board.
Freeberg, N.E. 1988. Analysis of the Revised Student Descriptive Questionnaire, Phase I: Accuracy of Student SelfReported Information (College Board Report No. 88-5). New York: College Entrance Examination Board.
Furst, E.J. 1966. "Validity of Some Objective Scales of Motivation for Predicting Academic Achievement," Educational and Psychological Measurement, 26, 927-933.
Ghiselli, E.E. 1960. "The Prediction of Predictability," Educational and Psychological Measurement, 20, 3-8.
Holland, J.L., and S.W. Lutz. 1968. "The Predictive Value of a Student's Choice of Vocation," Personnel and Guidance Journal, 46, 428-434.
Hoyt, D.P., and L.A. Munday. 1968. Your College Freshmen. Iowa City, Iowa: The American College Testing Program.
Jones, J.G., and L. Grieneeks. 1970. "Measures of SelfPerception as Predictors of Scholastic Achievement," Journal of Educational Research, 63, 201-203.
Klein, S.P., D.A. Rock, and F.R. Evans. 1968. "The Use of Multiple Moderators in Academic Prediction,'' Journal of Educational Measurement, 5, 151-160.
Lindsay, C.A., and R. Althouse. 1969. "Comparative
15
Validities of the Strong Vocational Interest Blank Academic Achievement Scale and the College Student Questionnaire Motivation for Grades Scale," Educational and Psychological Measurement, 29, 489-493.
Lunneborg, C.E. 1966. "A Research Review of the Washington Pre-College Testing Program, Journal of Educational Measurement, 3, 157-166.
Lunneborg, C.E. 1968. "Biographic Variables in Differential vs. Absolute Prediction," Journal of Educational Measurement, 5, 207-210.
Lunneborg, C.E., and P.W. Lunneborg. 1969. "Architecture School Performance Predicted from ASAT, Intellective and Nonintellective Measures," Journal of Applied Psychology, 53, 209-213.
Lunneborg, P.W., and C.E. Lunneborg. 1966. "The Differential Prediction of College Grades from Biographical Information," Educational and Psychological Measurement, 26, 917-925.
Maxey, E.J. 1972. A Comparison of Student-Reported and School-Reported Grades in Predicting College GPA. Unpublished manuscript. Iowa City, Iowa: American College Testing Program.
Nichols, R.C., and J.L. Holland. 1963. "Prediction of the First-Year College Performance of High-Aptitude Students," Psychological Monographs, 77, No.7, whole number 570.
Norris, L., and M. Katz. 1970. The Measurement of Academic Interests. Part II: The Predictive Validities of Academic In-
16
terest Measures (ETS Research Bulletin No. 70-67). Princeton, New Jersey: Educational Testing Service.
Oppenheim, D. 1970. Summary of Studies Using the Motivation for Grades Scale (Program Report). Princeton, New Jersey: Educational Testing Service.
Richards, J.M., Jr.. J.L. Holland, and S.W. Lutz. 1967. "Prediction of Student Accomplishment in College," Journal of Educational Psychology, 58, 343-355.
Richards, J.M., Jr., and S.W. Lutz. 1968. Predicting Student Accomplishment in College from the ACT Assessment," Journal of Educational Measurement, 5, 17-29.
Rock, D.A. 1965. Improving the Prediction of Academic Achievement by Population Moderators. Unpublished doctoral dissertation, Purdue University.
Sawyer, R., and R. Maxey. 1979. The Validity over Time of College Freshman Grade Prediction Equations (ACT Research Report No. 80). Iowa City, Iowa: The American College Testing Program.
Sawyer, R., and R. Maxey. 1982, January. The Relationship Between College Freshman Class Size and Other Institutional Characteristics and the Accuracy of Freshman Grade Predictions (ACT Research Report No. 82). Iowa City, Iowa: American College Testing Program.
Sproull, K.H. 1969. The Relation Between High School SelfConcept of Academic Ability and Subsequent Academic Achievement in the Community College. Unpublished doctoral dissertation, Michigan State University.