Topical Fire Report Series June 2017 | Volume 18, Issue 1 Residential Building Fires (2013-2015) These topical reports are designed to explore facets of the U.S. fire problem as depicted through data collected in the U.S. Fire Administration’s National Fire Incident Reporting System. Each topical report briefly addresses the nature of the specific fire or fire-related topic, highlights important findings from the data, and may suggest other resources to consider for further information. Also included are recent examples of fire incidents that demonstrate some of the issues addressed in the report or that put the report topic in context. Findings ĵ Each year, an estimated 380,200 residential building fires were reported to fire departments within the United States from 2013 to 2015. These fires caused an estimated 2,695 deaths; 12,000 injuries; and $7 billion in property loss. ĵ At 50 percent, cooking was the leading cause of residential building fires. Nearly all (90 percent) residential building cooking fires were small, confined fires. ĵ Residential building fire incidence was higher in the cooler months, peaking in January at 11 percent. ĵ Residential building fires occurred most frequently in the early evening, peaking during the dinner hours from 5 to 8 p.m., when cooking fire incidence is high. ĵ Nonconfined residential building fires most often started in cooking areas and kitchens (21 percent). ĵ In 49 percent of nonconfined residential building fires, the fire extended beyond the room of origin. The leading causes of these larger fires were unintentional or careless actions (17 percent), electrical malfunctions (14 percent), open flames (11 percent), and intentional actions (10 percent). ĵ The leading reported factor contributing to ignition category was misuse of material or product (38 percent). ĵ Smoke alarms were not present in 22 percent of nonconfined fires in occupied residential buildings. This is a high percentage when compared to the 3 percent of households lacking smoke alarms nationally. Additionally, automatic extinguishing systems (AESs) were present in only 4 percent of nonconfined fires in occupied residential buildings. Each year, from 2013 to 2015, fire departments responded to an estimated 380,200 fires in residential buildings across the nation. 1,2 These fires resulted in an annual average of 2,695 deaths; 12,000 injuries; and $7 billion in property loss. The residential building portion of the fire problem is of great national importance, as it accounts for the vast majority of civilian casualties. National estimates for 2013 to 2015 show that 83 percent of all fire deaths and 76 percent of all fire injuries occurred in residential buildings. In addition, residential building fires accounted for over half (56 percent) of the total dollar loss from all fires. 3 The term “residential buildings” includes what are commonly referred to as “homes,” whether they are one- or two-family dwellings or multifamily buildings. It also includes manufactured housing, hotels and motels, residential hotels, dormitories, assisted living facilities, and halfway houses — residences for formerly institutionalized individuals (patients with mental disabilities, drug addictions, or those formerly incarcerated) that are designed to facilitate their readjustment to private life. The term “residential buildings” does not include institutions, such as prisons, nursing homes, juvenile care facilities, or hospitals, even though people may reside in these facilities for short or long periods of time. National Fire Data Center 16825 S. Seton Ave. Emmitsburg, MD 21727 https://www.usfa.fema.gov/data/statistics/
Transcript
Topical Fire Report Series June 2017 | Volume 18, Issue 1
Residential Building Fires (2013-2015)
These topical reports are designed to explore facets of the U.S. fire problem as depicted through data collected in the U.S. Fire Administration’s National Fire Incident Reporting System. Each topical report briefly addresses the nature of the specific fire or fire-related topic, highlights important findings from the data, and may suggest other resources to consider for further information. Also included are recent examples of fire incidents that demonstrate some of the issues addressed in the report or that put the report topic in context.
Findingsĵ Each year, an estimated 380,200 residential building fires were reported to fire
departments within the United States from 2013 to 2015. These fires caused an estimated 2,695 deaths; 12,000 injuries; and $7 billion in property loss.
ĵ At 50 percent, cooking was the leading cause of residential building fires. Nearly all (90 percent) residential building cooking fires were small, confined fires.
ĵ Residential building fire incidence was higher in the cooler months, peaking in January at 11 percent.
ĵ Residential building fires occurred most frequently in the early evening, peaking during the dinner hours from 5 to 8 p.m., when cooking fire incidence is high.
ĵ Nonconfined residential building fires most often started in cooking areas and kitchens (21 percent).
ĵ In 49 percent of nonconfined residential building fires, the fire extended beyond the room of origin. The leading causes of these larger fires were unintentional or careless actions (17 percent), electrical malfunctions (14 percent), open flames (11 percent), and intentional actions (10 percent).
ĵ The leading reported factor contributing to ignition category was misuse of material or product (38 percent).
ĵ Smoke alarms were not present in 22 percent of nonconfined fires in occupied residential buildings. This is a high percentage when compared to the 3 percent of households lacking smoke alarms nationally. Additionally, automatic extinguishing systems (AESs) were present in only 4 percent of nonconfined fires in occupied residential buildings.
Each year, from 2013 to 2015, fire departments responded to an estimated 380,200 fires in residential buildings across the nation.1,2 These fires resulted in an annual average of 2,695 deaths; 12,000 injuries; and $7 billion in property loss.
The residential building portion of the fire problem is of great national importance, as it accounts for the vast majority of civilian casualties. National estimates for 2013 to 2015 show that 83 percent of all fire deaths and 76 percent of all fire injuries occurred in residential buildings. In addition, residential building fires accounted for over half (56 percent) of the total dollar loss from all fires.3
The term “residential buildings” includes what are commonly referred to as “homes,” whether they are one- or two-family dwellings or multifamily buildings. It also includes manufactured housing, hotels and motels, residential hotels, dormitories, assisted living facilities, and halfway houses — residences for formerly institutionalized individuals (patients with mental disabilities, drug addictions, or those formerly incarcerated) that are designed to facilitate their readjustment to private life. The term “residential buildings” does not include institutions, such as prisons, nursing homes, juvenile care facilities, or hospitals, even though people may reside in these facilities for short or long periods of time.
National Fire Data Center16825 S. Seton Ave.Emmitsburg, MD 21727https://www.usfa.fema.gov/data/statistics/
TFRS Volume 18, Issue 1 | Residential Building Fires (2013-2015)
2
As part of a series of topical reports that address fires in types of residential buildings, this report addresses the characteristics of all residential building fires, as reported to the National Fire Incident Reporting System (NFIRS). The focus is on fires reported from 2013 to 2015, the most recent data available at the time of the analysis.4 NFIRS data is used for the analyses throughout this report.
For the purpose of this report, the term “residential fires” is synonymous with “residential building fires.” “Residential fires” is used throughout the body of this report; the findings, tables, charts, headings and endnotes reflect the full category “residential building fires.”
Type of fireBuilding fires are divided into two classes of severity in the NFIRS: “confined fires,” which are fires confined to certain types of equipment or objects, and “nonconfined fires,” which are fires that are not confined to certain types of equipment or objects. Confined building fires are small fire incidents that are limited in extent, staying within pots, fireplaces or certain other noncombustible containers.5 Confined fires rarely result in serious injury or large content loss and are expected to have no significant accompanying property loss due to flame damage.6
Of the two classes of severity, nonconfined fires accounted for 50 percent of residential fires. The smaller, confined fires accounted for the remaining 50 percent of residential fires. Cooking fires were the predominant type of confined fires in residential buildings (Table 1).
Table 1. Residential building fires by type of incident (2013-2015)
Incident type PercentNonconfined fires 49.6Confined fires 50.4
Cooking fire, confined to container 37.8Chimney or flue fire, confined to chimney or flue 5.3Incinerator overload or malfunction, fire confined 0.2Fuel burner/boiler malfunction, fire confined 2.3Commercial compactor fire, confined to rubbish 0.2Trash or rubbish fire, contained 4.6
Total 100.0Source: NFIRS 5.0.
Loss measuresTable 2 presents losses, averaged over the three-year period from 2013 to 2015, of reported residential and nonresidential building fires.7 The average number of fatalities and injuries per 1,000 residential fires was notably higher than the same loss measures for nonresidential building fires.
Table 2. Loss measures for residential and nonresidential building fires (three-year average, 2013-2015)
TFRS Volume 18, Issue 1 | Residential Building Fires (2013-2015)
3
Property useFigure 1 presents the percentage distribution of fire losses by property use (i.e., one- and two-family residential buildings, multifamily residential buildings, and other residential buildings).8 Consistent with the fact that the majority of residential fires took place in one- and two-family residential buildings (64 percent), the percentages of fatalities (81 percent), injuries (63 percent) and dollar loss (75 percent) were also highest in these types of residences.
One explanation for the higher percentages of fires and subsequent losses in one- and two-family dwellings may be that more stringent building and fire codes, which require detection and suppression systems, as well as regular fire inspections, are imposed on multifamily dwellings and other residential buildings. In addition, multifamily dwellings and other residential buildings may be professionally maintained more often.
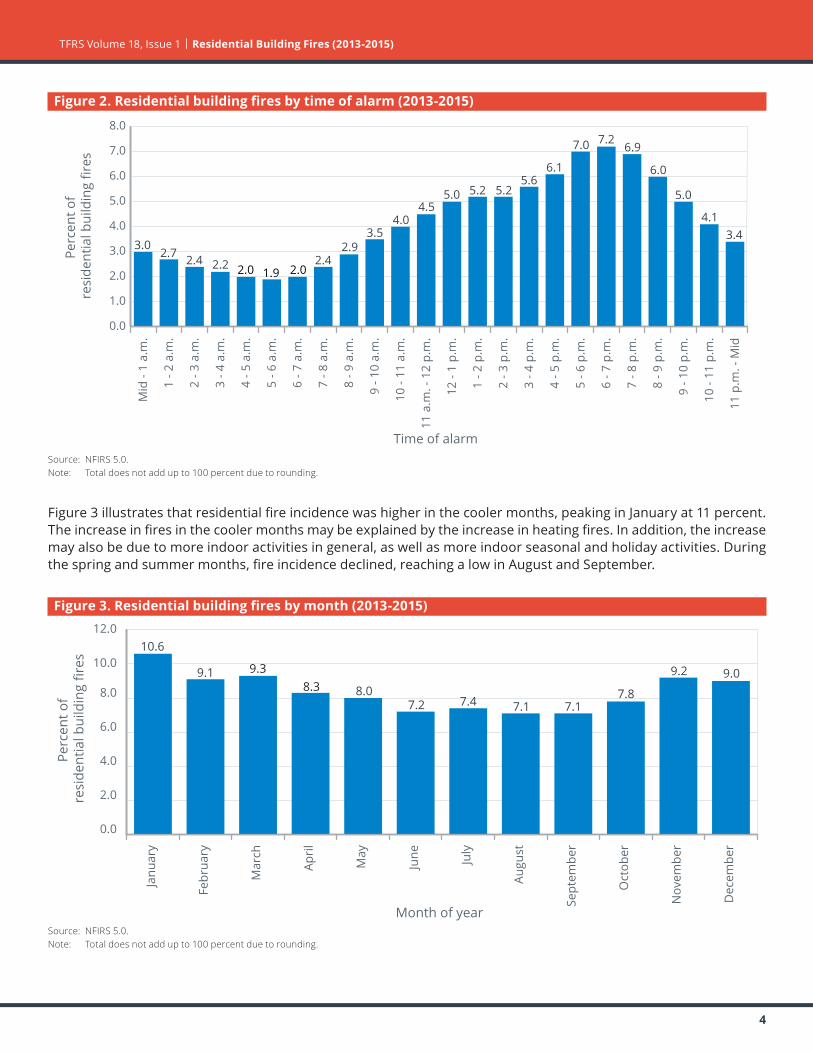
When residential building fires occurAs shown in Figure 2, residential fires occurred most frequently in the early evening, peaking during the dinner hours from 5 to 8 p.m., when cooking fire incidence is high.9,10 Cooking fires, discussed next in the “Causes of Residential Building Fires” section, accounted for 50 percent of residential fires. Fires then declined throughout the night, reaching the lowest point during the early to midmorning hours (4 to 7 a.m.).
TFRS Volume 18, Issue 1 | Residential Building Fires (2013-2015)
4
Figure 2. Residential building fires by time of alarm (2013-2015)
0.0
1.0
2.0
3.0
4.0
5.0
6.0
7.0
8.0
11 p
.m. -
Mid
10 -
11 p
.m.
9 - 1
0 p.
m.
8 - 9
p.m
.
7 - 8
p.m
.
6 - 7
p.m
.
5 - 6
p.m
.
4 - 5
p.m
.
3 - 4
p.m
.
2 - 3
p.m
.
1 - 2
p.m
.
12 -
1 p.
m.
11 a
.m. -
12
p.m
.
10 -
11 a
.m.
9 - 1
0 a.
m.
8 - 9
a.m
.
7 - 8
a.m
.
6 - 7
a.m
.
5 - 6
a.m
.
4 - 5
a.m
.
3 - 4
a.m
.
2 - 3
a.m
.
1 - 2
a.m
.
Mid
- 1
a.m
.
3.02.7 2.4 2.4
2.93.5
4.04.5
5.0 5.2 5.25.6
6.1
7.0 7.26.9
6.0
5.0
4.13.4
2.2 2.0 1.9 2.0
Perc
ent o
f re
side
ntia
l bui
ldin
g fir
es
Time of alarmSource: NFIRS 5.0.Note: Total does not add up to 100 percent due to rounding.
Figure 3 illustrates that residential fire incidence was higher in the cooler months, peaking in January at 11 percent. The increase in fires in the cooler months may be explained by the increase in heating fires. In addition, the increase may also be due to more indoor activities in general, as well as more indoor seasonal and holiday activities. During the spring and summer months, fire incidence declined, reaching a low in August and September.
Figure 3. Residential building fires by month (2013-2015)
0.0
2.0
4.0
6.0
8.0
10.0
12.0
Dec
embe
r
Nov
embe
r
Oct
ober
Sept
embe
r
Augu
st
July
June
May
Apri
l
Mar
ch
Febr
uary
Janu
ary
10.6
9.18.0
7.2 7.4 7.1 7.17.8
9.2 9.09.38.3
Perc
ent o
f re
side
ntia
l bui
ldin
g fir
es
Month of yearSource: NFIRS 5.0.Note: Total does not add up to 100 percent due to rounding.
TFRS Volume 18, Issue 1 | Residential Building Fires (2013-2015)
5
Causes of residential building firesCooking was the leading cause and accounted for 50 percent of all residential fires, as shown in Figure 4.11 Nearly all of these cooking fires (90 percent) were small, confined fires with limited damage.
The next three causes combined accounted for nearly one quarter of residential fires: fires caused by heating (12 percent); electrical malfunctions, such as short circuits and wiring problems (6 percent); and other unintentional or careless actions, a miscellaneous group (6 percent).12
Figure 4. Causes of residential building fires (2013-2015)
However, when looking at the different types of property use (i.e., one- and two-family, multifamily, and other residential buildings), there are striking differences in the prevalence of cooking as a fire cause. Cooking accounted for 74 percent of multifamily residential building fires and 58 percent of other residential building fires, but only 37 percent of one- and two-family building fires. The most persuasive explanation for this difference may be that the smaller confined fires in one- and two-family dwellings are not reported as often to fire departments. They are small and contained, and they do not cause much damage. In addition, only the residents hear the smoke alarm if it is activated. However, these same confined fires in multifamily residences may be reported — if someone else in the
TFRS Volume 18, Issue 1 | Residential Building Fires (2013-2015)
6
complex hears the alarm or smells the fire. Alternatively, if it is a newer complex, the alarms are connected to the building alarm system, and the fire department may be called automatically.
Heating and electrical malfunctions played a larger role in one- and two-family fires than in multifamily fires. One reason for this may be that many one- and two-family residential buildings have fireplaces, chimneys and fireplace-related equipment that most other types of residential properties do not have.13 This heating equipment difference may also be the explanation for the increase in confined chimney and flue fires (a component of heating fires) seen in one- and two-family fires (8 percent) as compared to multifamily fires (less than 1 percent).
Fire spread in residential building firesAs shown in Figure 5, 56 percent of residential fires were limited to the object of origin. Included in these fires were those coded as “confined fires” in the NFIRS. In addition, 25 percent of fires extended beyond the room of origin.
Figure 5. Extent of fire spread in residential building fires (2013-2015)
8.3
Fire
spr
ead
Percent of residential building fires0.0 10.0 20.0 30.0 40.0 50.0 60.0 70.0
Beyond building of origin
Limited to building of origin
Limited to floor of origin
Limited to room of origin
Limited to object of origin 55.7
19.7
4.8
16.9
2.9
Source: NFIRS 5.0.
Confined firesThe NFIRS allows abbreviated reporting for confined fires, and many reporting details of these fires are not required, nor are they reported. (Not all fires confined to the object of origin are counted as confined fires.)14 As previously discussed, however, it is known that confined fires accounted for 50 percent of all residential fires. Confined cooking fires — those cooking fires confined to a pot or the oven, for example — accounted for the majority of these confined fires (Table 1).
In addition, the number of confined residential fires was greatest from 5 to 8 p.m. These fires accounted for 61 percent of all residential fires occurring in this time period. Moreover, confined cooking fires accounted for 78 percent of the confined fires and 48 percent of all fires in residential buildings that occurred between 5 and 8 p.m.
Confined residential fires peaked in January, then steadily declined until reaching the lowest incidences in June, July and August.
Nonconfined firesThe next sections of this topical report address nonconfined residential fires — the larger and more serious fires — where more detailed fire data are available, as they are required to be reported in the NFIRS.
TFRS Volume 18, Issue 1 | Residential Building Fires (2013-2015)
7
CausesofnonconfinedresidentialbuildingfiresWhile cooking was the leading cause of residential fires overall, it only accounted for 12 percent of all nonconfined residential fires. At 14 percent, electrical malfunction was the leading cause of nonconfined residential fires. The second leading cause of these fires was carelessness or other unintentional actions at 13 percent (Figure 6).
Figure 6. Causes of nonconfined residential building fires (2013-2015)
Caus
es
Percent of nonconfined residential building fires0.0 5.0 10.0 15.0 20.0 25.0 30.0 35.0
Unknown
Cause under investigation
Other unintentional, careless
Equipment misoperation, failure
Exposure
Natural
Other equipment
Other heat
Open flame
Appliances
Electrical malfunction
Cooking
Heating
Smoking
Playing with heat source
IntentionalPercent of nonconfined residential building fires with cause determinedPercent of all nonconfined residential building fires
Wherenonconfinedresidentialbuildingfiresstart(areaoffireorigin)Nonconfined residential fires most often started in cooking areas and kitchens (21 percent), as shown in Table 3. Bedrooms (13 percent) and family rooms or living rooms (7 percent) were the next most common areas of fire origin in the home. Smaller but not minor percentages of fires started in vacant spaces and attics (5 percent), laundry areas (5 percent), and exterior wall surfaces (5 percent). Also of interest, 4 percent of nonconfined residential fires started in garages and carports.
Note that these areas of origin do not include areas associated with confined fires. Cooking was the leading cause of all residential fires at 50 percent, and it is not surprising that kitchens were the leading area of fire origin. The percentages were not identical between cooking and kitchen fires because some cooking fires started outside the kitchen, some areas of origin for cooking fires were not reported (as is the case in most confined cooking fires), and some kitchen fires did not start due to cooking. In fact, only 50 percent of nonconfined residential fires that started in the kitchen were cooking fires. Other unintentional or careless actions accounted for 12 percent, appliances (such as freezers and refrigerators) accounted for 9 percent, and heat from other sources (such as flames/torches or hot materials) accounted for an additional 7 percent of kitchen fires.
TFRS Volume 18, Issue 1 | Residential Building Fires (2013-2015)
8
Table 3. Leading areas of fire origin in nonconfined residential building fires (2013-2015)
Areas of fire origin Percent (unknowns apportioned)
Cooking area, kitchen 21.0Bedrooms 12.5Common room, den, family room, living room, lounge 6.5
Source: NFIRS 5.0.
Hownonconfinedresidentialbuildingfiresstart(heatsource)Figure 7 shows sources of heat categories for nonconfined residential fires. Heat from powered equipment accounted for 48 percent of nonconfined residential fires. This category includes electrical arcing (16 percent); radiated or conducted heat from operating equipment (14 percent); heat from other powered equipment (13 percent); and spark, ember or flame from operating equipment (5 percent).
Heat from open flame or smoking materials accounted for 17 percent of nonconfined residential fires. This category includes items such as cigarettes (5 percent), other miscellaneous open flame or smoking materials (4 percent), lighters and matches (combined, 4 percent), and candles (3 percent).
The third largest category pertains to hot or smoldering objects (15 percent). This category includes miscellaneous hot or smoldering objects (7 percent) and hot embers or ashes (7 percent).
Figure 7. Sources of heat in nonconfined residential building fires by major category (2013-2015)
Percent of nonconfined residential building fires0.0 10.0 20.0 30.0 40.0 50.0 60.0
Undetermined
Multiple heat sources includingmultiple ignitions
Explosives, fireworks
Chemical, natural heat source
Other heat source
Heat spread from another fire
Hot or smoldering objects
Heat from open flame orsmoking material
Heat from powered equipment
37.6
0.50.80.50.9
1.93.0
4.06.4
5.38.5
9.615.4
10.717.1
29.947.9
Percent of all nonconfined residential building fires
Percent of nonconfined residential building fires with heat source determined
Source: NFIRS 5.0.
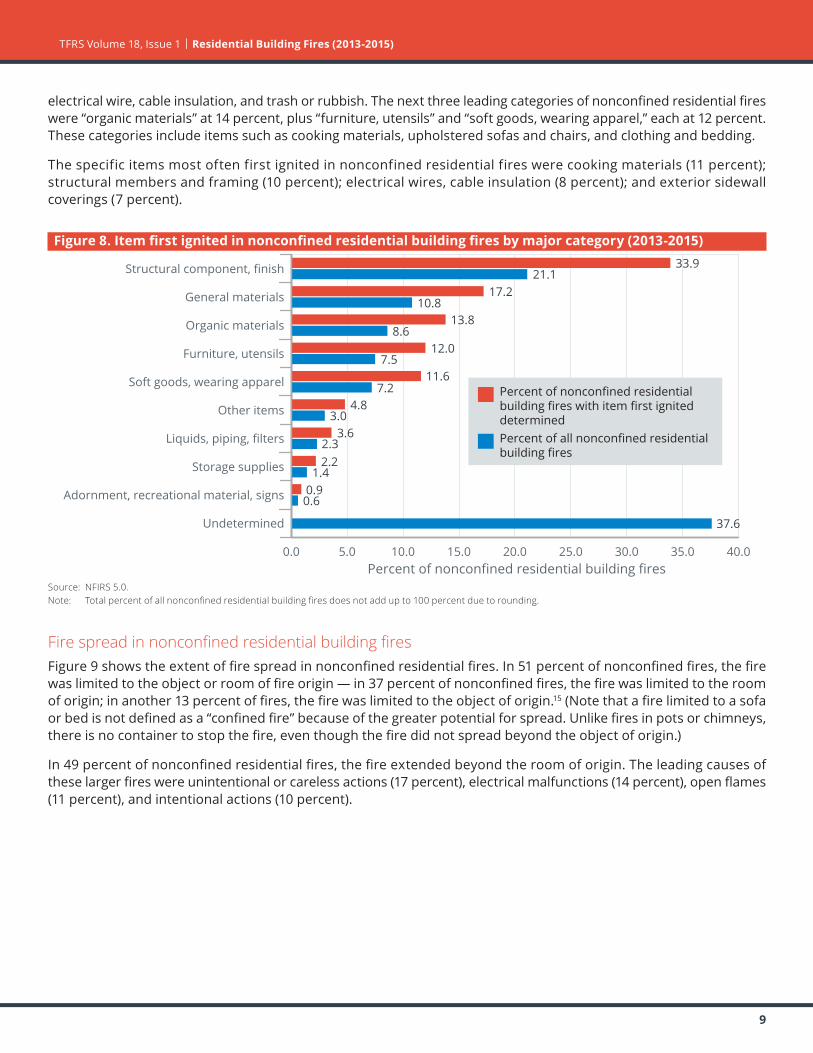
WhatignitesfirstinnonconfinedresidentialbuildingfiresAs shown in Figure 8, 34 percent of the items first ignited in nonconfined residential fires, where the item was determined, fell under the “structural component, finish” category. This category includes structural members or framing and exterior sidewall coverings. The second leading category of items first ignited in nonconfined residential fires was “general materials,” which accounted for 17 percent of these fires. “General materials” includes items such as
TFRS Volume 18, Issue 1 | Residential Building Fires (2013-2015)
9
electrical wire, cable insulation, and trash or rubbish. The next three leading categories of nonconfined residential fires were “organic materials” at 14 percent, plus “furniture, utensils” and “soft goods, wearing apparel,” each at 12 percent. These categories include items such as cooking materials, upholstered sofas and chairs, and clothing and bedding.
The specific items most often first ignited in nonconfined residential fires were cooking materials (11 percent); structural members and framing (10 percent); electrical wires, cable insulation (8 percent); and exterior sidewall coverings (7 percent).
Figure 8. Item first ignited in nonconfined residential building fires by major category (2013-2015)
Percent of nonconfined residential building fires0.0 5.0 10.0 15.0 20.0 25.0 30.0 35.0 40.0
Undetermined
Adornment, recreational material, signs
Storage supplies
Liquids, piping, filters
Other items
Soft goods, wearing apparel
Furniture, utensils
Organic materials
General materials
Structural component, finish
37.6
0.60.9
1.42.22.3
3.63.0
4.87.2
11.67.5
12.08.6
13.810.8
17.221.1
33.9
Percent of all nonconfined residential building fires
Percent of nonconfined residential building fires with item first ignited determined
FirespreadinnonconfinedresidentialbuildingfiresFigure 9 shows the extent of fire spread in nonconfined residential fires. In 51 percent of nonconfined fires, the fire was limited to the object or room of fire origin — in 37 percent of nonconfined fires, the fire was limited to the room of origin; in another 13 percent of fires, the fire was limited to the object of origin.15 (Note that a fire limited to a sofa or bed is not defined as a “confined fire” because of the greater potential for spread. Unlike fires in pots or chimneys, there is no container to stop the fire, even though the fire did not spread beyond the object of origin.)
In 49 percent of nonconfined residential fires, the fire extended beyond the room of origin. The leading causes of these larger fires were unintentional or careless actions (17 percent), electrical malfunctions (14 percent), open flames (11 percent), and intentional actions (10 percent).
TFRS Volume 18, Issue 1 | Residential Building Fires (2013-2015)
10
Figure 9. Extent of fire spread in nonconfined residential building fires (2013-2015)
8.3
Fire
spr
ead
Percent of nonconfined residential building fires0.0 10.0 20.0 30.0 40.0
Beyond building of origin
Limited to building of origin
Limited to floor of origin
Limited to room of origin
Limited to object of origin 13.3
37.2
9.5
34.0
5.9
Source: NFIRS 5.0.Note: Total percent does not add up to 100 percent due to rounding.
FactorscontributingtoignitioninnonconfinedresidentialbuildingfiresTable 4 shows the categories of factors contributing to ignition in nonconfined residential fires. The leading category was the misuse of material or product (38 percent). In this category, the leading specific factors contributing to ignition were a heat source too close to combustible materials (14 percent) and abandoned or discarded materials, such as matches or cigarettes (11 percent).
Electrical failures and malfunctions contributed to 22 percent of nonconfined residential fires. Operational deficiency was the third leading category at 15 percent. Unattended equipment was the leading factor in the operational deficiency category and accounted for 7 percent of all nonconfined residential fires.
Table 4. Factors contributing to ignition for nonconfined residential building fires by major category (where factors contributing to ignition are specified, 2013-2015)
Factors contributing to ignition category Percent of nonconfined residential building fires (unknowns apportioned)
Misuse of material or product 37.9Electrical failure, malfunction 22.3Operational deficiency 14.9Fire spread or control 10.9Mechanical failure, malfunction 7.2Other factors contributing to ignition 6.1Natural condition 3.7Design, manufacture, installation deficiency 1.9
TFRS Volume 18, Issue 1 | Residential Building Fires (2013-2015)
11
Alerting/Suppression systems in residential building firesFire fatalities and injuries have declined over the last 35 years, partly due to new technologies to detect and extinguish fires. Smoke alarms are present in most homes. In addition, the use of residential sprinklers is widely supported by the fire service and is gaining support within residential communities.
Smoke alarm data is available for both confined and nonconfined fires, although for confined fires, the data is very limited in scope. Since different levels of data are reported on smoke alarms in confined and nonconfined fires, the analyses are performed separately. Note that the data presented in Tables 5, 6 and 7 are the raw counts from the NFIRS dataset and are not scaled to national estimates of smoke alarms in residential fires. In addition, the NFIRS does not allow for the determination of the type of smoke alarm (i.e., photoelectric or ionization) or the location of the smoke alarm with respect to the area of fire origin.
SmokealarmsinnonconfinedfiresOverall, smoke alarms were reported as present in 43 percent of nonconfined residential fires (Table 5). In 27 percent of nonconfined residential fires, there were no smoke alarms present. In another 30 percent of these fires, firefighters were unable to determine if a smoke alarm was present. Thus, smoke alarms were potentially missing in 27 to 57 percent of fires with the ability to spread and possibly result in fatalities.
Table 5. Presence of smoke alarms in nonconfined residential building fires (2013-2015)
Presence of smoke alarms PercentPresent 43.0None present 27.1Undetermined 30.0Total 100.0
Source: NFIRS 5.0.Note: Total percent does not add up to 100 percent due to rounding.
While 16 percent of all nonconfined residential fires occurred in residential buildings that are not currently or routinely occupied, these buildings — which are under construction, undergoing major renovations, vacant and the like — are unlikely to have alerting and suppression systems that are in place and, if in place, that are operational. In fact, only 7 percent of all nonconfined fires in unoccupied residential buildings were reported as having smoke alarms that operated. As a result, the detailed smoke alarm analyses in the next section focus on nonconfined fires in occupied residential buildings only.
SmokealarmsinnonconfinedfiresinoccupiedresidentialbuildingsSmoke alarms were reported as present in 49 percent of nonconfined fires in occupied residential buildings (Table 6). In 22 percent of nonconfined fires in occupied residential buildings, there were no smoke alarms present. In another 30 percent of these fires,16 firefighters were unable to determine if a smoke alarm was present; unfortunately, in 49 percent of fires where the presence of a smoke alarm was undetermined, either the flames involved the building of origin or spread beyond it. The fires were so large and destructive that it is unlikely the presence of a smoke alarm could be determined.
When smoke alarms were present (49 percent) and the alarm’s operational status is considered, the percentage of smoke alarms reported as present consisted of:
ĵ Present and operated — 29 percent. ĵ Present but did not operate — 12 percent (alarm failed to operate, 6 percent; fire too small, 6 percent). ĵ Present but operational status unknown — 8 percent.
TFRS Volume 18, Issue 1 | Residential Building Fires (2013-2015)
12
When the subset of incidents where smoke alarms were reported as present was analyzed separately as a whole, smoke alarms were reported to have operated in 59 percent of the incidents and failed to operate in 12 percent. In another 13 percent of this subset, the fire was too small to activate the alarm. The operational status of the alarm was undetermined in 16 percent of these incidents.
Nationally, only 3 percent of households do not have smoke alarms.17 At least 22 percent of nonconfined fires in occupied residential buildings had no smoke alarms present — and perhaps more if fires without information on smoke alarms could be factored in.18 A large proportion of reported fires without smoke alarms may reflect the effectiveness of the alarms themselves: Smoke alarms do not prevent fires, but they may prevent a fire from being reported if it is detected at an early stage and extinguished before the fire department becomes involved. Alternatively, fires in homes without smoke alarms may not be detected at an early stage, causing them to grow large, require fire department intervention, and thus be reported.19
If a fire occurs, properly installed and maintained smoke alarms provide an early warning signal to everyone in a home. Smoke alarms help save lives and property. The USFA continues to partner with other government agencies and fire service organizations to improve and develop new smoke alarm technologies. More information on smoke alarm technologies, performance, disposal and storage, training bulletins, and public education and outreach materials can be found at https://www.usfa.fema.gov/prevention/technology/smoke_fire_alarms.html. Additionally, the USFA’s position statement on smoke alarms is available at https://www.usfa.fema.gov/about/smoke_alarms_position.html.
Table 6. NFIRS smoke alarm data for nonconfined fires in occupied residential buildings (2013-2015)
Presence of smoke alarms
Smoke alarm operational status Smoke alarm effectiveness Count Percent
SmokealarmsinconfinedfiresLess information about smoke alarm status is collected for confined fires, but the data still give important insights about the effectiveness of alerting occupants in these types of fires. The analyses presented here do not differentiate between occupied and unoccupied residential buildings, as this data detail is not required when reporting confined fires in the NFIRS. However, an assumption may be made that confined fires are fires in occupied housing, as these
TFRS Volume 18, Issue 1 | Residential Building Fires (2013-2015)
13
types of fires are unlikely to be reported in residential buildings that are not occupied.
Smoke alarms alerted occupants in 45 percent of the reported confined residential fires (Table 7). In other words, residents received a warning from a smoke alarm in over two-fifths of these fires. The data suggest that smoke alarms may alert residents to confined fires, as the early alerting allowed the occupants to extinguish the fires, or the fires self-extinguished. If this is the case, it is an example of the contribution to overall safety and the ability to rapidly respond to fires in early stages that smoke alarms afford. Details on smoke alarm effectiveness for confined fires are needed to pursue this analysis further.
Occupants were not alerted by smoke alarms in 17 percent of confined residential fires.20 In 38 percent of these confined fires, the smoke alarm effectiveness was unknown.
Table 7. NFIRS smoke alarm data for confined residential building fires (2013-2015)
Automatic extinguishing systems in nonconfined fires in occupied residential buildingsAES data are available for both confined and nonconfined fires, although for confined fires, the data is also very limited in scope. In confined residential building fires, an AES was present in 1 percent of reported incidents.21 In addition, the following AES analyses focus on nonconfined fires in occupied residential buildings only, as even fewer AESs are present in unoccupied housing.
Residential sprinklers are the primary AES in residences but are not yet widely installed. In fact, AESs were reported as present in only 4 percent of nonconfined fires in occupied residential buildings (Table 8).
Residential sprinkler systems help to reduce the risk of deaths and injuries, homeowner insurance premiums, and uninsured property losses. Yet many homes do not have AESs, although they are often found in hotels and businesses. Sprinklers are required by code in hotels and many multifamily residences. There are major movements in the U.S. fire service to require sprinklers in all new homes. At present, however, they are largely absent in residences nationwide.22
USFA and fire service officials across the nation are working to promote and advance residential fire sprinklers. More information on costs and benefits, performance, training bulletins, and public education and outreach materials regarding residential sprinklers is available at https://www.usfa.fema.gov/prevention/technology/home_fire_sprinklers.html. Additionally, the USFA’s position statement on residential sprinklers is available at https://www.usfa.fema.gov/about/sprinklers_position.html.
ExamplesThe following are recent examples of residential fires reported by the media:
ĵ March 2017: Children playing with matches accidentally started a Lake Worth, Florida, apartment building fire. While Palm Beach County Fire Rescue was able to control the fire, six apartments in the building were damaged. Nineteen residents were displaced as a result of the fire, including six children.23
ĵ March 2017: Five people were displaced as a result of a house fire in Richland County, South Carolina. According to the Columbia Fire Department, the fire started at approximately 12:30 p.m. and was under control by 2:00 p.m. While there were no injuries, the fire, caused by unattended cooking, resulted in significant damage to the house.24
ĵ February 2017: Firefighters responded to an early morning house fire in Hamilton County, Indiana, which injured two people. One of two injured, a 21-year-old man, was transported to a hospital with severe but nonlife-threatening burns. The other injured person had minor burns, which were later treated at the hospital. Four other people escaped uninjured. Investigators determined the fire was caused when an unattended candle caught bedding on fire in a room above the home’s garage. According to the fire department, an occupant of the home kept the fire from spreading further by closing the door to the room where the fire started. Damage to the home was estimated at $65,000.25
ĵ January 2017: A 67-year old man died in a late morning house fire in Winter Haven, Florida. Before Polk County and Auburndale firefighters arrived on scene, neighbors of the man attempted to save him but were unsuccessful due to extreme heat, smoke and flames. The State Fire Marshal’s Office determined the fire started in the living room of the home and was caused by a small electric heater placed too close to a recliner.26
NFIRS data specifications for residential building firesData for this report were extracted from the NFIRS annual Public Data Release files for 2013, 2014 and 2015. Only Version 5.0 data were extracted.
TFRS Volume 18, Issue 1 | Residential Building Fires (2013-2015)
15
Residential building fires were defined using the following criteria:
ĵ Aid Types 3 (mutual aid given) and 4 (automatic aid given) were excluded to avoid double counting of incidents.
ĵ Incident Types 111 to 123 (excluding Incident Type 112):
Incident Type Description111 Building fire113 Cooking fire, confined to container114 Chimney or flue fire, confined to chimney or flue115 Incinerator overload or malfunction, fire confined116 Fuel burner/boiler malfunction, fire confined117 Commercial compactor fire, confined to rubbish118 Trash or rubbish fire, contained120 Fire in mobile property used as a fixed structure, other121 Fire in mobile home used as fixed residence122 Fire in motor home, camper, recreational vehicle123 Fire in portable building, fixed location
ĵ Property Use Series 400, which consists of the following:
Property Use Description400 Residential, other419 One- or two-family dwelling, detached, manufactured home, mobile home not in transit, duplex429 Multifamily dwelling439 Boarding/Rooming house, residential hotels449 Hotel/Motel, commercial459 Residential board and care460 Dormitory-type residence, other462 Sorority house, fraternity house464 Barracks, dormitory
ĵ Structure type:
Ý For Incident Types 113 to 118: f 1—Enclosed building, or f 2—Fixed portable or mobile structure, or f Structure Type not specified (null entry).
Ý For Incident Types 111 and 120 to 123: f 1—Enclosed building, or f 2—Fixed portable or mobile structure.
The analyses contained in this report reflect the current methodologies used by the USFA. The USFA is committed to providing the best and most current information on the U.S. fire problem and continually examines its data and methodology to fulfill this goal. Because of this commitment, data collection strategies and methodological changes are possible and do occur. As a result, analyses and estimates of the fire problem may change slightly over time. Previous analyses and estimates on specific issues (or similar issues) may have used different methodologies or data definitions and may not be directly comparable to the current ones.
TFRS Volume 18, Issue 1 | Residential Building Fires (2013-2015)
16
Information regarding the USFA’s national estimates for residential building fires, as well as the data sources used to derive the estimates, can be found in the document “Data Sources and National Estimates Methodology Overview for the U.S. Fire Administration’s Topical Fire Report Series (Volume 18),” http://www.usfa.fema.gov/downloads/pdf/statistics/data_sources_and_national_estimates_methodology_vol18.pdf. This document also addresses the specific NFIRS data elements analyzed in the topical reports, as well as “unknown” data entries and missing data.
To request additional information, visit https://www.usfa.fema.gov/contact.html. To comment on this specific report, visit https://apps.usfa.fema.gov/contact/dataReportEval?reportTitle=Residential%20Building%20Fires%20(2013-2015).
Notes:1National estimates are based on 2013 to 2015 native Version 5.0 data from the NFIRS, residential structure fire loss estimates from the National Fire Protection Association’s (NFPA’s) annual surveys of fire loss, and the USFA’s residential building fire loss estimates: https://www.usfa.fema.gov/data/statistics/order_download_data.html. Further information on the USFA’s residential building fire loss estimates can be found in the “National Estimates Methodology for Building Fires and Losses,” August 2012, https://www.usfa.fema.gov/downloads/pdf/statistics/national_estimate_methodology.pdf. For information on the NFPA’s survey methodology, see the NFPA’s report “Fire Loss in the United States During 2015,” September 2016, http://www.nfpa.org/news-and-research/fire-statistics-and-reports/fire-statistics/fires-in-the-us/overall-fire-problem/fire-loss-in-the-united-states. In this topical report, fires are rounded to the nearest 100, deaths to the nearest five, injuries to the nearest 25, and dollar loss to the nearest $100 million.2 In NFIRS Version 5.0, a structure is a constructed item of which a building is one type. In previous versions of the NFIRS, the term “residential structure” commonly referred to buildings where people live. To coincide with this concept, the definition of a residential structure fire for the NFIRS 5.0 includes only those fires where the NFIRS 5.0 structure type is 1 or 2 (enclosed building and fixed portable or mobile structure) with a residential property use. Such structures are referred to as “residential buildings” to distinguish these buildings from other structures on residential properties that may include fences, sheds and other uninhabitable structures. In addition, confined fire incidents that have a residential property use but do not have a structure type specified are presumed to occur in buildings. Nonconfined fire incidents that have a residential property use without a structure type specified are considered to be invalid incidents (structure type is a required field) and are not included.3The percentages shown here are derived from the national estimates of residential building fires as explained in Endnote 1 and the summary data resulting from the NFPA’s annual fire loss surveys (Haynes, Hylton J.G., “Fire Loss in the United States During 2015,” NFPA, September 2016; Haynes, Hylton J.G., “Fire Loss in the United States During 2014,” NFPA, September 2015; Karter, Jr., Michael, J., “Fire Loss in the United States During 2013,” NFPA, September 2014).4Fire department participation in the NFIRS is voluntary; however, some states do require their departments to participate in the state system. Additionally, if a fire department is a recipient of a Fire Act Grant, participation is required. From 2013 to 2015, 67 percent of the NFPA’s annual average estimated 1,294,500 fires to which fire departments responded were captured in the NFIRS. Thus, the NFIRS is not representative of all fire incidents in the U.S. and is not a “complete” census of fire incidents. Although the NFIRS does not represent 100 percent of the incidents reported to fire departments each year, the enormous dataset exhibits stability from one year to the next without radical changes. Results based on the full dataset are generally similar to those based on part of the data.5In the NFIRS, confined fires are defined by Incident Type codes 113 to 118.6The NFIRS distinguishes between “content” and “property” loss. Content loss includes losses to the contents of a structure due to damage by fire, smoke, water and overhaul. Property loss includes losses to the structure itself or to the property itself. Total loss is the sum of the content loss and the property loss. For confined fires, the expectation is that the fire did not spread beyond the container (or rubbish for Incident Type code 118), and hence, there was no property damage (damage to the structure itself) from the flames. However, there could be property damage as a result of smoke, water and overhaul.7The average fire death and fire injury loss rates computed from the national estimates do not agree with average fire death and fire injury loss rates computed from NFIRS data alone. The fire death rate computed from national estimates is (1,000 x (2,695/380,200)) = 7.1 deaths per 1,000 residential building fires, and the fire injury rate is (1,000 x (12,000/380,200)) = 31.6 injuries per 1,000 residential building fires. 8“One- and two-family residential buildings” include detached dwellings, manufactured homes, mobile homes not in transit, and duplexes. “Multifamily residential buildings” include apartments, town houses, row houses, condominiums, and other tenement properties. “Other residential buildings” include boarding/rooming houses, hotels/motels, residential board and care facilities, dormitory-type residences, sorority/fraternity houses, and barracks.9For the purposes of this report, the time of the fire alarm is used as an approximation for the general time at which the fire started. However, in the NFIRS, it is the time at which the fire was reported to the fire department.10USFA, “Cooking Fires in Residential Buildings (2008-2010),” Volume 13, Issue 12, January 2013, https://www.usfa.fema.gov/downloads/pdf/statistics/v13i12.pdf.11The USFA Structure Fire Cause Methodology was used to determine the cause of residential building fires. The cause methodology and definitions can be found in the document “National Fire Incident Reporting System Version 5.0 Fire Data Analysis Guidelines and Issues,” July 2011, https://www.usfa.fema.gov/downloads/pdf/nfirs/nfirs_data_analysis_guidelines_issues.pdf.
TFRS Volume 18, Issue 1 | Residential Building Fires (2013-2015)
17
12Fires caused by intentional actions include, but are not limited to, fires that are deemed to be arson. Intentional fires are those fires that are deliberately set and include fires that result from the deliberate misuse of a heat source and fires of an incendiary nature (arson) that require fire service intervention. For information and statistics on arson fires only, refer to the Uniform Crime Reporting Program arson statistics from the U.S. Department of Justice, FBI, Criminal Justice Information Services Division, http://www.fbi.gov/about-us/cjis/ucr/ucr.13The American Housing Survey does not indicate the number of fireplaces, chimneys and fireplace-related equipment per se. It does collect data on fireplaces, etc., as the primary heating unit, which applies to this analysis. U.S. Department of Housing and Urban Development (HUD) and U.S. Census Bureau, 2015 American Housing Survey – Table Creator, select “2015 (Year) National (Area) Housing Unit Characteristics (Table); Units by Structure Type (Variable 1),” https://www.census.gov/programs-surveys/ahs/data/interactive/ahstablecreator.html#?s_areas=a00000&s_year=n2015&s_tableName=Table1&s_byGroup1=a1&s_byGroup2=a1&s_filterGroup1=t1&s_filterGroup2=g1 (accessed March 27, 2017). 14As noted previously, confined building fires are small fire incidents that are limited in scope, are confined to noncombustible containers, rarely result in serious injury or large content loss, and are expected to have no significant accompanying property loss due to flame damage. In the NFIRS, confined fires are defined by Incident Type codes 113 to 118.15Total does not add up to 51 percent due to rounding.16Total does not add up to 100 percent due to rounding.17Greene, Michael and Craig Andres, “2004-2005 National Sample Survey of Unreported Residential Fires,” Division of Hazard Analysis, Directorate for Epidemiology, U.S. Consumer Product Safety Commission, July 2009.18Here, at least 22 percent of nonconfined fires in occupied residential buildings had no smoke alarms present — the 22 percent that were known to not have smoke alarms and some portion (or as many as all) of the fires where the smoke alarm presence was undetermined.19The “2004-2005 National Sample Survey of Unreported Residential Fires,” however, suggests that this may not be the case. It is observed that “if this conjecture is true, it would suggest that the percentage decrease in fire department-attended fires would have been greater than unattended fires in the 20 year period between the surveys.”20In confined fires, the entry “smoke alarm did not alert occupants” can mean no smoke alarm was present; the smoke alarm was present but did not operate; the smoke alarm was present and operated, but the occupant(s) was already aware of the fire; or there were no occupants present at the time of the fire.21As confined fire codes are designed to capture fires contained to noncombustible containers, it is not recommended to code a fire incident as a small-, low- or no-loss confined fire incident if the AES operated and contained the fire as a result. The preferred method is to code the fire as a standard fire incident with fire spread confined to the object of origin and provide the relevant information on AES presence and operation.22HUD and U.S. Census Bureau, American Housing Survey for the United States: 2011, September 2013, “Health and Safety Characteristics-All Occupied Units (National),” Table S-01-AO, https://www.census.gov/content/dam/Census/programs-surveys/ahs/data/2011/h150-11.pdf (accessed April 3, 2017).23“Children Playing With Matches Start Lake Worth Apartment Fire, Displaces 19 Residents,” www.wptv.com, March 20, 2017, http://www.wptv.com/news/region-c-palm-beach-county/lake-worth/lake-worth-apartment-building-fire-extinguished (accessed March 27, 2017).24Kulmala, Teddy, “Wednesday House Fire Off Leesburg Road Was Cooking-Related,” www.thestate.com, March 8, 2017, http://www.thestate.com/news/local/article137231168.html (accessed March 21, 2017).25“Investigators Believe Unattended Candle Caused House Fire That Injured 2 Near Geist Reservoir,” www.cbs4indy.com, Feb. 15, 2017, http://cbs4indy.com/2017/02/15/investigators-believe-unattended-candle-caused-house-fire-that-injured-2-near-geist-reservoir/ (accessed March 21, 2017).26Chambliss, John, “Electric Heater Started House Fire Where Haven Man Died,” www.theledger.com, Jan. 12, 2017, http://www.theledger.com/news/20170111/electric-heater-started-house-fire-where-haven-man-died (accessed March 21, 2017).