66
Resonance Energy Transfer Fluorescence Resonance Energy Transfer Surface Energy Transfer Non-Radiative Energy Transfer driven by dipole-dipole couplin
| Date post: | 27-Dec-2015 |
| Category: |
Documents |
| Upload: | melvyn-jacobs |
| View: | 239 times |
| Download: | 7 times |
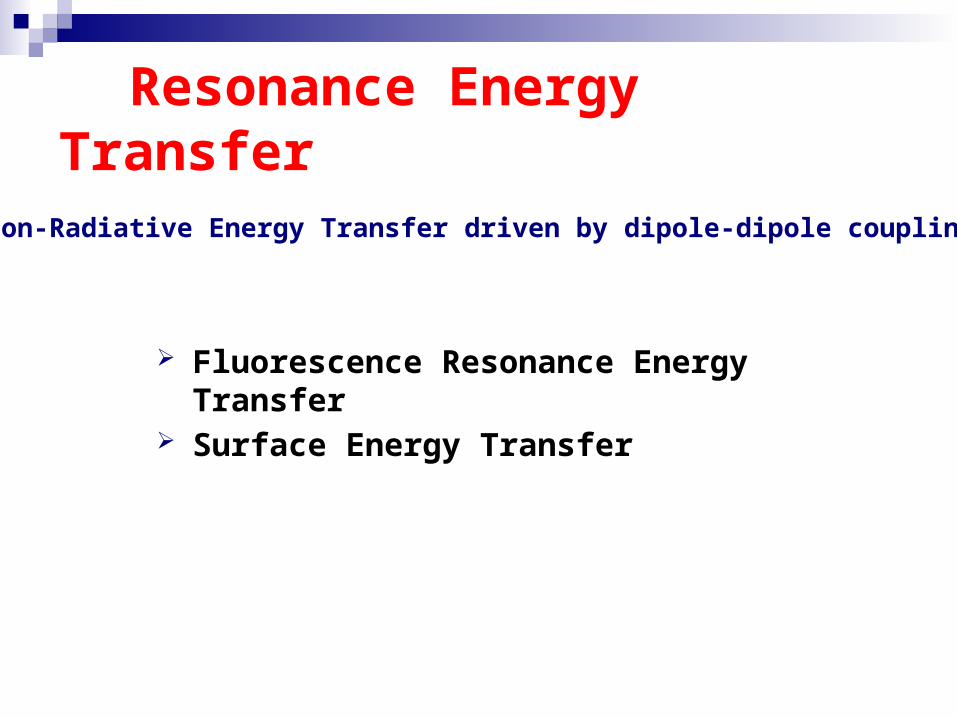
Resonance Energy Transfer
Fluorescence Resonance Energy Transfer
Surface Energy Transfer
Non-Radiative Energy Transfer driven by dipole-dipole coupling
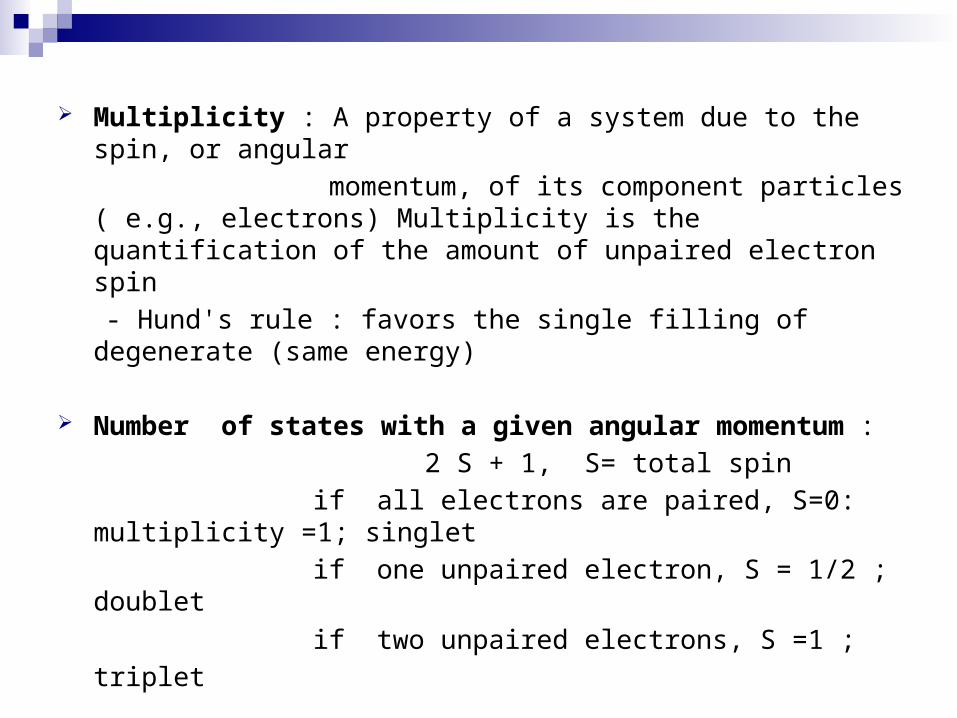
Multiplicity : A property of a system due to the spin, or an-gular
momentum, of its component particles ( e.g., elec-trons) Multiplicity is the quantification of the amount of un-paired electron spin
- Hund's rule : favors the single filling of degenerate (same energy)
Number of states with a given angular momentum : 2 S + 1, S= total spin if all electrons are paired, S=0: multiplicity =1; sin-
glet if one unpaired electron, S = 1/2 ; doublet
if two unpaired electrons, S =1 ; triplet
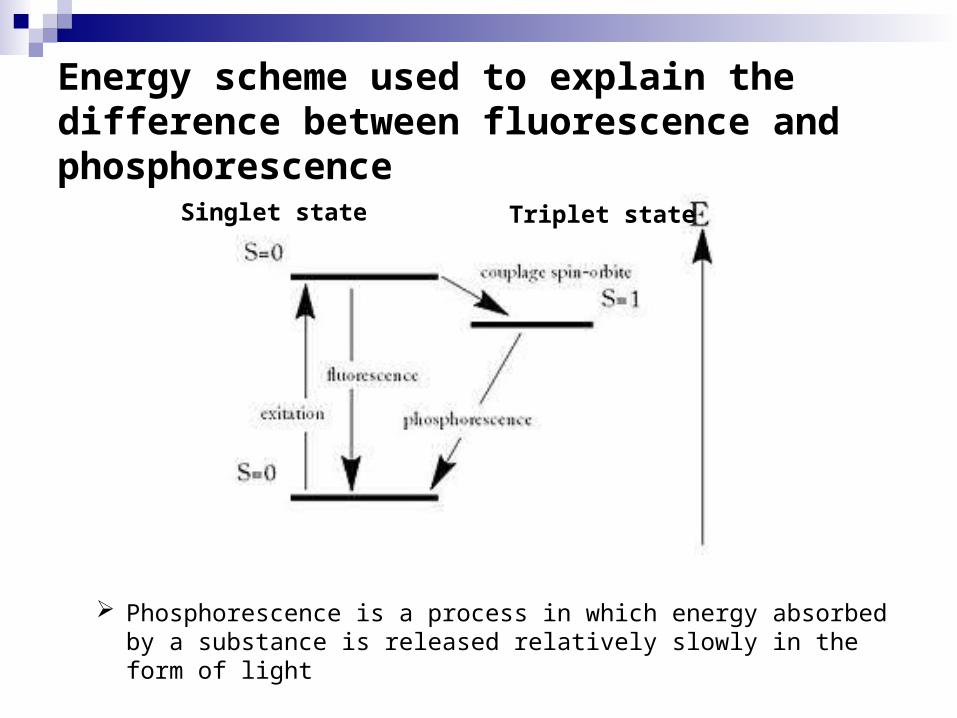
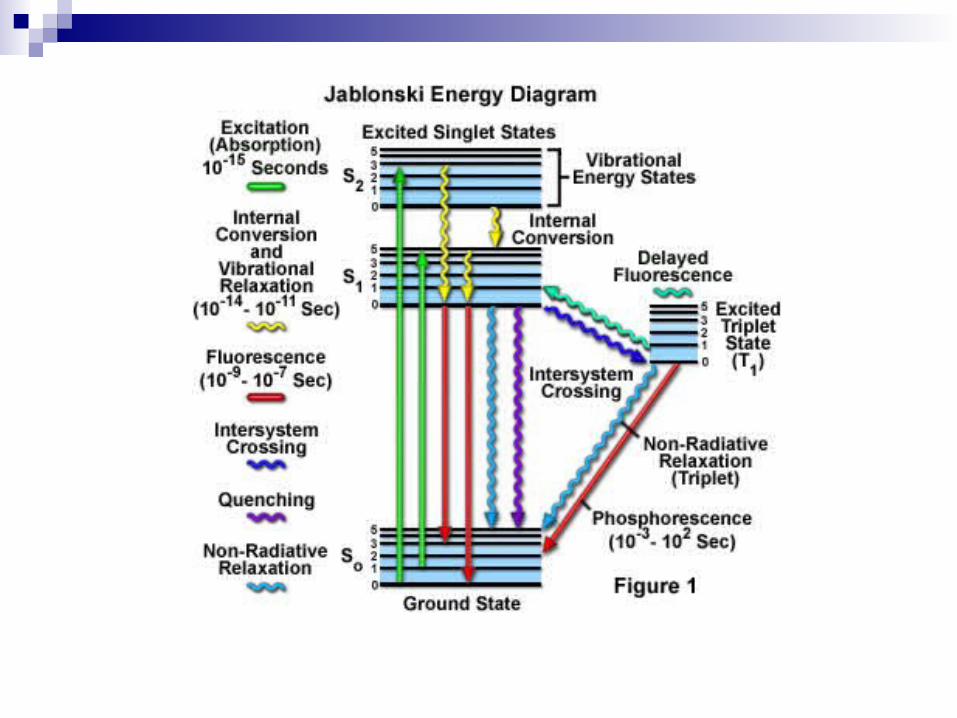
Energy scheme used to explain the dif-ference between fluorescence and phosphorescence
Phosphorescence is a process in which energy absorbed by a substance is released relatively slowly in the form of light
Singlet state Triplet state
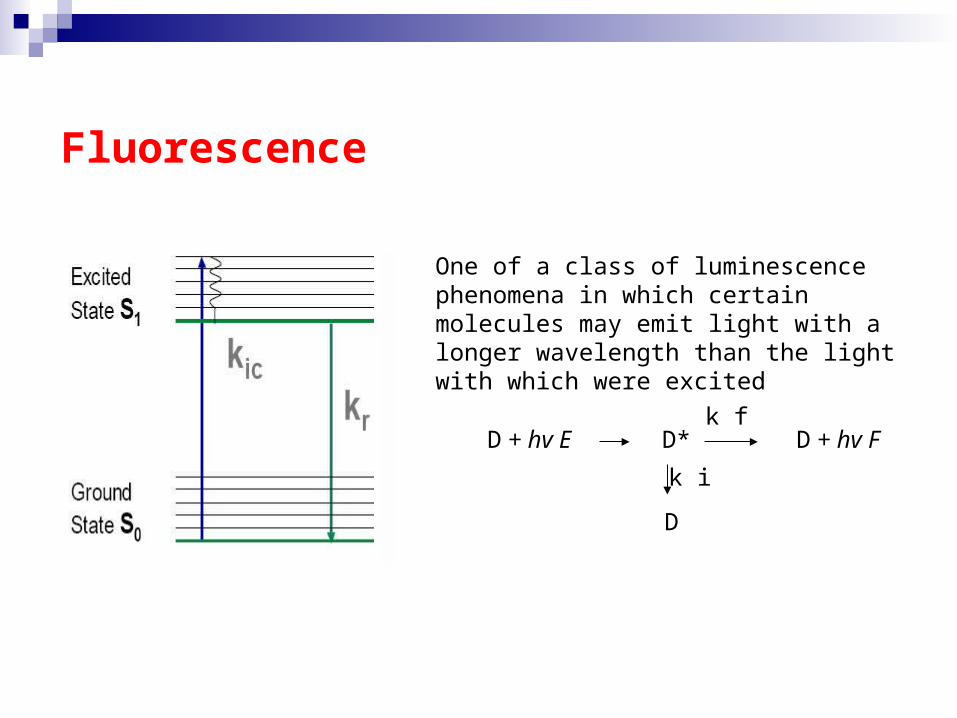
Fluorescence
One of a class of luminescence phe-nomena in which certain molecules may emit light with a longer wavelength than the light with which were excited
D + hv E D* D + hv Fk f
k i
D
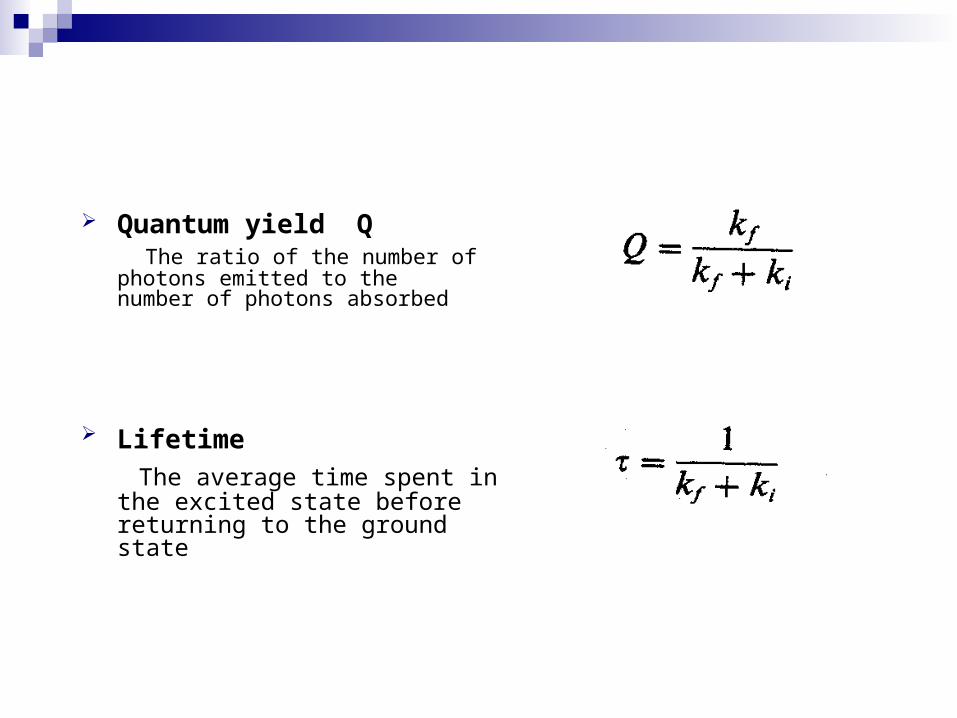
Quantum yield Q The ratio of the number of pho-
tons emitted to the number of photons absorbed
Lifetime The average time spent in the
excited state before returning to the ground state
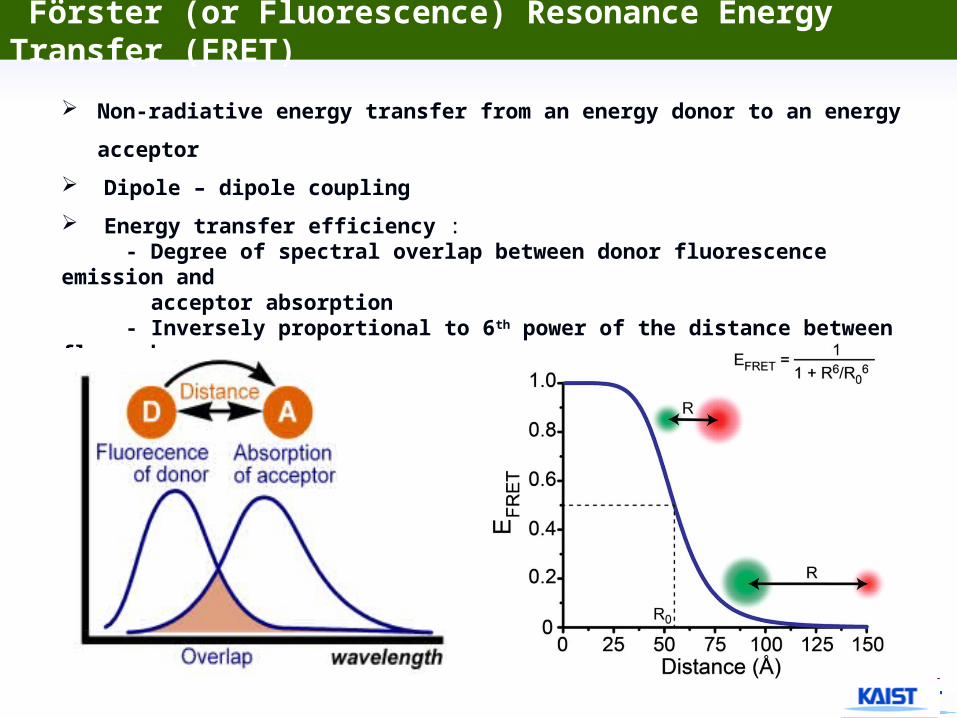
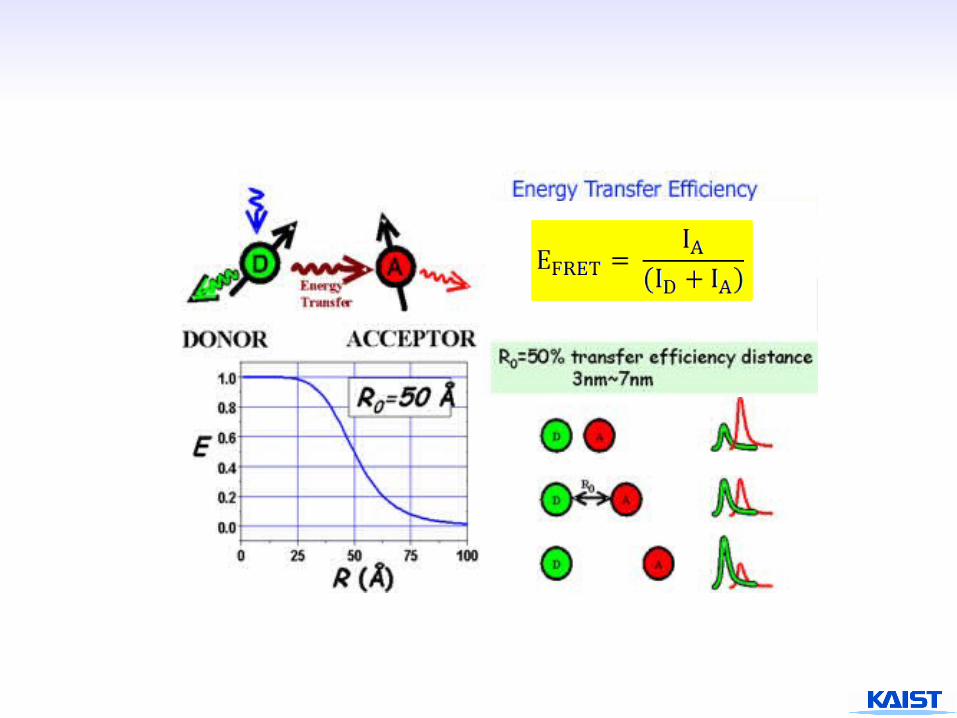
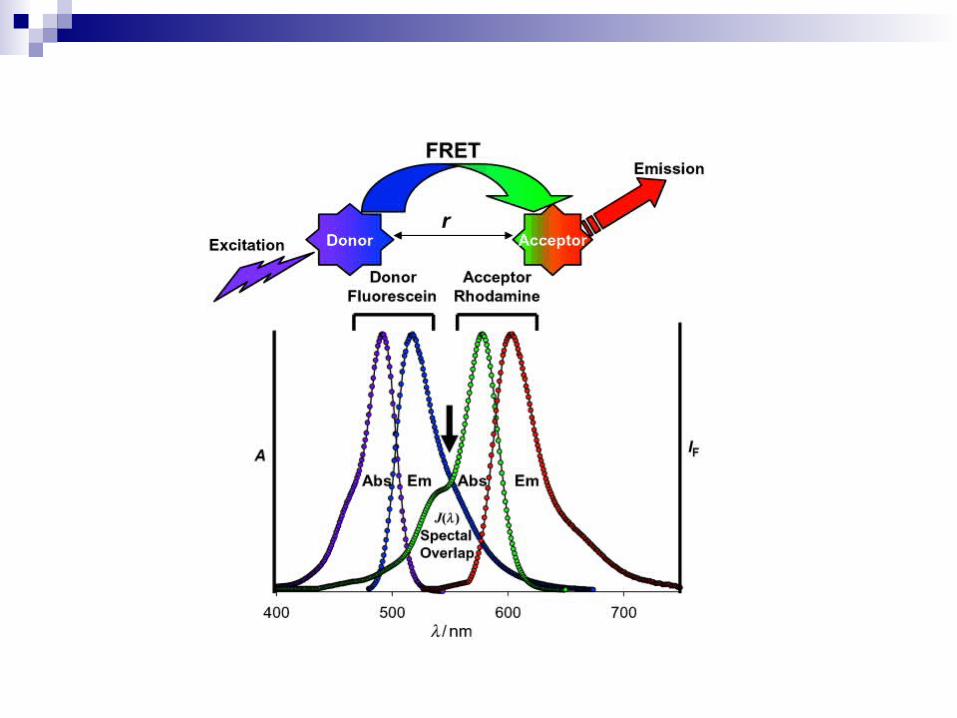
Förster (or Fluorescence) Resonance Energy Trans-fer (FRET)
Non-radiative energy transfer from an energy donor to an energy
acceptor
Dipole – dipole coupling
Energy transfer efficiency : - Degree of spectral overlap between donor fluorescence emission and acceptor absorption - Inversely proportional to 6th power of the distance between fluo-rophores - ~ 10 nm
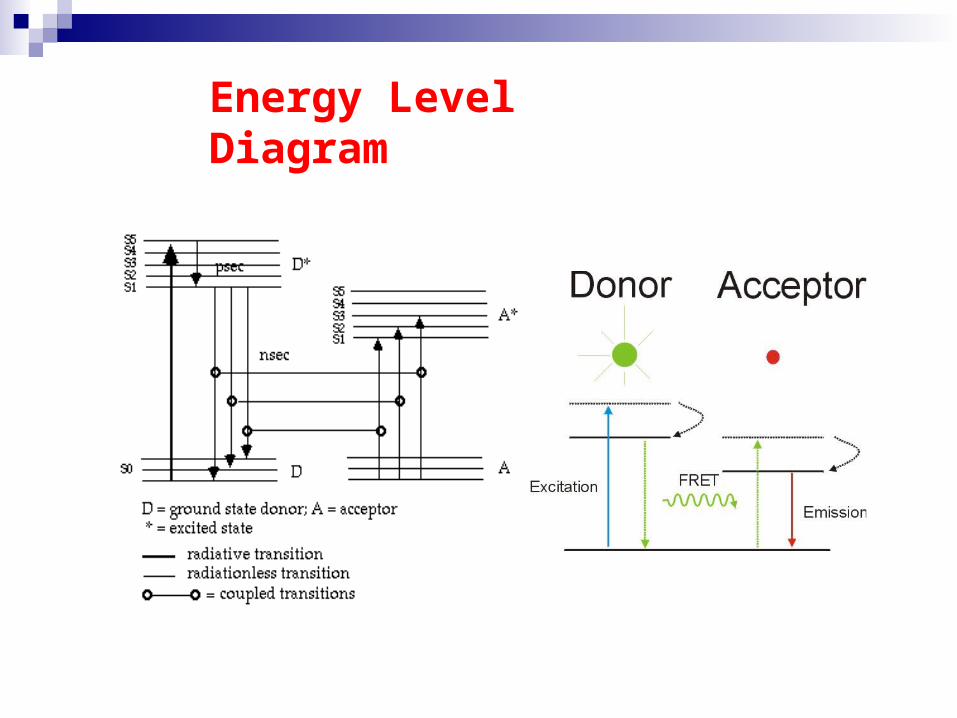
Energy Level Dia-gram
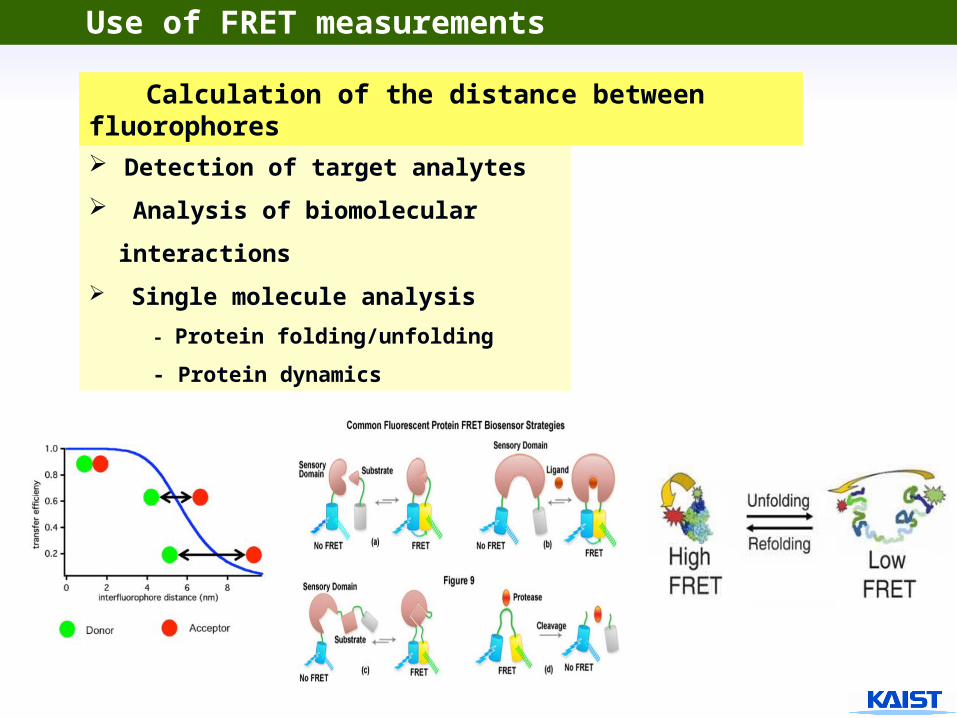
Use of FRET measurements
Detection of target analytes
Analysis of biomolecular inter-
actions
Single molecule analysis
- Protein folding/unfolding
- Protein dynamics
Calculation of the distance between fluo-rophores
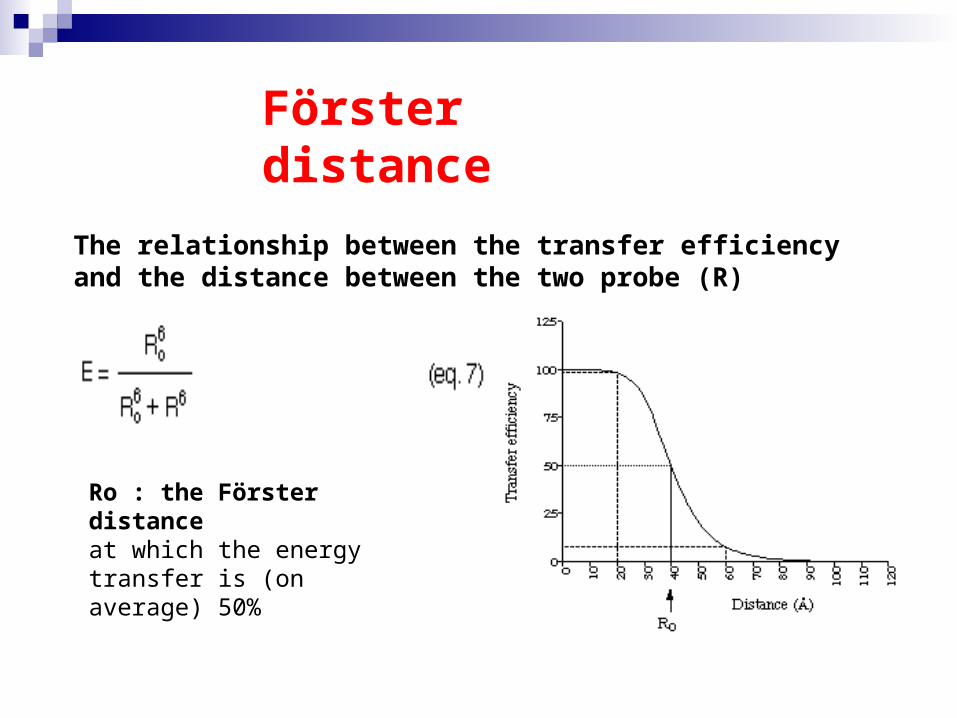
Förster dis-tance
The relationship between the transfer efficiency and the distance between the two probe (R)
Ro : the Förster dis-tanceat which the energy trans-fer is (on average) 50%
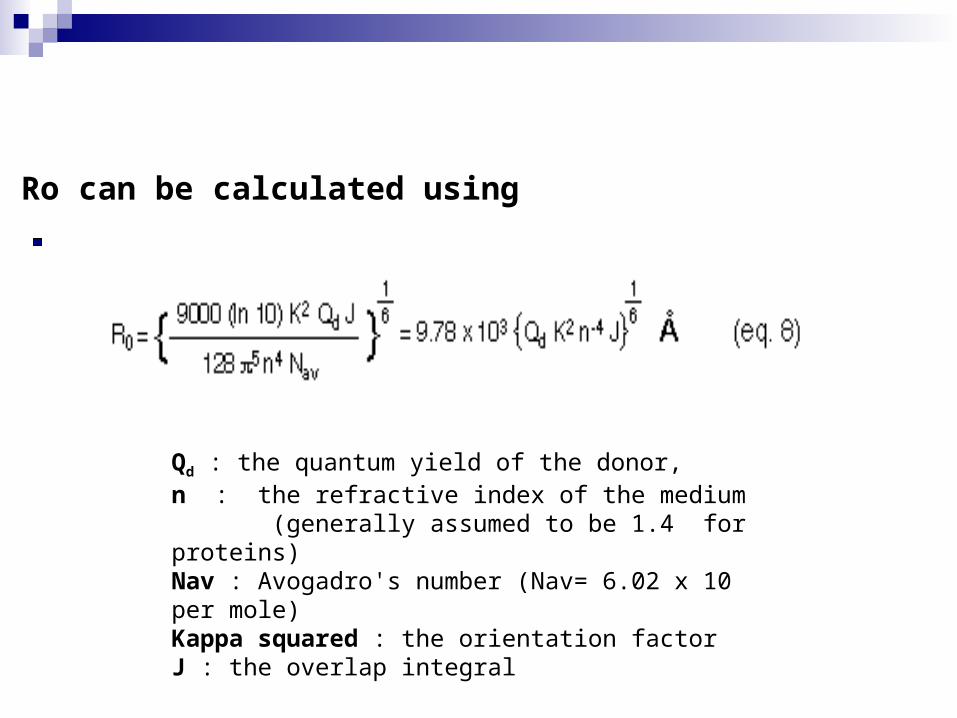
Ro can be calculated using
Qd : the quantum yield of the donor,n : the refractive index of the medium (generally assumed to be 1.4 for proteins) Nav : Avogadro's number (Nav= 6.02 x 10 per mole)Kappa squared : the orientation factorJ : the overlap integral
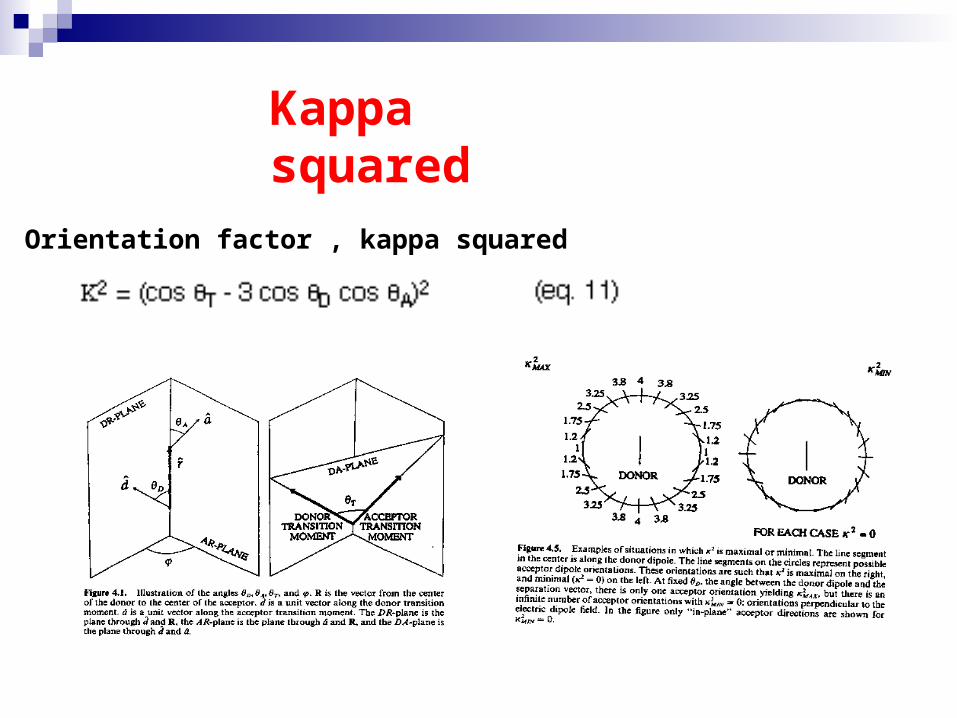
Kappa squared
Orientation factor , kappa squared
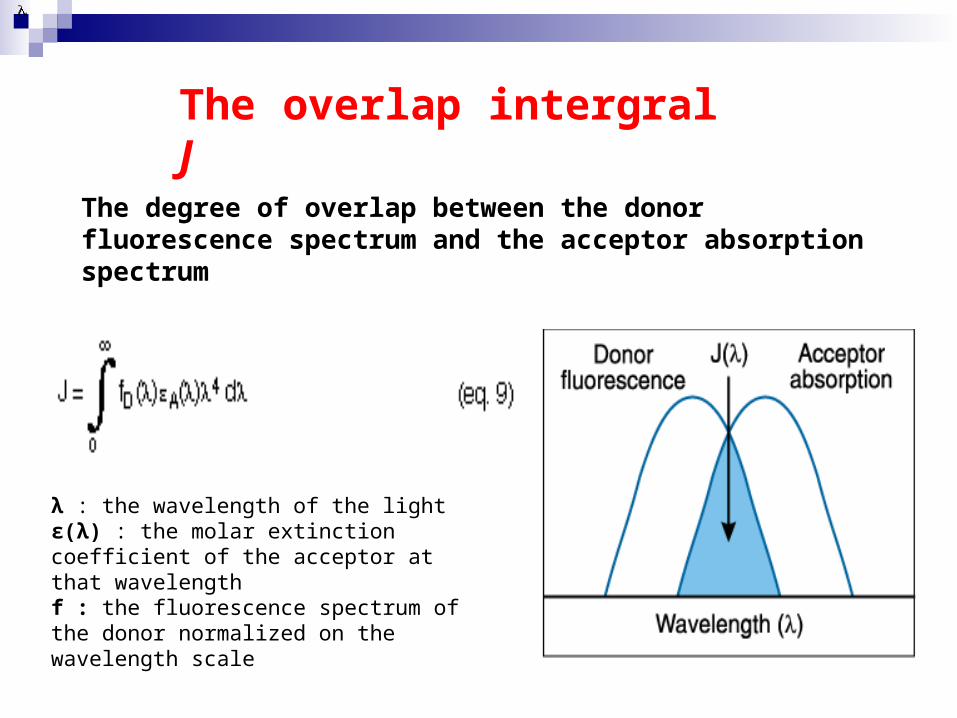
The overlap intergral J
The degree of overlap between the donor fluores-cence spectrum and the acceptor absorption spec-trum
λ : the wavelength of the light ε(λ) : the molar extinction coefficient of the acceptor at that wavelengthf : the fluorescence spectrum of the donor normalized on the wavelength scale
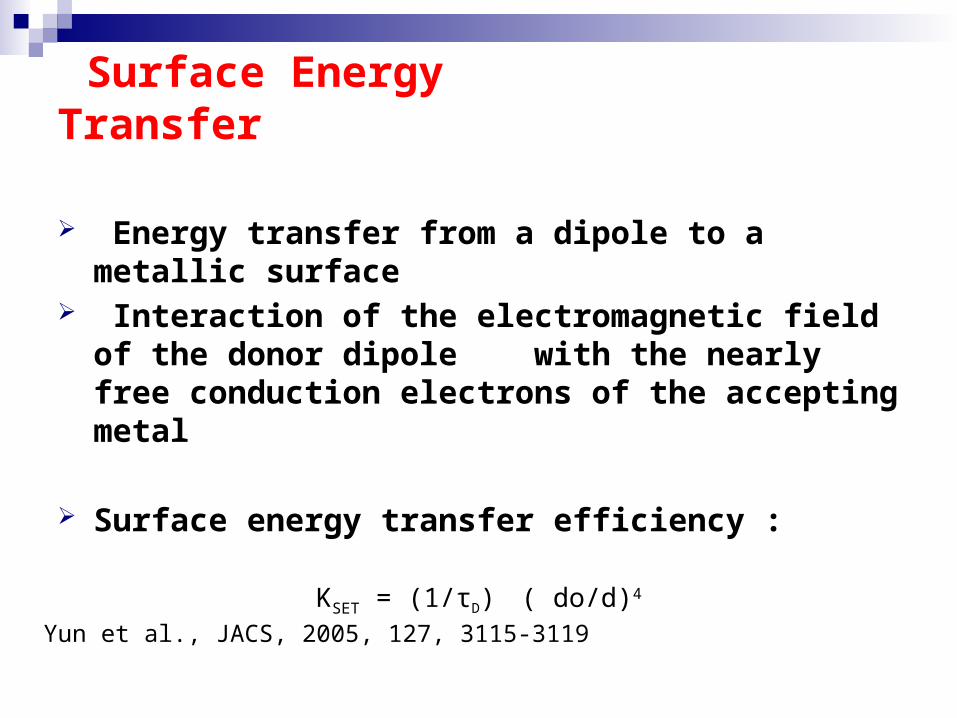
Surface Energy Transfer
Energy transfer from a dipole to a metallic surface
Interaction of the electromagnetic field of the donor dipole with the nearly free con-duction electrons of the accepting metal
Surface energy transfer efficiency :
KSET = (1/τD) ( do/d)4
Yun et al., JACS, 2005, 127, 3115-3119
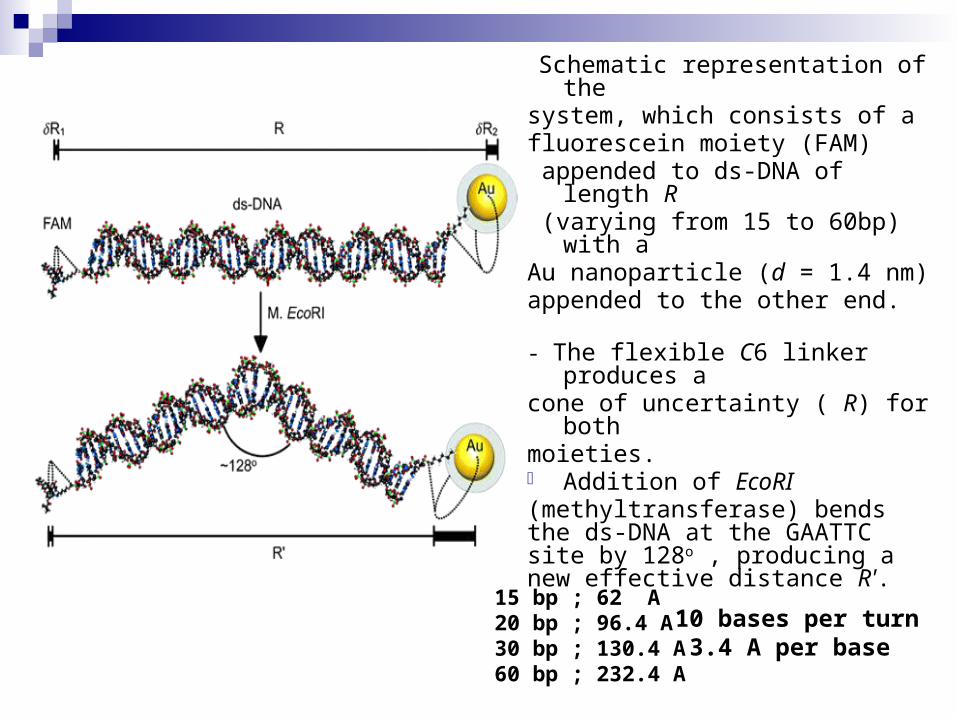
Schematic representation of thesystem, which consists of afluorescein moiety (FAM) appended to ds-DNA of length R (varying from 15 to 60bp) with a Au nanoparticle (d = 1.4 nm) appended to the other end.
- The flexible C6 linker produces a cone of uncertainty ( R) for both moieties. - Addition of EcoRI (methyltransferase) bends the ds-DNA at the GAATTC site by 128o , producing a new effective distance R'.
10 bases per turn 3.4 A per base
15 bp ; 62 A20 bp ; 96.4 A30 bp ; 130.4 A60 bp ; 232.4 A
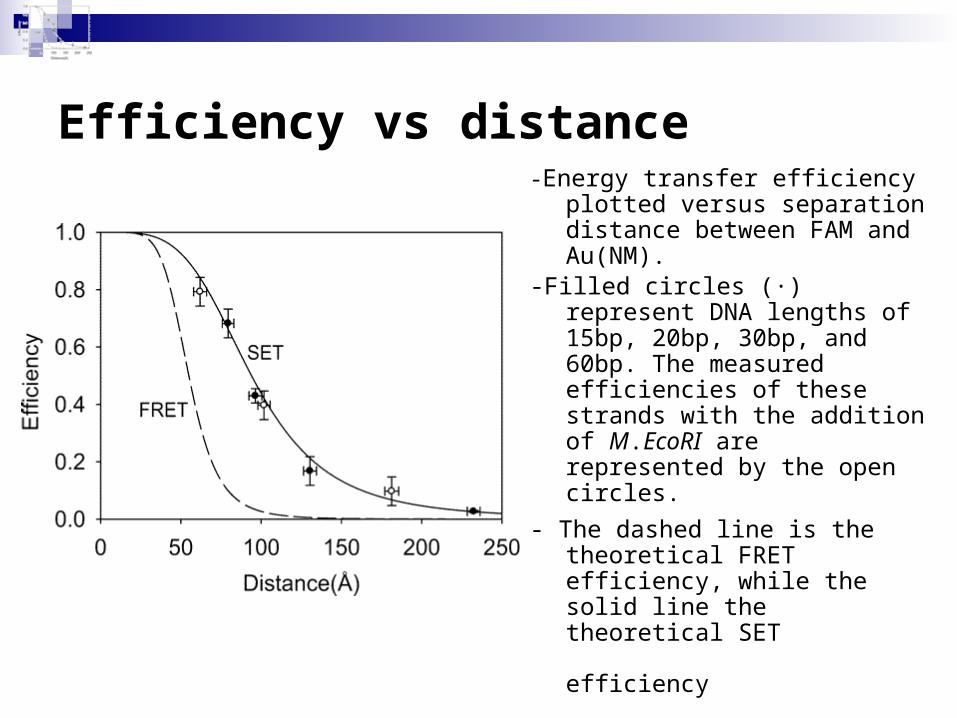
Efficiency vs distance-Energy transfer efficiency plot-
ted versus separation dis-tance between FAM and Au(NM).
-Filled circles (·) represent DNA lengths of 15bp, 20bp, 30bp, and 60bp. The measured effi-ciencies of these strands with the addition of M.EcoRI are represented by the open cir-cles.
- The dashed line is the theoreti-cal FRET efficiency, while the solid line the theoretical SET
efficiency
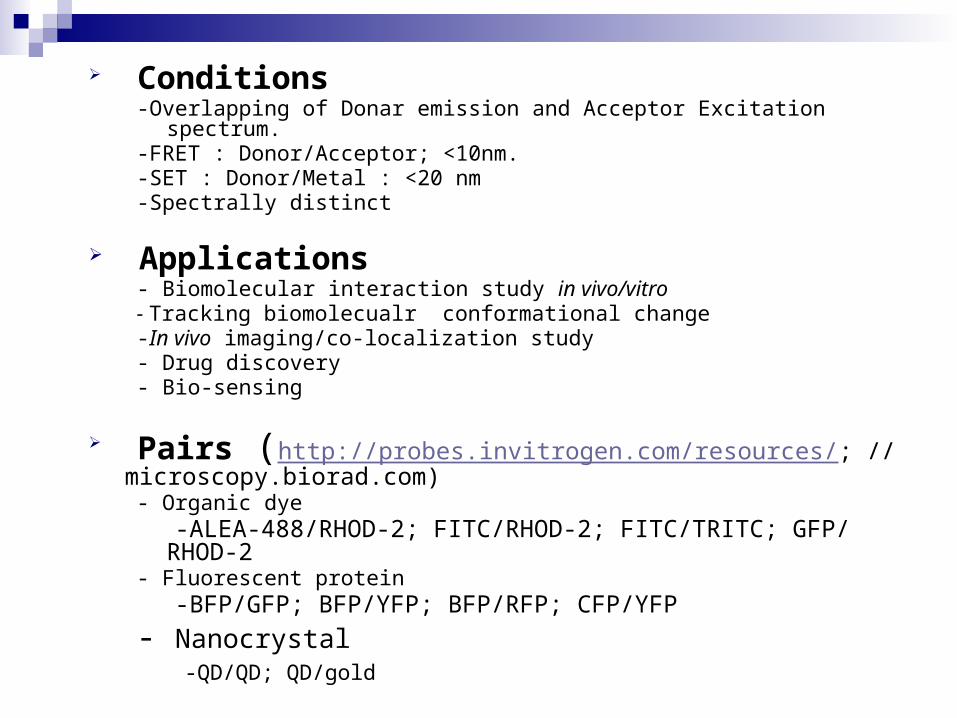
Conditions-Overlapping of Donar emission and Acceptor Excitation spectrum.-FRET : Donor/Acceptor; <10nm.-SET : Donor/Metal : <20 nm-Spectrally distinct
Applications- Biomolecular interaction study in vivo/vitro- Tracking biomolecualr conformational change-In vivo imaging/co-localization study- Drug discovery- Bio-sensing
Pairs (http://probes.invitrogen.com/resources/; //microscopy-.biorad.com)- Organic dye -ALEA-488/RHOD-2; FITC/RHOD-2; FITC/TRITC; GFP/RHOD-2- Fluorescent protein -BFP/GFP; BFP/YFP; BFP/RFP; CFP/YFP
- Nanocrystal -QD/QD; QD/gold
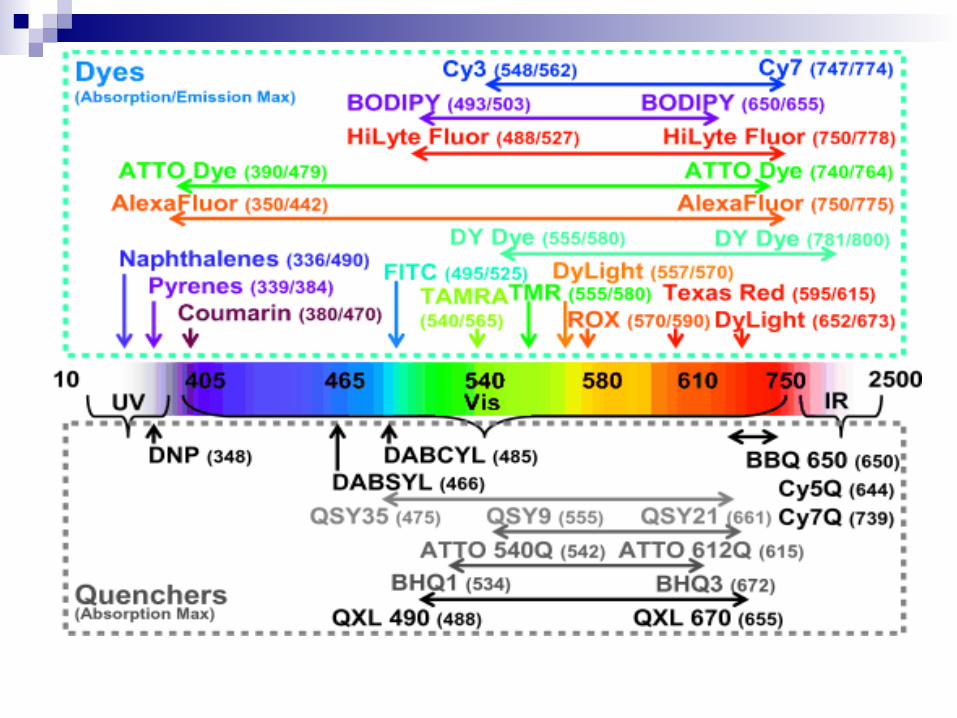
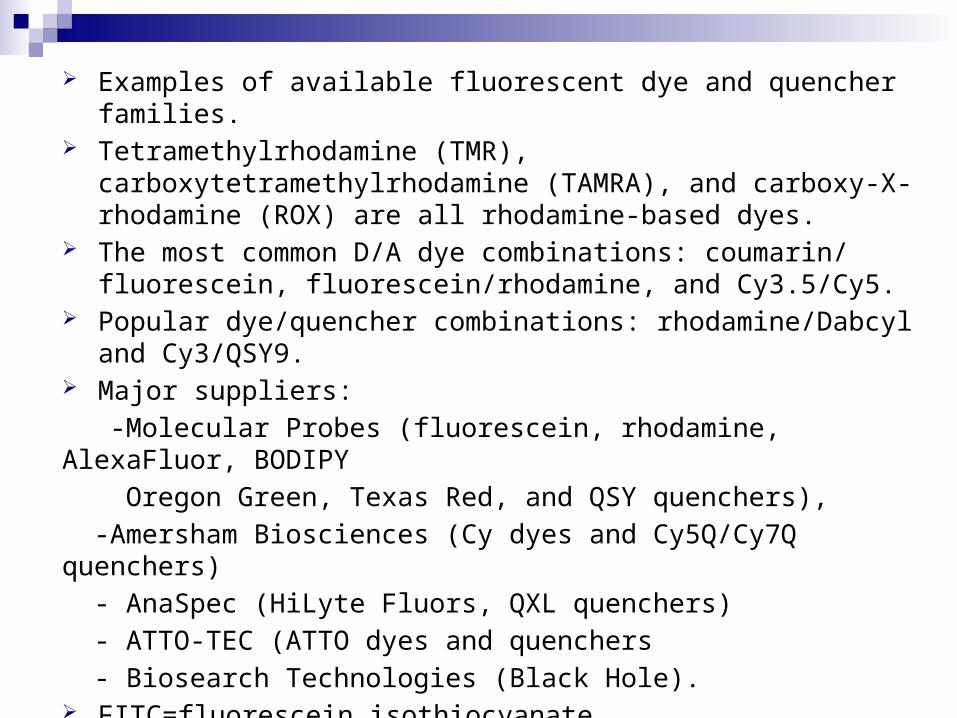
Examples of available fluorescent dye and quencher families. Tetramethylrhodamine (TMR), carboxytetramethylrhodamine
(TAMRA), and carboxy-X-rhodamine (ROX) are all rhodamine-based dyes.
The most common D/A dye combinations: coumarin/fluores-cein, fluorescein/rhodamine, and Cy3.5/Cy5.
Popular dye/quencher combinations: rhodamine/Dabcyl and Cy3/QSY9.
Major suppliers: -Molecular Probes (fluorescein, rhodamine, AlexaFluor, BODIPY Oregon Green, Texas Red, and QSY quenchers), -Amersham Biosciences (Cy dyes and Cy5Q/Cy7Q quenchers) - AnaSpec (HiLyte Fluors, QXL quenchers) - ATTO-TEC (ATTO dyes and quenchers - Biosearch Technologies (Black Hole). FITC=fluorescein isothiocyanate.
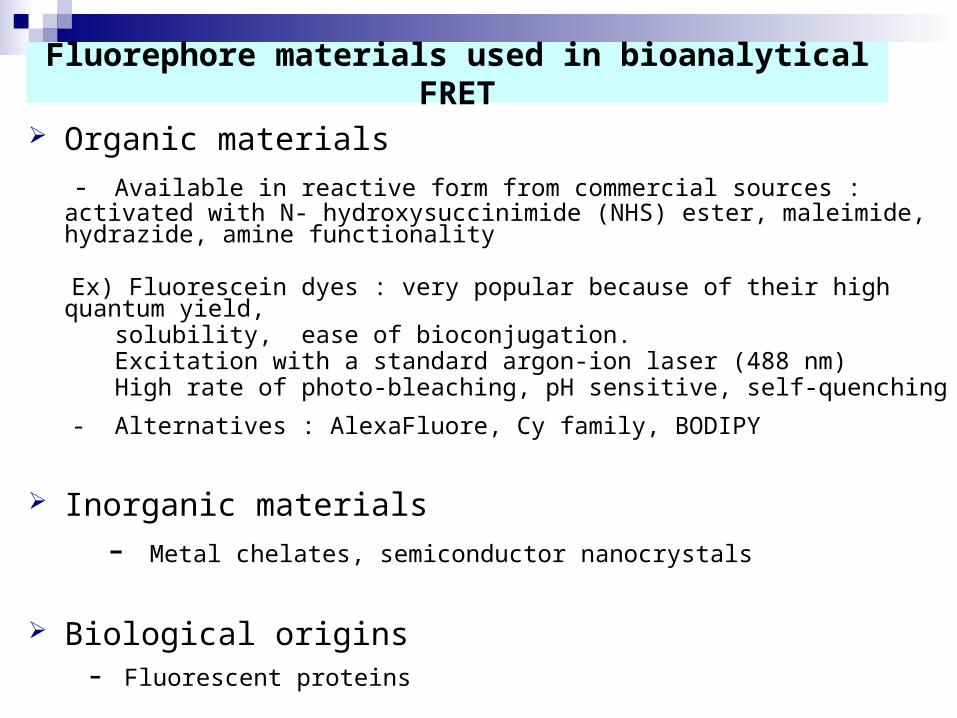
Fluorephore materials used in bioanalytical FRET
Organic materials - Available in reactive form from commercial sources : activated with N-
hydroxysuccinimide (NHS) ester, maleimide, hydrazide, amine functional-ity
Ex) Fluorescein dyes : very popular because of their high quantum yield, solubility, ease of bioconjugation. Excitation with a standard argon-ion laser (488 nm) High rate of photo-bleaching, pH sensitive, self-quenching
- Alternatives : AlexaFluore, Cy family, BODIPY
Inorganic materials
- Metal chelates, semiconductor nanocrystals
Biological origins - Fluorescent proteins
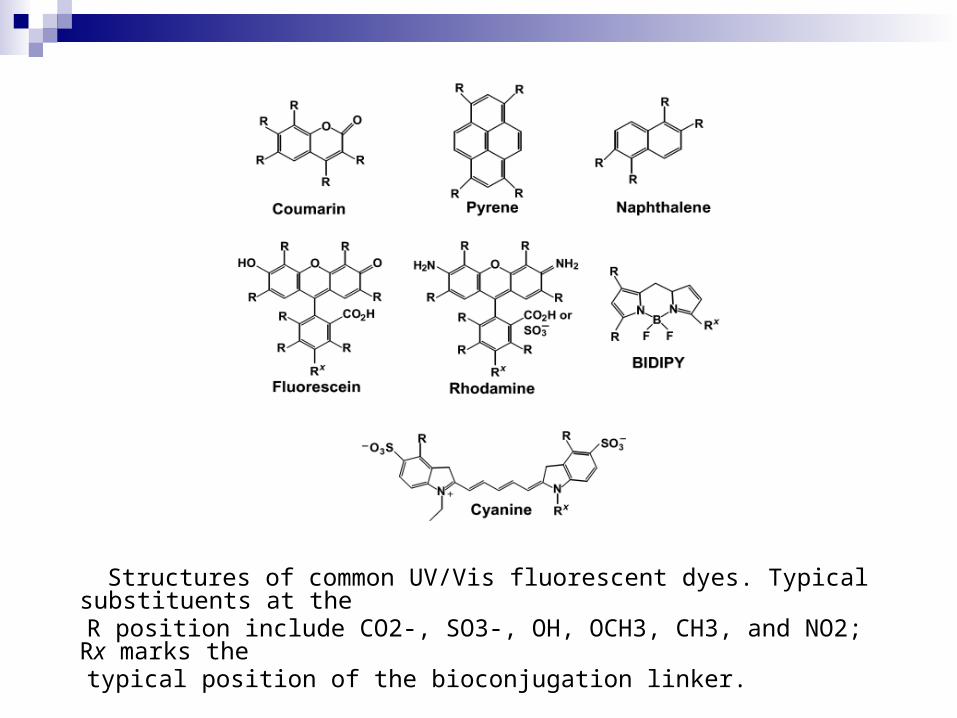
Structures of common UV/Vis fluorescent dyes. Typical substituents at the
R position include CO2-, SO3-, OH, OCH3, CH3, and NO2; Rx marks the
typical position of the bioconjugation linker.
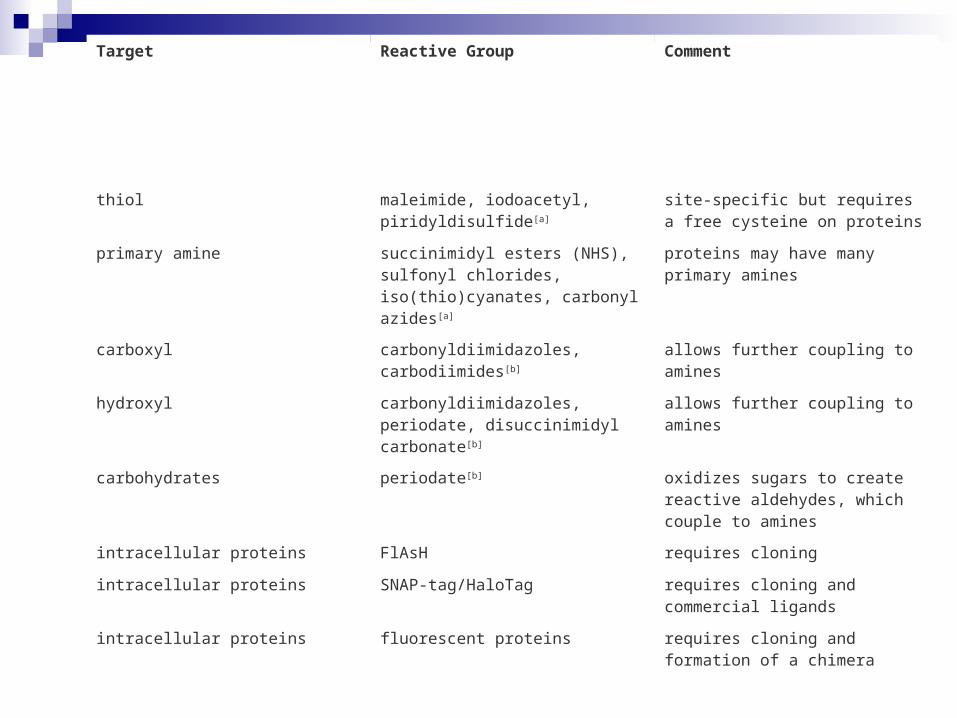
Target Reactive Group Comment
thiol maleimide, iodoacetyl, piridyld-isulfide[a]
site-specific but requires a free cysteine on proteins
primary amine succinimidyl esters (NHS), sul-fonyl chlorides, iso(thio)cyanates, carbonyl azides[a]
proteins may have many pri-mary amines
carboxyl carbonyldiimidazoles, carbodi-imides[b]
allows further coupling to amines
hydroxyl carbonyldiimidazoles, periodate, disuccinimidyl carbonate[b]
allows further coupling to amines
carbohydrates periodate[b] oxidizes sugars to create reac-tive aldehydes, which couple to amines
intracellular proteins FlAsH requires cloning
intracellular proteins SNAP-tag/HaloTag requires cloning and commercial ligands
intracellular proteins fluorescent proteins requires cloning and formation of a chimera
Experimental meth-ods
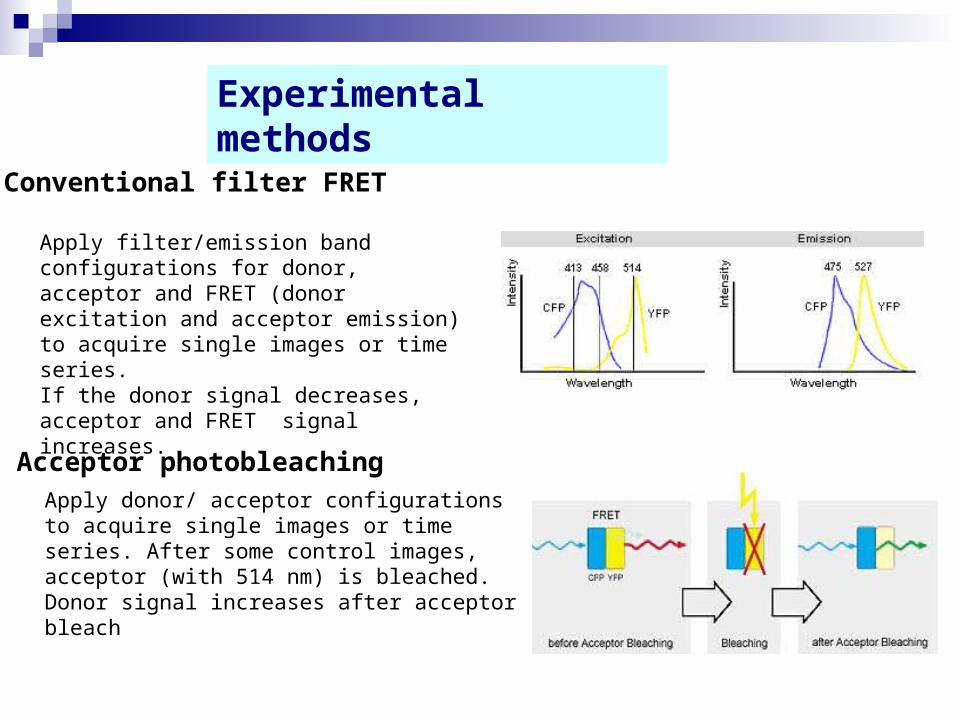
Conventional filter FRET
Apply filter/emission band configura-tions for donor, acceptor and FRET (donor excitation and acceptor emis-sion) to acquire single images or time series. If the donor signal decreases, acceptor and FRET signal increases.
Acceptor photobleaching
Apply donor/ acceptor configurations to ac-quire single images or time series. After some control images, acceptor (with 514 nm) is bleached. Donor signal increases af-ter acceptor bleach
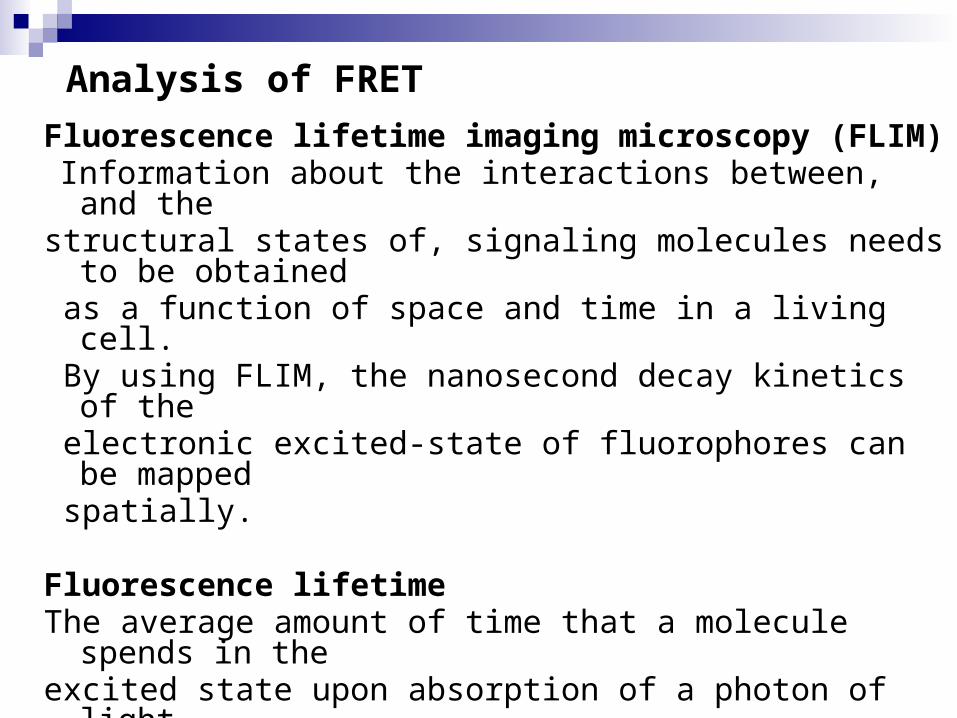
Fluorescence lifetime imaging microscopy (FLIM) Information about the interactions between, and the structural states of, signaling molecules needs to be
obtained as a function of space and time in a living cell. By using FLIM, the nanosecond decay kinetics of the electronic excited-state of fluorophores can be mapped spatially.
Fluorescence lifetime The average amount of time that a molecule spends in
theexcited state upon absorption of a photon of light.Fluorescence lifetime is independent of fluorophoreconcentration and light-path length.
Analysis of FRET
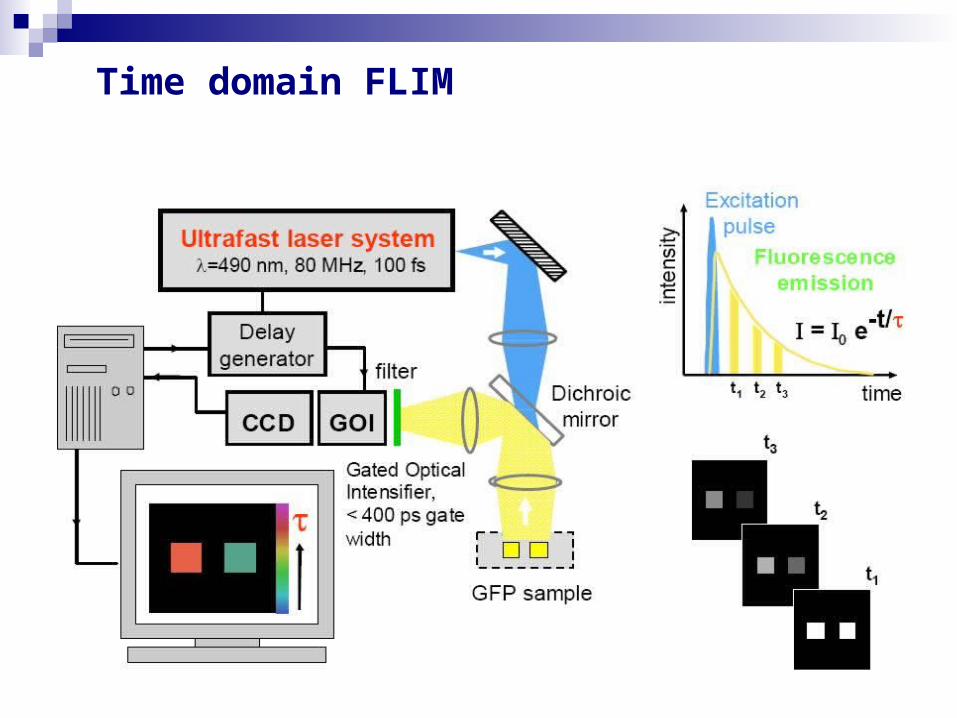
Time domain FLIM
Fluorescent pro-teins
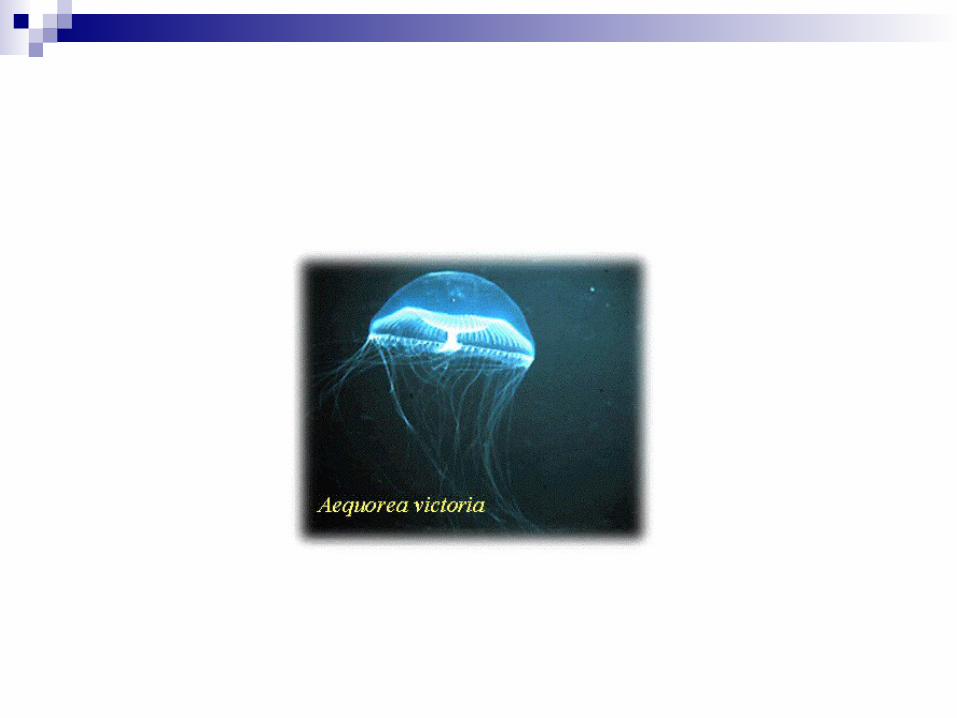
Green Fluorescence Protein (GFP) from jellyfish Widespread use by their expression in other organisms Key internal residues are modified during maturation to form the p-hydroxybenzylideneimidazolinon chromophore, located
in the central helix and surrounded by 11 ß-strands (ß-can structure)
In-vivo labeling of cells ; Localization and tracing of target pro-tein
GFP variants : BFP, CFP, YFP Red fluorescent protein (DS Red) from coral reef : tetrameric,
slow maturation Monomeric RFP by protein engineering Quantum yield : 0.17 (BFP) ~ 0.79 (GFP) BFP/CFP ; CFP/YFP( high change in the FRET signal ratio) : fused to N- or C terminus of proteins by gene manipulation
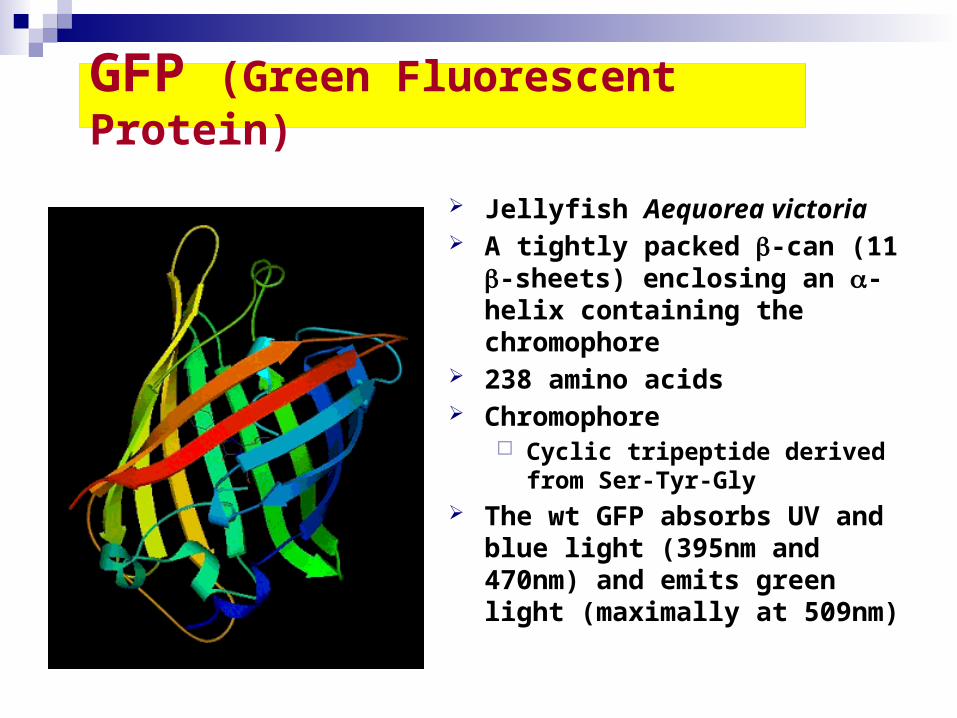
GFP (Green Fluorescent Protein)
Jellyfish Aequorea victoria A tightly packed --can (11
--sheets) enclosing an --he-lix containing the chro-mophore
238 amino acids Chromophore
Cyclic tripeptide derived from Ser-Tyr-Gly
The wt GFP absorbs UV and blue light (395nm and 470nm) and emits green light (maximally at 509nm)
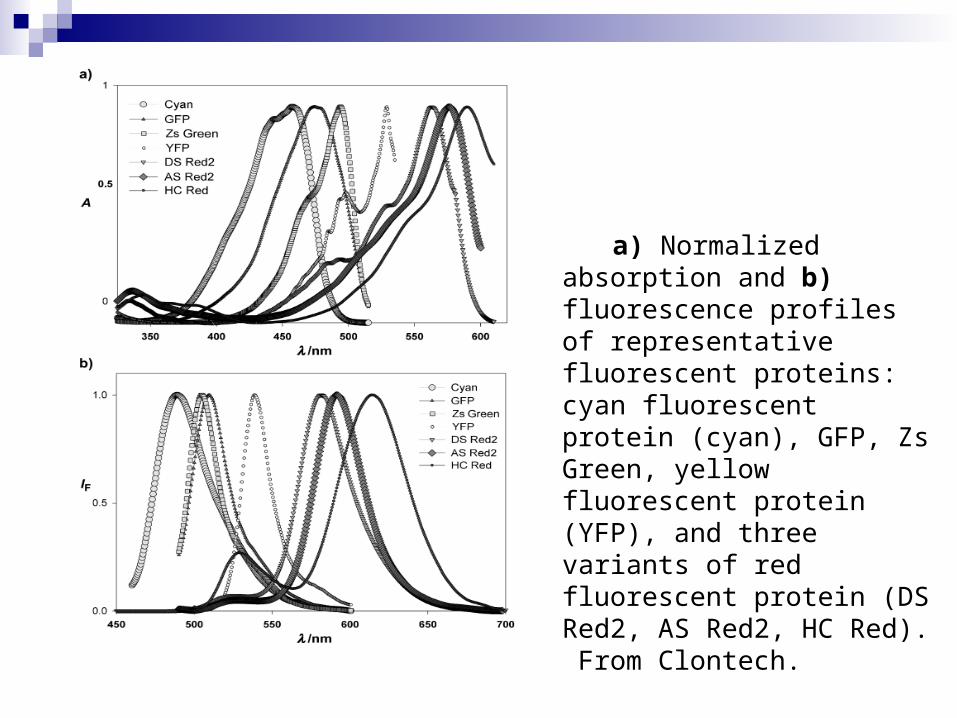
a) Normalized absorption and b) fluorescence pro-files of representative fluo-rescent proteins: cyan fluo-rescent protein (cyan), GFP, Zs Green, yellow fluo-rescent protein (YFP), and three variants of red fluo-rescent protein (DS Red2, AS Red2, HC Red). From Clontech.

Inter-molecular FRET
Analysis of biomolecular interactions using FP
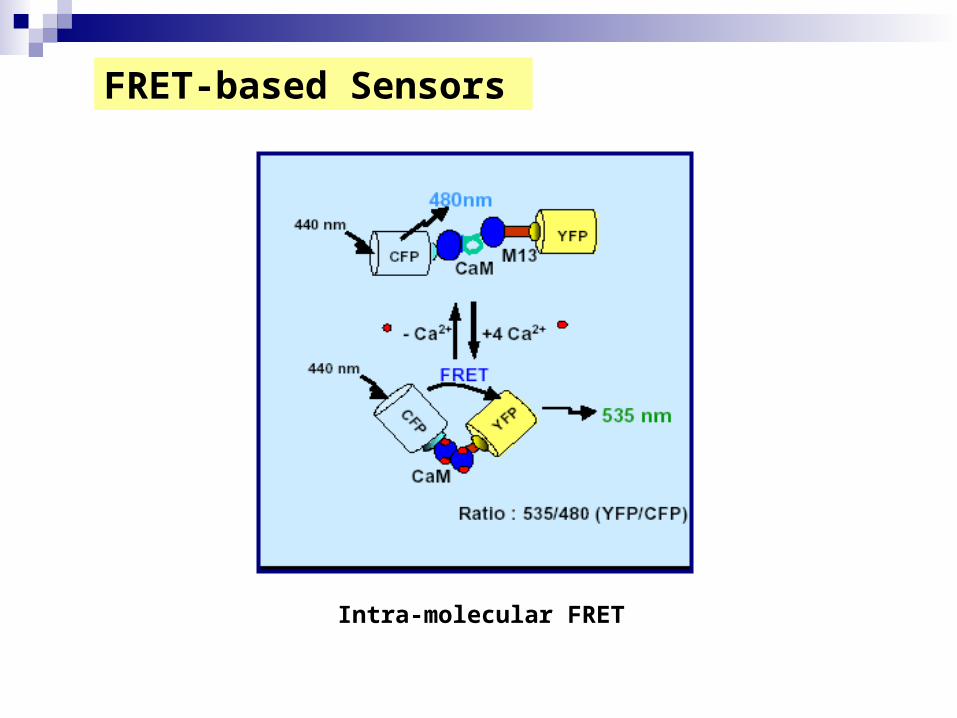
FRET-based Sen-sors
Intra-molecular FRET
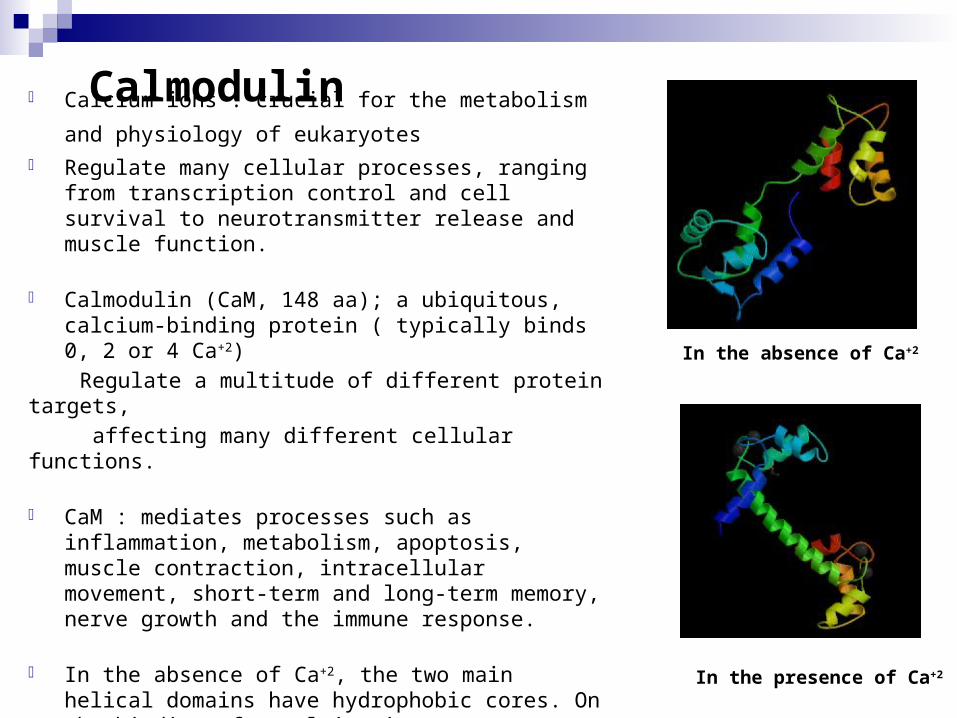
Calmod-ulin - Calcium ions : crucial for the metabolism and
physiology of eukaryotes - Regulate many cellular processes, ranging from
transcription control and cell survival to neuro-transmitter release and muscle function.
- Calmodulin (CaM, 148 aa); a ubiquitous, calcium-binding protein ( typically binds 0, 2 or 4 Ca+2)
Regulate a multitude of different protein targets, affecting many different cellular functions.
- CaM : mediates processes such as inflammation, metabolism, apoptosis, muscle contraction, intra-cellular movement, short-term and long-term memory, nerve growth and the immune response.
- In the absence of Ca+2, the two main helical do-mains have hydrophobic cores. On the binding of a calcium ion, conformational changes exposes hy-drophobic regions which have the potential to act as docking regions for target proteins ( over 100 proteins including kinases, phosphatases etc.)
In the absence of Ca+2
In the presence of Ca+2
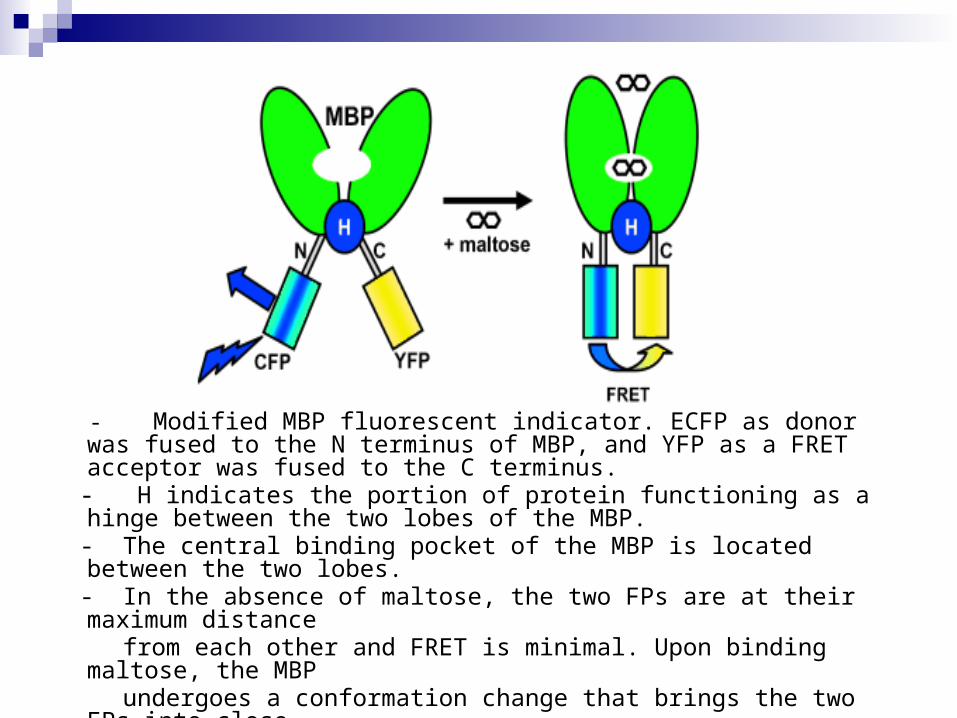
- Modified MBP fluorescent indicator. ECFP as donor was fused to the N terminus of MBP, and YFP as a FRET acceptor was fused to the C terminus.
- H indicates the portion of protein functioning as a hinge between the two lobes of the MBP.
- The central binding pocket of the MBP is located between the two lobes.
- In the absence of maltose, the two FPs are at their maximum dis-tance
from each other and FRET is minimal. Upon binding maltose, the MBP
undergoes a conformation change that brings the two FPs into close
proximity and increases FRET, which can be monitored by the change in
ratio of the YFP and CFP emission
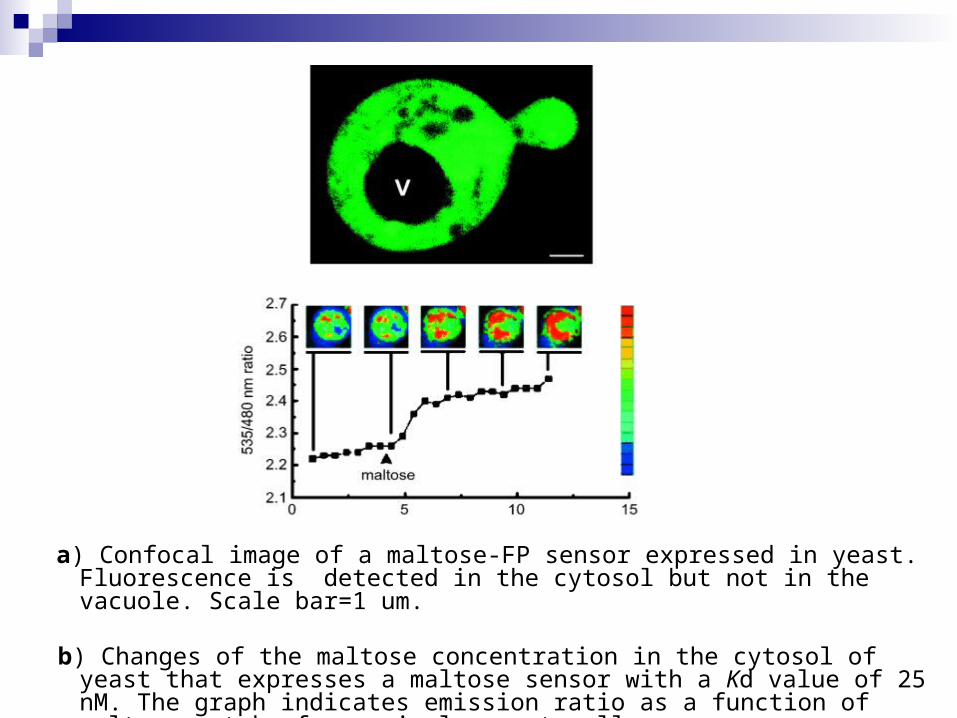
a) Confocal image of a maltose-FP sensor expressed in yeast. Fluores-cence is detected in the cytosol but not in the vacuole. Scale bar=1 um.
b) Changes of the maltose concentration in the cytosol of yeast that ex-
presses a maltose sensor with a Kd value of 25 nM. The graph indi-cates emission ratio as a function of maltose uptake for a single yeast cell.
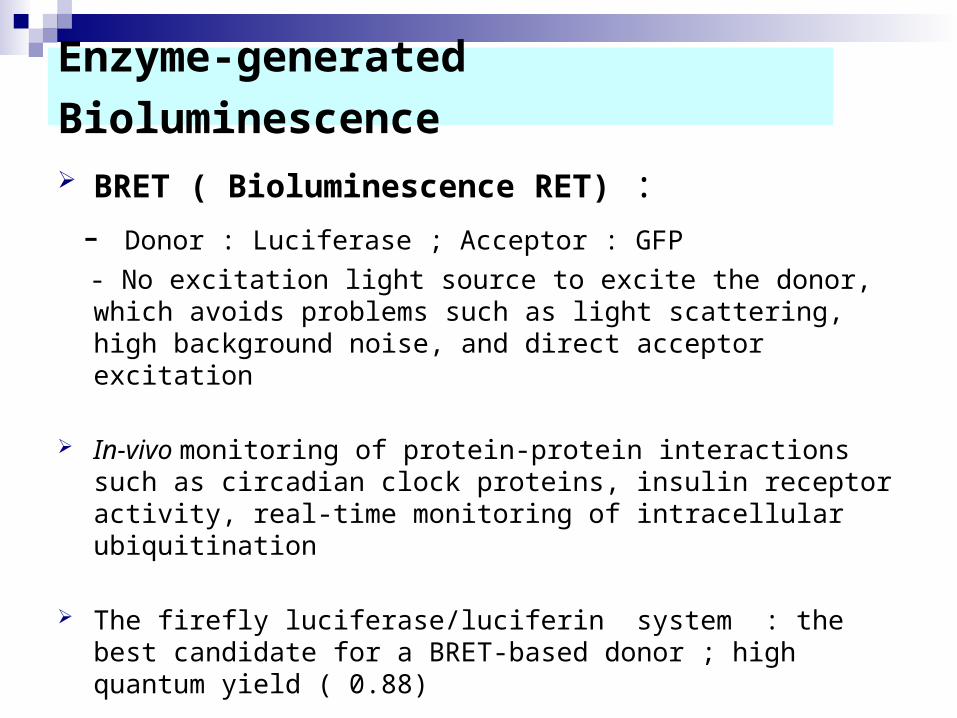
Enzyme-generated Biolumines-cence BRET ( Bioluminescence RET) : - Donor : Luciferase ; Acceptor : GFP
- No excitation light source to excite the donor, which avoids problems such as light scattering, high background noise, and direct acceptor excitation
In-vivo monitoring of protein-protein interactions such as cir-
cadian clock proteins, insulin receptor activity, real-time mon-itoring of intracellular ubiquitination
The firefly luciferase/luciferin system : the best candidate for a BRET-based donor ; high quantum yield ( 0.88)
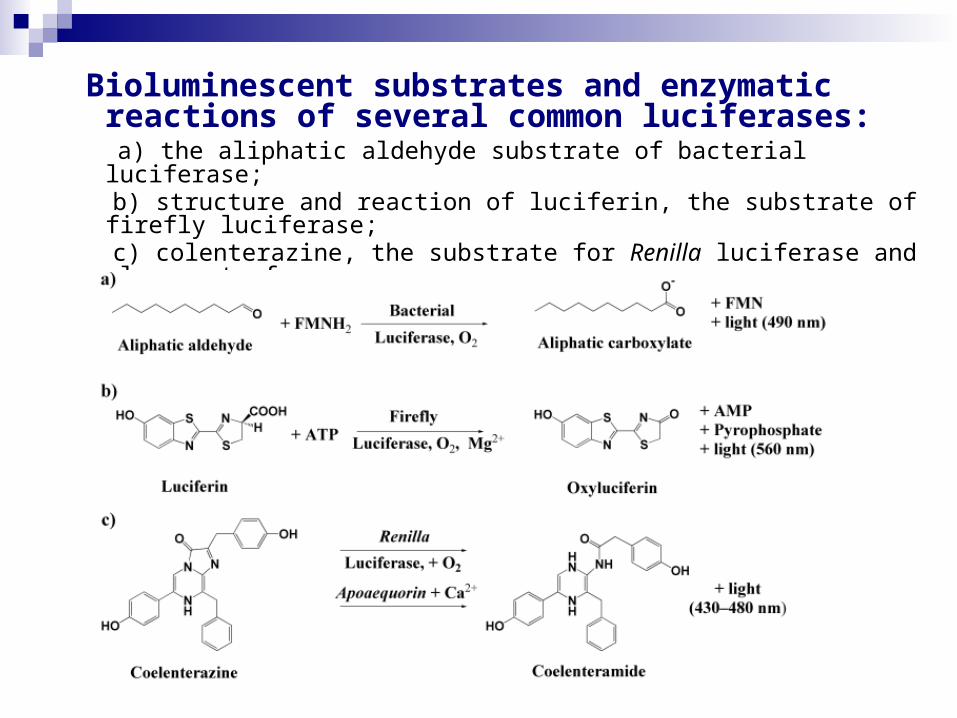
Bioluminescent substrates and enzymatic re-actions of several common luciferases:
a) the aliphatic aldehyde substrate of bacterial luciferase; b) structure and reaction of luciferin, the substrate of firefly lu-
ciferase; c) colenterazine, the substrate for Renilla luciferase and also part of apoaequorin.
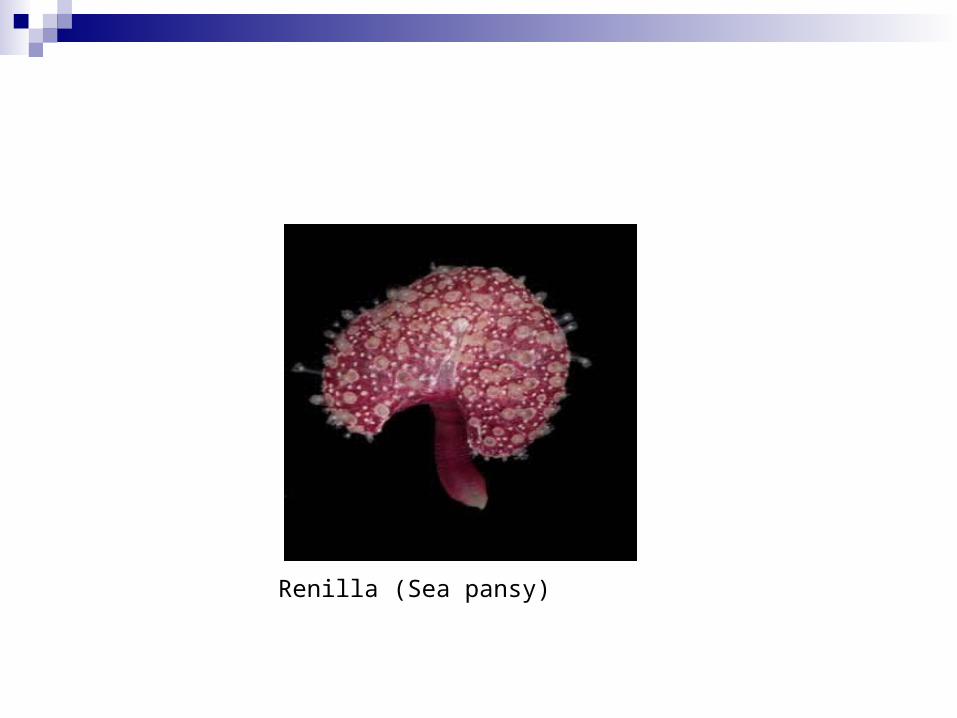
Renilla (Sea pansy)
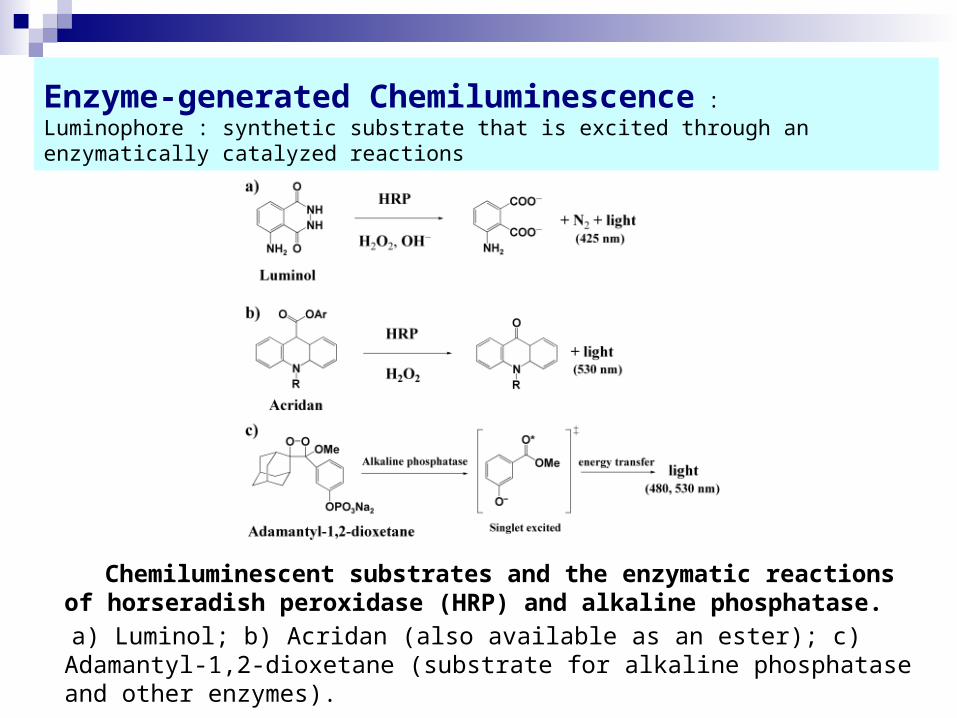
Enzyme-generated Chemiluminescence :Luminophore : synthetic substrate that is excited through an enzymatically cat-alyzed reactions
Chemiluminescent substrates and the enzymatic reactions of horseradish peroxidase (HRP) and alkaline phosphatase.
a) Luminol; b) Acridan (also available as an ester); c) Adamantyl-1,2-dioxetane (substrate for alkaline phosphatase and other enzymes).
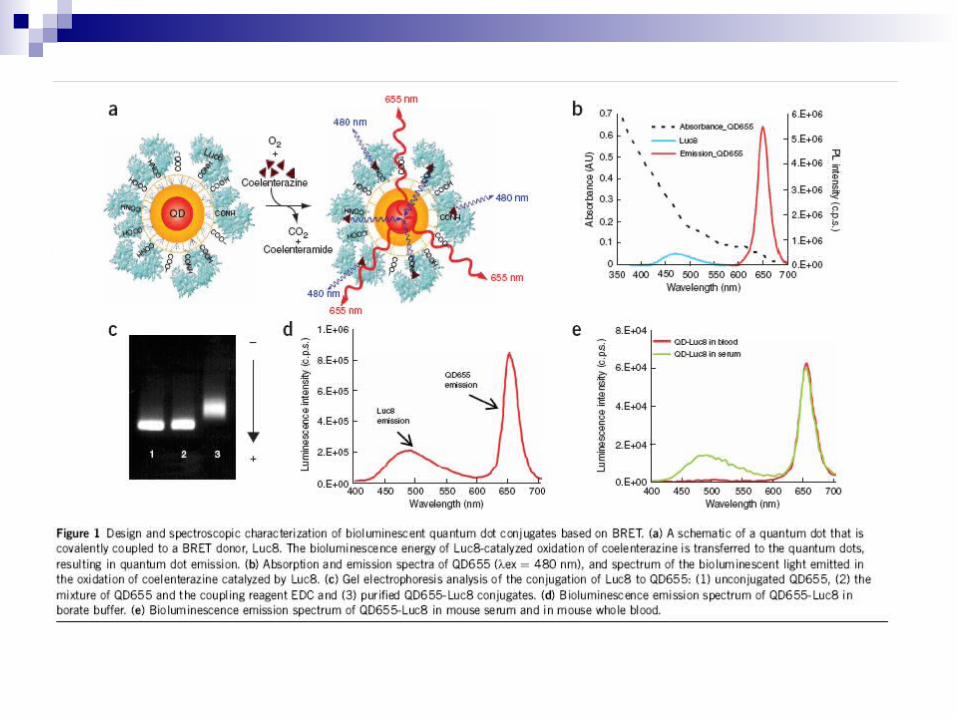
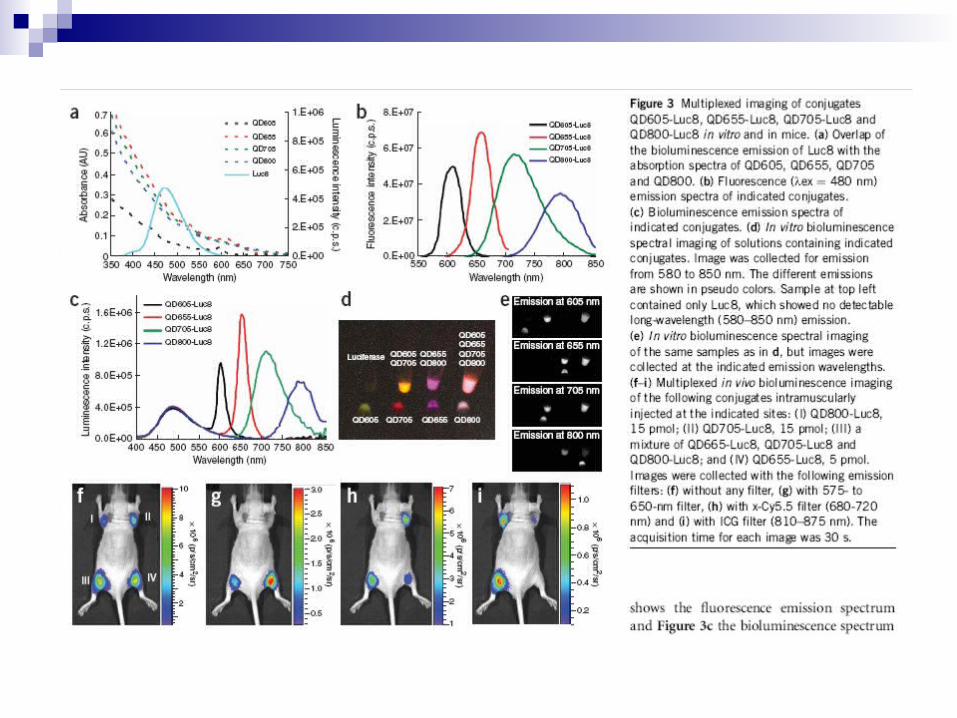
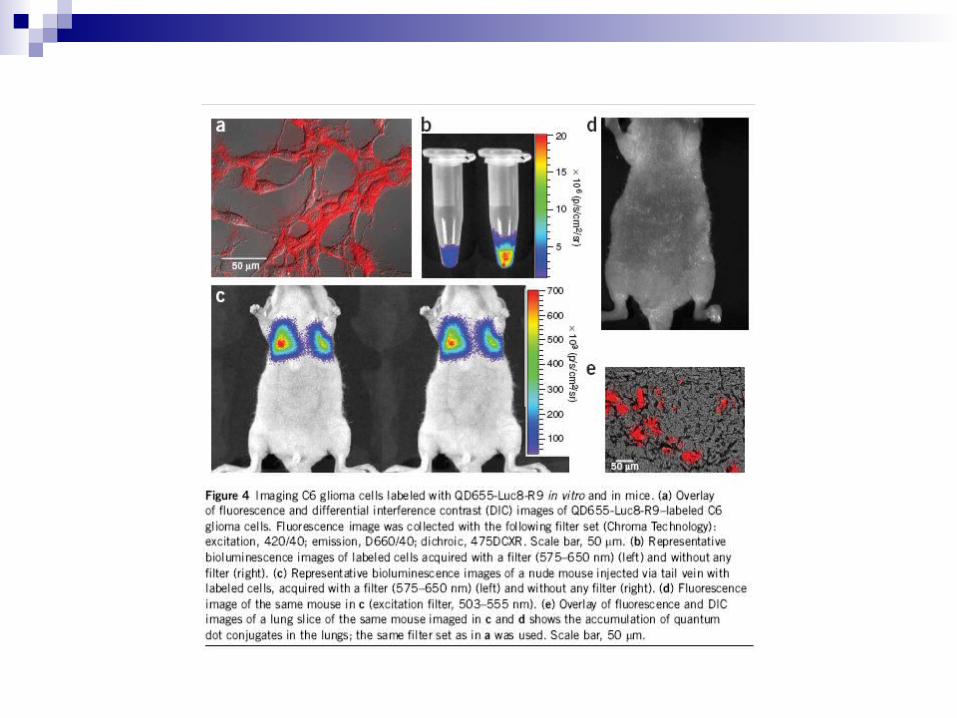
Self-illuminating quantum dot conjugates for in-vivo imaging
Unique optical property of Qd: - High quantum yields, large molar extinction coefficients, size-de-
pendent tunable emission and high photostability Fluorescent probes for biological imaging Challenging issues - Requirement for external illumination strong background auto-fluorescence from ubiquitous endoge-
nous chromophores such as collagen, porphyrins and flavins little light is available for quantum dot excitation at non-superfi-
cial locations due to absorption and scattering of optical photons in tissues Ideal quantum for in-vivo imaging - Light emission with no requirement for external excitation
Quantum dot conjugates based on the principle of BRET
So et al., Nature Biotech., 24, 339-343 (2006)
Construction of self-illuminating QDs conju-gates
Use of luciferase from Renilla reniformis Luc8 : Eight mutation variant : more stable in serum and
higher catalytic activity - emit blue light with a peak at 480 nm upon addition of its
substrate coelenterazine Conjugation of Luc8 to polymer-coated CdSe/ZnS core-shell
QD 655 through coupling of the amino groups on LUC8 to carboxylated on the QD
- The hydrodynamic diameter of QD655-Luc8 : ~ 2 nm - The conjugate contains six copies of Luc8 on average
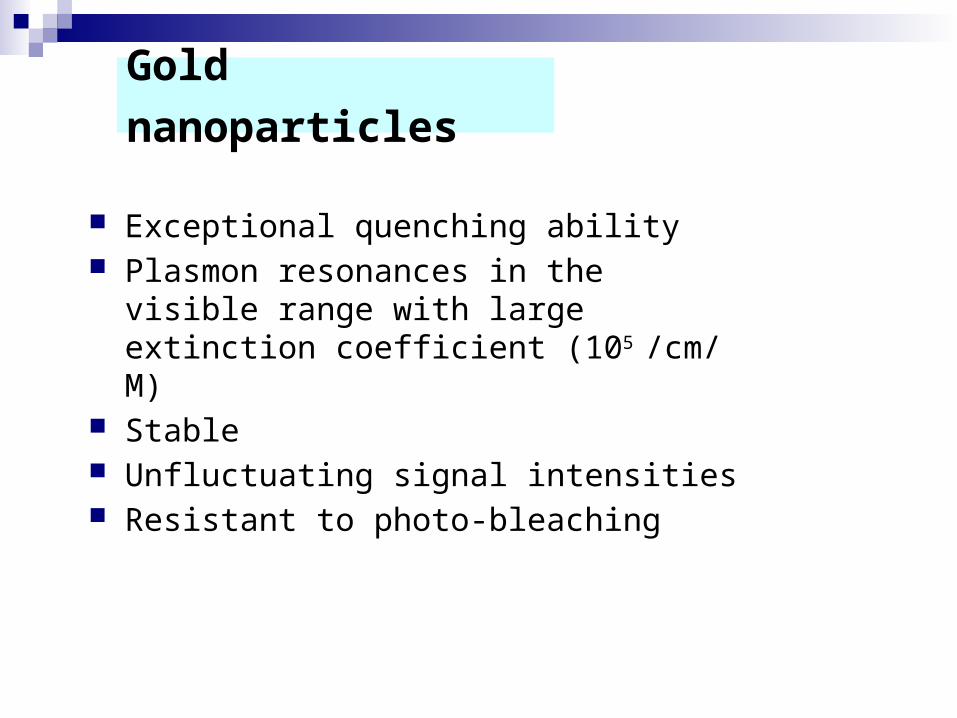
Gold nanoparti-cles
Exceptional quenching ability Plasmon resonances in the visible
range with large extinction coefficient (105 /cm/M)
Stable Unfluctuating signal intensities Resistant to photo-bleaching
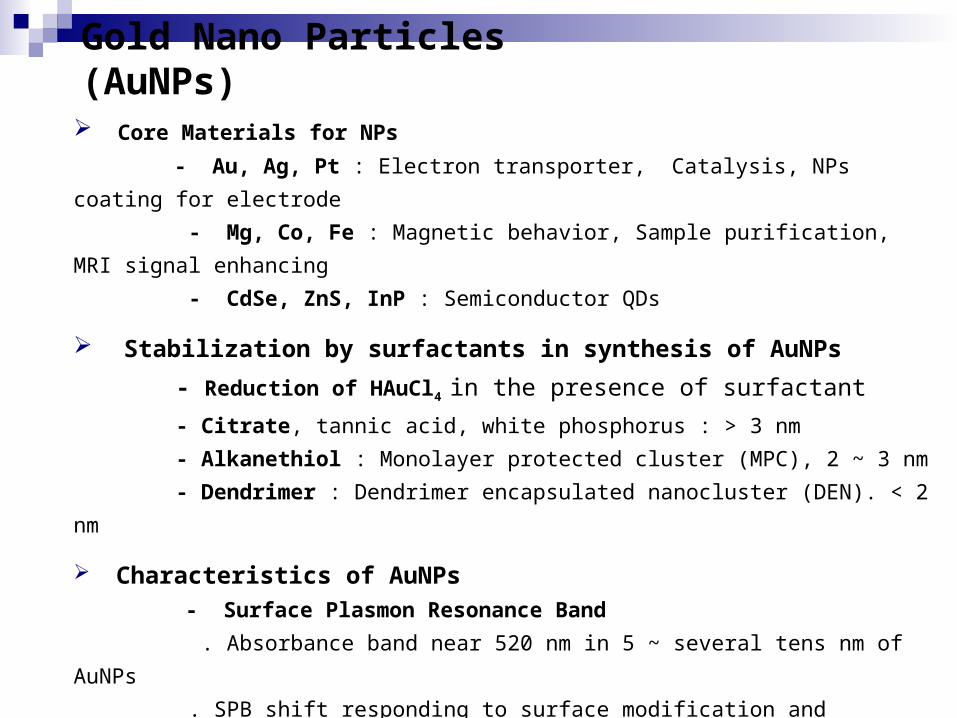
Gold Nano Particles (AuNPs) Core Materials for NPs
- Au, Ag, Pt : Electron transporter, Catalysis, NPs coating for electrode
- Mg, Co, Fe : Magnetic behavior, Sample purification, MRI signal enhanc-
ing
- CdSe, ZnS, InP : Semiconductor QDs
Stabilization by surfactants in synthesis of AuNPs
- Reduction of HAuCl4 in the presence of surfactant
- Citrate, tannic acid, white phosphorus : > 3 nm
- Alkanethiol : Monolayer protected cluster (MPC), 2 ~ 3 nm
- Dendrimer : Dendrimer encapsulated nanocluster (DEN). < 2 nm
Characteristics of AuNPs - Surface Plasmon Resonance Band
. Absorbance band near 520 nm in 5 ~ several tens nm of AuNPs
. SPB shift responding to surface modification and environmental condition
- Photoluminescence as Gold QDs
. <2nm of AuNPs : smaller Bohr radius than semiconductor
. Size dependent excitation/emission spectrum
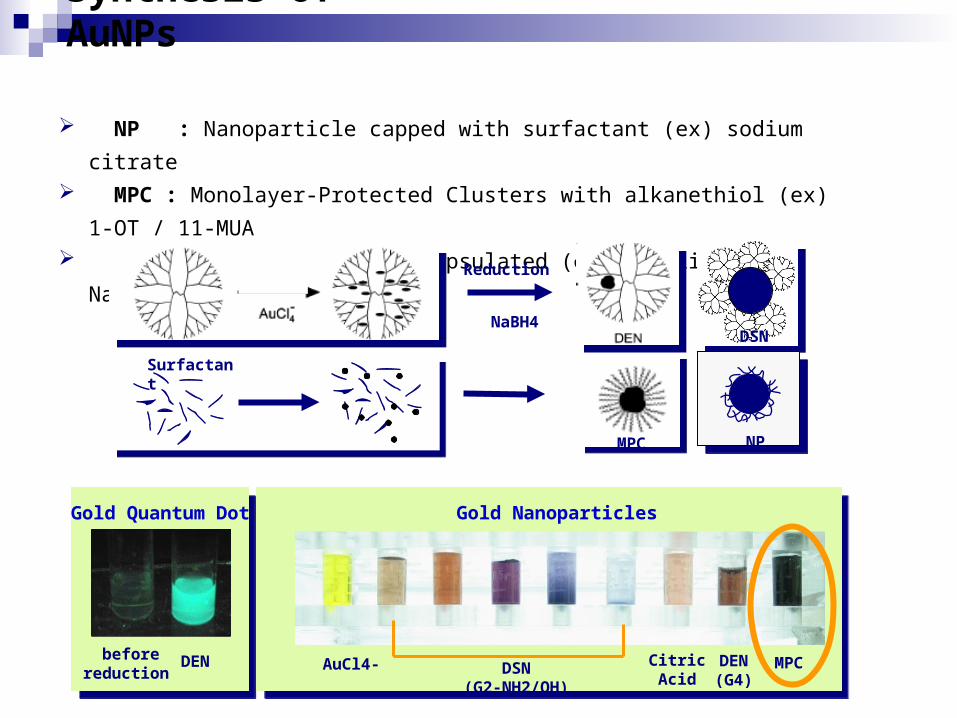
NP : Nanoparticle capped with surfactant (ex) sodium citrate MPC : Monolayer-Protected Clusters with alkanethiol (ex) 1-OT / 11-
MUA DEN / DSN : Dendrimer-Encapsulated (or Stabilized) Nanoclusters
Synthesis of AuNPs
DEN AuCl4- DSN(G2-NH2/OH)
CitricAcid
MPCDEN(G4)
beforereduction
Gold Quantum Dot Gold Nanoparticles
Reduction
Surfactant
NaBH4
MPC NP
DSN
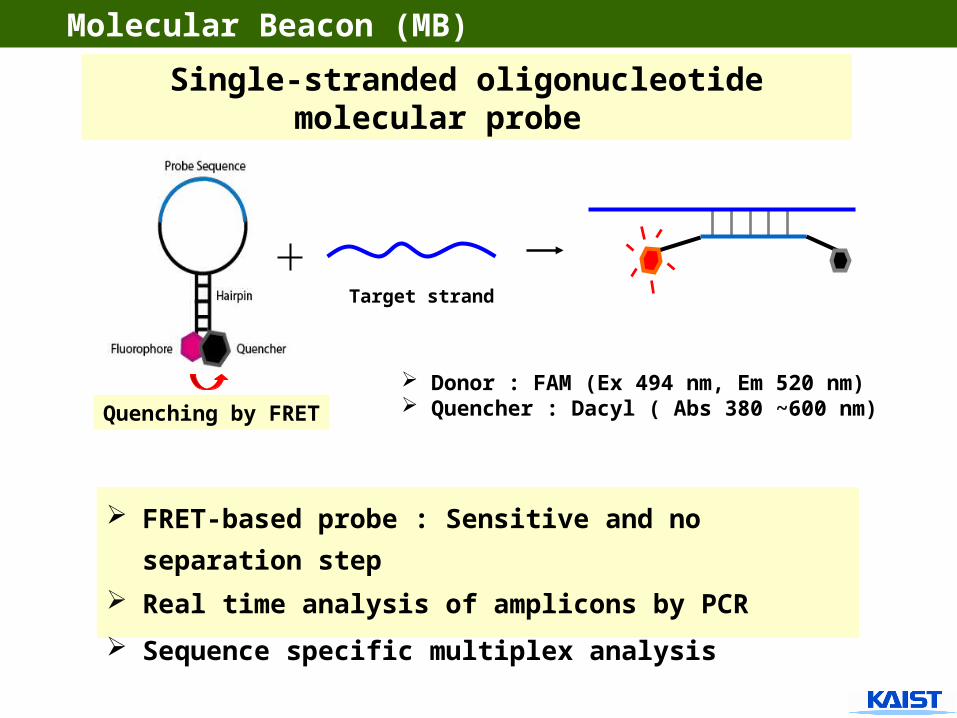
FRET-based probe : Sensitive and no separa-
tion step
Real time analysis of amplicons by PCR
Sequence specific multiplex analysis
Target strand
Quenching by FRET
Single-stranded oligonucleotide molecu-lar probe
Molecular Beacon (MB)
Donor : FAM (Ex 494 nm, Em 520 nm) Quencher : Dacyl ( Abs 380 ~600 nm)
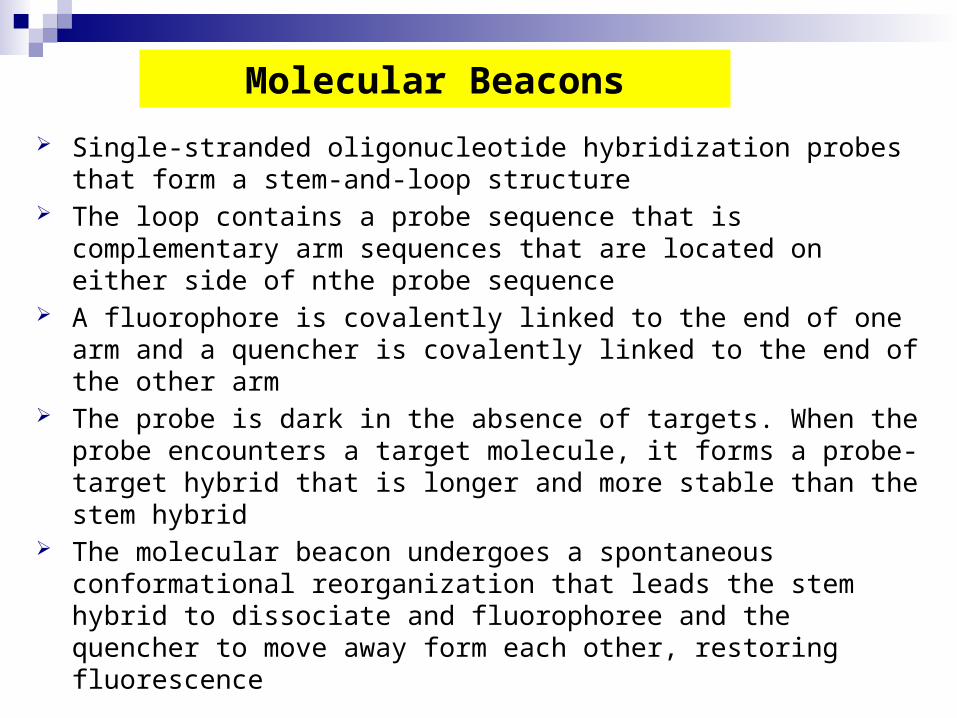
Molecular Beacons
Single-stranded oligonucleotide hybridization probes that form a stem-and-loop structure
The loop contains a probe sequence that is complementary arm sequences that are located on either side of nthe probe sequence
A fluorophore is covalently linked to the end of one arm and a quencher is covalently linked to the end of the other arm
The probe is dark in the absence of targets. When the probe encounters a target molecule, it forms a probe-target hybrid that is longer and more stable than the stem hybrid
The molecular beacon undergoes a spontaneous conforma-tional reorganization that leads the stem hybrid to dissociate and fluorophoree and the quencher to move away form each other, restoring fluorescence
Use : genetic screening, SNP detection, pharmacogenetic ap-plications
Diagnosis of acquired resistance in lung cancer using molecular beacons
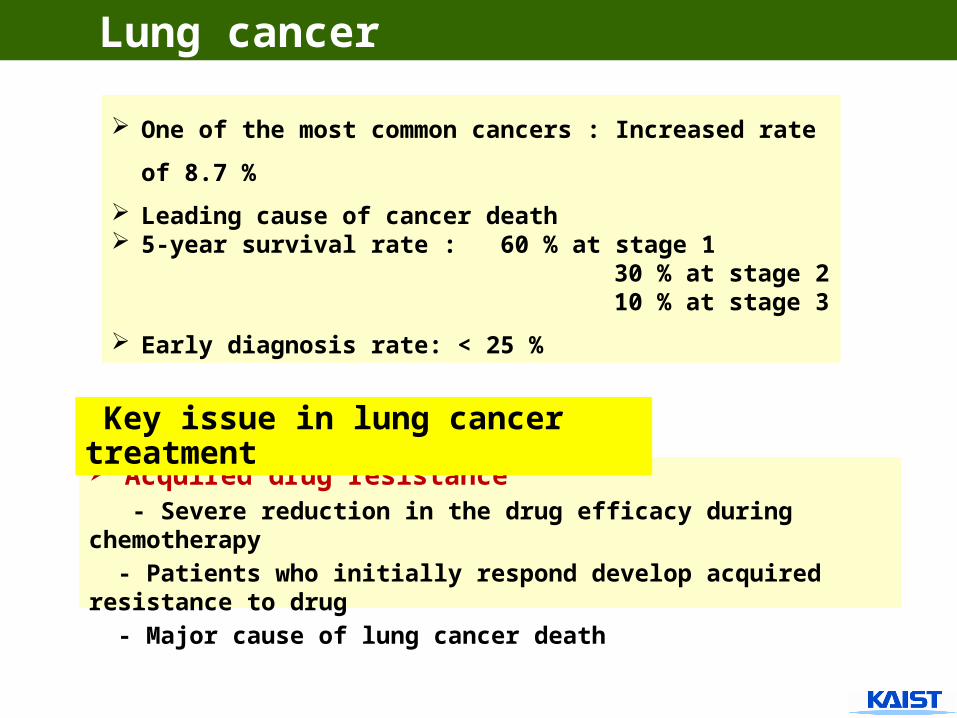
Acquired drug resistance - Severe reduction in the drug efficacy during chemo-therapy - Patients who initially respond develop acquired resis-tance to drug - Major cause of lung cancer death
One of the most common cancers : Increased rate
of 8.7 %
Leading cause of cancer death 5-year survival rate : 60 % at stage 1 30 % at stage 2 10 % at stage 3
Early diagnosis rate: < 25 %
Lung cancer
Key issue in lung cancer treatment
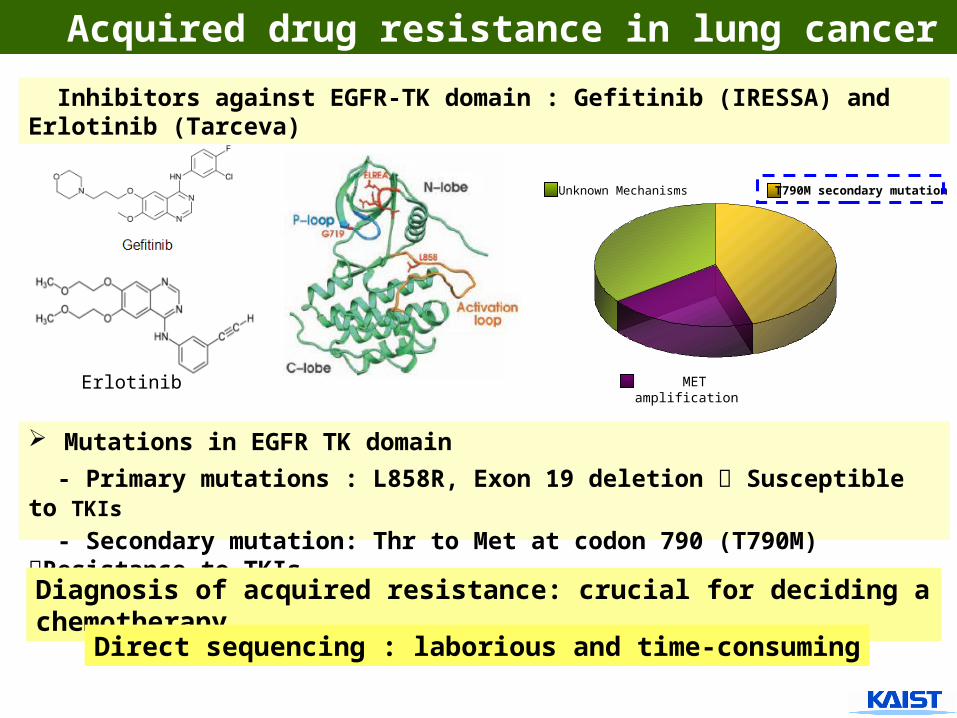
Mutations in EGFR TK domain
- Primary mutations : L858R, Exon 19 deletion Susceptible to TKIs
- Secondary mutation: Thr to Met at codon 790 (T790M) Resis-tance to TKIs
MET amplification
T790M secondary mutationUnknown Mechanisms
Acquired drug resistance in lung cancer
Diagnosis of acquired resistance: crucial for deciding a chemotherapy
Inhibitors against EGFR-TK domain : Gefitinib (IRESSA) and Er-lotinib (Tarceva)
Erlotinib
Direct sequencing : laborious and time-consuming
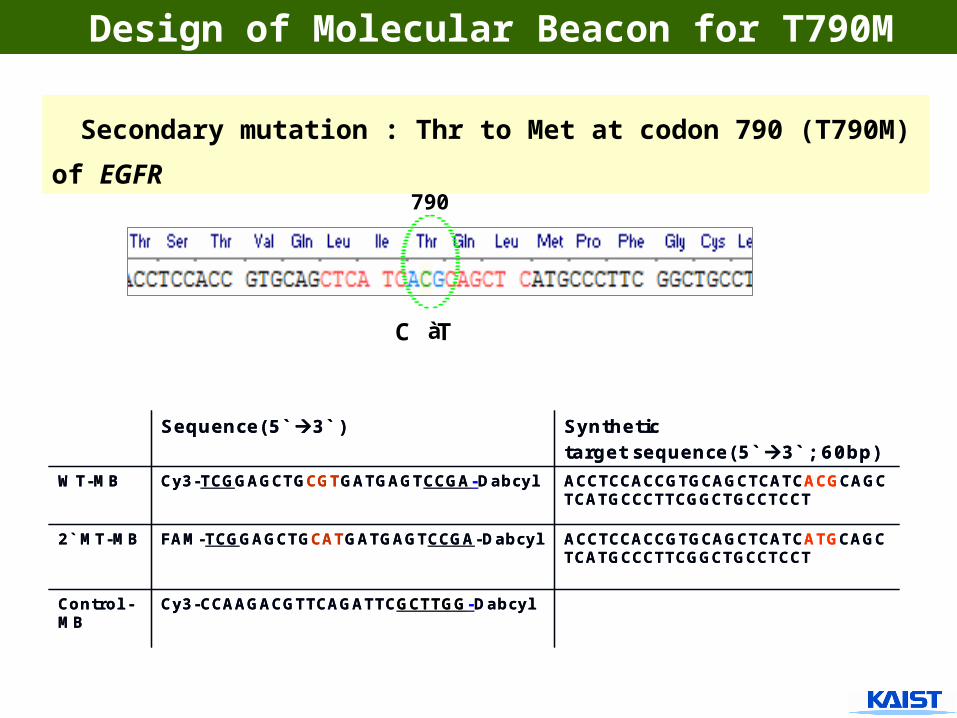
Design of Molecular Beacon for T790M
C àT
790
Secondary mutation : Thr to Met at codon 790 (T790M)
of EGFR
C T
ACCTCCACCGTGCAGCTCATCATGCAGCTCATGCCCTTCGGCTGCCTCCT
FAM-TCGGAGCTGCATGATGAGTCCGA-Dabcyl2` MT-MB
Cy3-CCAAGACGTTCAGATTCGCTTGG-DabcylControl -MB
ACCTCCACCGTGCAGCTCATCACGCAGCTCATGCCCTTCGGCTGCCTCCT
Cy3-TCGGAGCTGCGTGATGAGTCCGA-DabcylWT-MB
Synthetictarget sequence(5` 3` ; 60bp)
Sequence(5` 3` )
ACCTCCACCGTGCAGCTCATCATGCAGCTCATGCCCTTCGGCTGCCTCCT
FAM-TCGGAGCTGCATGATGAGTCCGA-Dabcyl2` MT-MB
Cy3-CCAAGACGTTCAGATTCGCTTGG-DabcylControl -MB
ACCTCCACCGTGCAGCTCATCACGCAGCTCATGCCCTTCGGCTGCCTCCT
Cy3-TCGGAGCTGCGTGATGAGTCCGA-DabcylWT-MB
Synthetictarget sequence(5` 3` ; 60bp)
Sequence(5` 3` )
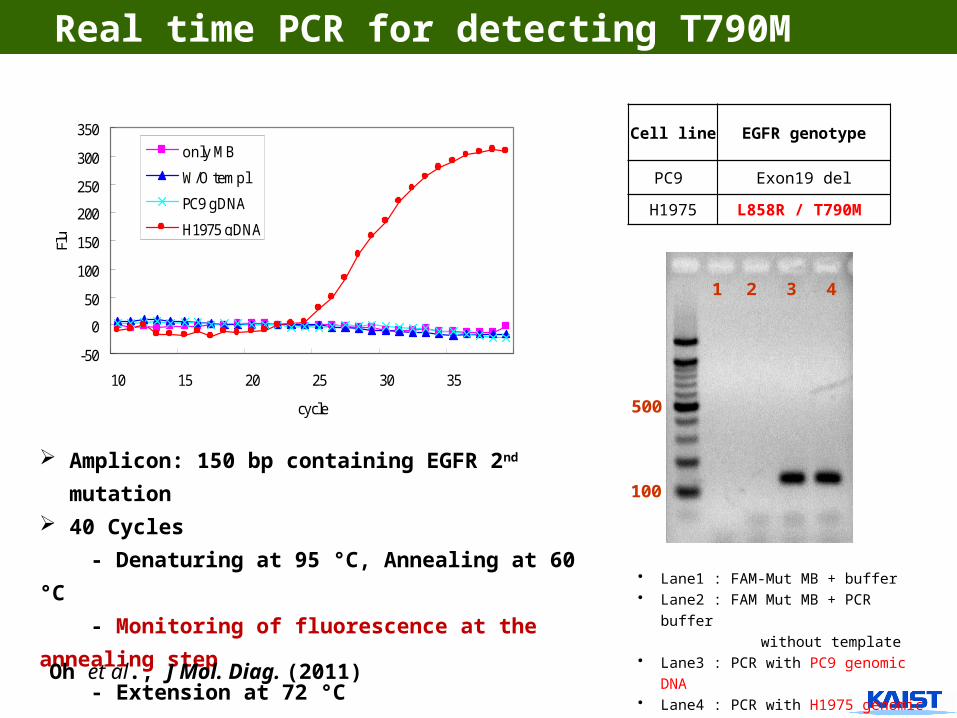
Real time PCR for detecting T790M
• Lane1 : FAM-Mut MB + buffer • Lane2 : FAM Mut MB + PCR buffer without template• Lane3 : PCR with PC9 genomic DNA • Lane4 : PCR with H1975 genomic
DNA
FAM-Mut1
-50
0
50
100
150
200
250
300
350
10 15 20 25 30 35
cycle
Flu
only MB
W/O templ
PC9 gDNA
H1975 gDNA
(A) (B)
100
500
1 2 3 4
Amplicon: 150 bp containing EGFR 2nd mu-
tation 40 Cycles
- Denaturing at 95 °C, Annealing at 60 °C
- Monitoring of fluorescence at the anneal-
ing step
- Extension at 72 °C
Cell line EGFR genotype
PC9 Exon19 del
H1975 L858R / T790M (A) (B)
100
500
1 2 3 4
Oh et al., J Mol. Diag. (2011)
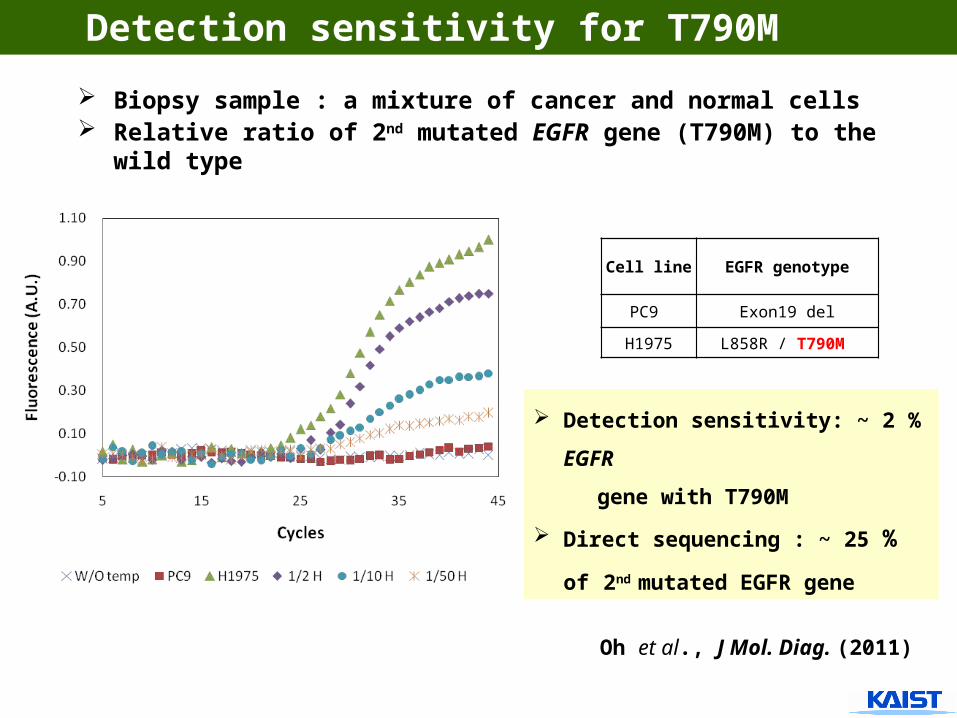
Detection sensitivity: ~ 2 %
EGFR
gene with T790M
Direct sequencing : ~ 25 % of
2nd mutated EGFR gene
Detection sensitivity for T790M
Biopsy sample : a mixture of cancer and normal cells Relative ratio of 2nd mutated EGFR gene (T790M) to the
wild type
Cell line EGFR genotype
PC9 Exon19 del
H1975 L858R / T790M
Oh et al., J Mol. Diag. (2011)
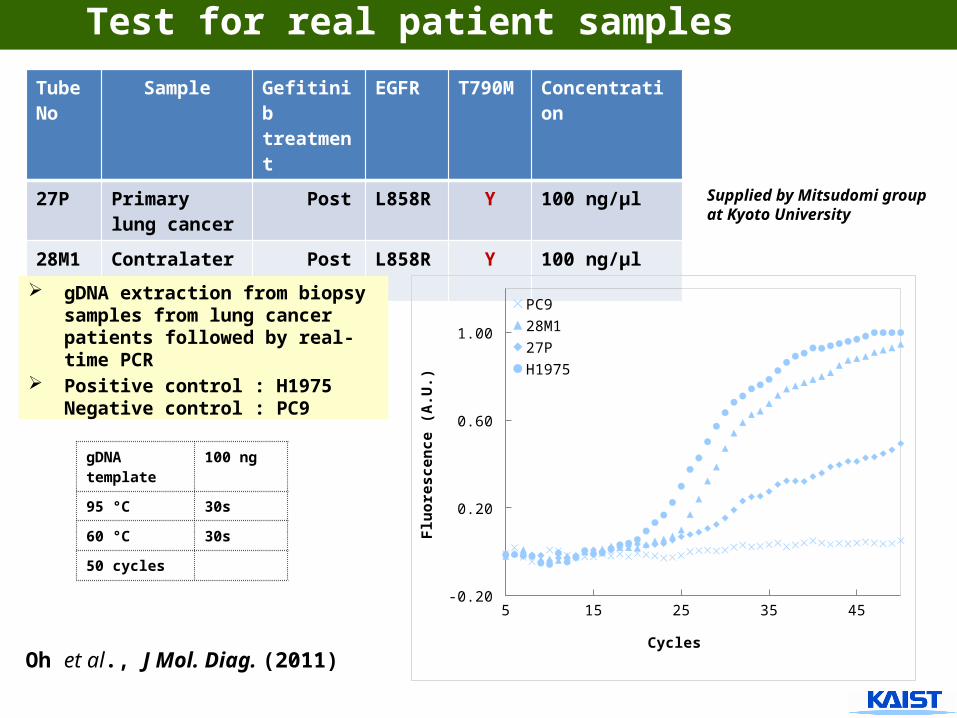
Test for real patient samples
Tube No
Sample Gefitinib treatment
EGFR T790M
Concentration
27P Primary lung cancer
Post L858R
Y 100 ng/μl
28M1
Contralateral lung
Post L858R
Y 100 ng/μl
gDNA tem-plate
100 ng
95 °C 30s
60 °C 30s
50 cycles
gDNA extraction from biopsy samples from lung cancer pa-tients followed by real-time PCR
Positive control : H1975Negative control : PC9
Supplied by Mitsudomi group at Kyoto Univer-sity
5 15 25 35 45-0.20
0.20
0.60
1.00
PC9
28M1
27P
H1975
Cycles
Flu
ore
scen
ce (
A.U
.)
Oh et al., J Mol. Diag. (2011)
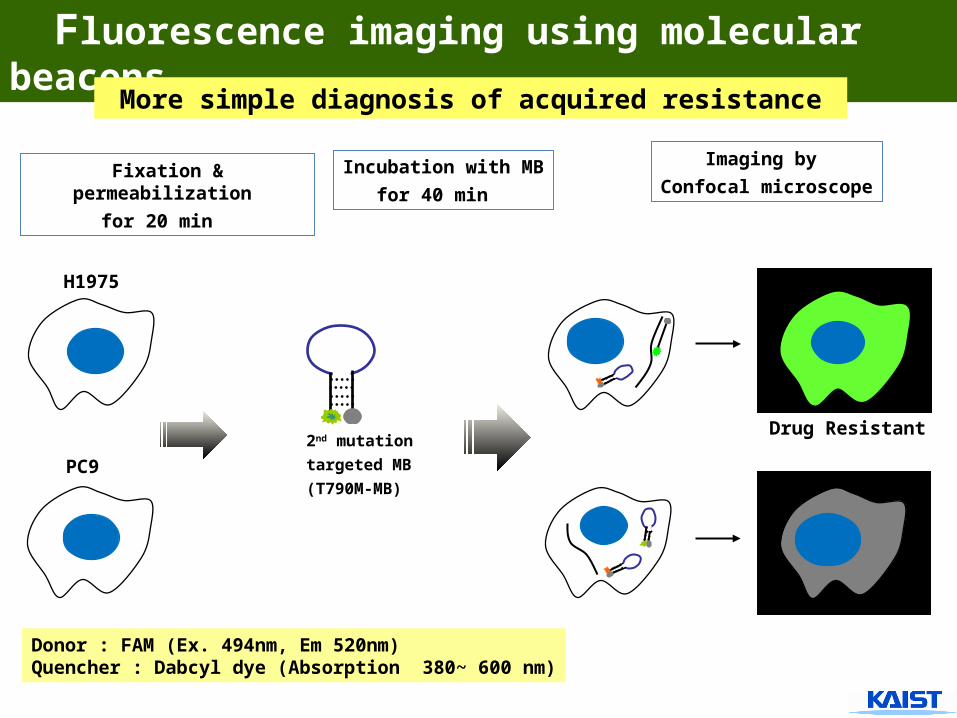
Fixation & permeabiliza-tion
for 20 min
Drug Resistant
Fluorescence imaging using molecular beacons
H1975
PC9
Incubation with MB
for 40 min
2nd mutation
targeted MB
(T790M-MB)
Imaging by
Confocal microscope
Donor : FAM (Ex. 494nm, Em 520nm) Quencher : Dabcyl dye (Absorption 380~ 600 nm)
More simple diagnosis of acquired resistance
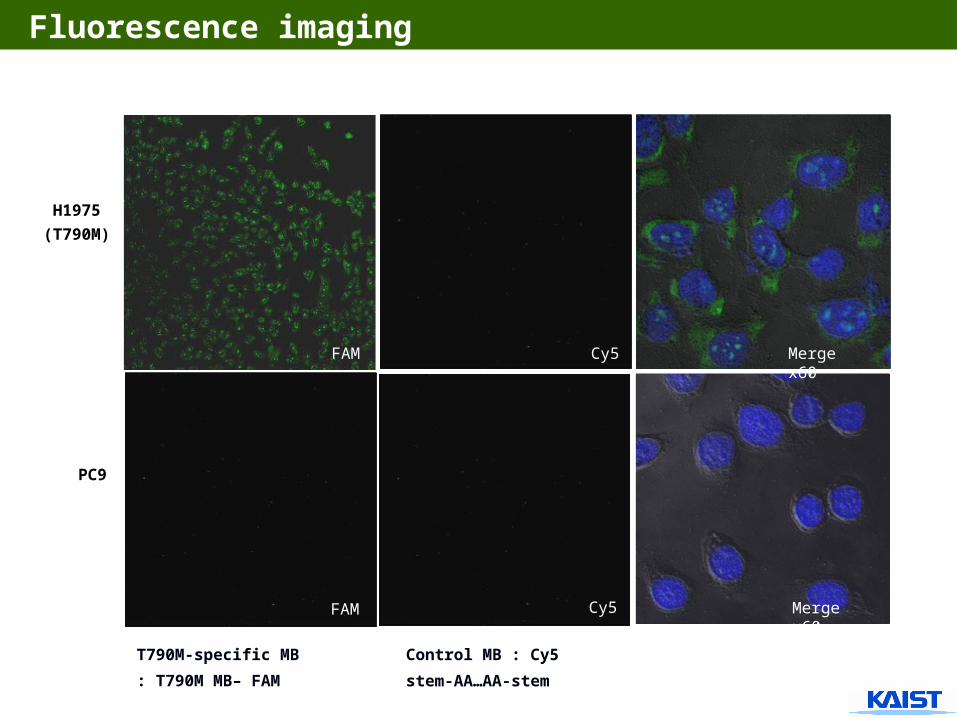
Cy5
Cy5
FAM
FAM
Merge x60
Merge x60
H1975
(T790M)
PC9
T790M-specific MB
: T790M MB– FAM
Control MB : Cy5
stem-AA…AA-stem
Fluorescence imaging
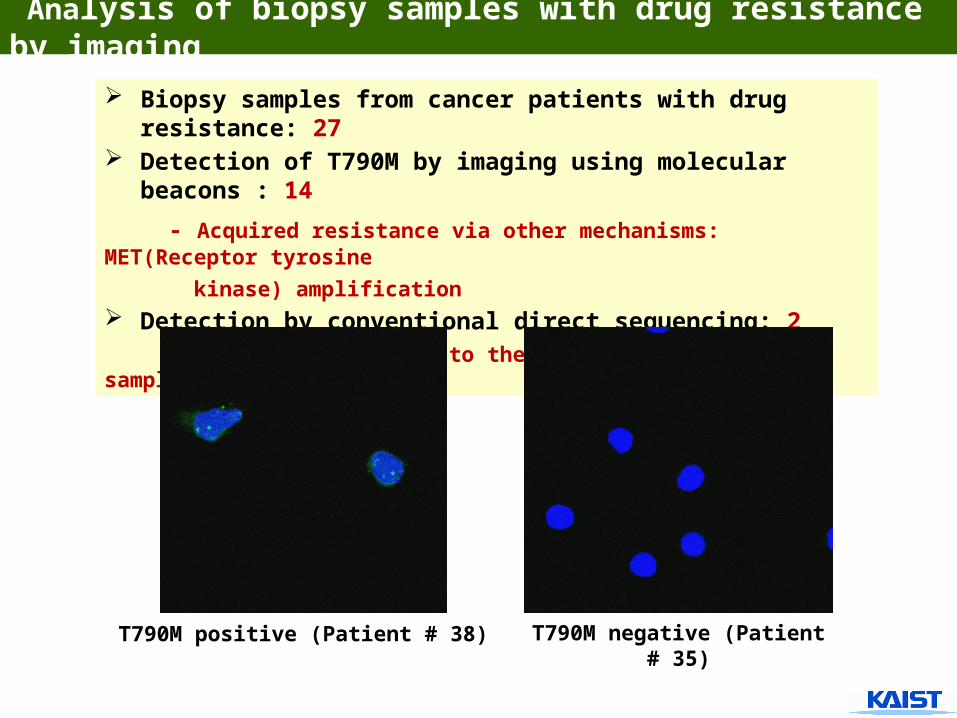
Analysis of biopsy samples with drug resistance by imaging
Biopsy samples from cancer patients with drug resis-tance: 27
Detection of T790M by imaging using molecular bea-cons : 14
- Acquired resistance via other mechanisms: MET(Receptor tyrosine
kinase) amplification Detection by conventional direct sequencing: 2 - Low sensitivity due to the normal cells in biopsy samples
T790M positive (Patient # 38) T790M negative (Patient # 35)
Proteolytic activity monitored by FRET between quantum dot and quencher
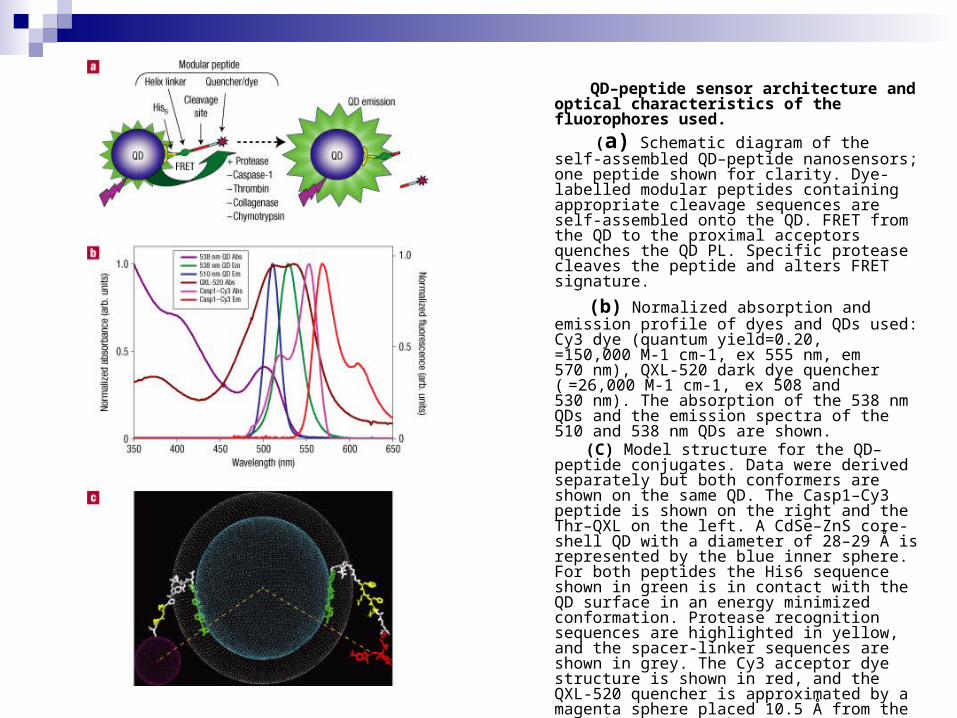
QD–peptide sensor architecture and optical character-istics of the fluorophores used.
(a) Schematic diagram of the self-assembled QD–peptide nanosensors; one peptide shown for clarity. Dye-labelled modular peptides containing appropriate cleavage se-quences are self-assembled onto the QD. FRET from the QD to the proximal acceptors quenches the QD PL. Spe-cific protease cleaves the peptide and alters FRET signa-ture.
(b) Normalized absorption and emission profile of dyes and QDs used: Cy3 dye (quantum yield=0.20, =150,000 M-1 cm-1, ex 555 nm, em 570 nm), QXL-520 dark dye quencher ( =26,000 M-1 cm-1, ex 508 and 530 nm). The absorption of the 538 nm QDs and the emission spectra of the 510 and 538 nm QDs are shown.
(C) Model structure for the QD–peptide conjugates. Data were derived separately but both conformers are shown on the same QD. The Casp1–Cy3 peptide is shown on the right and the Thr–QXL on the left. A CdSe–ZnS core-shell QD with a diameter of 28–29 Å is represented by the blue inner sphere. For both peptides the His6 se-quence shown in green is in contact with the QD surface in an energy minimized conformation. Protease recogni-tion sequences are highlighted in yellow, and the spacer-linker sequences are shown in grey. The Cy3 acceptor dye structure is shown in red, and the QXL-520 quencher is approximated by a magenta sphere placed 10.5 Å from the cysteine S atom. The centre-to-centre distance deter-mined from FRET efficiencies are 55 Å for the QD–Casp1–Cy3 (R0=54 Å) and 56 Å for QD–Thr–QXL (R0=43 Å). The second grey shell represents the DHLA ligand cap whose maximum lateral extension away from the QD surface can vary between 5 and 11 Å; 10 Å is shown here.
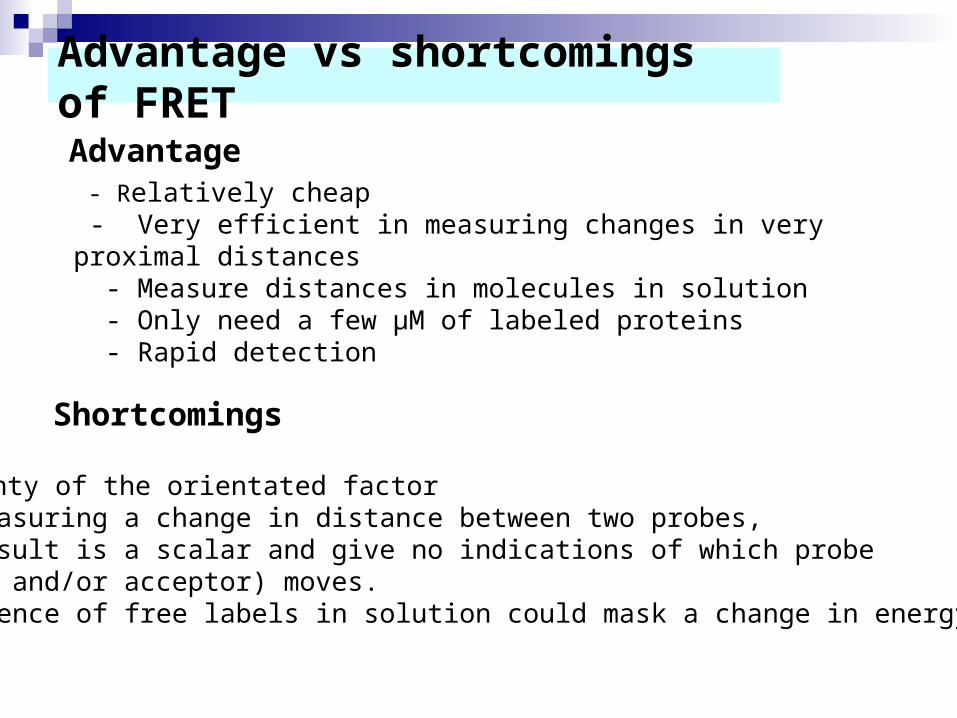
Advantage vs shortcomings of FRET
Advantage - Relatively cheap - Very efficient in measuring changes in very proximal distances - Measure distances in molecules in solution - Only need a few µM of labeled proteins - Rapid detection
Shortcomings
- Uncertainty of the orientated factor - When measuring a change in distance between two probes, the result is a scalar and give no indications of which probe (donor and/or acceptor) moves. - The presence of free labels in solution could mask a change in energy transfer.
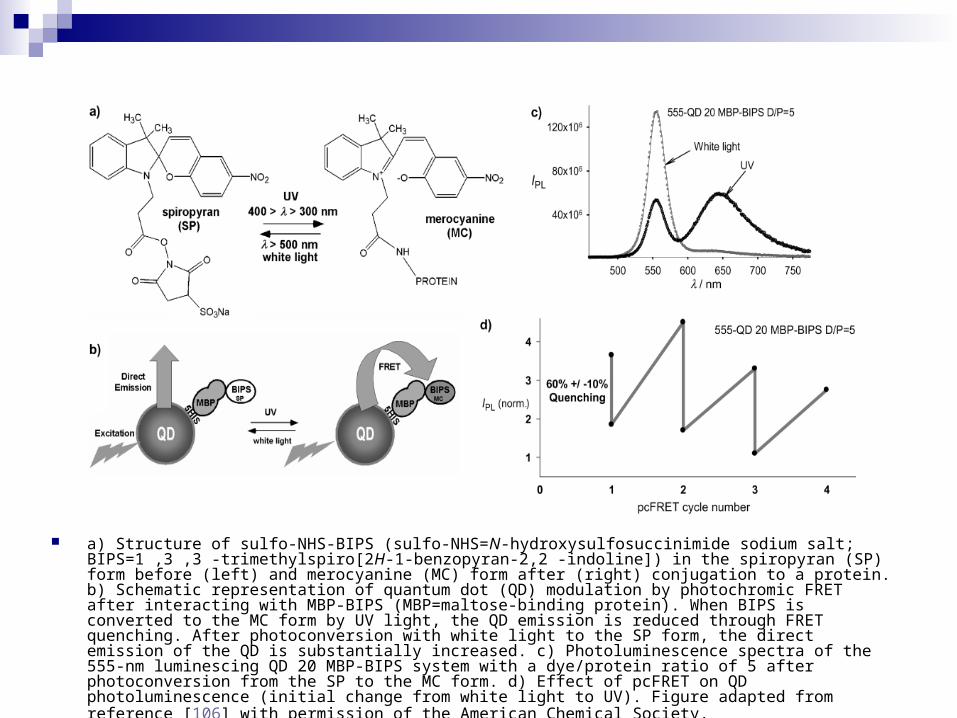
a) Structure of sulfo-NHS-BIPS (sulfo-NHS=N-hydroxysulfosuccinimide sodium salt; BIPS=1 ,3 ,3 -trimethylspiro[2H-1-benzopyran-2,2 -indoline]) in the spiropyran (SP) form before (left) and merocyanine (MC) form after (right) conjugation to a protein. b) Schematic representation of quantum dot (QD) modulation by photochromic FRET after interacting with MBP-BIPS (MBP=maltose-binding protein). When BIPS is converted to the MC form by UV light, the QD emission is reduced through FRET quenching. After photoconversion with white light to the SP form, the direct emission of the QD is substan-tially increased. c) Photoluminescence spectra of the 555-nm luminescing QD 20 MBP-BIPS system with a dye/protein ratio of 5 after photoconversion from the SP to the MC form. d) Effect of pcFRET on QD photoluminescence (initial change from white light to UV). Figure adapted from reference [106] with permission of the American Chemical Society.


![Resonant dipole–dipole interaction in confined and strong ...john/john/RDDI in... · coherently or incoherently [5]. In the incoherent Forster energy transfer, the dipole oscillators](https://static.documents.pub/doc/80x56/6041d1aad5c05d122c4a8027/resonant-dipoleadipole-interaction-in-confined-and-strong-johnjohnrddi-in.jpg)


![Low-energy dipole response of exotic nuclei · energy close to twice the excitation energy of the GDR [3]. The question of how the dipole response of a nucleus changes when going](https://static.documents.pub/doc/80x56/60676b1c2682cd14d905d2dc/low-energy-dipole-response-of-exotic-nuclei-energy-close-to-twice-the-excitation.jpg)