H. Rahardjo, T.T. Lee, E.C. Leong, and R.B. Rezaur
Abstract: Rainfall-induced landslides are a common problem in residual soil slopes of the tropics. It is widely knownthat rainfall-induced slope failures are mainly caused by infiltration of rainwater; however, the response of a residualsoil slope to infiltration is not fully understood. The difficulties lie in the quantification of the flux boundary conditionacross the slope surface with respect to infiltration and its effect on the pore-water pressure conditions in the slope.Therefore, it is important to understand the response of a slope to different rainfall conditions and the resultingchanges in pore-water pressures and water contents. A residual soil slope in Singapore was instrumented with pore-water pressure, water content, and rainfall measuring devices, and studies were carried out under natural and simulatedrainfalls. Results indicate that significant infiltration may occur in a residual soil slope during a rainfall. Small totalrainfalls can contribute a larger infiltration percentage than large total rainfalls. The percentage of infiltration usuallydecreases with increasing total rainfalls. The study has indicated the existence of a threshold rainfall of about 10 mmfor runoff generation to commence. Infiltration during wet periods may lead to the development of positive pore-waterpressures as a consequence of a perched water table condition. Matric suctions are recovered gradually during dry peri-ods due to redistribution. Soil water contents tend to be higher near the toe of the slope than at the crest irrespectiveof rainfall events, indicating subsurface movement of water in the downslope direction. The study has also indicated acorrelation between rainfall amount and relative increase in pore-water pressure. The results can be used to quantify theflux boundary conditions required for the seepage analyses associated with rainfall-induced slope failures.
Résumé : Les glissements de terrain induits par la pluie sont un problème courant dans les talus des sols résiduels destropiques. Il est généralement connu que les ruptures de talus induites par la pluie sont principalement causées parl’infiltration d’eau; cependant, la réaction à l’infiltration d’un talus de sol résiduel n’est pas vraiment bien comprise.Les difficultés se situent au niveau de la quantification de la condition à la limite de l’écoulement en travers de la sur-face du talus par rapport à l’infiltration, et des conditions de la pression interstitielle dans le talus. En conséquence, ilest important de comprendre la réaction du talus aux différentes conditions de pluie et aux changements résultants despressions interstitielles et des teneurs en eau. On a instrumenté un talus de sol résiduel à Singapour pour mesurer lapression interstitielle, la teneur en eau et les chutes de pluie, et on a réalisé des études dans des conditions naturelleset simulées de pluies. Les résultats indiquent qu’une infiltration appréciable peut se produire dans un talus de sol rési-duel au cours d’une chute de pluie. De petites chutes de pluie isolées peuvent contribuer à un pourcentage d’infiltrationplus grand que des chutes de pluie isolées plus importantes. Habituellement, le pourcentage d’infiltration diminue avecl’augmentation des chutes de pluies isolées. L’étude a indiqué que l’existence d’un seuil de chute de pluie d’environ10 mm est requis pour que le ruissellement commence à être généré. Durant les périodes humides, l’infiltration peutconduire au développement de pressions interstitielles positives par suite d’une condition de nappe d’eau perchée. Lessuccions matricielles sont récupérées graduellement au cours des périodes sèches à cause de la redistribution. Les te-neurs en eau tendent à être plus élevées près du pied du talus qu’à la crête indépendamment des événements de pluie,ce qui indique qu’il y a un migration de l’eau souterraine en direction du pied du talus. L’étude a aussi indiqué qu’il ya une corrélation entre la quantité de pluie et l’accroissement relatif de la pression interstitielle. Les résultats peuventêtre utilisés pour quantifier les conditions à la limite de l’écoulement requises pour les analyses de réseauxd’écoulement associés aux ruptures de talus induites par la pluie.
Mots clés : infiltration, pression interstitielle, teneur en eau, sol résiduel, ruptures de talus induites par la pluie.
[Traduit par la Rédaction] Rahardjo et al. 351
Introduction
A number of studies have demonstrated that slope failurescan be attributed to several factors such as climatic condi-
tions, geological features, topography, and vegetation or to acombination of these factors (e.g., Ost et al. 2003; Basile etal. 2003). These factors and their contribution to slope insta-bility vary with geographical location. In the tropical and
Received 13 February 2003. Accepted 10 September 2004. Published on the NRC Research Press Web site at http://cgj.nrc.ca on1 April 2005.
H. Rahardjo,1 T.T. Lee, E.C. Leong, and R.B. Rezaur. NTU-PWD Geotechnical Research Centre, School of Civil andEnvironmental Engineering, Nanyang Technological University, Blk N1, Nanyang Avenue, Singapore 639798.
subtropical regions where the groundwater table is usuallydeep, residual soils frequently exist in an unsaturated condi-tion, and shallow landslides often occur due to heavy rainfall(Lim et al. 1996; Toll et al. 1999).
Infiltration of rainwater into a residual soil slope may im-pair slope stability by changing the pore-water pressure inthe soil which in turn controls the water content of the soil.Usually unsaturated residual soils experience high matricsuction (i.e., negative pore-water pressure) during dry peri-ods, which contributes to the shear strength of the residualsoil. During prolonged wet periods when there is sufficientinfiltration into the slope, the matric suction of the soil de-creases, and this in turn results in an increase in the soilwater content. As a result, the additional shear strength pro-vided by the matric suction can be reduced enough to triggera shallow landslide (Fredlund and Rahardjo 1993; Rahardjoet al. 1995).
Numerical simulations of rainwater infiltration and subse-quent slope instability have been investigated in many stud-ies (e.g., Cheng 1997; Gasmo et al. 2000; Cho and Lee2001; Tsaparas et al. 2002; Ng et al. 2003). The applicationof seepage and slope stability analyses requires an under-standing of the infiltration amount and its contribution to thewater content, pore-water pressure changes in the slope con-trolled by the soil physical properties, and climatic condi-tions. Therefore, it is of primary importance to study,through field measurements, the variation in infiltration,water content, and pore-water pressures (i.e., variation inresponse) of a residual soil slope with respect to changes inthe climatic conditions. With an understanding of the mecha-nism and the effect of rainwater infiltration into a residualsoil slope, a reasonable procedure can be developed forslope stability analysis under transient seepage due to rain-fall. This procedure is of interest to geotechnical engineersin finding preventive measures against rainfall-induced slopefailures. There appear to be few studies, however, that exam-ine through field measurements the physical process of rain-water infiltration into a residual soil slope and thecontribution of the infiltrated rainwater on soil water contentand pore-water pressure changes which control the stabilityof a slope.
The primary focus of this study is therefore (i) to examinechanges in infiltration, runoff, soil water content, and pore-water pressures in a residual soil slope subjected to variousrainfall conditions; and (ii) to identify the infiltration charac-teristics, particularly the amount of infiltration for a givenrainfall.
Theory
The characteristics of water flow, pore-water pressurechanges, and shear strength of soils are the main parametersassociated with rainfall-induced slope failures in unsaturatedsoils, and these parameters are directly affected by the fluxboundary condition (infiltration, evaporation) at the soil-atmosphere interface. The effect of infiltration on water flowthrough an unsaturated soil can be realized from unsaturatedsoil mechanics theories. The governing equation for the flowof water through an isotropic unsaturated soil can be formu-lated using Darcy’s law as follows (Fredlund and Rahardjo1993):
[1]∂∂
∂∂
∂∂
∂∂
ρ ∂∂x
khx y
khy
m ght
ww
ww w
ww⎛
⎝⎜⎞⎠⎟
+⎛
⎝⎜
⎞
⎠⎟ = 2
in which hw is the hydraulic head and is defined by
[2] h z u gw w w= + /ρ
where z is the elevation head; uw is the pore-water pressure;x and y are the cartesian coordinates in the x and y direc-tions, respectively; kw is the hydraulic conductivity; ρw is thedensity of water; g is the gravitational acceleration; m2
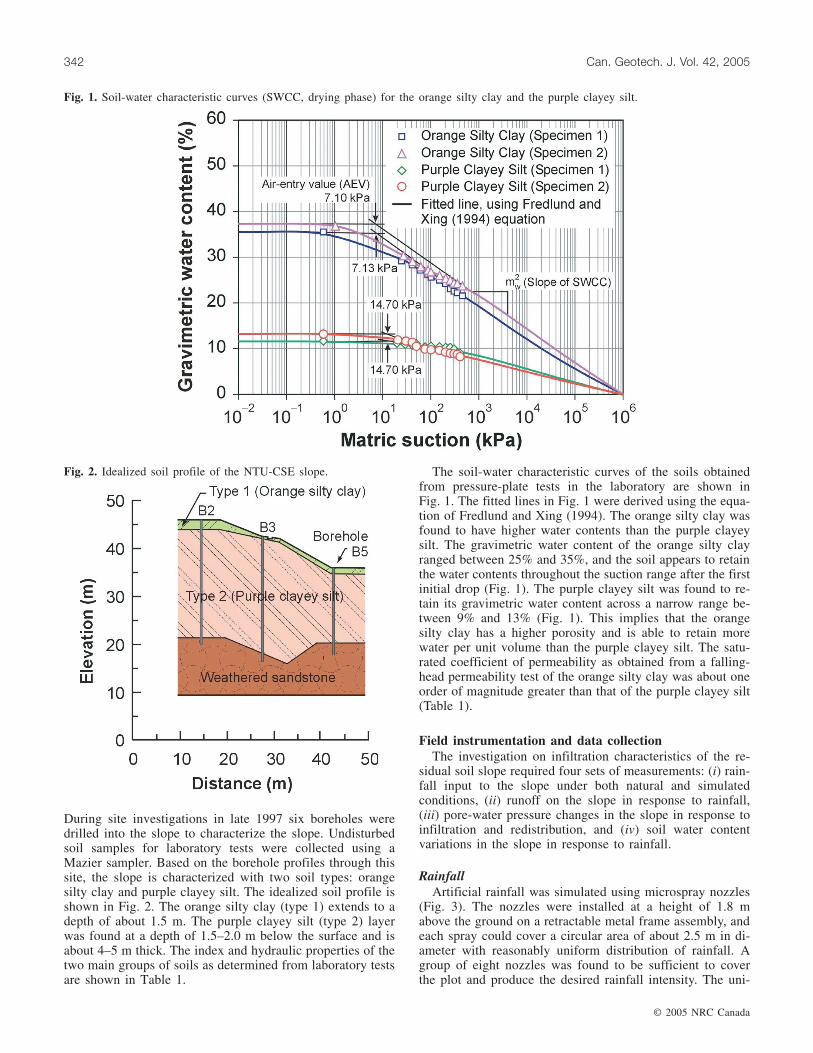
w isthe coefficient of water volume change (see Fig. 1) with re-spect to a change in matric suction (ua – uw), or the slope ofthe soil-water characteristic curve (SWCC), where ua is thepore-air pressure and is assumed to be atmospheric pressure;and t is time.
Although Darcy’s law is applicable to water flow throughboth saturated and unsaturated soils, there are two major dif-ferences between the water flows through saturated and un-saturated soils. First, the ability of an unsaturated soil toretain water varies with the soil suction (an SWCC definesthe relationship between the soil suction and the water con-tent; see Fig. 1). Second, like saturated soils, the hydraulicconductivity of an unsaturated soil is not a constant butrather a function of the soil suction (a permeability functioncurve defines the relationship between soil suction and thewater content). In eq. [1], both kw and m2
w are influenced bythe changing pore-water pressure as a consequence of infil-tration. Infiltration changes pore-water pressure and, sincepore-water pressure is related to both water retention(through the SWCC) and hydraulic conductivity (through thepermeability function curve) of an unsaturated soil, the flowof water through an unsaturated soil (eq. [1]) is largely af-fected by the infiltration. Thus it is essential to understandthe response of a residual soil slope to rainfall and infiltra-tion.
Equipment and methods
Site description and characterizationThe study was conducted at the NTU-CSE experimental
plot located on a cut slope (Fig. 2) in the Nanyang Techno-logical University (NTU) campus. The surface measuredabout 14 m wide by 24 m long, rising to a height of 12 m(gradient 2:1). A berm was cut into the slope during land-scaping. A horizontal drain runs across the berm, and theslope is well turfed with Buffalo grass.
The climate at the study site is of the hot and humid equa-torial type with no marked dry season. Average values of an-nual precipitation, annual potential evaporation, and annualmean temperature are 2300 mm, 1800 mm, and 26 °C,respectively (Meteorological Service Singapore 1997).Monthly precipitation is usually greatest from Novemberthrough January, but rain falls in all months of the year. Anaverage of 179 rainy days occur in a year, and rainstorms areshort, intense, and of limited spatial extent (Toll et al. 1999).Rainfall intensity typically ranges from 20 to 50 mm/h, al-though short-term intensities can exceed 100 mm/h (Rezauret al. 2002).
The slope is mainly underlain by the residual soils derivedfrom the weathering of the sedimentary Jurong Formation.
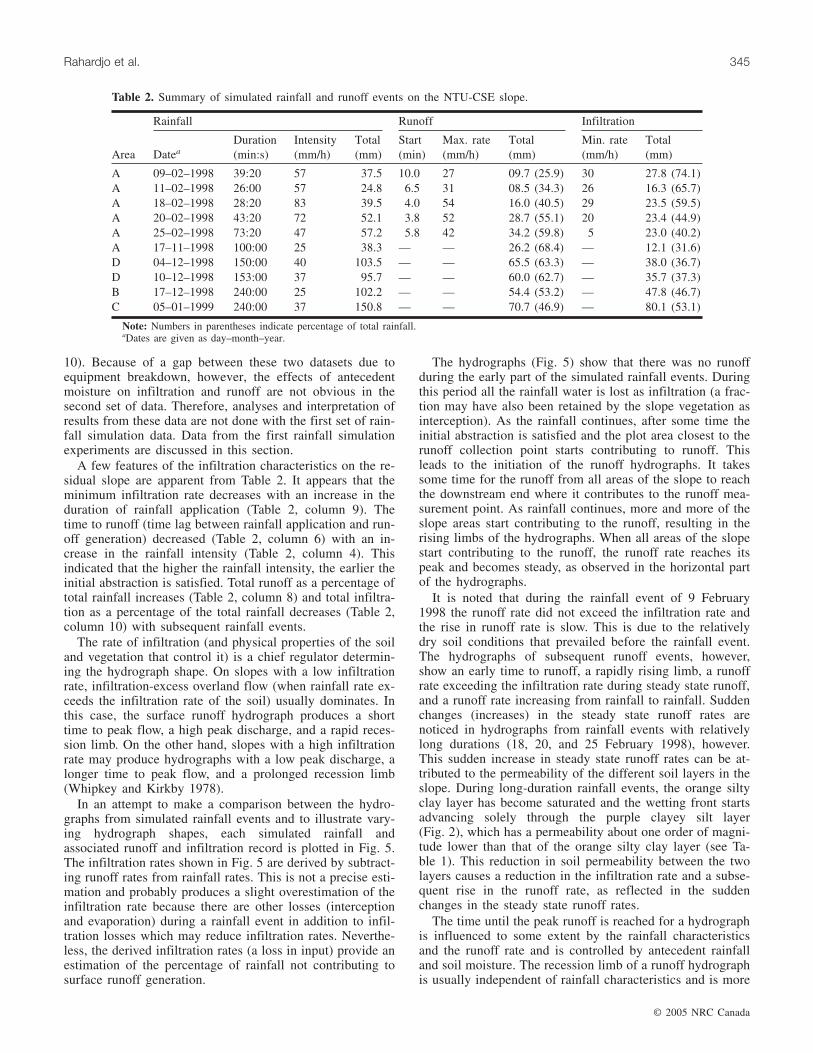
During site investigations in late 1997 six boreholes weredrilled into the slope to characterize the slope. Undisturbedsoil samples for laboratory tests were collected using aMazier sampler. Based on the borehole profiles through thissite, the slope is characterized with two soil types: orangesilty clay and purple clayey silt. The idealized soil profile isshown in Fig. 2. The orange silty clay (type 1) extends to adepth of about 1.5 m. The purple clayey silt (type 2) layerwas found at a depth of 1.5–2.0 m below the surface and isabout 4–5 m thick. The index and hydraulic properties of thetwo main groups of soils as determined from laboratory testsare shown in Table 1.
The soil-water characteristic curves of the soils obtainedfrom pressure-plate tests in the laboratory are shown inFig. 1. The fitted lines in Fig. 1 were derived using the equa-tion of Fredlund and Xing (1994). The orange silty clay wasfound to have higher water contents than the purple clayeysilt. The gravimetric water content of the orange silty clayranged between 25% and 35%, and the soil appears to retainthe water contents throughout the suction range after the firstinitial drop (Fig. 1). The purple clayey silt was found to re-tain its gravimetric water content across a narrow range be-tween 9% and 13% (Fig. 1). This implies that the orangesilty clay has a higher porosity and is able to retain morewater per unit volume than the purple clayey silt. The satu-rated coefficient of permeability as obtained from a falling-head permeability test of the orange silty clay was about oneorder of magnitude greater than that of the purple clayey silt(Table 1).
Field instrumentation and data collectionThe investigation on infiltration characteristics of the re-
sidual soil slope required four sets of measurements: (i) rain-fall input to the slope under both natural and simulatedconditions, (ii) runoff on the slope in response to rainfall,(iii) pore-water pressure changes in the slope in response toinfiltration and redistribution, and (iv) soil water contentvariations in the slope in response to rainfall.
RainfallArtificial rainfall was simulated using microspray nozzles
(Fig. 3). The nozzles were installed at a height of 1.8 mabove the ground on a retractable metal frame assembly, andeach spray could cover a circular area of about 2.5 m in di-ameter with reasonably uniform distribution of rainfall. Agroup of eight nozzles was found to be sufficient to coverthe plot and produce the desired rainfall intensity. The uni-
Fig. 1. Soil-water characteristic curves (SWCC, drying phase) for the orange silty clay and the purple clayey silt.
Fig. 2. Idealized soil profile of the NTU-CSE slope.
formity in rainfall application was assessed by collectingrainfall in a number of small cans spread randomly over thespray area and comparing the rainfall collected in the cansfor a fixed period of rainfall simulation. Water was suppliedto the nozzles via a flexible hose from a submersible centri-fuge pump in a water tank. The flow rate was controlled bytwo sets of valves: a primary feedback valve near the pump,and a set of secondary valves near the nozzles. The second-ary valves controlled the supply to the nozzles, and the pri-mary feedback valve was used to control the water pressureon the piping network and divert the excess water back tothe supply tank. By calibrating the secondary valves it waspossible to produce rainfall of different intensities. Naturalrainfall on the slope was recorded by a Handar model 444A2
(Handar, Sunnyvale, Calif.) tipping-bucket rain gauge(Fig. 3) with a resolution of 0.25 mm per tip.
Surface runoffSurface runoff in the slope was measured using a capaci-
tance water depth probe (model 6521J, Unidata, O’ConnorWA, Australia) housed vertically inside a perspex flume atthe lower end of the plot (Fig. 3). Runoff measurementswere made alternately at four locations on the slope (areasA, B, C and D; see Fig. 4). Corrugated zinc sheets, 300 mm
high and driven about 100 mm into the ground, were used toborder the plots (Fig. 3). Each runoff plot measured about22.5 m2 (9.0 m × 2.5 m) in size. The boundaries guided thesurface runoff into the perspex flume. The water depth probehad an accuracy of 1 mm and continuous measurement capa-bilities, with a measuring range of 0–0.5 m. The flume wasconstructed from perspex sheeting and was adjustable inwidth. This allowed the flume to be lightweight, portable,and flexible to accommodate small to high flow rates byvarying the width as dictated by the plot size. The flume wasplaced on a levelled platform at the downstream end of theslopes, and the runoff water from the plot outlet was guidedto the flume through a half-section of PVC pipe. The con-nection between the lower plot boundary and the PVC pipewas cemented to avoid any leakage. A buffer plate was fixedinside the flume to dampen turbulence, and the resultingflow was fairly laminar for the depth probe to give stablereadings. Prior to the field installation, the probe output sig-nals were calibrated in the laboratory against known flowrates and water depths. Data on surface runoff were col-lected only during a rainfall event and at a 10 s interval res-olution.
Plasticity index (%) 21.0 13.5Liquid limit (%) 47.0 34.0Specific gravity 2.67 2.72Saturated density (Mg/m3) 1.86 2.27Saturated gravimetric water content (%) 35.0 13.0Saturated volumetric water content (%) 48.3 26.1Unified Soil Classification System (USCS) classification CL CLSaturated permeability, ks (m/s) 5.18×10⁻⁶ 1.67×10⁻⁷
Table 1. Soil properties of the NTU-CSE slope.
Fig. 3. Setup for rainfall simulation on the NTU-CSE slope. Fig. 4. Plan view of the NTU-CSE slope showing layout of in-struments.
2 Trade names and company names are included for the benefit of the reader and do not imply endorsement or preferential treatment of theproduct by the authors.
Pore-water pressurePore-water pressure changes in the slope in response to
infiltration were measured by standard jet-fill tensiometers(model 2725, Soilmoisture Equipment Corporation, SantaBarbara, Calif.). Each tensiometer was fitted with a pressuretransducer for automated measurement. Seven rows of tensi-ometers were installed in the slope (designated rows A–Gdownslope; see Fig. 4). Each row was designed to measurepore-water pressures at depths of about 0.5, 1.1, 1.4, 2.3,and 3.2 m (designated columns 1–5) below the ground sur-face, spaced 0.5 m apart. The spacing between consecutiverows was 2.5–3.0 m. These tensiometer depths and spacingwere chosen with a view to acquire detailed information onpore-water pressure profiles across the slope. The tensiom-eters were installed in 25 mm holes that were cored by pipesto the desired depths using a percussion method. At the bot-tom, the holes were made slightly smaller in diameter thanthe tensiometer tube to allow a snug fit between the ten-siometer tip and the soil. A layer of bentonite powder wasplaced around the entrance of the 25 mm hole to seal thesmall gap between the tensiometer body and the wall of thehole. A 2 mm thick, 6 cm × 6 cm rubber shield was slippedaround the tensiometer body and placed on top of the ben-tonite layer. These steps were taken to prevent any surfacewater from leaking down the hole along the tensiometerbody and reaching the tensiometer tip prematurely. The ten-siometers were completely buried with the pressure trans-ducers, leaving only the jet-fill cups protruding from theground surface. This was done to minimize changes to theappearance of the slopes for aesthetic reasons. The protrud-ing jet-fill cups were then covered with wire mesh to protectthem from any accidental damage during regular turf main-tenance work on the slope. Figure 4 shows the details of thefield instrument layout. Prior to installation, all tensiometerswere tested with deaired water to ensure that the ceramictips were free from cracks and all connections were properlysealed. Pressure transducers were calibrated individuallyusing a microprocessor-based digital pressure calibrator(model DPI601, Druck, Licester, England).
A pressure correction was used to convert the pressuremeasured by the transducers, which are located at the top ofthe tensiometer tube, to the actual pressure at the ceramic tipof the tensiometer, which is located at the bottom of thetensiometer tube. The magnitude of the correction is equal tothe elevation head between the tensiometer tip and the trans-ducer port. This correction was incorporated in the calibra-tion equation for each tensiometer according to respectivedepths.
Casagrande-type piezometers, consisting of a 25 mmdiameter PVC standpipe attached to a porous stone tip, wereinstalled in five boreholes (Fig. 4) in the slope. Thepiezometer tips were positioned about 10 m below theground surface. Small-diameter standpipes were chosen be-cause they would provide a quicker response to any fluctua-tions in the groundwater table. The boreholes were sealedabove and below the piezometer tips with bentonite to obtainaccurate measurements of the groundwater tables at thepiezometer tips. Each piezometer porous tip housed asubmersible, water-depth transmitter (model PTX 161/D,Druck) for long-term and automatic readings of groundwatertable fluctuations in response to rainfall. Prior to field instal-
lation, each transmitter was calibrated in a pressure chamberto measure gauge pressure from 0 to 20 m of water. Thestandpipe also served as a backup so that manual measure-ments could be performed in the event the transmitter be-came inoperable. Tensiometer and piezometer readings werescanned at 20 min intervals by dataloggers (Hydra, Fluke,Everett WA, USA) and were stored in a personal computer.
Soil water contentThe average water content of the surface soils (0.15 m
depth) in the slope before and after a rainfall event was mea-sured by time domain reflectometry (TDR) techniques. ATrasemeter (model 6050X1, Soilmoisture Equipment Corp.),which works on the TDR principle, was used to measure theaverage water content along the length of its waveguide(0.15 m). The waveguide was positioned vertically andpushed completely into the soil, and TDR measurementswere taken near each tensiometer location (Fig. 4).
Soil in general is composed of air, mineral-soil particles,and water. The dielectric constant (K) of air, mineral parti-cles, and water is 1, 2–3, and 80, respectively. Because ofthe great difference between the dielectric constant of waterand that of other constituents in a soil, the dielectric constantof a soil is dependent on the water content of the soil. If asoil is completely dry, K will be 3 or 4 and about 11–12 at25% volumetric water content, θw. The TDR technique formeasuring soil water content is established on the relation-ship between the volumetric water content of a soil, θw, andits apparent dielectric constant, K. The relationship betweenK and θw is practically independent of soil type or fabric fora wide range of soil textures and properties. This relation-ship has been verified by many studies (e.g., Topp and Davis1984; Dalton and Van Genuchten 1986; Zegelin et al. 1992)and has been accepted as the universal relationship for volu-metric water content and apparent dielectric constant mea-sured using TDR (Cook and Fredlund 1998).
The Trasemeter consists of a step pulse generator–analyser, a coaxial cable, and a waveguide. The step pulsegenerator emits an electromagnetic pulse that travels alongits coaxial cable and through its parallel metallic waveguideburied in the soil at a speed determined by the dielectricconstant of the soil. From the travel time of the pulse alongthe waveguide and from the known length of the waveguide,the Trasemeter analyser computes the dielectric constant Kof the soil. The analyser then computes the water content ofthe soil from the relationship between K and θw.
Results and discussion
Simulated rainfall and infiltrationDuring February of 1998 five simulated rainfall experi-
ments were conducted in area A of the slope to understandinfiltration effects on the residual soil slope under con-trolled-rainfall conditions. It is difficult to assess the infiltra-tion effects on the slope due to natural rainfall eventsbecause natural rainfall intensity and duration vary within arainfall event and from event to event. A summary of experi-ments with simulated rainfalls is shown in Table 2. A secondset of five experiments with simulated rainfall was con-ducted between 17 November 1998 and 5 January 1999 inareas A–D. These data are summarized in Table 2 (rows 6–
10). Because of a gap between these two datasets due toequipment breakdown, however, the effects of antecedentmoisture on infiltration and runoff are not obvious in thesecond set of data. Therefore, analyses and interpretation ofresults from these data are not done with the first set of rain-fall simulation data. Data from the first rainfall simulationexperiments are discussed in this section.
A few features of the infiltration characteristics on the re-sidual slope are apparent from Table 2. It appears that theminimum infiltration rate decreases with an increase in theduration of rainfall application (Table 2, column 9). Thetime to runoff (time lag between rainfall application and run-off generation) decreased (Table 2, column 6) with an in-crease in the rainfall intensity (Table 2, column 4). Thisindicated that the higher the rainfall intensity, the earlier theinitial abstraction is satisfied. Total runoff as a percentage oftotal rainfall increases (Table 2, column 8) and total infiltra-tion as a percentage of the total rainfall decreases (Table 2,column 10) with subsequent rainfall events.
The rate of infiltration (and physical properties of the soiland vegetation that control it) is a chief regulator determin-ing the hydrograph shape. On slopes with a low infiltrationrate, infiltration-excess overland flow (when rainfall rate ex-ceeds the infiltration rate of the soil) usually dominates. Inthis case, the surface runoff hydrograph produces a shorttime to peak flow, a high peak discharge, and a rapid reces-sion limb. On the other hand, slopes with a high infiltrationrate may produce hydrographs with a low peak discharge, alonger time to peak flow, and a prolonged recession limb(Whipkey and Kirkby 1978).
In an attempt to make a comparison between the hydro-graphs from simulated rainfall events and to illustrate vary-ing hydrograph shapes, each simulated rainfall andassociated runoff and infiltration record is plotted in Fig. 5.The infiltration rates shown in Fig. 5 are derived by subtract-ing runoff rates from rainfall rates. This is not a precise esti-mation and probably produces a slight overestimation of theinfiltration rate because there are other losses (interceptionand evaporation) during a rainfall event in addition to infil-tration losses which may reduce infiltration rates. Neverthe-less, the derived infiltration rates (a loss in input) provide anestimation of the percentage of rainfall not contributing tosurface runoff generation.
The hydrographs (Fig. 5) show that there was no runoffduring the early part of the simulated rainfall events. Duringthis period all the rainfall water is lost as infiltration (a frac-tion may have also been retained by the slope vegetation asinterception). As the rainfall continues, after some time theinitial abstraction is satisfied and the plot area closest to therunoff collection point starts contributing to runoff. Thisleads to the initiation of the runoff hydrographs. It takessome time for the runoff from all areas of the slope to reachthe downstream end where it contributes to the runoff mea-surement point. As rainfall continues, more and more of theslope areas start contributing to the runoff, resulting in therising limbs of the hydrographs. When all areas of the slopestart contributing to the runoff, the runoff rate reaches itspeak and becomes steady, as observed in the horizontal partof the hydrographs.
It is noted that during the rainfall event of 9 February1998 the runoff rate did not exceed the infiltration rate andthe rise in runoff rate is slow. This is due to the relativelydry soil conditions that prevailed before the rainfall event.The hydrographs of subsequent runoff events, however,show an early time to runoff, a rapidly rising limb, a runoffrate exceeding the infiltration rate during steady state runoff,and a runoff rate increasing from rainfall to rainfall. Suddenchanges (increases) in the steady state runoff rates arenoticed in hydrographs from rainfall events with relativelylong durations (18, 20, and 25 February 1998), however.This sudden increase in steady state runoff rates can be at-tributed to the permeability of the different soil layers in theslope. During long-duration rainfall events, the orange siltyclay layer has become saturated and the wetting front startsadvancing solely through the purple clayey silt layer(Fig. 2), which has a permeability about one order of magni-tude lower than that of the orange silty clay layer (see Ta-ble 1). This reduction in soil permeability between the twolayers causes a reduction in the infiltration rate and a subse-quent rise in the runoff rate, as reflected in the suddenchanges in the steady state runoff rates.
The time until the peak runoff is reached for a hydrographis influenced to some extent by the rainfall characteristicsand the runoff rate and is controlled by antecedent rainfalland soil moisture. The recession limb of a runoff hydrographis usually independent of rainfall characteristics and is more
Note: Numbers in parentheses indicate percentage of total rainfall.aDates are given as day–month–year.
Table 2. Summary of simulated rainfall and runoff events on the NTU-CSE slope.
influenced by slope topography and soil properties. There-fore, the most noticeable and significant changes in theshape of the runoff hydrographs from simulated rainfallevents between 9 and 25 February 1998 are the increases inpeak runoff rates from storm to storm (Fig. 5; Table 2, col-umn 7). Also significant are the decreasing infiltration ratesin successive storms (Fig. 5; Table 2, column 9) and thesimilar recession limbs of the hydrographs. Given the nearlysimilar rainfall characteristics, the changes in the shape ofthe runoff hydrographs can be attributed to the decreasinginfiltration rates from rainfall to rainfall due to antecedentwater contents in the soil. The variation of the water contentin the slope due to rainfall is discussed in the next section.
The hydrograph from a rainfall event on 25 February 1998indicates infiltration and runoff generation conditions undera long-duration and relatively low intensity rainfall. Duringlong-duration and low-intensity rainfall events the infiltra-tion rate reduces significantly and the steady state runoffrates may approach rainfall rates, but the time to peak runoffis long. The incomplete recession limb for the hydrograph ofthe rainfall on 25 February 1998 was due to malfunction ofthe water depth probe. A comparison of total runoff and totalinfiltration expressed as a percentage of total rainfall fromindividual events (Table 2, columns 8 and 10) indicates thata large portion of the rainwater enters the slope as infiltra-tion and may contribute to the potential for slope instability.These data suggest that about 40%–74% of the total rainfallamount contributes to infiltration, depending on the rainfallintensity and duration and antecedent water content condi-tions in the slope (Table 2).
Water content variation due to rainfallThe variations in the water contents in the slope (area A)
due to the simulated rainfall events are shown in Table 3.The water content values are the average volumetric watercontents within 15 cm depths obtained from TDR measure-ments before and after each rainfall event near eachtensiometer location between rows A and D (see Fig. 4).
Table 3 indicates the existence of a general trend in thewater content data. The volumetric water contents near thetoe (row D) of the slope always appear to be (before or afterrainfall) higher than those at the crest (row A). The existenceof relatively higher water contents near the slope toe than atthe crest before and after rainfall events suggests the exis-tence of subsurface flow within the soil layers in a down-slope direction towards the toe of the slope. In this case,water in the upper slope areas drains vertically downwardsand to the lower slope areas as subsurface flow. As a result,there is more drainage on the upper slope areas and morewater retention on the lower slope areas. The lower slope ar-eas remain wetter than the upper slope areas and thereforeshow higher water contents than those at the crest.
In the previous section it was pointed out that the time torunoff, peak runoff rate, and infiltration rate decrease fromevent to event and are controlled by the antecedent moistureconditions prevailing in the slope prior to each rainfall event.The water content data for the slope before and after therainfall event (Table 3) show why the time to runoff, peakrunoff rate, and infiltration rates were reached earlier duringthe subsequent rainfall events. For instance, the average wa-ter content in the slope prior to the rainfall simulation on 9February 1998 was about 34% (Table 3). Prior to the rainfallsimulation on 11 February 1998, the average water contentof the slope was about 35% (a consequence of previous rain-fall). This implies that the initial degree of saturation of theslope before the 11 February 1998 rainfall event was higherthan that before the 9 February 1998 rainfall. Therefore,with about the same rainfall intensity, the time to runoff andpeak runoff were reached earlier and the runoff rate ex-ceeded the infiltration rate earlier than the previous rainfall.The change in volumetric water contents in the slope due toa rainfall appears to be influenced by the amount of the rain-fall and the number of dry days between rainfall events.
Fig. 5. Comparison of hydrographs of simulated rainfall eventsin area A of the NTU-CSE slope.
Natural rainfall and infiltrationDuring December 1998 and January 1999, data on natural
rainfall–runoff events were collected for 27 rainfall eventson the slope. Data from these 27 events were analysed to de-termine the total runoff resulting from each rainfall event,total runoff and infiltration expressed as a percentage of totalrainfall, and peak intensity of each rainfall event. Table 4summarizes the results of the runoff measurements from nat-ural rainfall events in the slope. The runoff coefficients (ratioof runoff amount to rainfall amount in percentage) in theslope for all runoff-generating rainfalls varied from 11% to45% (Table 4), with an average value of 25%. Runoff gener-ation appears to be infrequent in the grass-covered residualsoil slope. The data suggest that rainstorms in excess of10 mm usually generate runoff, even under dry antecedentconditions (Table 4, see rainfall and runoff amounts on 16and 25 December 1998 and 4 and 14 January 1999).
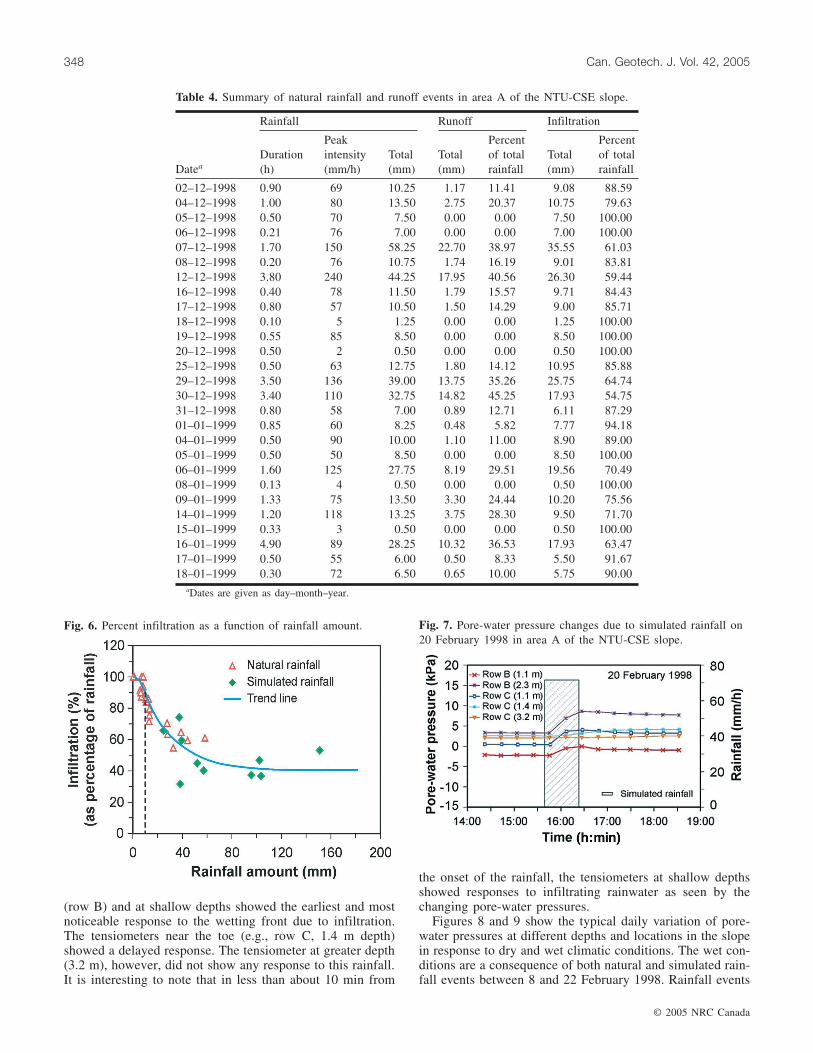
In Fig. 6, infiltration amounts (as a percentage of totalrainfall) are plotted against rainfall amounts from 27 naturaland 10 simulated rainfalls monitored in the slope. It appearsfrom Fig. 6 that rainfall events producing small totalamounts of rainfall may contribute fully to infiltration. Thissuggests the existence of a threshold rainfall amount. Anyrainfall below this amount will not produce any runoff, andthe whole rainfall may end up as infiltration. With referenceto Fig. 6 (broken line), this threshold appears to be about10 mm of total rainfall. Beyond the threshold rainfall, thepercentage of rainfall contributing to infiltration decreaseswith an increase in total rainfalls. The infiltration amountcould decrease to about 40% of the rainfall (Fig. 6) for rain-
fall events that produce a high total amount of rainfall. This,however, does not mean that the total infiltration amount isless under rainfall events with a higher total rainfall than thetotal infiltration under rainfall events with a smaller totalrainfall. For example, with 40% of the rainfall contributingto infiltration, a 100 mm rainfall (higher total amount)would result in a total of 40 mm infiltration. With 100% ofthe rainfall contributing to infiltration, a 10 mm rainfallwould produce only 10 mm of total infiltration.
The data suggest that in residual soil slopes total infiltra-tion could range between 40% and about 100% of the totalrainfall depending on the rainfall amount. The relationship(Fig. 6) derived from the rainfall records in the residual soilslope has practical significance. If the rainfall amount isknown, Fig. 6 could indicate the fraction of the rainfall thatcould become infiltration. This may be useful for seepageanalysis that requires this information as flux boundary con-ditions.
Pore-water pressure variation due to rainfallThe effect of infiltration and evapotranspiration on pore-
water pressure changes in the slope can be examinedindependently. Figure 7 shows an enlarged view of the pore-water pressure variation in the slope in response to the rain-fall event (simulated) of 20 February 1998 at selectedlocations. The tensiometers at 0.5 m depths were inoperativeduring February 1998 due to instrument malfunction. There-fore, data from tensiometers at 0.5 m are not presented. Alltensiometers at shallow depths (1–2 m) showed a responseto the rainfall event. The tensiometers near the slope crest
Table 3. Summary of volumetric water contents, θw (%), before and after simulated rainfalls inarea A of the NTU-CSE slope in 1998.
(row B) and at shallow depths showed the earliest and mostnoticeable response to the wetting front due to infiltration.The tensiometers near the toe (e.g., row C, 1.4 m depth)showed a delayed response. The tensiometer at greater depth(3.2 m), however, did not show any response to this rainfall.It is interesting to note that in less than about 10 min from
the onset of the rainfall, the tensiometers at shallow depthsshowed responses to infiltrating rainwater as seen by thechanging pore-water pressures.
Figures 8 and 9 show the typical daily variation of pore-water pressures at different depths and locations in the slopein response to dry and wet climatic conditions. The wet con-ditions are a consequence of both natural and simulated rain-fall events between 8 and 22 February 1998. Rainfall events
Table 4. Summary of natural rainfall and runoff events in area A of the NTU-CSE slope.
Fig. 6. Percent infiltration as a function of rainfall amount. Fig. 7. Pore-water pressure changes due to simulated rainfall on20 February 1998 in area A of the NTU-CSE slope.
with a small total rainfall amount (e.g., 15 February 1998)only affect the pore-water pressures at shallow depths(Fig. 9). The small natural rainfall event (about 2 mm)during 17 February 1998 did not show any effect on thepore-water pressures in any locations in the slope (Fig. 9).Tensiometer data (Figs. 8, 9) suggest that the zone of influ-ence of infiltration extends to about the 3 m depth. Tensiom-eters at shallow depths showed a quick response to rainfalland redistribution. The tensiometers at a greater depthshowed a delayed response. The nearly instant changein pore-water pressures at different depths during a rainfallevent (Figs. 8, 9) indicates a fast infiltration rate into theslope. This, however, does not lead to a constant wet soilcondition, as can be seen in the gradual suction recoverybetween rainfall events. Figures 8 and 9 show that matricsuctions (negative pore-water pressures) prevail at shallowdepths during dry periods but gradually decrease with an in-crease in depth.
The soils at shallower depths are in close proximity to theatmosphere and surface vegetation and therefore are moreeasily and frequently influenced by rainfall and evapotran-spiration compared to the deeper soil layers. In addition tovertical and downslope drainage, the combined influence ofsoil properties and vegetation encourages evaporation, tran-spiration, and redistribution at the soil–atmosphere interface.Consequently, the pore-water pressures at shallow depths ex-
perience relatively quick and high matric suction develop-ments. In contrast, the soils at greater depths, where the in-fluence of climate and vegetation is less, require a relativelylonger time for the suction recovery and therefore show adelayed response, as observed in Figs. 8 and 9.
Positive pore-water pressures observed at different depths(Figs. 7–9) are a consequence of a perched water table thathas developed. Positive pore-water pressures may alsodevelop in poorly sealed tensiometers where surface watermay leak down along the tensiometer tube during a rainfalland reach the tensiometer tip prematurely, causing a suddenrise in pore-water pressure. In the present study the chancesthat the observed positive pore-water pressures are a conse-quence of surface water leaking along the tensiometer tubesare less likely because the tensiometers were properly sealedand adequate precautions were taken to avoid any leakagealong the tensiometer shaft (described in the “Field instru-mentation and data collection” section). Furthermore, al-though the tensiometers showed rapid responses to theinfiltrating rainwater, the gradual recovery of matric suctionsafter rainfall and during dry periods (Figs. 7–9) provides ad-ditional evidence that the positive pore-water pressures ob-served were not due to leakage of surface water along thetensiometer shaft. A sudden decrease in matric suction dueto surface water leaking along a tensiometer body duringrainfall will be recovered immediately after a rainfall event(Gasmo et al. 2000). This happens because the soil sur-rounding the prematurely wet tensiometer tip still remainsnear its initial matric suction prior to the rainfall event.Therefore, the surrounding soil is able to absorb the mois-ture from the surface water leak, causing the matric suctionof the soil in contact with the tensiometer to recover ratherquickly.
Piezometers installed in the slope (Fig. 4) did not showany response during the monitoring period, indicating thatthe groundwater table was located below the depth of thepiezometer tips. In the residual soil slope under investiga-tion, the formation of a perched water table and the resultingdevelopment of positive pore-water pressures could be initi-ated by two processes: variations of unsaturated permeabilityof the soil with variations in matric suction (i.e., permeabil-ity function), and the decreasing saturated permeability withincreasing depths (due to the decrease in the degree ofweathering at greater depths). The advancement of the infil-trating rainwater to deeper depths is affected by the unsatu-rated permeability of the soil in front of the wetting frontwhich is still at its initial matric suction. The low unsatu-rated permeability in front of the wetting front impedes thedownward vertical movement of water. As the advancingwetting front reaches the boundary between the permeable(orange silty clay) and the relatively less permeable (purpleclayey silt) soil layer the movement is further impeded dueto a reduction in the saturated permeability (Table 1). As aresult, the infiltrating rainwater collects at the less permeablesoil layer (Fig. 2) and results in a build up of positive pore-water pressures as observed in Figs. 7–9. The positive pore-water pressures are sustained for a period of time with agradual decrease in magnitude. The recovery of matric suc-tion is dependent on how efficiently the slope vegetation andclimatic conditions accelerate the decrease in pore-waterpressures.
Fig. 8. Time series of rainfall and pore-water pressures between8 and 15 February 1998 in area A of the NTU-CSE slope.
Fig. 9. Time series of rainfall and pore-water pressures between15 and 22 February 1998 in area A of the NTU-CSE slope.
It is obvious from Figs. 8 and 9 that an increase in pore-water pressure is anticipated at almost all magnitudes ofrainfall events. The increase in pore-water pressures, how-ever, does not seem to be proportional to the rainfall amount.Therefore, the correlation between the increase in pore-waterpressures (difference in pore-water pressure before and aftera rainfall) and rainfall amount was examined. This was doneby taking the algebraic difference in pore-water pressuresbefore and after a rainfall event for all depths and rainfallevents shown in Figs. 8 and 9. Figure 10 shows the increasein pore-water pressure as a function of the rainfall amountmonitored at the slope. Although there is considerable scat-ter (correlation coefficient r2 = 0.517), the trend in thedataset is evident. The relative increase in pore-water pres-sure appears to increase rapidly with an increase in the rain-fall amount, but then the rate of increase tends to decline atgreater rainfall amounts. This tendency is perhaps due to thefact that soils in a relatively dry condition (low water con-tent, high matric suction) cause an increase in the pore-waterpressure but fail to raise the pore-water pressure to its maxi-mum value when the infiltration is from a relatively smallrainfall. When a larger rainfall occurs, the rise in pore-waterpressure reaches its maximum as the soil approaches satura-tion, and additional rainfall does not contribute to infiltrationor to any significant increase in pore-water pressure. There-fore, the relative increase in pore-water pressure increaseswith an increase in rainfall and tends to decline at higherrainfalls.
The equation shown in Fig. 10 has a negative intercept,indicating that a rainfall of greater than 1.38 mm is neededto initiate a rise in pore-water pressure. This is consistentwith the concept that small-magnitude rainfalls may not beavailable to the soil to contribute to an increase in pore-water pressure because they will be intercepted by the slopevegetation. Figure 9, which can be used to justify this con-cept, shows that there is a small rainfall (about 1 mm)between 17 and 18 February 1998, and the pore-water pres-sures at any depth did not respond to this rainfall. There aresome observation errors inherent in the data, however, asthere are few observations available on changes of pore-water pressures at very low rainfalls. Therefore the equationin Fig. 10 was not forced through the origin.
The relationship shown in Fig. 10 appears to have somepractical significance. It can be used to assess the possiblerisk of slope failure. For an application of Fig. 10, the pore-water pressure in the slope before a rainfall event and a rela-tionship between pore-water pressure and factor of safety arerequired. The existing pore-water pressure in the slope maycome from one or more tensiometers installed in the slope(preferably more than one location to obtain a representativevalue). The relationship between pore-water pressure andfactor of safety can be established from a numerical analysis(seepage and slope stability analyses) for a residual soilslope subjected to various rainfall conditions where the fluxboundary and pore-water pressure conditions are knownfrom a previous field-monitoring scheme. Assuming that thecurrent pore-water pressure in the slope is –5 kPa and a rain-fall of 40 mm is anticipated, Fig. 10 readily indicates that anincrease in pore-water pressure of about 4 kPa is inevitable.This means that after a 40 mm rainfall the pore-water pres-sure in the slope will become –5 + 4 = –1 kPa. From the re-
lationship between pore-water pressure and factor of safety,it is possible to estimate the factor of safety at a pore-waterpressure of –1 kPa (i.e., after the 40 mm rainfall). Thus, therelationship shown in Fig. 10 can be used to assess the risksof slope failure when a high rainfall is anticipated.
Conclusions
The results of natural and simulated rainfall–runoff exper-iments conducted on the test slope suggest that a largeproportion of the rainfall contributes to infiltration in the re-sidual soil slope. A rainfall may contribute from 40% toabout 100% of its total rainfall as infiltration (assuming neg-ligible interception losses) depending on the rainfall amount.This information is useful for seepage analyses that requirethe total infiltration amount as an input parameter. Smallertotal rainfalls may contribute fully to infiltration, and largertotal rainfalls may contribute more towards runoff generationand relatively less to infiltration. The percentage of rainfallcontributing to infiltration decreases with an increase in therainfall amount. There appears to be a threshold rainfall ofabout 10 mm. Storm events resulting in a total rainfall abovethis threshold are only capable of producing surface runoff.Infiltration and runoff amount, as well as the relative in-crease in pore-water pressure due to a rainfall, are influ-enced by the antecedent rainfall in the slope.
Rainfall events may result in positive pore-water pressuredevelopment in the residual soil slope as a result of the for-mation of a perched water table. The relative increase inpore-water pressures appears to be related to rainfallamount. The relationships between the relative increase inpore-water pressure and total rainfall may provide a usefultool for assessing slope instability due to rainfall. The char-acteristics of infiltration processes, runoff generation, andpore-water pressure changes identified in this study mayhave relevance for the assessment of rainfall-induced slopeinstability in residual soil slopes under similar climatic con-ditions in different geographic regimes.
Acknowledgements
This work was funded by a research grant from theNational Science and Technology Board, Singapore (grant
Fig. 10. Relationship between rainfall and the increase in pore-water pressures.
NSTB 17/6/16, Rainfall-induced slope failures). The secondauthor gratefully acknowledges the research scholarshipmade available by NTU for this study. The authors grate-fully acknowledge the field assistance of the GeotechnicsLaboratory staff, School of Civil and Environmental Engi-neering, Nanyang Technological University, Singapore, dur-ing the setup, troubleshooting, and data collection for thisstudy.
References
Basile, A., Mele, G., and Terribile, F. 2003. Soil hydraulic behaviorof a selected benchmark soil involved in the landslide of Sarno1998. Geoderma, 117(3–4): 331–346.
Cheng, P.F.K. 1997. Soil infiltration prediction and its significancein slope stability. In Proceedings of the 3rd Asian YoungGeotechnical Engineers Conference, Singapore. Edited by T.S.Tan, S.H. Chew, K.K. Phoon, and T.G. Ng. Photoplates Pt. Ltd.,Singapore. pp. 661–669.
Cho, S.E., and Lee, S.R. 2001. Instability of unsaturated soil slopesdue to infiltration. Computers and Geotechnics, 28: 185–208.
Cook, D.L., and Fredlund, D.G. 1998. TDR matric suctionmeasurements. In Unsaturated Soils: Proceedings of the 2ndInternational Conference on Unsaturated Soils, Beijing, China,27–30 August 1998. International Academic Publishing House,Beijing, China. pp. 338–343.
Dalton, F.N., and Van Genuchten, M. 1986. The time domainreflectometry method for measuring soil water content and sa-linity. Geoderma, 38: 237–250.
Fredlund, D.G., and Rahardjo, H. 1993. Soil mechanics for unsatu-rated soils. John Wiley & Sons, Inc., New York.
Fredlund, D.G., and Xing, A. 1994. Equations for the soil-watercharacteristic curve. Canadian Geotechnical Journal, 31(3):521–532.
Gasmo, J.M., Rahardjo, H., and Leong, E.C. 2000. Infiltrationeffects on stability of a residual soil slope. Computers andGeotechnics, 26: 145–165.
Lim, T.T., Rahardjo, H., Chang, M.F., and Fredlund, D.G. 1996.Effect of rainfall on matric suctions in a residual soil slope. Ca-nadian Geotechnical Journal, 33(4): 618–628.
Meteorological Service Singapore. 1997. Summary of observa-tions. Meteorological Service Singapore, Singapore.
Ng, C.W.W., Zhan, L.T., Bao, C.G., Fredlund, D.G., and Gong,B.W. 2003. Performance of unsaturated expansive soil slopesubjected to artificial rainfall infiltration. Géotechnique, 53(2):143–157.
Ost, L., Van-Den, E.M., Poesen, J., and Vanmaercke-Gottigny,M.C. 2003. Characteristics and spatial distribution of large land-slides in the Flemish Ardennes (Belgium). Zeitschrift fürGeomorphologie N.F., 47(3): 329–350.
Rahardjo, H., Lim, T.T., Chang, M.F., and Fredlund, D.G. 1995.Shear-strength characteristics of a residual soil. CanadianGeotechnical Journal, 32(1): 60–77.
Rezaur, R.B., Rahardjo, H., and Leong, E.C. 2002. Spatial andtemporal variability of pore-water pressures in residual soilslopes in a tropical climate. Earth Surface Processes and Land-forms, 27(3): 317–338.
Toll, D.G., Rahardjo, H., and Leong, E.C. 1999. Landslides in Sin-gapore. In Proceedings of the 2nd International Conference onLandslides, Slope Stability and the Safety of Infra-Structures,Singapore, 27–28 July 1999. CI-Premier Conference Organisa-tion, Orchard Plaza, Singapore. pp. 269–276.
Topp, G.C., and Davis, J.L. 1984. Measurement of soil water con-tent using time domain reflectometry: a field evaluation. SoilScience Society of America Journal, 16: 19–24.
Tsaparas, I., Rahardjo, H., Toll, D.G., and Leong, E.C. 2002. Con-trolling parameters for rainfall-induced landslides. Computersand Geotechnics, 29: 1–27.
Whipkey, R.Z., and Kirkby, M.J. 1978. Flow within the soil. InHillslope hydrology. Edited by M.J. Kirkby. John Wiley & SonsInc., New York. pp. 121–145.
Zegelin, S.J., White, I., and Russell, G.F. 1992. A critique of timedomain reflectometry technique for determining field soil watercontent. In Advances in measurement of soil physical proper-ties: bringing theory into practice. Edited by G.C. Topp, W.D.Reynolds, and R.E. Green. Soil Science Society of America,Madison, Wisc., Special Publication 30, pp. 187–208.