33
Resting pattern and social interactions in goats - the impact of size and organisation of lying space Applied Animal Behaviour Science 108 , 89-103
Resting pattern and social interactions in goats - the impact of size and organisation of lying space
Applied Animal Behaviour Science 108 , 89-103
Resting pattern and social interactions in goats – the impact of size and organisation of
lying space
Inger Lise Andersen and Knut Egil Bøe
Norwegian University of Life Sciences
Department of Animal and Aquacultural Sciences
P.O.Box 5003
1432 Ås, Norway
Corresponding author: Inger Lise Andersen ([email protected]; phone: +47
64965171, fax: +47 64965101)
1

ABSTRACT 1
2
3
4
5
6
7
8
9
10
11
12
13
14
15
16
17
18
19
20
21
22
23
24
25
The aim of the present experiment was to examine how size and organisation of lying space
affected resting pattern and social interactions in female goats. Twenty-four goats of a
Norwegian milking breed divided into 6 groups, were systematically rotated between six
experimental pens (width x depth: 2.0 x 3.0 m) with resting areas of different size (small: 0.5
m2, medium: 0.75 m2 or large: 1.0 m2) and organisation (one vs. two levels/heights). Resting
pattern was analysed using instantaneous sampling with 10 minutes intervals for 24 hours,
whereas social interactions were continuously observed in five hours between 09.00 and
14.00 during the last 24 hours of each experimental week. Individuals within each group were
ranked from 1 to 4 (1 being the dominant individual) according to how many times they had
withdrawn from an interactions and avoided contact with another goat throughout the entire
experimental period. By using MatMan (Software for matrix manipulation and analysis), we
converted a matrix of withdrawal and avoidance interactions among the goats (based on all
treatments) in each group into a matrix of dominance relationships.
The goats spent less time resting (P<0.01) and rested less simultaneously (P<0.001) when the
resting area was small compared to a medium and large resting area. Time spent resting in the
activity area also increased with decreasing lying space (P<0.01). The goats preferred resting
close to a pen wall, and this occurred more seldom when the resting area was small (P<0.01).
Resting in social contact with pen mates occurred in less than 6 % of the observations lying,
and this was not significantly affected by the size of the resting area. When the lying space
was organized on two levels, one or two goats resting at the same time on the same level was
most the commonly observed. In most pens, the lowest ranked individuals in the groups spent
less time resting (P<0.01), less time resting against a wall (P<0.01), and spent more of their
resting time in the low-comfort activity area (P<0.0001). The amount of social interactions
2

1
2
3
4
5
6
7
8
9
10
11
12
13
14
15
16
17
18
19
20
21
22
23
24
was not significantly affected by the size of the resting area, but there were significantly fewer
displacements (P<0.01) and the overall aggression level was lower (P<0.05) when lying space
was organised on two levels rather than one. In conclusion, time spent resting and resting
pattern was more dependent on size (large, medium, small) than organisation (one vs. two
levels) of the lying space, whereas this was the opposite for social interactions.
Key words: goats, lying space, resting pattern, social interactions
1. INTRODUCTION
Aggressive interactions among animals increase when resources become more limited in
space (e.g. Milinski and Parker, 1991; Estevez et al., 2006) and for farm animals these
resources may be feeding or drinking space, access to litter or straw, attractive resting places
and the freedom to move itself if the overall space is limited. Although resting pattern may
not appear to be the most important indicator of the welfare status, farm animals tend to show
a very synchronous activity and resting pattern if the environmental conditions allow it (Rook
and Penning, 1991; Fraser and Broom, 1997). Behaving synchronously is considered to be an
important benefit of living in groups, since it may increase the safety of the individual (e.g.
Estevez et al., 2006). Decreased space allowance reduces resting time and synchrony in
resting, and increases the amount of aggressive interactions in cattle (Zeeb et al., 1988; Fisher
et al., 1997; Mogensen et al., 1997; Nielsen et al., 1997; Fregonesi and Leaver, 2002). Similar
results are found when decreasing lying space in social groups of sheep (Bøe et al., 2006), and
it is the low status individuals that tend to suffer most in terms of a major decrease in resting
time. As has been documented theoretically (Milinski and Parker, 1991) and with empirical
work on pigs (Andersen et al., 1999), it is not only the average access to resources that are
3
1
2
3
4
5
6
7
8
9
10
11
12
13
14
15
16
17
18
19
20
21
22
23
24
25
reduced when resources become more limited in space. The differences between high and low
status individuals also increase in a more competitive environment.
In his review of goat housing, Toussaint (1997) recommends a space allowance for adult
goats of 1.50 m2, which corresponds to the requirements in the European regulations for
organic farming (Council Regulation (EC) No 1804/1999). However, regulations both in
Sweden (1.20 m2 per goat) and Switzerland (1.0 m2 per goat) have lower demands for space
allowance. In the present study we chose to use a space allowance of 1.5 m2 since this is both
in accordance with European legislations for ecological goat farming and what is
recommended by Toussaint (1997). Unfortunately, scientific information about how size and
organisation of lying space affects the behaviour and social interactions in goats is scarce.
When offering a total floor space of 1.0 m2, 1.5 m2 or 2.0 m2 per animal in social groups of
horned and horneless goats, Loretz et al. (2004) documented a lower resting time at the lowest
space allowance, but inter-individual distances and the level of aggression remained
surprisingly stable across treatments. This is in contrast to several studies in pigs and cattle,
showing an increase in the aggression level when the available space is being reduced (pigs:
Weng et al., 1998; Turner et al., 2000, cattle: Zeeb et al., 1988; Fisher et al., 1997; Fregonesi
and Leaver, 2002). In addition to floor space per se, the different areas of the pen may
represent different qualities, and attractive lying places may be a source of competition. For
example ewes compete for access to resting places next to a wall, and tend to avoid resting in
the centre of the pen even if the flooring material is exactly the same (Marsden and Wood-
Gush, 1986; Færevik et al., 2005; Bøe et al., 2006). As lying space decreases, time spent lying
in close contact to other ewes increased (Bøe et al., 2006), clearly indicating that the
individuals prefer to rest without body contact if the space allowed them to do so.
4

1
2
3
4
5
6
7
8
9
10
11
12
13
14
15
16
17
18
19
20
21
22
23
24
25
Female Mountain goats are reported to interact aggressively much more frequent than most
other female ungulates (reviewed by Fournier and Festa-Bianchet, 1995). Shank (1972)
describes in an elegant way a wide repertoire of social behaviours in goats ranging from the
very intensive ‘rush association’ or ‘clash association’ to the less risky and intensive
threatening movements such as pawing, directing the forehead/horns or one side of the body
towards, or rushing towards the opponent. Some claim that dominance is relatively mild and
not so clear in wild or feral goats (e.g. Stewart and Scott, 1947; Scott, 1948), whereas others
find clear dominance relationships (e.g. Schaller, 1977; Hart, 1985) and a relatively stable
hierarchic order within the flock (Barroso et al., 2000; Cote, 2000). Yet, the dominance
relationships appear to be less stable in time than what is reported for other female ungulates
(Fournier and Festa-Bianchet, 1995).
The aim of the present experiment is to investigate how size and organisation of lying space
influence the resting pattern and social interactions in goats kept in small groups.
Since attractive resting places can be considered an important resource that are worthwhile
competing for, we predict that the overall time spent resting and resting synchronously will
decline with decreasing lying space, that the time spent lying in the less attractive activity area
will increase and that the amount of aggression in the groups will increase. We also expect
that dividing the lying space into two levels rather than one will increase the possibility for
some individuals to avoid each other while resting, and thus more individuals are predicted to
rest simultaneously and the level of aggression is predicted to be lower. Finally, we predict to
find large individual differences in access to the resting areas within groups, and that the
differences between low and high-ranked individuals will increase as the lying space is
reduced.
5
2. MATERIAL AND METHODS 1
2
3
4
5
6
7
8
9
10
11
12
13
14
15
16
17
18
19
20
21
22
23
24
25
2.1 Experimental set-up and pens
Twenty-four goats divided into six groups of four goats, were systematically rotated between
six equally sized experimental pens in a 3 x 2 factorial design with resting areas of different
size (small: 0.50 m2 per goat, medium: 0.75 m2 per goat or large: 1.00 m2 per goat; Fig. 1) and
organisation (one vs. two levels). Total space allowance for each goat irrespective of the size
of lying area was 1.5 m2. We used the same sizes of lying areas as previously used in a similar
study on sheep (Bøe et al., 2006) to be able to compare the results. To get accustomed to the
different pen treatments, the groups stayed one week in each pen, and video recordings were
made in the last 24 hours of each week.
The pens were located in an insulated, mechanically ventilated room where the ambient air
temperature was kept constant around 10 °C. All the pens measured 2.0 x 3.0 m, and the total
lying space was exactly the same in the one and two-level pens (Fig. 1). The height between
first and second level was 0.80 m, and stairs were provided on the right side in front of the
resting area to make an easy access to the second level (pilot studies revealed the need for
these stairs). The resting area in both types of pens, including the second level, was made of
solid, wooden floor covered with a small amount of sawdust. Pen walls were also made of
solid wood. To make it unattractive to lie in the activity/feeding area, wooden beams (1.5” x
2.0”) were placed on the floor at c/c 400 mm, as previously demonstrated in a similar study
on sheep (Bøe et al., 2006).
Figure 1 here
2.2 Animals and feeding
6

1
2
3
4
5
6
7
8
9
10
11
12
13
14
15
16
17
18
19
20
21
22
23
24
25
Healthy, female, dehorned, dry, pregnant (late gestation) goats (between one and four years
old) of a Norwegian milking breed were used in the experiment.
The goats were fed grass silage ad libitum, and they had free access to water from buckets
placed in the feeding through in front of the pen. A total amount of 0.3 kg per goat of standard
concentrates was given in the morning (08.30 hours). Fresh silage was provided, pens were
cleaned and new litter was added both in the morning and in the afternoon (14.30 hours).
2.3 Behavioural observations
All the goats were video recorded in the last 24 hours within each experimental week before
being rotated. Three video cameras (Panasonic WV – BP 310 G) were suspended over the
pens, covering two pens each, and were connected to a multiplexer (Robot MV99P) and a
time-lapse video recorder (Panasonic AG 6720).
Resting pattern was analysed using instantaneous sampling with 10 minutes intervals for 24
hours. Percent of total observations of the following behaviours were then calculated:
- Standing in the activity area
- Standing in the resting area
- Moving (walking or running) in the activity area
- Moving (walking or running) in the resting area
- Lying in the resting area:
a. with or without body contact (<10 cm) with another goat
b. with or without 50% or more of one side of the body in contact (<10 cm) with
a pen wall
7
1
2
3
4
5
6
7
8
9
10
11
12
13
14
15
16
17
18
19
20
21
22
23
24
25
- Lying in the activity area:
a. with or without body contact (<10 cm) with another goat
b. with or without 50% or more of one side of the body in contact (<10 cm) with
a pen wall
From this, % of observations where all four goats within each group were resting
simultaneously on the resting area was calculated. Based on the data from the two-level pens,
we also calculated % of observations where one, two, three or four goats were resting on the
same level in the three two-level pens.
All instances of social interactions were continuously scored for five hours between 09.00 and
14.00 hours during the 24-hour period of video recording in each experimental week. This
was the time of the day when the goats were most active. The following ethogram with
mutually exclusive behaviours was based on previous studies on social interactions in goats
(e.g. Shank, 1972):
- Nosing on/exploring (nose in contact with) another goat
- Frontal clashing (a position where the actor is rearing onto the hind legs with the head
and torso twisted followed by descending forcefully onto the front legs delivering a
powerful strike forwards and downwards reaching the head of the receiver)
- Butting with the head towards the head or shoulders of another goat
- Butting with the head towards other parts of the body
- Chasing (moving quickly after) another goat that tries to escape
- Threatening (pawing or rushing towards, or directing the forehead towards the
opponent but without physical contact)
8

1
2
3
4
5
6
7
8
9
10
11
12
13
14
15
16
17
18
19
20
21
22
23
24
25
- Avoiding (moving the head and/or body away from an approaching goat, but with no
direct interaction)
- Withdrawing (moving the head and/or body away from another goat after a social
interaction)
- Displacing (physically forcing another goat to leave its resting position or feeding
place by pushing or butting sideward or from behind)
Frontal clashing, butting, chasing, threatening, and displacing were then summed into total
number of aggressive interactions.
Withdrawal and avoidance order was the criteria for determining rank within groups (e.g.
Rowell, 1974; Jensen, 1982). Individuals within each group were ranked from 1 to 4 (1 being
the dominant individual) according to how many times they had withdrawn from an
interactions and avoided contact with another goat throughout the entire experimental period.
By using MatMan (Software for matrix manipulation and analysis), we converted a matrix of
withdrawal and avoidance interactions among the goats (based on all treatments) in each
group into a matrix of dominance relationships. The dominant animal of each pair was given
the value ‘1’ whereas a subordinate individual was assigned the value ‘0’. If the dominance
relationship was undecided (either because no dominance interactions occurred or because
both animals performed an equal number of interactions to each other), both animals were
given the value ‘0.5’.
2.4 Statistics
To analyse the effects of size and organisation of lying space on social behaviours, a mixed
model analysis of variance with the following class variable were used (Hatcher and
9
Stepanski, 1994): size of resting area (small: 0.5, medium:0.75, large:1.0 m2 per goat), lying
space organisation (1 or 2 levels), the interaction between size and organisation of lying
space, group (1 to 6) and experimental period (rotation 1 to 6). Group was specified as a
random effect in the model. Mean values per group were used as statistical unit. Differences
between means were investigated by using the Student-Newman Keuls` test. Experimental
period was included to document the development in social interactions over time in the
experiment. Lying/resting pattern was also analysed with a similar mixed model analysis of
variance and with the same class variables.
1
2
3
4
5
6
7
8
9
10
11
12
13
14
15
16
17
18
19
20
21
22
23
24
25
To compare % of observations where 1, 2, 3 or 4 goats were resting simultaneously on the
first versus second level of the resting area, a mixed model analysis of variance with number
of goats resting simultaneously (1, 2, 3 or 4) and group (random effect) as class variables
were used.
The relationship between individual rank and resting pattern within the different pens was
investigated by using a one-way analysis of variance with individual rank (1, 2, 3 or 4) as
class variable.
3. RESULTS
Experimental period (rotation) did not significantly affect resting pattern or social
interactions.
3.1 Resting pattern
Irrespective of whether the lying space was organised on one or two levels, the goats
significantly decreased their resting time from 66 % when the resting area was large, to 61 %
10

when the resting area was small (Table 1). All four goats in each group were lying
simultaneously significantly more often when the resting area was large both when lying
space was organised on one and two levels (Table 1). However, the mean proportion of
observations when this occurred was not more than 21 %, even when the resting area was
large. The goats tended to rest at the same time more frequently when lying space was
organized on one rather than on two levels. Groups differed significantly in how much time
they spent resting simultaneously (F
1
2
3
4
5
6
7
8
9
10
11
12
13
14
15
16
17
18
19
20
21
22
23
24
25
5,25=4.7, P<0.01), ranging from 0.6% of the observations
in one group to 23% in another, irrespective of treatment. This suggests that resting pattern
may also depend on the types of individuals that are grouped together. When decreasing the
resting area from large to small, the goats increased their time spent resting in the low-
comfort activity area significantly from 4 % to 16 % on average (Table 1), but there was no
significant difference between groups. There was a large individual difference within groups
in time spent resting and the proportion of time resting in the activity area. When the resting
area was large, the individual range in total resting time was from 46 to 77% in the one-level
pen, whereas the corresponding range in the two-level pen was from 24 to 81%. At the largest
lying space, the proportion of time spent lying in the activity area varied between 0 and 38%
in the one-level pen, whereas this range was between 0 and 58% in the two-level pen. These
ranges increased when the resting area decreased, and when the resting area was small, the
time spent lying in the activity area varied as much as between 0 and 88% when the resting
area was on one level compared to a range of 0 to 96% in the two-level pen.
The goats were lying in body contact in less than 7% of the observations lying in all
treatments (Table 1). Lying in contact with another goat occurred more frequently in the one-
level than in the two-level pens, irrespective of the size of the resting area (Table 1), and there
was no significant difference between the groups in this behaviour. Time spent resting in
11
contact with a pen wall increased from 68 % of observations lying when lying space was
small to 82 % when lying space was large (Table 1). There were no significant effects of lying
space organisation on how much time the goats spent lying against a wall, but the groups
tended to differ in this behaviour (F
1
2
3
4
5
6
7
8
9
10
11
12
13
14
15
16
17
18
19
20
21
22
23
24
25
5,25=2.5, P=0.06).
There were no significant interactions between size and organisation of lying space in any of
the behaviours related to resting pattern.
3.2 The use of first vs. second floor in the two-level pens
We never observed four goats resting on the same level simultaneously in any of the two-
level pens, and three goats resting on the same level rarely occurred even when the resting
area was large (Fig. 2). One or two goats resting at the same time on both levels was the most
common resting pattern. At a medium resting space, one goat resting on the second level was
more frequently observed than two goats (first level: one goat: 37.7±3.8%, two goats:
41.9±8.4%, three goats: 0.9±0.9%, F2,10=13.9, P<0.01; second level: one goat: 55.6±6.1%,
two goats: 24.0±7.0%, three goats: 0.6±0.5%, F2,10=18.2, P<0.001). When the resting area
was small, one goat resting on each level occurred in more than 50% of the observations and
significantly more often than two goats (17-23%; first level: F2,10=30.7, P<0.0001; second
level: F2,10=15.3, P<0.001). There were no significant differences between groups with
respect to how frequent one, two or three goats were resting on each of the two levels.
3.3 Social interactions
There were no significant effects of the size of the resting area on the number of agonistic
interactions between the goats, but they tended to displace each other more frequently when
lying space was medium than when lying space was small (Table 2). Lying space on two
12

levels resulted in significantly fewer displacements, and the overall aggression level was
lower than when lying space was organised on one level (Table 2). Furthermore, when lying
space was on two levels, there were fewer incidents where the goats fled/withdrew from an
interaction or avoided interactions with others. There were significant differences between
groups in the amount of threats and defensive behaviours (threat: F
1
2
3
4
5
6
7
8
9
10
11
12
13
14
15
16
17
18
19
20
21
22
23
24
25
5, 20 = 5.5, P<0.01;
avoidance: F5,20 = 10.4, P<0.0001; withdrawal: F5, 20 = 5.2, P<0.01) made by the goats, but
none of the other social behaviours differed significantly between groups. Even within the
‘large resting area’ treatment, the total number of aggressive interactions within a group
varied between 0 and 24 (lying space on one level) and between 2 and 12 (lying space on two
levels), suggesting that the amount of aggression was strongly dependent on the individuals
that were grouped together. There was a huge individual variation in aggression level within
the different groups, ranging from some individuals not initiating any aggressive conflicts at
all to one individual initiating more than 50 aggressive interactions within a 6-hour period. On
average there was one goat in each group during each treatment that initiated less than two
aggressive interactions.
There was a significant interaction between size and organisation of lying space concerning
the number of displacements (F2,20 =5.7, P<0.05). When lying space was organised on one
level, the number of displacements were highest for the medium lying space whereas this was
the case for the large lying space in the two-level pen (Large lying space, one level: 2.1±0.5,
Medium lying space, one level: 4.3±0.8, Small lying space, one level: 2.1±0.6; Large lying
space, two levels: 2.0±0.3, Medium lying space, two levels: 1.4±0.2, Small lying space, two
levels: 1.5±0.2). Concerning the other social behaviours, there were no significant interactions
between size and organisation of lying space.
13
3.4 Dominance relationships and the use of resting areas 1
2
3
4
5
6
7
8
9
10
11
12
13
14
15
16
17
18
19
20
21
22
23
24
25
Calculated matrixes of dominance relationships showed that the individuals in three of the
groups could be ranked from 1 to 4 (1 is the highest rank and 4 is the lowest rank) with
respect to the number of times one individual had withdrawn from an interaction or avoided
another goat. In another two groups, one individual was dominant over the other three (one
received rank 1, and three received rank 2). In the last group, no clear dominance relationship
occurred with respect to avoidance and withdrawal, and this group was thus excluded from
further analysis.
The lowest ranked (rank 4) goat spent less time resting than the other individuals in most of
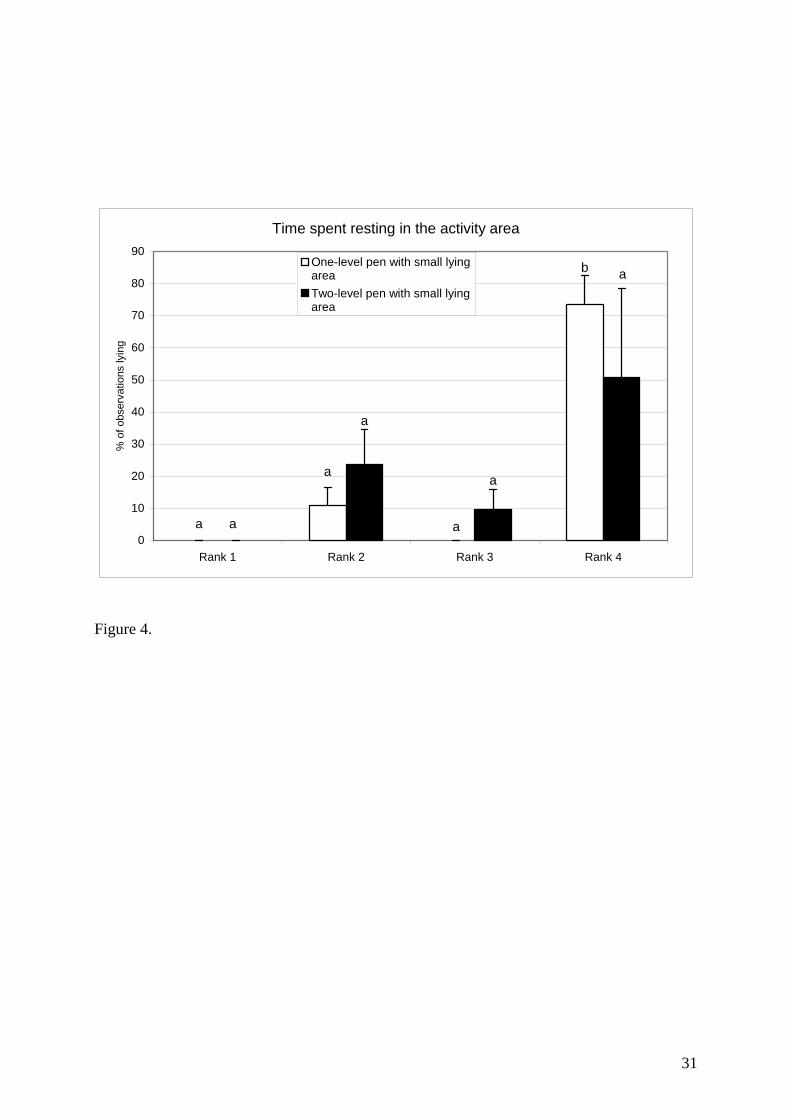
the pens (One-level: large: F3,19=0.03, P<0.05, medium: F3,19=9.1, P<0.001, small: Fig. 3;
Two level: large: F3,19=3.6, P< 0.05, medium: F3,19=4.2, P<0.05), except for the two level pen
with small resting area where there was no significant effect of social rank (Fig. 3).
In the one-level pen with a large resting area all individuals spent more than 90% of their
resting time on the resting area. In most of the other pens, the lowest ranked individual in
each group spent significantly more time (% of observations lying) resting in the activity area
than the other individuals (One-level: large: F3,19=0.6, P=0.65, medium: F3,19=6.6, P<0.01,
small: Fig. 4; Two level: large: F3,19=39.2, P< 0.0001, medium: F3,19=254.7, P<0.0001, small:
Fig. 4).
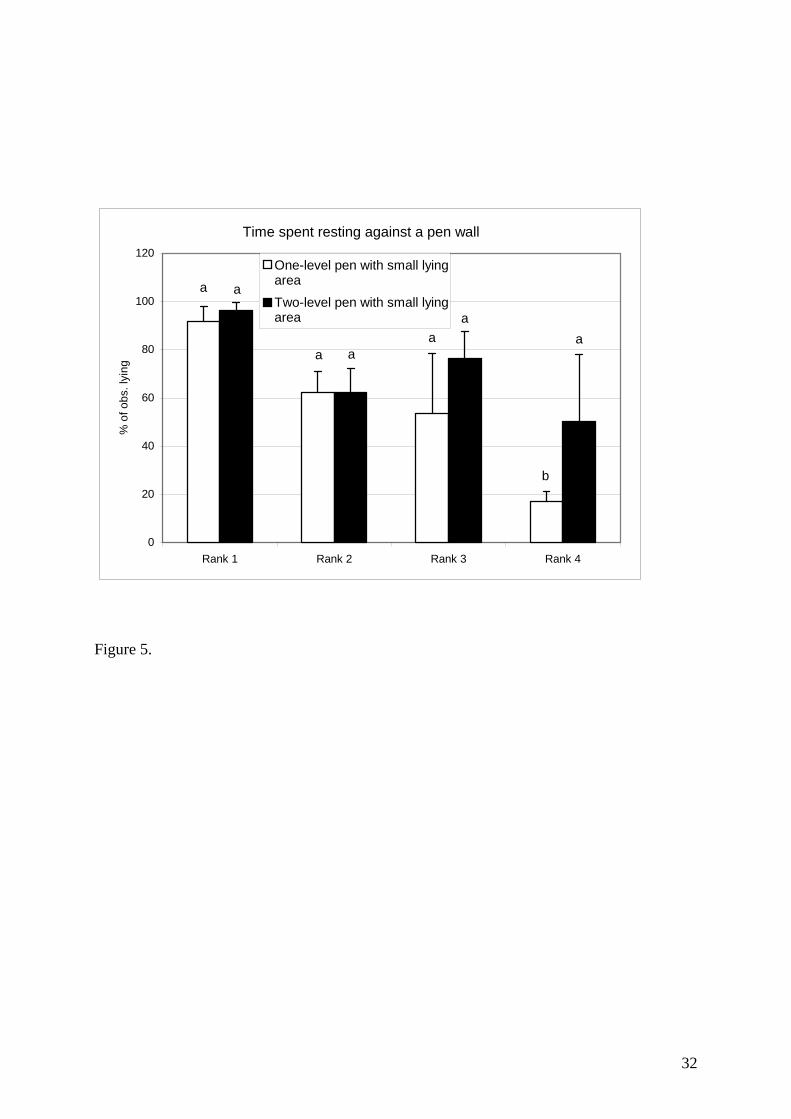
In the one-level pen with large resting area all goats were resting against a pen wall in 64 to
98% of the observations lying, irrespective of social rank. In the other pens, the extent to
which the goats were lying against a wall decreased with decreasing rank (One-level: large
resting area: F3,19=1.2, P=0.33, medium resting area: F3,19=4.0, P<0.05, small resting area:
14
1
2
3
4
5
6
7
8
9
10
11
12
13
14
15
16
17
18
19
20
21
22
23
24
25
Fig. 5; Two level: large: F3,19=3.5, P< 0.05, medium: F3,19=15.4, P<0.0001), except for the
two-level pen with small resting area where it was hardly possible to rest without wall contact
(Fig. 5).
There was no significant effect of social rank on the use of first vs. second level for resting. In
three out of five groups, the highest ranked individual spent 93 to 96% of their resting time on
the first level whereas in the other two groups they spent all their resting time on the second
floor in the pen with the large resting area. In most of the groups, the first and second ranked
individual rested on separate levels, irrespective of the size of the resting area.
4. DISCUSSION
The main results from the present study showed that resting pattern in goats was more
dependent on size than organisation (one vs. two levels) of lying space, whereas this was the
opposite for social interactions. Loretz et al. (2004) found no effect of space allowance per se
on the aggression level in social groups of goats, but when lowering the space allowance from
2.0 to 1.0 m2, the proportion of time spent lying decreased. In accordance with previous
results in sheep (Bøe et al., 2006) and complementary to the results of Loretz et al. (2004), the
present experiment documented that the lying time decreased even further when available
lying space decreased from 1.0 to 0.5 m2, reaching a level of 61% of the observations when
the smallest resting area was used. In comparison, the proportion of time lying was around
75% of the observations at 2.0 m2 per goat in the study of Loretz et al. (2004). Comparatively,
the goats rested in 66 % at the largest resting space in the present study, which may suggest
that the environment was far from being optimal in terms of achieving adequate rest for the
goats. This can be due to the larger amount of agonistic interactions in the present study that
both had a smaller group size and 0.5 m2 less floor space per goat than what Loretz et al.
15

(2004) used in their study. It is important to be aware that while changing the size of the
resting area in the present study, the total available floor space was kept constant on 1.5 m
1
2
3
4
5
6
7
8
9
10
11
12
13
14
15
16
17
18
19
20
21
22
23
24
2
per goat. Despite the significant effects of the size of the resting area in the present study, the
actual change in percent of observations resting from the largest to the smallest lying area was
only 5% and the corresponding increase in percent of observations resting in the activity area
was 15%. Furthermore, there was no effect of size of the lying area on the amount of
agonistic interactions. Thus, the direct welfare consequences by this decrease in lying space
may be considered as minor. Increasing the total space allowance and thereby allowing more
personal space may thus be of greater importance to reduce aggression and to increase resting
time than changing the size of the lying areas per se. According to Jensen et al. (2005), heifers
show an inelastic demand to rest for at least 50% of a 24-H period, which suggests that resting
is a strong, basic need for the animals. No such studies have been conducted in goats, and thus
we know little about what is the preferred resting time and resting pattern for this species.
In accordance with what was predicted and previously found in sheep (Bøe et al., 2006), the
goats were resting less synchronously, and they were lying more in the less comfortable
activity area when lying space was decreased. However, in contrast to sheep that also spent
more time resting in close proximity of other group members as the lying space declined, the
goats strongly avoided this during all treatments. Even in the largest lying space, the goats
only spent around 3% of the resting observations lying in body contact with another
individual, whereas the corresponding value for sheep was 60% (Bøe et al., 2006). This
supports the results of Lyons et al. (1993) who found that sheep spent more time near pen-
mates and showed greater adrenocortical responses when separated from pen-mates than did
goats, suggesting that goats have a more individualistic nature and prefer a larger distance to
16
1
2
3
4
5
6
7
8
9
10
11
12
13
14
15
16
17
18
19
20
21
22
23
24
25
other individuals. They also express separation anxiety differently in that the sheep showed a
higher locomotive activity whereas vocal rates were higher in goats (Lyon et al., 1993).
When lying space was divided into two levels rather than one, the amount of aggressive
conflicts declined as predicted, but in contrast to what was predicted, this did not result in
more individuals resting simultaneously. The latter can be explained by the more limited lying
space on each level when the resting area is separated on two floors than when all available
lying space is concentrated on one level.
Although sheep and goats are both herd-living ungulates that are born into structured social
groups (e.g. Shackleton and Shank, 1984), they still differ in their social behaviour. In
contrast to sheep mothers and their lambs that keep in close proximity and interact frequently,
newborn goat kids can spend much time away from their mother lying hidden at a distance
(Lickliter, 1984). Adult sheep also seek close proximity to social companions much more than
goats (Hafez et al., 1969), and it is more difficult to separate two sheep when faced with a
human handler than a pair of goats (Scott, 1945). This most likely reflects adaptation to
different habitats where the species originally evolved, since wild goats tend to live in more
competitive environments than do wild sheep.
If goats prefer larger individual distances when resting as suggested by the present study, this
may also explain why the amount of aggressive interactions is lower when lying space in
divided on two separate levels. Using resting areas on different levels or several separated
resting places instead of one large area would thus probably be a good way of reducing the
aggression and social stress in groups of goats. The goats appeared to prefer wall space for
resting in a similar way as sheep (Bøe et al., 2006) and domestic fowl (e.g. Cornetto and
Estevez, 2001). This may be due to increased comfort, but in poultry this has been explained
17
as an anti-predator strategy suggesting that the animals may feel safer close to a wall than in
an open area. Since providing solid partitions between the animals may reduce the likelihood
of aggressive interactions (e.g. Andersen et al., 1999), the use of individual resting stalls
could be an interesting alternative to increase the overall resting time in goats, especially if
lying space is limited. Time spent resting synchronously in the present study (20% of the
observations lying) was much lower than what was found in sheep (45% of observations
lying) at a lying space of 1.0 m
1
2
3
4
5
6
7
8
9
10
11
12
13
14
15
16
17
18
19
20
21
22
23
24
25
2. This can be due to interspecies differences in resting pattern,
but also that the goats need a larger social space due to a different social motivation and
preferences than sheep. Fournier and Festa-Bianchet (1995) states that goats are more
frequently involved in aggressive interactions than other ungulates and this should be taken
into consideration when designing houses for goats. When legislations concerning space
requirements are made, preferred individual distances and individual differences in the use of
space in social groups should be emphasized rather than the need for physical space per se.
The most common resting pattern in the two-level pen with the large resting area was that one
or two goats were resting simultaneously on each level. However, it was only when the
resting area was large that all goats could rest simultaneously in this type of pen. Our
experience from the present study indicates that since the preferred distance between resting
individuals appears to be high, we would expect more individuals to rest on the same level if
the length of the large two-level resting area is increased while the depth is maintained. To be
able to document this, we have to study the exact individual distances between goats. The
differences in access to the resting area between goats of different social rank appeared to be
stronger when lying space was on one rather than two levels, probably because it is easier to
monopolize one big resting area. As predicted, low-ranked individuals rested less and spent
more time resting in the less attractive activity area than high-ranked goats, and in the one-
18
1
2
3
4
5
6
7
8
9
10
11
12
13
14
15
16
17
18
level pens this difference was most pronounced when the resting area was medium or small.
Thus, low-status individuals are likely to get too little rest in such an environment.
5. CONCLUSION
In conclusion, time spent resting and resting synchronously decreased whereas the time spent
resting in the activity area increased as the resting area became smaller irrespective of
whether the resting area was organised on one or two levels. Low-status individuals suffered
more from a reduced resting time, and were forced to rest more on the low-comfort activity
area than high-status goats. The organisation of lying space had little impact on the resting
time and the resting pattern of the goats, but the amount of agonistic interactions was lower
when the resting are was organised on two levels, which suggest that this may be a
recommendable system in commercial herds. In general, the goats preferred to rest against a
wall and without body contact with other individuals.
Acknowledgements
The authors would like to acknowledge Tine Norske Meierier BA for financing this
experiment. We also thank our research technicians Kari Eikanger and Agnes Kloumann for
their excellent assistance.
19
REFERENCES
Andersen, I. L., Bøe, K. E., Kristiansen, A. L., 1999. The influence of different feeding
arrangements and food type on competition at feeding in pregnant sows. Appl. Anim.
Behav. Sci. 65, 91-104.
Barroso, F. G., Alados, C. L. and Boza, J., 2000. Social hierarchy in the domestic goat: effect
on food habits and production. App. Anim.Behav. Sci. 69, 35-53.
Bøe, K.E., Berg, S., Andersen, I.L., 2006. Resting behaviour and dicplacements in ewes –
effects of reduced lying space and pen shape. Appl. Anim. Behav. Sci. 98, 249-259.
Cornetto, T. L. and Estevez, I., 2001. Influence of vertical panels on use of space by domestic
fowl. Appl. Anim. Behav. Sci. 71, 141-153.
Côté, S. D., 2000. Dominance hierarchies in female mountain goats: stability, aggressiveness
and determinants of rank. Behav. 137, 1541-1566.
Estevez, I., Andersen, I. L. and Nævdal, E., 2006. Group size, density and social dynamics in
farm animals. Appl. Anim. Behav. Sci., in press.
Fisher, A. D., Crowe, M. A., Kiely, P. O. and Enright, W. J., 1997. Growth, behaviour, adrenal
and immune response of finishing beef heifers housed on slatted floors at 1.5, 2.0, 2.5
or 3.0 m2 space allowance. Livest. Prod. Sci. 51, 245-254.
20

Fraser, A. F. and Broom, D. M., 1997. Farm Animal Behaviour and Welfare (3rd ed.), CAB
Int., 435 pp.
Fournier, F. and Festa-Bianchet, M., 1995. Social dominance in adult female mountain goats.
Anim. Behav. 49, 1449-1459.
Fregonesi, J.A., Leaver, J.D., 2004. Influence of space allowance and milk yield level on
behaviour, performance and health of dairy cows housed in straw yard and cubicle
systems. Livest. Prod. Sci. 78, 245-257.
Færevik, G., Andersen, I.L. and Bøe, K.E., 2005. Preferences of sheep for different types of
pen flooring. Appl. Anim. Behav. Sci. 90, 265-276.
Hafez, E.S.F (Editor), 1969. The Behaviour of Domestic Animals (2nd ed.), book review,
Bailliere, Tindall & Cassell, London, p. 424.
Hart, B. L., 1985. In: The behaviour of domestic animals, Freeman, New York, p. 390.
Hatcher, L and Stepanski, E. J., 1994. A Step-by-Step Approach to Using the SAS® System
for Univariate and Multivariate Statistics, Cary, NC: SAS Institute Inc., 552 pp.
Jensen, P., 1982. An analysis of agonistic interaction patterns in group-housed dry sows -
Aggression regulation through an ‘avoidance order’. Appl. Anim. Eth. 9, 47-61.
21
Jensen, M. B., Pedersen, L. J. and Munksgaard, L., 2005. The effect of reward duration on
demands functions for rest in dairy heifers and lying requirements as measured by
demand functions. Appl. Anim. Behave. Sci. 90, 207-217.
Lickliter, R. E., 1984. Hiding behavior in domestic goat kids. Appl. Anim. Behav. Sci. 12,
245-251.
Loretz, C., Wechsler, B., Hauser, R., Rüsch, P., 2004. A comparison of space requirements of
horned and hornless goats at the feed barrier and in the lying area. Appl. Anim. Behav.
Sci. 87, 275-283.
Lyons, D. M., Price, E. O., and Moberg, G.P., 1993. Social grouping tendencies and
seprataion-induced distress in juvenile sheep and goats. Dev. Psychobiol. 26, 251-259.
Marsden, M.D. and Wood-Gush, D.G.M., 1986. The use of space by group-housed sheep.
Appl. Anim. Behav. Sci. 15, 178.
Milinski, M., Parker, G.A. 1991. Competition for resources. In: J.R. Krebs and N.B. Davies
(Eds.) Behavioural ecology. Blackwell Scientific, Oxford, pp.137-168.
Mogensen, L., Krohn, C.C., Sørensen, J.T. Hinhede, J. and Nielsen, L.H., 1997. Associations
between resting behaviour and live weight gain in dairy heifers housed in pens with
different space allowance and floor type. Appl. Anim. Behav. Sci. 55, 11-19.
22
Nielsen, H. L., Mogensen, L., Krohn, C., Hindhede, J. and Sørensen, J. T., 1997. Resting and
social behaviour of dairy heifers housed in slatted floor pens with different sized
bedded lying areas. Appl. Anim. Behav. Sci. 54, 307-316.
Rook, A.J. and Penning, P.D., 1991. Synchronization of eating, ruminating and idling activity
by grazing sheep. Appl. Anim. Behav. Sci. 32 (2-3), 157-166.
Rowell, T. E., 1974. The concept of social dominance. Behav. Biol. 11, 131-154.
Schaller, G.B., 1977. Mountain monarchs. Univ. of Chicago Press, Chicago.
Scott, J. P., 1945. Social behaviour, organization and leadership in a small flock of domestic
sheep. Comp. Psychol. Mono. 18, 1-29.
Scott, J. P., 1948. Dominance and the frustration-aggression hypothesis. Physiol. Zool. 21,
31-39.
Shank, C.C., 1972. Some aspects of social behaviour in a population of feral goats (capra
hircus L.). Z. Tierpsychol. 30, 488-528.
Shackleton, D. M. and Shank, C. C., 1984. A review of the social behaviour of feral and wild
sheep and goats. J. Anim. Sci. 58, 500-509.
Stewart, J. C. and Scott, J. P., 1947. Lack of correlation between leadership and dominance
relationships in a herd of goats. J. Comp. Physiol. Psychol. 40, 255-264.
23

24
Toussaint, G., 1997. The housing of milk goats. Livest. Prod. Sci. 49, 151-164.
Turner, S. P., Ewen, M., Rooke, J. A., Edwards, S. A., 2000. The effect of space allowance on
performance, aggression and immune competence of growing pigs housed on straw
deep-litter at different group sizes. Livest. Prod. Sci. 66, 47-55.
Weng, R.C., Edwards, S.A. and English, P.R., 1998. Behaviour, social interactions and lesion
scores of group-housed sows in relation to floor space allowance. Appl. Anim. Behav.
Sci. 59, 307-316.
Zeeb, K., Bock, C., Heinzler, B., 1988. Control and social stress by consideration of suitable
space. In: Zayan, R., Dantzer, R. (Eds.). Social stress in domestic animals. Kluwer
Academic Publishers, Dordrecht, The Netherlands, 275-281
Tables
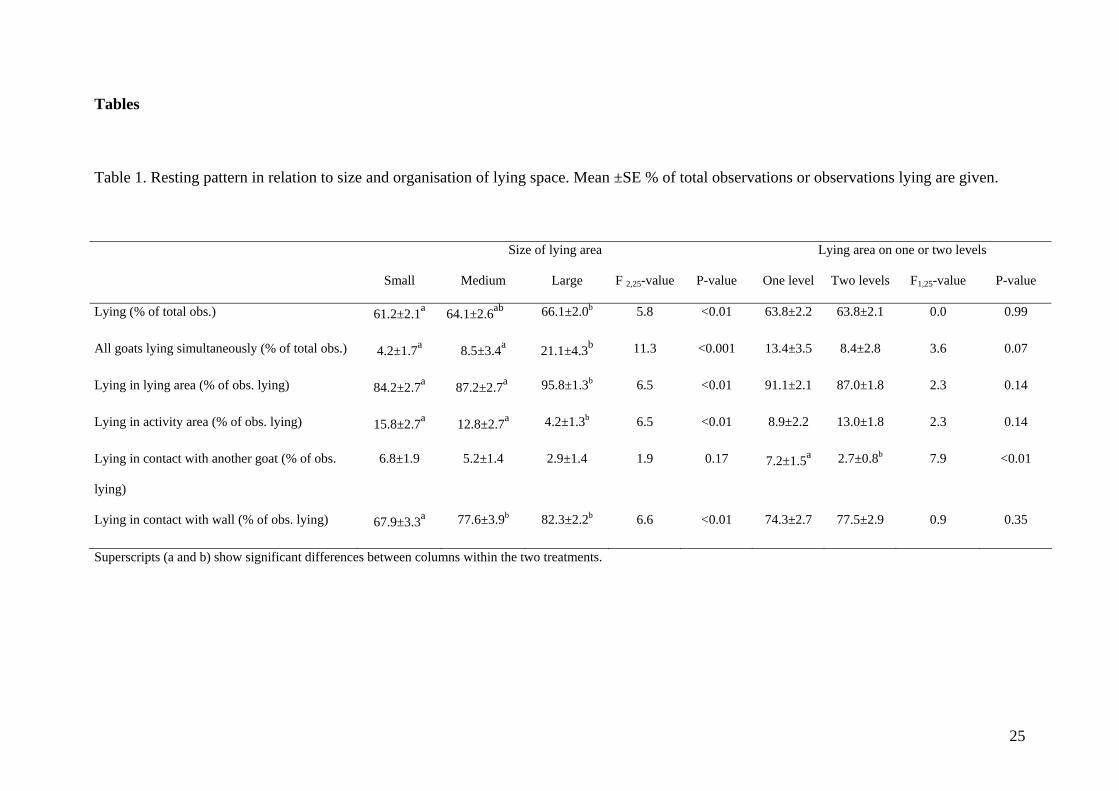
Table 1. Resting pattern in relation to size and organisation of lying space. Mean ±SE % of total observations or observations lying are given.
Size of lying area Lying area on one or two levels
Small Medium Large F 2,25-value P-value One level Two levels F1,25-value P-value
Lying (% of total obs.) 61.2±2.1a 64.1±2.6ab 66.1±2.0b 5.8 <0.01 63.8±2.2 63.8±2.1 0.0 0.99
All goats lying simultaneously (% of total obs.) 4.2±1.7a 8.5±3.4a 21.1±4.3b 11.3 <0.001 13.4±3.5 8.4±2.8 3.6 0.07
Lying in lying area (% of obs. lying) 84.2±2.7a 87.2±2.7a 95.8±1.3b 6.5 <0.01 91.1±2.1 87.0±1.8 2.3 0.14
Lying in activity area (% of obs. lying) 15.8±2.7a 12.8±2.7a 4.2±1.3b 6.5 <0.01 8.9±2.2 13.0±1.8 2.3 0.14
Lying in contact with another goat (% of obs.
lying)
6.8±1.9 5.2±1.4 2.9±1.4 1.9 0.17 7.2±1.5a 2.7±0.8b 7.9 <0.01
Lying in contact with wall (% of obs. lying) 67.9±3.3a 77.6±3.9b 82.3±2.2b 6.6 <0.01 74.3±2.7 77.5±2.9 0.9 0.35
Superscripts (a and b) show significant differences between columns within the two treatments.
25

26
Table 2. Number of social interactions (mean ± SE) in pens with different size and organisation of lying space.
Size of lying area, m2/goat Lying area on one or two levels
0.5 0.75 1.0 F 2,20-value P-value One level Two levels F1,20-value P-value
Nose/explore 0.7±0.2 1.2±0.3 1.0±0.3 1.0 0.40 1.2±0.2 0.8±0.2 1.2 0.28
Frontal clashes and butting towards head
/shoulders
2.2±0.5 2.8±0.8 3.7±1.1 0.7 0.53 3.6±0.9 2.3±0.4 0.12 0.73
Butting towards rest of the body 1.3±0.3 1.2±0.4 1.8±0.5 1.23 0.31 1.6±0.4 1.3±0.3 1.1 0.30
Displace 1.8±0.3 2.8±0.6 2.1±o.3 2.9 0.08 3.0±0.5 1.6±0.2 11.8 < 0.01
Chase 0.4±0.2 0.4±0.2 0.5±0.2 0.2 0.79 0.6±0.2 0.2±0.1 3.4 0.08
Threat 0.8±0.3 0.7±0.3 0.8±0.4 0.0 1.0 1.0±0.3 0.6±0.1 1.4 0.25
Aggressive Interactions* 6.4±0.8 8.0±1.6 8.9±2.1 0.9 0.4 9.7±1.6 6.0±0.7 4.2 < 0.05
Avoid 0.9±0.3 0.8±0.2 1.1±0.3 1.4 0.28 1.2±0.2 0.7±0.1 5.7 < 0.05
Withdraw/flee 3.7±0.8 3.9±1.3 4.1±1.2 0.1 1.0 5.0±1.2 2.9±0.4 3.5 0.08
*Aggressive interactions include clash, butt, displace, chase and threat.

Figure legends
Figure 1. Experimental pens
Figure 2. Percent of observations (means + SE) where one, two or three goats were
simultaneously resting on one of the levels in the large two-level pen.
Differences between white bars: F 2,10=6.4, a,b: P<0.05; differences between
black bars: F 2,10=12.8, c,d: P<0.001
Figure 3. Percent of observations (means + SE) resting for individuals with different
social rank (1 is the highest rank and 4 is the lowest rank) when lying space
was small. Differences between white bars: F3,19=7.7; a,b: P<0.01.
Figure 4. Percent of observations (means +SE) resting in the activity area for individuals
with different social rank (1 is the highest rank and 4 is the lowest rank) when
lying space was small. Differences between white bars: F3,19=7.7; a,b:
P<0.0001.
Figure 5. Percent of observations (means + SE) resting against a pen wall for individuals
with different social rank (1 is the highest rank and 4 is the lowest rank) when
lying space was small. Differences between white bars: F3,19=5.6; a,b: P<0.01.
27

0.5 m2 per goat 0.75 m2 per 1.0 m2 per goat
Food and waterFood and waterFood and water
3000 mm
500mm 750 mm 2000 mm
2000 mm1500 mm1000 mm
One level
Two levels
Lying space:
Food and water Food and waterFood and water
2000 mm
Figure 1.
28

Goats lying on first vs. second floor at large lying space
b
aa
d
cc
0
10
20
30
40
50
60
One goat Two goats Three goats
% o
f obs
.
First levelSecond level
Figure 2.
29

Time spent resting
b
a
aa
aa
aa
10
20
30
40
50
60
70
80
Rank 1 Rank 2 Rank 3 Rank 4
% o
f tot
. obs
.
One-level pen with smalllying area
Two-level pen with smalllying area
Figure 3.
30
Time spent resting in the activity area
b
a
a
a
a
a
a
a0
10
20
30
40
50
60
70
80
90
Rank 1 Rank 2 Rank 3 Rank 4
% o
f obs
erva
tions
lyin
g
One-level pen with small lyingareaTwo-level pen with small lyingarea
Figure 4.
31
Time spent resting against a pen wall
b
aa
a
aa
a
a
0
20
40
60
80
100
120
Rank 1 Rank 2 Rank 3 Rank 4
% o
f obs
. lyi
ng
One-level pen with small lyingarea
Two-level pen with small lyingarea
Figure 5.
32

![Deriving reproducible biomarkers from multi-site resting ... · proven to capture interactions between brain regions that may lead to neuropathology diagnostic biomarkers [6]. Nu-merous](https://static.documents.pub/doc/80x56/601e65b2d42c196c9848e446/deriving-reproducible-biomarkers-from-multi-site-resting-proven-to-capture-interactions.jpg)


