Results from the 2020 EP3 Survey to Physics Department Chairs: External Report Stephanie Chasteen (Chasteen Educational Consulting) Joel C. Corbo (University of Colorado Boulder) Robert Dalka (University of Maryland College Park) Chandra Turpen (University of Maryland College Park) 1 October 27, 2020 1 The authors contributed equally to this survey study, and we therefore list ourselves in alphabetical order. SC, CT and JC led on the survey development and data collection, RD and CT led on the data analysis, and the whole team contributed to writing this report. Questions about this report from members of the EP3 project team should be directed to Stephanie Chasteen ([email protected]). Questions about this report from anyone outside of the EP3 project team should be directed to Chandra Turpen ([email protected]).
Transcript
Results from the 2020 EP3 Survey to Physics Department Chairs:
External Report
Stephanie Chasteen (Chasteen Educational Consulting) Joel C. Corbo (University of Colorado Boulder)
Robert Dalka (University of Maryland College Park) Chandra Turpen (University of Maryland College Park) 1
October 27, 2020
1 The authors contributed equally to this survey study, and we therefore list ourselves in alphabetical order. SC, CT and JC led on the survey development and data collection, RD and CT led on the data analysis, and the whole team contributed to writing this report. Questions about this report from members of the EP3 project team should be directed to Stephanie Chasteen ([email protected]). Questions about this report from anyone outside of the EP3 project team should be directed to Chandra Turpen ([email protected]).
1
Table of Contents Executive Summary 2
What is the EP3 project? 4
Methodology 6
Findings 8 Physics Departments Facing and Responding to Threats 8 Prevalent Problems that Physics Departments Face 11 Existence and Use of Guiding Organizational Documents 12 Departmental Culture of Assessment and Change 14 Program Review Practices 18
Conclusions 21
References 22
Appendix A: Summary of other survey findings 23
Appendix B: Additional Information about the Survey Sample 24
2
Executive Summary The APS Effective Practices for Physics Programs (EP3) Project Team surveyed chairs at physics-degree-granting departments nationwide to assess their perspectives on assessment practices and departmental change. The EP3 research team (J. Corbo, R. Dalka, and C. Turpen) and evaluator (S. Chasteen) share these results to inform the community’s ongoing work to sustain and strengthen physics programs across the country. These findings provide insights that stakeholders at local and regional levels can use to advocate for physics programs. Additionally, these results will inform the development of the EP3 Guide in addressing effective departmental change, assessment practices, and program review. Threats to Sustainability: Department chairs were asked to reflect on threats, unrelated to the Covid-19 pandemic, to the continuity of their programs. These threats included financial strain, reductions in personnel, and deprioritization by administration. Of the survey respondents (N = 310), 45.2% reported experiencing a moderate or severe threat, which is a substantial and concerning number. A majority of departments facing threats were unlikely to consult outside resources when addressing the threatened actions. Resources developed by professional societies paired with collective responses from the larger physics community would help to support these departments in addressing threats. Problems Departments Face: Department chairs were asked to report on the most prevalent problems facing their departments, including those at the program level (e.g. curricula, climate) as well as external problems (e.g. finances). Department chairs reported problems relating to retention of underrepresented students, student enrollment and preparation, and external resources as their top concerns. Departmental Culture of Assessment and Change: Chairs perceived the assessment of student learning and departmental program outcomes as largely driven by compliance and as not leading to valuable change. However, chairs’ visions of ideal assessment practices and department change processes largely align with the guiding principles of the EP3 Project. Our results show that chairs’ vision for an ideal department was largely misaligned with their current modes of operation. The cultural practices with the most potential for improvement were 1) engaging multiple stakeholders and 2) using data effectively. These results will motivate future studies of how physics departments across the nation establish and maintain a culture of assessment and effective change. Program Review: Chairs perceived program review as being a valuable practice, generally approached as an opportunity for improvement, and resulting in positive change for the department. Most, but not all, indicated that external program review is part of that review process, and (for those with external review) it is cited as being one of the most helpful components of a review. However, nearly half of chairs indicated that review was approached
3
as a task for institutional requirements. Many felt that the review did not elicit useful responses from administrators (such as allocation of resources), suggesting a mismatch of expectations. Summary of Key Findings: The key findings discussed in more detail in this report are:
1. Almost half of physics departments have faced a moderate or substantial threat to the sustainability of their program.
2. In preparing to address threats, departments tend to collect data and talk with relevant stakeholders, but are unlikely to consult outside resources (e.g. reports).
3. In responding to threats, only a third of departments successfully avoided the threat and only a quarter received support from their institution to do so.
4. Departments reported problems relating to retention of underrepresented students, student enrollment and preparation, and financial and physical resources as their top concerns.
5. Most departments have articulated learning outcomes, but fewer have articulated strategic plans and curriculum maps.
6. While the vast majority of departments that have organizing documents use them somehow, most of these departments could use them more productively.
7. Assessments are largely not seen as leading to change, although chairs aspire for them to do so. Additionally, assessments are driven by external requirements more than is ideal, indicating a compliance focus.
8. Chairs see substantial room for improvement in how they go about changing the undergraduate physics program, especially when it comes to engaging multiple stakeholders and using data effectively.
9. Program review is usually seen as a valuable process; particularly external review. 10. Program review is usually required and approached as a task to fulfill institutional
requirements, but administrative involvement is mixed.
4
What is the EP3 project?
About EP3 The Effective Practices for Physics Programs (EP3) Project, led by the American Physical Society (APS) and the American Association of Physics Teachers (AAPT), aims to help physics programs respond to challenges they face by gathering and sharing knowledge, experience, and proven good practice. The EP3 Project began with the creation of the Best Practices for Undergraduate Physics Programs (BPUPP) task force in 2016, charged by the APS Council with developing a guide for self-assessment of undergraduate physics programs. The resulting EP3 Guide will allow programs to create, improve, and assess their individual programs in a way that can respond to local constraints, resources, and opportunities, while being informed by current research and good practice within the discipline. The Guide will include both a set of effective practices, and a guide for departmental review. It will include considerations of curricula, pedagogy, advising, mentoring, recruitment and retention, research and internship opportunities, diversity, scientific skill development, career/workforce preparation, staffing, resources, and faculty professional development. In addition to creating the EP3 Guide, the project will train physics program leaders and reviewers in how to use the Guide through workshops and Departmental Action Leadership Institutes (DALIs). The research arm of the EP3 project will investigate the impacts of the EP3 Guide and associated EP3 community engagement activities.
EP3 Vision of Success EP3 project aims to support physics departments in developing: (1) a departmental culture of systematic self-improvement and reflection, and (2) effective processes for enacting change. Thus, if departments simply take up the practices in the guide (such as “design meaningful undergraduate research experiences” or “implement a teacher preparation pathway”), but not any of the effective change processes (such as determining critical goals, engaging in self-reflection, and engaging key stakeholders), the goal of culture change is less likely to be achieved. A core aspect of the EP3 philosophy is that successful physics departments engage in cyclic self-reflection on their own processes and outcomes to guide their decisions and actions. We believe that effective change efforts in a department are:
1. Deliberately designed: driven by a clear understanding of the problem to be solved and current priorities.
2. Context-dependent: driven by local goals, challenges, and contexts, rather than external mandates.
3. Driven by a sense of ownership by department members of the process and outcomes, including a sense of collective responsibility for the health of the department.
4. Driven by broad engagement, so that a range of stakeholders are involved, actions (even if driven by a champion) involve a collaborative process, and work is grounded in a commitment to equity and inclusion.
5. Grounded in evidence, including an accurate understanding of the available evidence about the problem and decision-making based on appropriate interpretation of the evidence.
6. Ongoing: change is not considered to be a one and done activity, but instead change processes include opportunities to revisit outcomes and decisions on a regular basis.
Additionally, we see successful change efforts as drivers of positive improvements to departmental culture. We propose that positive department culture:
1. Embraces assessment as a driver of change, through collecting data from a broad range of sources and using the results to make decisions.
2. Embraces experimentation by encouraging risk-taking and innovation and learning from failures and successes.
3. Supports collective action and ownership by distributing power over decision-making in meaningful and equitable ways, supporting many stakeholders to work in partnership, and engendering good communication and trust.
4. Includes shared stewardship, the understanding that everyone has a shared responsibility for supporting the well-being of the department as a whole.
5. Includes a shared mission, including a shared understanding of what the department does and for whom, what it wants to achieve over time, and what it should do to achieve desired improvement.
These conceptualizations of positive departmental culture and effective change processes guided the design of our survey instrument.
6
Methodology This survey was designed to get an aggregate baseline measure of departmental cultures of assessment across the country before the release of the EP3 Guide and its accompanying community engagement activities. Because it was not feasible to get the perspectives of a broad array of departmental stakeholders, we decided to survey department chairs as an initial proxy for the departments as a whole. The survey was adapted from prior instruments (Fuller & Skidmore, 2014; Fuller et al, 2016; Ngai et al, 2020) and was administered in collaboration with the American Physical Society (APS), which maintains an email list of physics department chairs. The survey was sent to 766 physics departments/programs on 5/13/20, closing on 7/17/20. Nine institutions have two physics programs, meaning that surveys were sent to 757 unique institutions. We received a total of 388 unique survey submissions from institutions, of which 310 have given consent to have their responses used for research purposes and are therefore included in this report. Of the 78 that did not give consent, only 11 completed the survey in its entirety, and 54 completed less than 40% of the survey. Therefore, excluding the non-consenting results does not meaningfully change our findings and interpretations. In all, 41% of institutions that received the survey submitted a response and consented to having their responses used for research purposes. Table 1 provides a breakdown of the 759 institutions who received the survey and the 310 who completed the survey and consented to the use of their data. The breakdown includes degree type (Bachelor’s, Master’s, Doctoral), public vs. private, and Minority Serving Institution (MSI) vs. non-MSI. A further breakdown by type of MSI is contained in Appendix B. Across our sample, we found that: (a) Bachelor-granting institutions are slightly under-represented while PhD-granting institutions are slightly over-represented, (b) Public institutions are slightly over-represented while and Private institutions are slightly under-represented, and (c) the balance of MSIs and non-MSIs is representative. More detailed comparisons of representativeness by specific types of MSIs are available in Appendix B, along with other statistics about the respondents.
There are several limitations to our study design. These include:
1. The majority of respondents are department chairs, which only represent one type of stakeholder in a department. We also only accepted one response per department. Thus, the view of the respondent may not represent the views of other faculty members, staff members, or students in the department.
2. We did not collect demographic information about respondents, but based on empirical data on physics faculty as a whole it is likely that respondents are disportionately white and male.
3. Because of the way that APS defines who is included in their email list, the survey administration excluded two-year colleges, any departments that teach physics but do
7
not award a degree in physics, and “general science” or similar departments which include physics. As a result, MSIs are underrepresented in our results compared with their national prevalence.
4. Because of the relative rarity of Master’s granting institutions and MSIs in the data, any results that are unique to them will be drowned out in the aggregate data.
5. It is not always the case that the demographics of the student population in a physics department at an MSI is reflective of the demographics of the student body at the MSI as a whole. This may alter the conclusions that one can draw from the MSI data that we collected.
Table 1: Breakdown of the number of departments/programs who received our survey and the number who responded and consented to the use of their data, broken out in several different institutional characteristics. Note that in the MSI category, we are including Asian American and Native American Pacific Islander-Serving Institutions (AANAPISIs), Alaska Native-Serving and Native Hawaiian-Serving Institutions (ANNHIs) Historically Black Colleges and Universities (HBCUs), Hispanic Serving Institutions (HSIs), Native American-Serving Nontribal Institutions (NASNTI), Predominantly Black Institutions (PBIs), and Tribally Controlled Colleges and Universities (TCCUs). See Table 2 in Appendix B for a breakdown by these specific institution types.
Percent of institutions of a given characteristic out of all degree-granting institutions that received the survey (N=757)
Percent of institutions of given characteristic out of all degree-granting institutions that responded and consented to research (N=310)
Bachelor’s granting 66% (N=498)
61% (N=189)
Master’s granting 9% (N=71)
9% (N=28)
Doctoral granting 25% (N=188)
30% (N=93)
Public 48% (N=362)
54% (N=168)
Private 52% (N=395)
46% (N=142)
Minority Serving Institution (MSI)
17% (N=128)
17% (N=53)
Non-MSI 83% (N=629)
83% (N=257)
8
Findings We present the most salient results of the survey here, broken into five thematic areas.
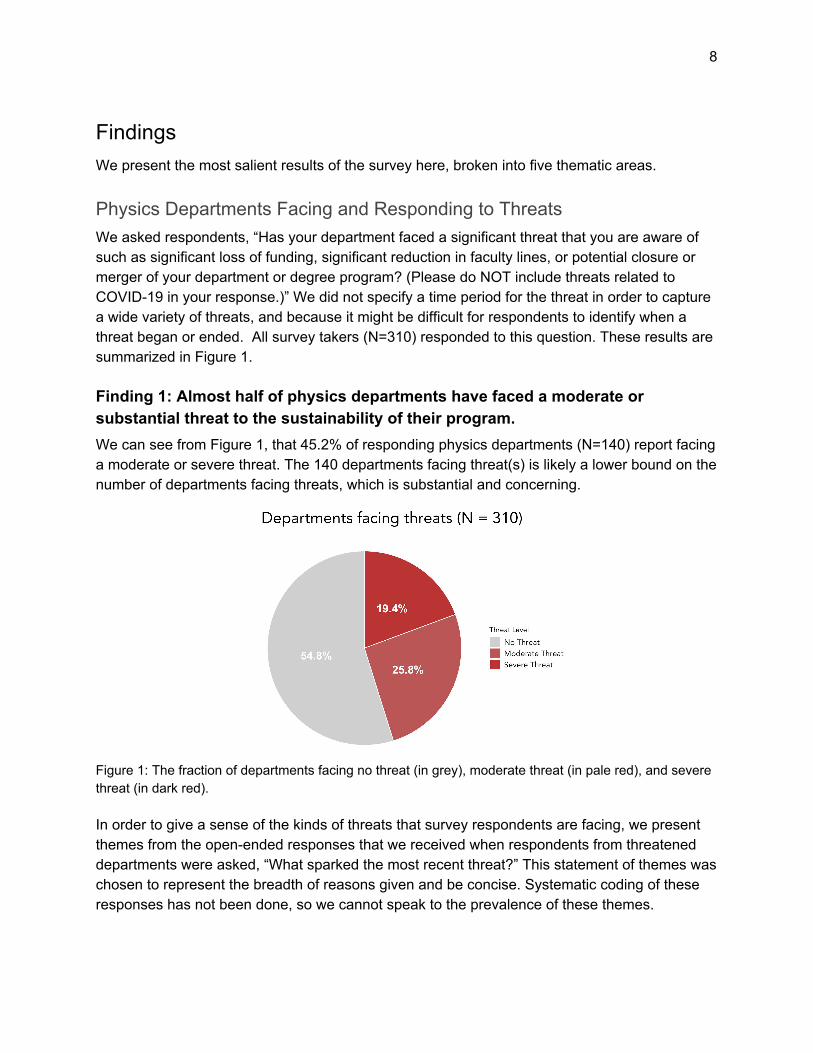
Physics Departments Facing and Responding to Threats We asked respondents, “Has your department faced a significant threat that you are aware of such as significant loss of funding, significant reduction in faculty lines, or potential closure or merger of your department or degree program? (Please do NOT include threats related to COVID-19 in your response.)” We did not specify a time period for the threat in order to capture a wide variety of threats, and because it might be difficult for respondents to identify when a threat began or ended. All survey takers (N=310) responded to this question. These results are summarized in Figure 1.
Finding 1: Almost half of physics departments have faced a moderate or substantial threat to the sustainability of their program. We can see from Figure 1, that 45.2% of responding physics departments (N=140) report facing a moderate or severe threat. The 140 departments facing threat(s) is likely a lower bound on the number of departments facing threats, which is substantial and concerning.
Figure 1: The fraction of departments facing no threat (in grey), moderate threat (in pale red), and severe threat (in dark red). In order to give a sense of the kinds of threats that survey respondents are facing, we present themes from the open-ended responses that we received when respondents from threatened departments were asked, “What sparked the most recent threat?” This statement of themes was chosen to represent the breadth of reasons given and be concise. Systematic coding of these responses has not been done, so we cannot speak to the prevalence of these themes.
9
Themes regarding chairs’ perceptions of what sparked the most recent threat (for severely and moderately threatened departments)
● Substantial reduction in state funding ● Poor institutional planning / Mismanagement of finances ● Shrinking faculty size (e.g. reduction in faculty lines, or faculty retiring/leaving) ● Declining enrollments in the department / program (e.g. low enrollments in the major, or
low enrollment in upper division courses, or low graduation rates) ● Declining undergraduate enrollments at the college ● Small programs viewed as expensive and more expendable ● Problematic orientations of specific administrators ● Focus on undergraduate education at the expense of graduate programs
Finding 2: In preparing to address threats, departments tend to collect data and talk with relevant stakeholders, but are unlikely to consult outside resources (e.g., reports). We then asked respondents from threatened departments, “Did your department do any of the following when preparing to address the threat?” In Figure 2, we see that in preparing to respond to a threat the vast majority of threatened departments collect data (72%), talk to relevant stakeholders (67%), and consider their department’s mission and values (52%). Departments were less likely to consult outside resources (39%), such as reports or guides. This final result has implications for the efforts of many professional societies developing approaches to supporting threatened departments.
Figure 2: Displays the fraction of threatened departments that prepared to address the threat by taking the following actions: collected data, talked to relevant stakeholders, considered departmental values, and consulted outside resources.
10
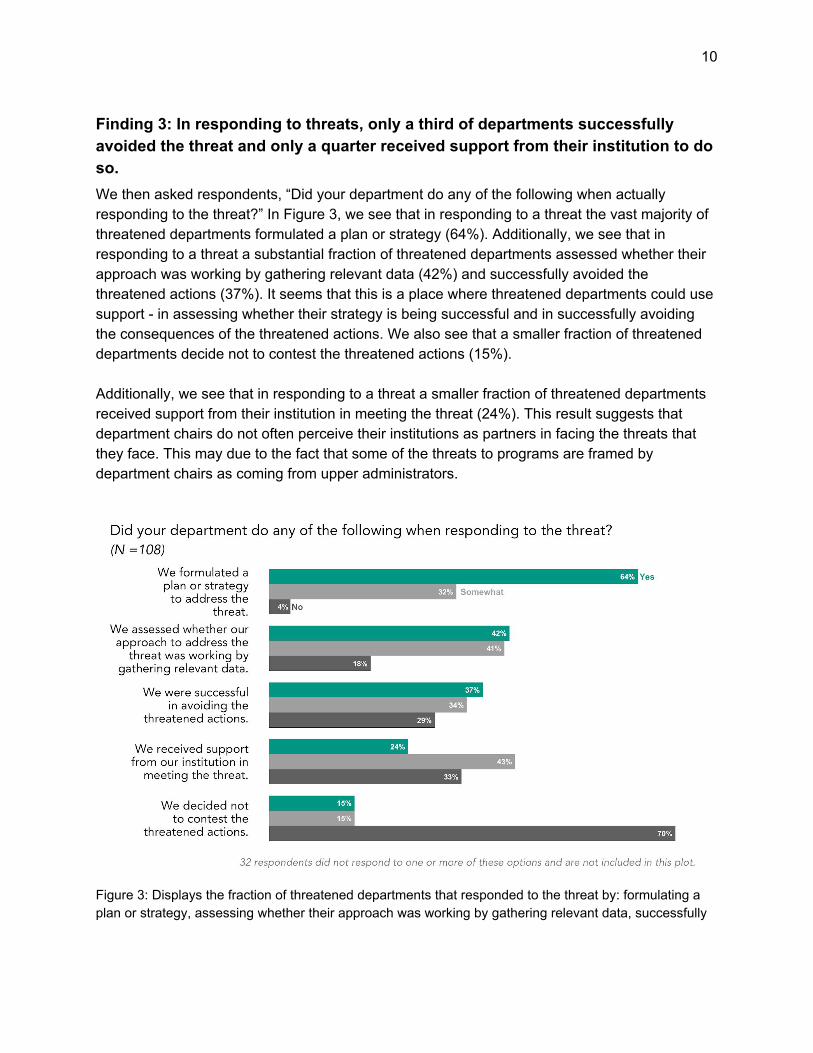
Finding 3: In responding to threats, only a third of departments successfully avoided the threat and only a quarter received support from their institution to do so. We then asked respondents, “Did your department do any of the following when actually responding to the threat?” In Figure 3, we see that in responding to a threat the vast majority of threatened departments formulated a plan or strategy (64%). Additionally, we see that in responding to a threat a substantial fraction of threatened departments assessed whether their approach was working by gathering relevant data (42%) and successfully avoided the threatened actions (37%). It seems that this is a place where threatened departments could use support - in assessing whether their strategy is being successful and in successfully avoiding the consequences of the threatened actions. We also see that a smaller fraction of threatened departments decide not to contest the threatened actions (15%). Additionally, we see that in responding to a threat a smaller fraction of threatened departments received support from their institution in meeting the threat (24%). This result suggests that department chairs do not often perceive their institutions as partners in facing the threats that they face. This may due to the fact that some of the threats to programs are framed by department chairs as coming from upper administrators.
Figure 3: Displays the fraction of threatened departments that responded to the threat by: formulating a plan or strategy, assessing whether their approach was working by gathering relevant data, successfully
11
avoiding the threatened actions, receiving support from their institution in meeting the threat, and deciding not to contest the threatened actions.
Prevalent Problems that Physics Departments Face This survey question was seen by a subset of respondents that at the end of the main survey opted-in to responding to additional survey questions and were given this specific block of additional survey questions. This reduced our sample size to N=121 for this item. This survey item included a closed list of problems (listed in Figure 4) that the project leadership expected departments might be facing. Respondents could click and drag each problem into an appropriate box labeled “top problem areas,” “moderate problem areas,” or “areas of little or no problems.” Respondents could also select “Other” and write in an unanticipated problem.
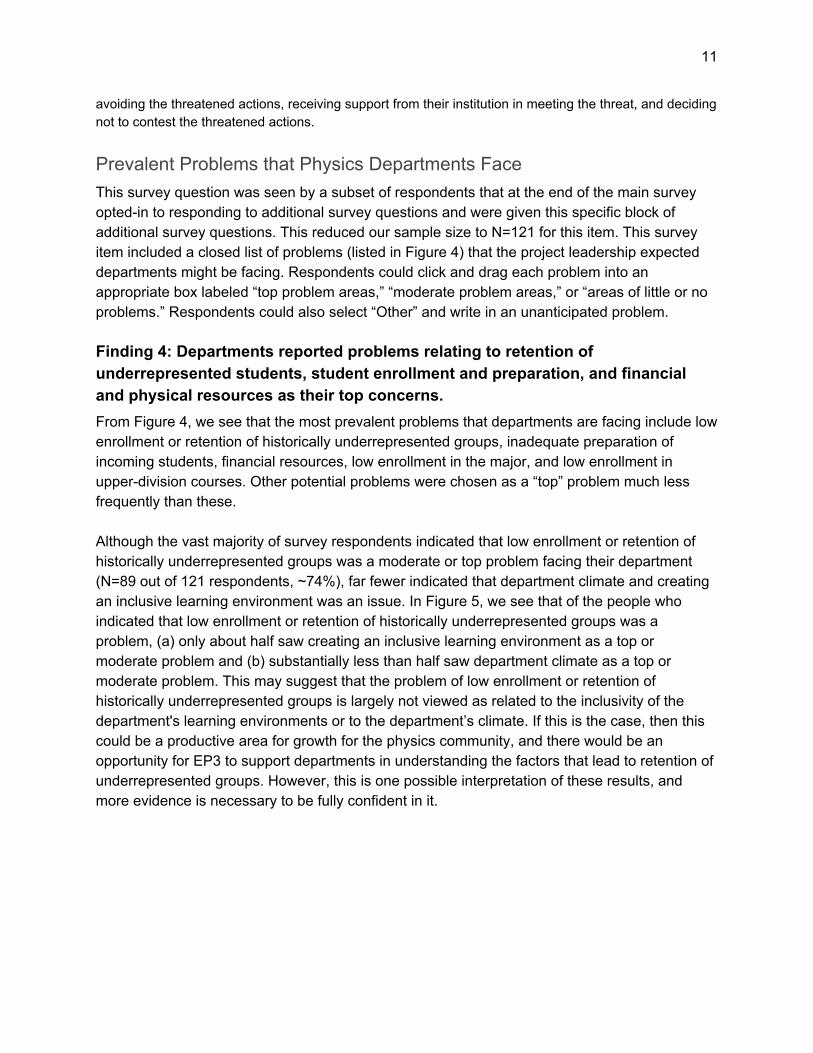
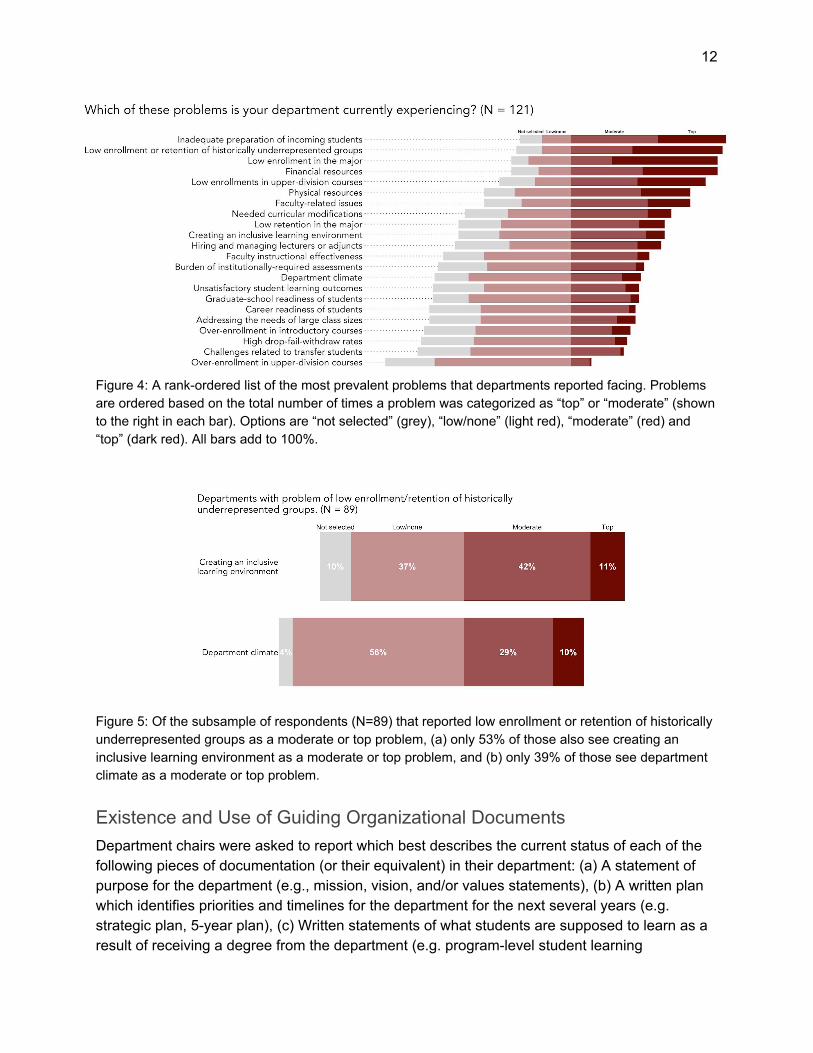
Finding 4: Departments reported problems relating to retention of underrepresented students, student enrollment and preparation, and financial and physical resources as their top concerns. From Figure 4, we see that the most prevalent problems that departments are facing include low enrollment or retention of historically underrepresented groups, inadequate preparation of incoming students, financial resources, low enrollment in the major, and low enrollment in upper-division courses. Other potential problems were chosen as a “top” problem much less frequently than these. Although the vast majority of survey respondents indicated that low enrollment or retention of historically underrepresented groups was a moderate or top problem facing their department (N=89 out of 121 respondents, ~74%), far fewer indicated that department climate and creating an inclusive learning environment was an issue. In Figure 5, we see that of the people who indicated that low enrollment or retention of historically underrepresented groups was a problem, (a) only about half saw creating an inclusive learning environment as a top or moderate problem and (b) substantially less than half saw department climate as a top or moderate problem. This may suggest that the problem of low enrollment or retention of historically underrepresented groups is largely not viewed as related to the inclusivity of the department's learning environments or to the department’s climate. If this is the case, then this could be a productive area for growth for the physics community, and there would be an opportunity for EP3 to support departments in understanding the factors that lead to retention of underrepresented groups. However, this is one possible interpretation of these results, and more evidence is necessary to be fully confident in it.
12
Figure 4: A rank-ordered list of the most prevalent problems that departments reported facing. Problems are ordered based on the total number of times a problem was categorized as “top” or “moderate” (shown to the right in each bar). Options are “not selected” (grey), “low/none” (light red), “moderate” (red) and “top” (dark red). All bars add to 100%.
Figure 5: Of the subsample of respondents (N=89) that reported low enrollment or retention of historically underrepresented groups as a moderate or top problem, (a) only 53% of those also see creating an inclusive learning environment as a moderate or top problem, and (b) only 39% of those see department climate as a moderate or top problem.
Existence and Use of Guiding Organizational Documents Department chairs were asked to report which best describes the current status of each of the following pieces of documentation (or their equivalent) in their department: (a) A statement of purpose for the department (e.g., mission, vision, and/or values statements), (b) A written plan which identifies priorities and timelines for the department for the next several years (e.g. strategic plan, 5-year plan), (c) Written statements of what students are supposed to learn as a result of receiving a degree from the department (e.g. program-level student learning
13
outcomes), (d) written statements of what students are supposed to learn as a result of completing a specific course (e.g. course-level learning outcomes), (e) An outline or matrix showing how program-level learning outcomes align with individual courses across the program (i.e. curriculum map), and (f) a written plan for how program-level learning outcomes are assessed in the department, such as performance indicators and/or timetable for when data is collected (i.e., plan for assessment of student learning). Department chairs were asked to report whether each form of documentation exists and the extent to which it is used by the department.
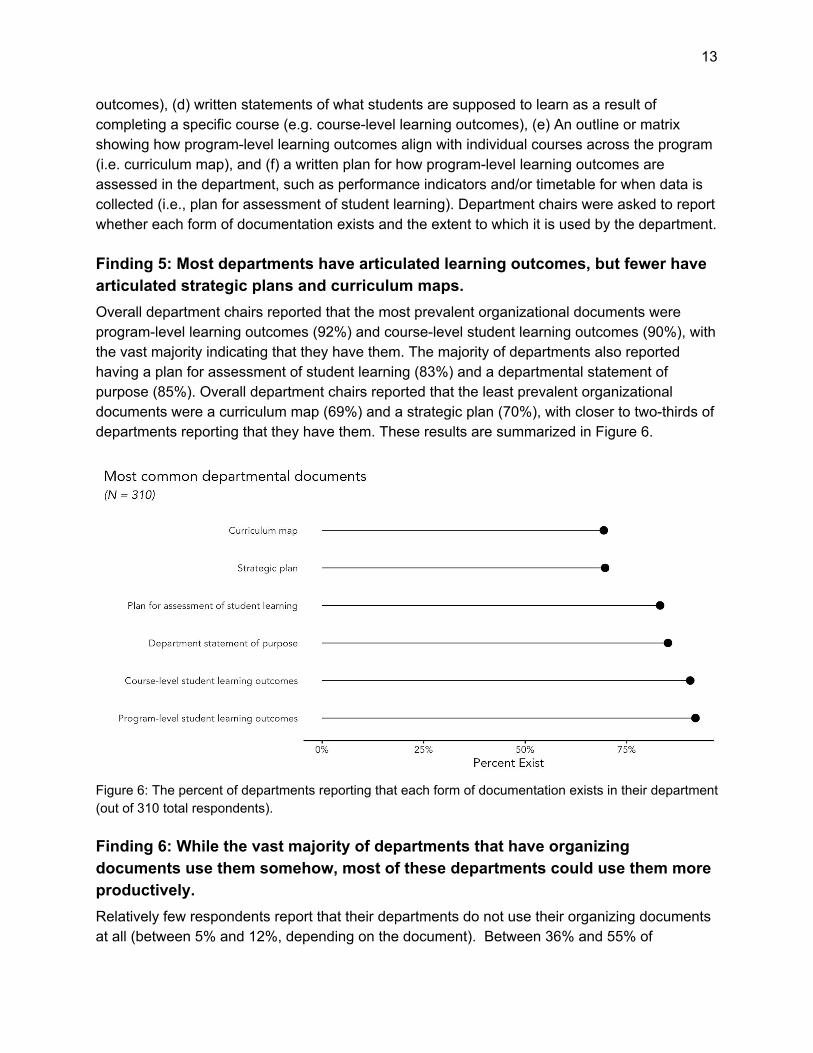
Finding 5: Most departments have articulated learning outcomes, but fewer have articulated strategic plans and curriculum maps. Overall department chairs reported that the most prevalent organizational documents were program-level learning outcomes (92%) and course-level student learning outcomes (90%), with the vast majority indicating that they have them. The majority of departments also reported having a plan for assessment of student learning (83%) and a departmental statement of purpose (85%). Overall department chairs reported that the least prevalent organizational documents were a curriculum map (69%) and a strategic plan (70%), with closer to two-thirds of departments reporting that they have them. These results are summarized in Figure 6.
Figure 6: The percent of departments reporting that each form of documentation exists in their department (out of 310 total respondents).
Finding 6: While the vast majority of departments that have organizing documents use them somehow, most of these departments could use them more productively. Relatively few respondents report that their departments do not use their organizing documents at all (between 5% and 12%, depending on the document). Between 36% and 55% of
14
respondents report that their departments use their organizing documents productively. The documents that are most used productively are program- and course-level learning outcomes, curriculum maps, and student learning assessment plans (47%-55%). Strategic plans are only used productively in 41% of departments, and statements of purpose are only used productively in 36% of departments. These results are summarized in Figure 7.
Figure 7: Out of the departments that report having each organizing document, this shows the percent of departments where organizing documents are productively used, somewhat used, or not used. All rows add to 100%.
Departmental Culture of Assessment and Change We asked respondents to indicate their agreement with a number of statements related to assessment of student learning, assessment of other departmental outcomes, and changes to the undergraduate program. Responses to these questions were on a seven point scale, from strongly agree to strongly disagree. Additionally, respondents were asked to respond to each prompt twice: once with respect to their current department and once with respect to their ideal department (inspired by the DELTA survey design described in Ngai et. al, 2020). There are many ways that we could have chosen to compare the current and ideal results. We chose to emphasize explicit agreement with these prompts (i.e., the percent of respondents who agreed or strongly agreed with the prompts), so Figures 8, 9, and 10 compare this percent between current and ideal. From this perspective, the gap between these percentages, if any, indicates the extent to which respondents’ current reality and ideal vision are mismatched.
15
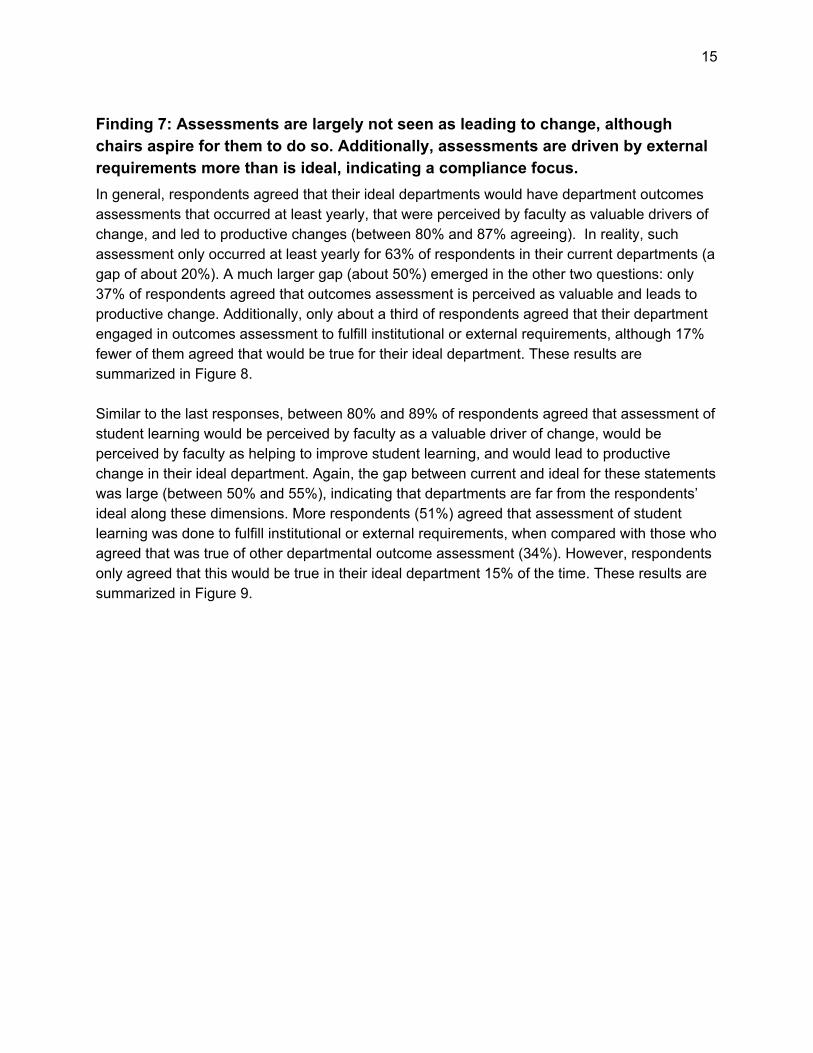
Finding 7: Assessments are largely not seen as leading to change, although chairs aspire for them to do so. Additionally, assessments are driven by external requirements more than is ideal, indicating a compliance focus. In general, respondents agreed that their ideal departments would have department outcomes assessments that occurred at least yearly, that were perceived by faculty as valuable drivers of change, and led to productive changes (between 80% and 87% agreeing). In reality, such assessment only occurred at least yearly for 63% of respondents in their current departments (a gap of about 20%). A much larger gap (about 50%) emerged in the other two questions: only 37% of respondents agreed that outcomes assessment is perceived as valuable and leads to productive change. Additionally, only about a third of respondents agreed that their department engaged in outcomes assessment to fulfill institutional or external requirements, although 17% fewer of them agreed that would be true for their ideal department. These results are summarized in Figure 8. Similar to the last responses, between 80% and 89% of respondents agreed that assessment of student learning would be perceived by faculty as a valuable driver of change, would be perceived by faculty as helping to improve student learning, and would lead to productive change in their ideal department. Again, the gap between current and ideal for these statements was large (between 50% and 55%), indicating that departments are far from the respondents’ ideal along these dimensions. More respondents (51%) agreed that assessment of student learning was done to fulfill institutional or external requirements, when compared with those who agreed that was true of other departmental outcome assessment (34%). However, respondents only agreed that this would be true in their ideal department 15% of the time. These results are summarized in Figure 9.
16
Figure 8: Percent of respondents who agree or strongly agree with the given statements about departmental outcome assessment, with both the respondents’ current (shown in black) and ideal (shown in teal) departments indicated. The histograms on the right indicate the distribution of responses for each question.
Figure 9: Percent of respondents who agree or strongly agree with the given statements about departmental assessment of student learning, with both the respondents’ current (shown in black) and ideal (shown in teal) departments indicated. The histograms on the right indicate the distribution of responses for each question.
17
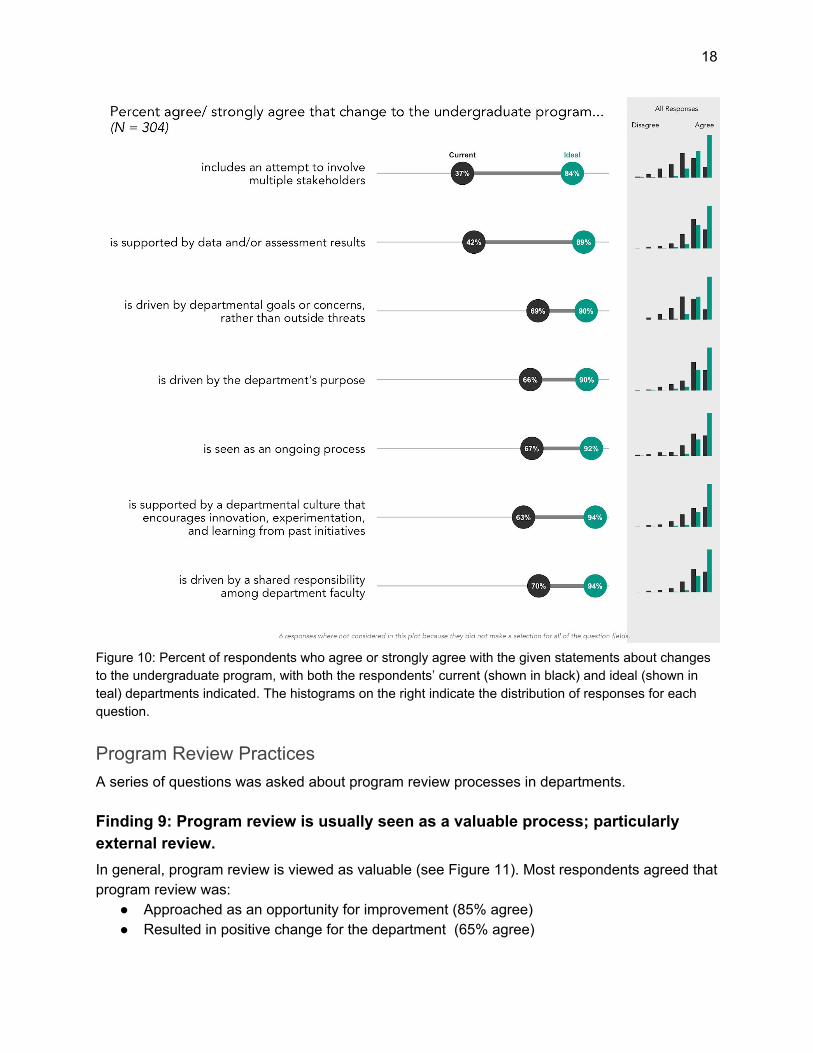
Finding 8: Chairs see substantial room for improvement in how they go about changing the undergraduate physics program, especially when it comes to engaging multiple stakeholders and using data effectively. In their current department, only 37% of respondents agreed that changes to the undergraduate program attempt to involve multiple stakeholders and only 42% agreed that they are supported by data and/or assessment results. More encouraging, between 63% and 70% agreed that currently such changes are driven by departmental goals (as opposed to outside threats); are driven by the department’s purpose; are seen as ongoing processes; are driven by shared responsibility among the faculty; and are supported by an innovative, experimental, and learning-oriented departmental culture. Respondents agreed more frequently that their changes to the undergraduate program in their ideal departments would exhibit these features (between 85% and 95% across the seven features). These results are summarized in Figure 10.
18
Figure 10: Percent of respondents who agree or strongly agree with the given statements about changes to the undergraduate program, with both the respondents’ current (shown in black) and ideal (shown in teal) departments indicated. The histograms on the right indicate the distribution of responses for each question.
Program Review Practices A series of questions was asked about program review processes in departments.
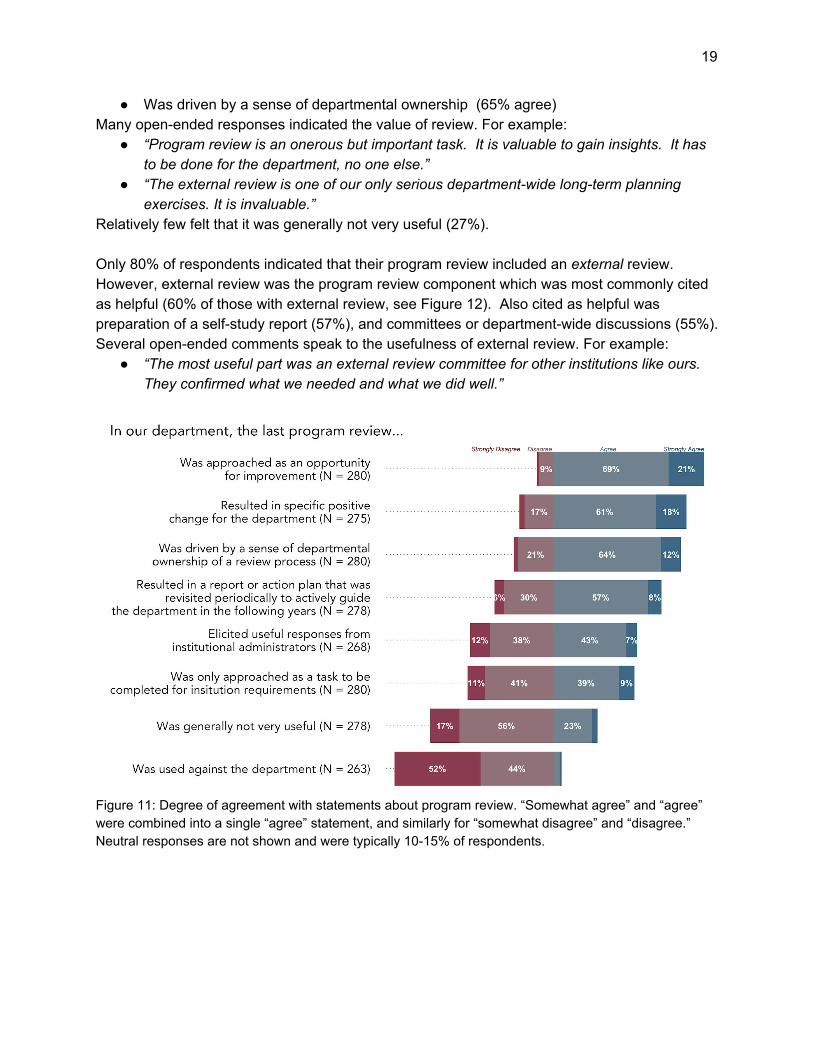
Finding 9: Program review is usually seen as a valuable process; particularly external review. In general, program review is viewed as valuable (see Figure 11). Most respondents agreed that program review was:
● Approached as an opportunity for improvement (85% agree) ● Resulted in positive change for the department (65% agree)
19
● Was driven by a sense of departmental ownership (65% agree) Many open-ended responses indicated the value of review. For example:
● “Program review is an onerous but important task. It is valuable to gain insights. It has to be done for the department, no one else.”
● “The external review is one of our only serious department-wide long-term planning exercises. It is invaluable.”
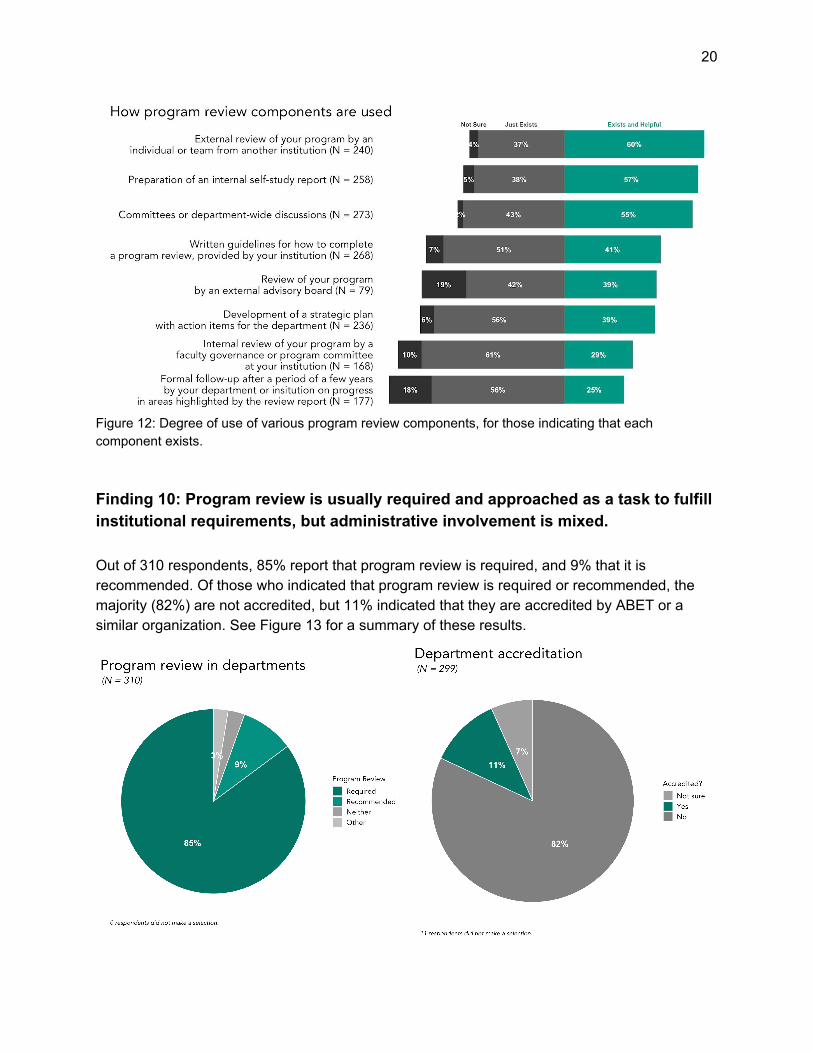
Relatively few felt that it was generally not very useful (27%). Only 80% of respondents indicated that their program review included an external review. However, external review was the program review component which was most commonly cited as helpful (60% of those with external review, see Figure 12). Also cited as helpful was preparation of a self-study report (57%), and committees or department-wide discussions (55%). Several open-ended comments speak to the usefulness of external review. For example:
● “The most useful part was an external review committee for other institutions like ours. They confirmed what we needed and what we did well.”
Figure 11: Degree of agreement with statements about program review. “Somewhat agree” and “agree” were combined into a single “agree” statement, and similarly for “somewhat disagree” and “disagree.” Neutral responses are not shown and were typically 10-15% of respondents.
20
Figure 12: Degree of use of various program review components, for those indicating that each component exists.
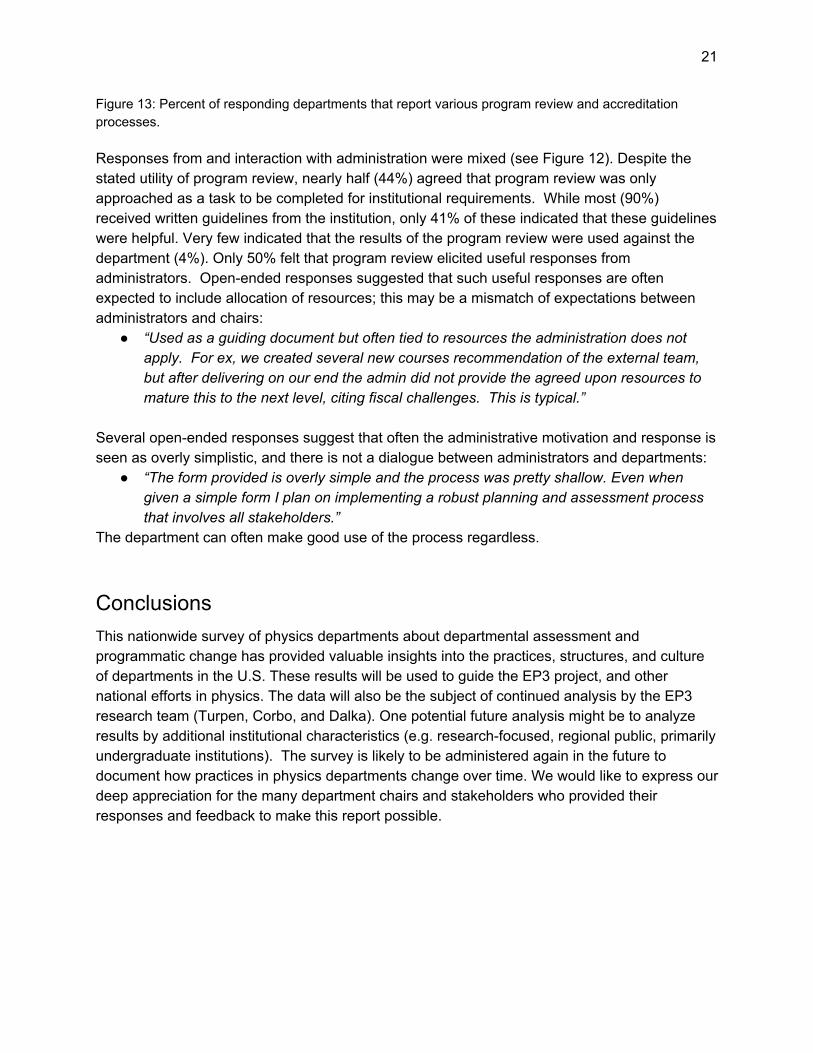
Finding 10: Program review is usually required and approached as a task to fulfill institutional requirements, but administrative involvement is mixed. Out of 310 respondents, 85% report that program review is required, and 9% that it is recommended. Of those who indicated that program review is required or recommended, the majority (82%) are not accredited, but 11% indicated that they are accredited by ABET or a similar organization. See Figure 13 for a summary of these results.
21
Figure 13: Percent of responding departments that report various program review and accreditation processes. Responses from and interaction with administration were mixed (see Figure 12). Despite the stated utility of program review, nearly half (44%) agreed that program review was only approached as a task to be completed for institutional requirements. While most (90%) received written guidelines from the institution, only 41% of these indicated that these guidelines were helpful. Very few indicated that the results of the program review were used against the department (4%). Only 50% felt that program review elicited useful responses from administrators. Open-ended responses suggested that such useful responses are often expected to include allocation of resources; this may be a mismatch of expectations between administrators and chairs:
● “Used as a guiding document but often tied to resources the administration does not apply. For ex, we created several new courses recommendation of the external team, but after delivering on our end the admin did not provide the agreed upon resources to mature this to the next level, citing fiscal challenges. This is typical.”
Several open-ended responses suggest that often the administrative motivation and response is seen as overly simplistic, and there is not a dialogue between administrators and departments:
● “The form provided is overly simple and the process was pretty shallow. Even when given a simple form I plan on implementing a robust planning and assessment process that involves all stakeholders.”
The department can often make good use of the process regardless.
Conclusions This nationwide survey of physics departments about departmental assessment and programmatic change has provided valuable insights into the practices, structures, and culture of departments in the U.S. These results will be used to guide the EP3 project, and other national efforts in physics. The data will also be the subject of continued analysis by the EP3 research team (Turpen, Corbo, and Dalka). One potential future analysis might be to analyze results by additional institutional characteristics (e.g. research-focused, regional public, primarily undergraduate institutions). The survey is likely to be administered again in the future to document how practices in physics departments change over time. We would like to express our deep appreciation for the many department chairs and stakeholders who provided their responses and feedback to make this report possible.
22
References E. M. Bensimon (2007). The Underestimated Significance of Practitioner Knowledge in the Scholarship on Student Success. The Review of Higher Education, 30(4), 441-469. M. B. Fuller & S. Skidmore (2014). An exploration of factors influencing institutional cultures of assessment. International Journal of Educational Research, 65 pp. 9–21. M. B. Fuller, S. T. Skidmore, R. M. Bustamante, & P. C. Holzweiss (2016). Empirically Exploring Higher Education Cultures of Assessment. The Review of Higher Education, 39(3), pp. 395-429. C. Ngai, M. E. Pilgrim, D. L. Reinholz, J. C. Corbo, and G. M. Quan (2020). “Developing the DELTA: Capturing Cultural Changes in Undergraduate Departments.” CBE-Life Sciences Education, 19(2).
23
Appendix A: Summary of other survey findings In this Appendix we briefly report on a few other findings that may be of interest to the community.
Structure of program reviews Respondents were asked about typical components of a program review process. The most ubiquitous program review components were Committees (91%), written guidelines from the institution (90%), and preparation of an internal self-study report (87%). Also common but not ubiquitous were external review (80%) and development of a strategic plan (79%). Less common were formal follow-up several years later (59%), or internal review by a faculty governance committee (56%). The least common review component was a review by an external advisory board (26%). A series of more detailed questions about program review were given to a subset (N=105) of survey respondents:
● Most program reviews occur every 5 years (28%) or 7 years (34%). Seventy percent of reviews occur at that intended frequency.
● For those programs with external review, the most common preparation time was 5-6 months (32%), but preparation times ranged from 1 month to more than a year.
● The most frequent number of external visitors was 1 (29%) or 2 (29%), but some included 3 visitors (20%). Most external review visits lasted 2 days (73% of respondents).
● Most respondents indicated that external site visitors were selected by the department but approved by the Dean (44%), or selected by the Dean with recommendations from the department (27%). It was very rare for either entity to select the review team independently.
● External visitors commonly met with the chair, faculty, students, Dean, and staff. Less commonly included were the Provost, or chairs of other departments.
Use of national-level reports A series of questions asked about the level of knowledge and use of certain national-level reports in physics and science education. We found that most respondents had not heard of the majority of reports. However, most respondents (94%) had heard of at least one of the reports. The most commonly recognized reports were SPIN-UP (88% of respondents report having heard of it), Career Toolbox (84%), and TEAM-UP (74%). Most respondents (86%) have also used at least one of these reports. The reports with the highest level of use (among those who had heard of it) were the Career Toolbox, and specialized AAPT recommendations (Undergraduate Physics Laboratory Curriculum, Computational Physics), plus SPIN-UP, PhysPort, and Guidelines for Self-Study (used by 50-60% of those who had heard of them).
24
Attendance at the Physics and Astronomy New Faculty Workshop Most respondents (78%) indicated that they frequently or almost always send new hires to the workshop. The most common reasons for doing so were for new faculty to get information about effective teaching practices, and to be exposed to teaching ideas within the discipline of physics and astronomy. Those who don’t frequently send faculty usually don’t have eligible faculty to send (e.g. they have not had new hires, or their new faculty hires weren’t new to teaching).
Appendix B: Additional Information about the Survey Sample This survey was conducted in collaboration with the American Physical Society (APS). APS maintains an email list of physics department chairs. A department or program is maintained on this list if a given department has graduated at least a single student in the last 5 years with a degree that APS considers to be in physics/the physical sciences (based on definitions found here). APS characterizes the highest degree awarded by each of these departments based on degrees awarded in the last 5 years, rather than on the existence of particular degree pathways. APS does not tag departments in this database with other institutional characteristics (such as Carnegie designations or MSI status). This email list is updated on an annual basis every summer. The email list that was used for this study was updated in the summer of 2019 based on degrees awarded between 2014 - 2018. Associated with this email list, APS maintains a characterization of the program’s “highest degree award” as within one of three categories: Bachelors-granting (BA/BS), Masters-granting (MA/MS), and doctorate-granting (PhD). This characterization is based on degrees awarded in the last 5 years, rather than based on the existence of program pathways. Of the research consenting respondents,
● 262 (84.5%) indicated that they were department chairs, department heads, or equivalent.
● 25 (8.1%) indicated that they were an undergraduate studies chair, associate chair, or equivalent.
● 12 (3.9%) indicated that they were former department chairs or equivalent. ● 11 (3.6%) responded “other position,” which included: “Physics Coordinator”,
“Department Coordinator”, “former undergrad studies chair and assessment liaison”, “Undergraduate program coordinator”, “Head of teacher licensure program and department's education expert”, “Person who regularly deals with curriculum (no title)”, “Undergraduate Program Coordinator”, “Assistant Professor”, “Program Chair”, “Department Secretary”.
Table 2 provides a summary of the institutions that received the survey and those that responded and gave consent for the use of their results, broken out by type of minority-serving institution (MSI) based on either federal designations or Department of Education definitions.
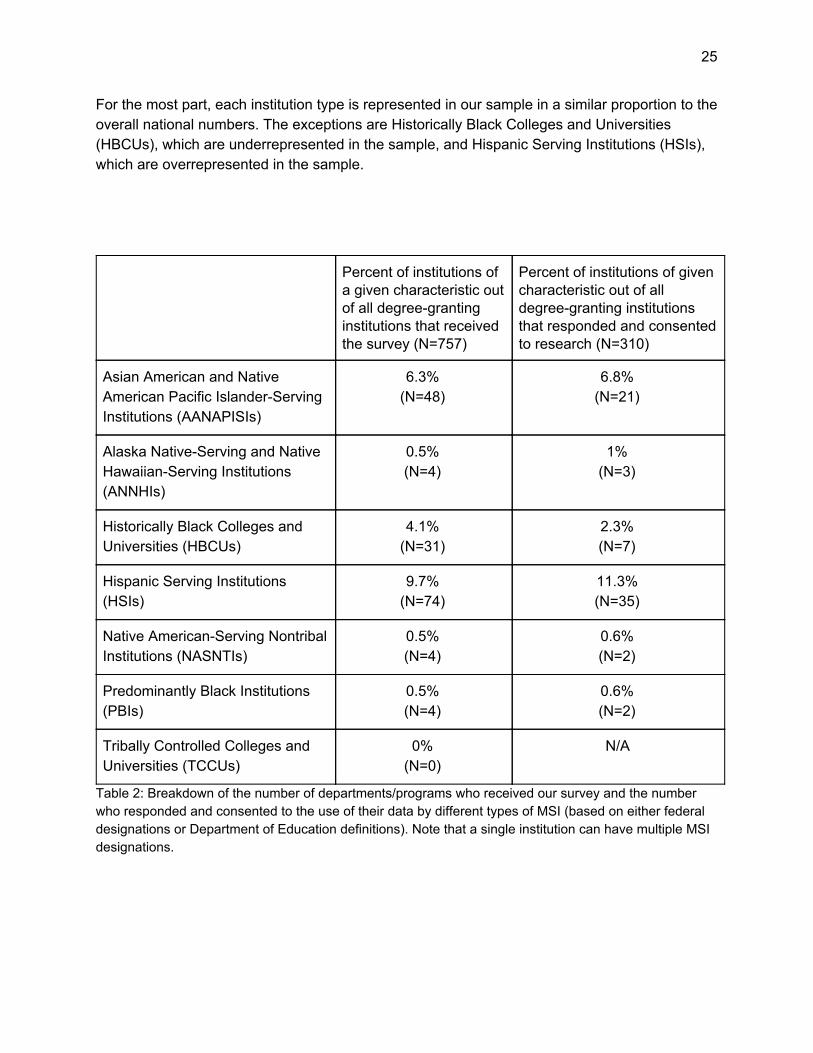
For the most part, each institution type is represented in our sample in a similar proportion to the overall national numbers. The exceptions are Historically Black Colleges and Universities (HBCUs), which are underrepresented in the sample, and Hispanic Serving Institutions (HSIs), which are overrepresented in the sample.
Table 2: Breakdown of the number of departments/programs who received our survey and the number who responded and consented to the use of their data by different types of MSI (based on either federal designations or Department of Education definitions). Note that a single institution can have multiple MSI designations.
Percent of institutions of a given characteristic out of all degree-granting institutions that received the survey (N=757)
Percent of institutions of given characteristic out of all degree-granting institutions that responded and consented to research (N=310)
Asian American and Native American Pacific Islander-Serving Institutions (AANAPISIs)
6.3% (N=48)
6.8% (N=21)
Alaska Native-Serving and Native Hawaiian-Serving Institutions (ANNHIs)
0.5% (N=4)
1% (N=3)
Historically Black Colleges and Universities (HBCUs)