37
February 26 th , 2018 Cerved Information Solutions S.p.A. Results to 31 December 2017

0 73
132
0 128 142
109 189 255
191 191 191
0 103 188
16 159 189
221 221 221
92 188 210
February 26th, 2018
Cerved Information Solutions S.p.A.
Results to 31 December 2017
1
Disclaimer
This presentation and any materials distributed in connection herewith (together, the “Presentation”) do not constitute or form a part of, and should not be construed as, an offer for sale or subscription of or solicitation of any offer to purchase or subscribe for any securities, and neither this Presentation nor anything contained herein shall form the basis of, or be relied upon in connection with, or act as an inducement to enter into, any contract or commitment whatsoever. The information contained in this Presentation has not been independently verified and no representation or warranty, express or implied, is made as to, and no reliance should be placed on, the fairness, accuracy, completeness, reasonableness or correctness of the information or opinions contained herein. None of Cerved Information Solutions S.p.A., its subsidiaries or any of their respective employees, advisers, representatives or affiliates shall have any liability whatsoever (in negligence or otherwise) for any loss howsoever arising from any use of this document or its contents or otherwise arising in connection with this Presentation. The information contained in this Presentation is provided as at the date of this Presentation and is subject to change without notice.
Statements made in this Presentation may include forward-looking statements. These statements may be identified by the fact that they use words such as “anticipate”, “estimate”, “should”, “expect”, “guidance”, “project”, “intend”, “plan”, “believe”, and/or other words and terms of similar meaning in connection with, among other things, any discussion of results of operations, financial condition, liquidity, prospects, growth, strategies or developments in the industry in which we operate. Such statements are based on management’s current intentions, expectations or beliefs and involve inherent risks, assumptions and uncertainties, including factors that could delay, divert or change any of them. Forward-looking statements contained in this Presentation regarding trends or current activities should not be taken as a representation that such trends or activities will continue in the future. Actual outcomes, results and other future events may differ materially from those expressed or implied by the statements contained herein. Such differences may adversely affect the outcome and financial effects of the plans and events described herein and may result from, among other things, changes in economic, business, competitive, technological, strategic or regulatory factors and other factors affecting the business and operations of the company. Neither Cerved Information Solutions S.p.A. nor any of its affiliates is under any obligation, and each such entity expressly disclaims any such obligation, to update, revise or amend any forward-looking statements, whether as a result of new information, future events or otherwise. You should not place undue reliance on any such forward-looking statements, which speak only as of the date of this Presentation. It should be noted that past performance is not a guide to future performance. Please also note that interim results are not necessarily indicative of full-year results.

2
Today’s Presenters
Marco Nespolo – Chief Executive Officer
Giovanni Sartor – Chief Financial Officer
9 years at Cerved
9 years of TMT industry experience
Prior experience: Seves Group, Nylstar (RP-Snia JV), Eni, Heinz
Education: MBA from Eni University; Statistics and Economics degree from University of Padua
Pietro Masera – Head of Corporate Development & IR
5 years at Cerved
15 years of TMT industry experience
Prior experience: CVC, Deutsche Bank, Bankers Trust, UBS, SEAT
Education: degree in Economics and Business Administration from University of Bergamo
9 years at Cerved
13 years of TMT industry experience
Prior experience: Bain Capital, Bain & Company, Citibank
Education: degree in Business Administration from Bocconi University of Milan

3
Table of Contents
Highlights 1
Financial Review 3
Appendices 4
Business Review 2
4
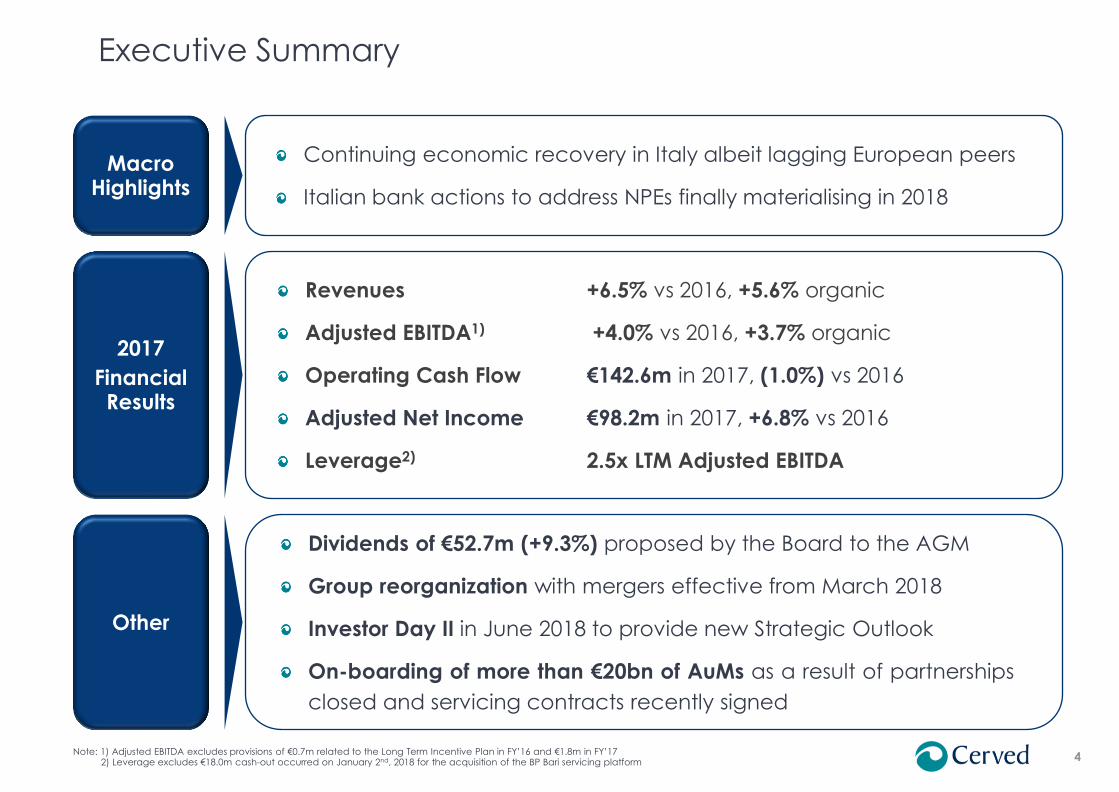
Executive Summary
Macro Highlights
Continuing economic recovery in Italy albeit lagging European peers
Italian bank actions to address NPEs finally materialising in 2018
2017
Financial Results
Revenues +6.5% vs 2016, +5.6% organic
Adjusted EBITDA1) +4.0% vs 2016, +3.7% organic
Operating Cash Flow €142.6m in 2017, (1.0%) vs 2016
Adjusted Net Income €98.2m in 2017, +6.8% vs 2016
Leverage2) 2.5x LTM Adjusted EBITDA
Other
Dividends of €52.7m (+9.3%) proposed by the Board to the AGM
Group reorganization with mergers effective from March 2018
Investor Day II in June 2018 to provide new Strategic Outlook
On-boarding of more than €20bn of AuMs as a result of partnerships
closed and servicing contracts recently signed
Note: 1) Adjusted EBITDA excludes provisions of €0.7m related to the Long Term Incentive Plan in FY’16 and €1.8m in FY’17 2) Leverage excludes €18.0m cash-out occurred on January 2nd, 2018 for the acquisition of the BP Bari servicing platform
5
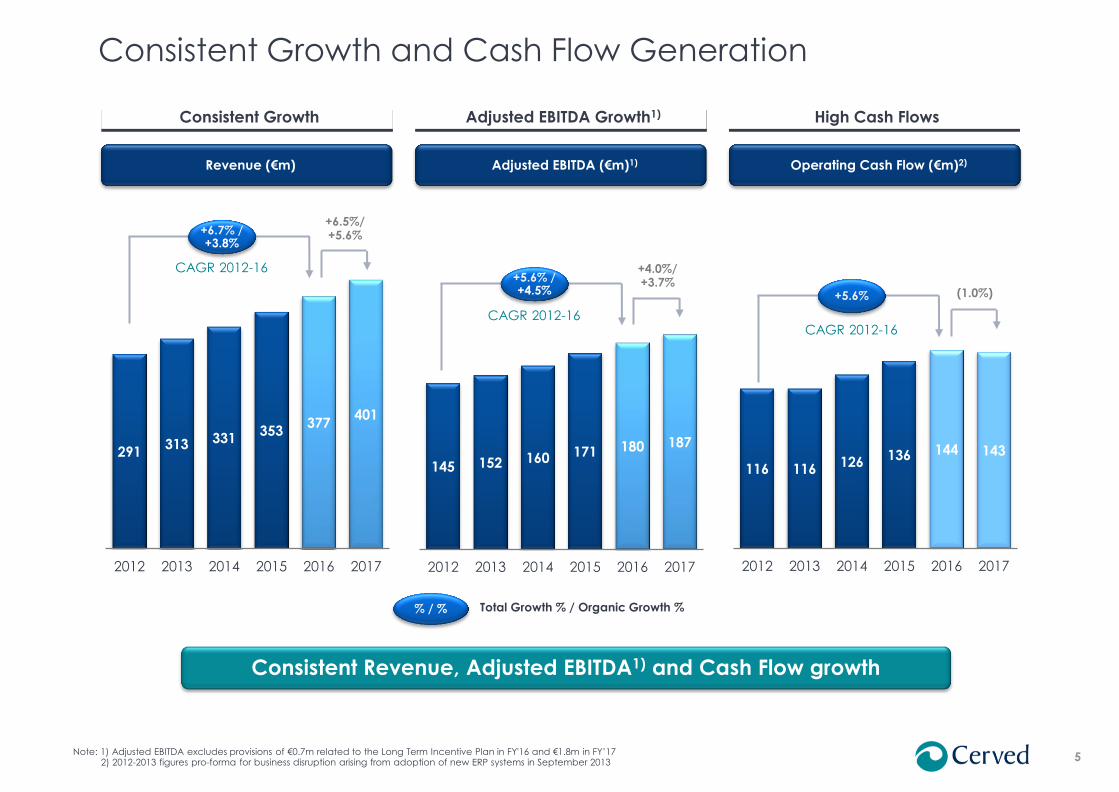
116 116 126
136 144 143
2012 2013 2014 2015 2016 2017
145 152 160 171 180 187
2012 2013 2014 2015 2016 2017
291 313 331
353 377
401
2012 2013 2014 2015 2016 2017
+6.5%/ +5.6%
Consistent Growth and Cash Flow Generation
Note: 1) Adjusted EBITDA excludes provisions of €0.7m related to the Long Term Incentive Plan in FY'16 and €1.8m in FY’17 2) 2012-2013 figures pro-forma for business disruption arising from adoption of new ERP systems in September 2013
Consistent Growth Adjusted EBITDA Growth1) High Cash Flows
Revenue (€m) Adjusted EBITDA (€m)1) Operating Cash Flow (€m)2)
Consistent Revenue, Adjusted EBITDA1) and Cash Flow growth
% / % Total Growth % / Organic Growth %
+6.7% / +3.8%
CAGR 2012-16 +4.0%/ +3.7% +5.6% /
+4.5%
CAGR 2012-16
(1.0%) +5.6%
CAGR 2012-16
6
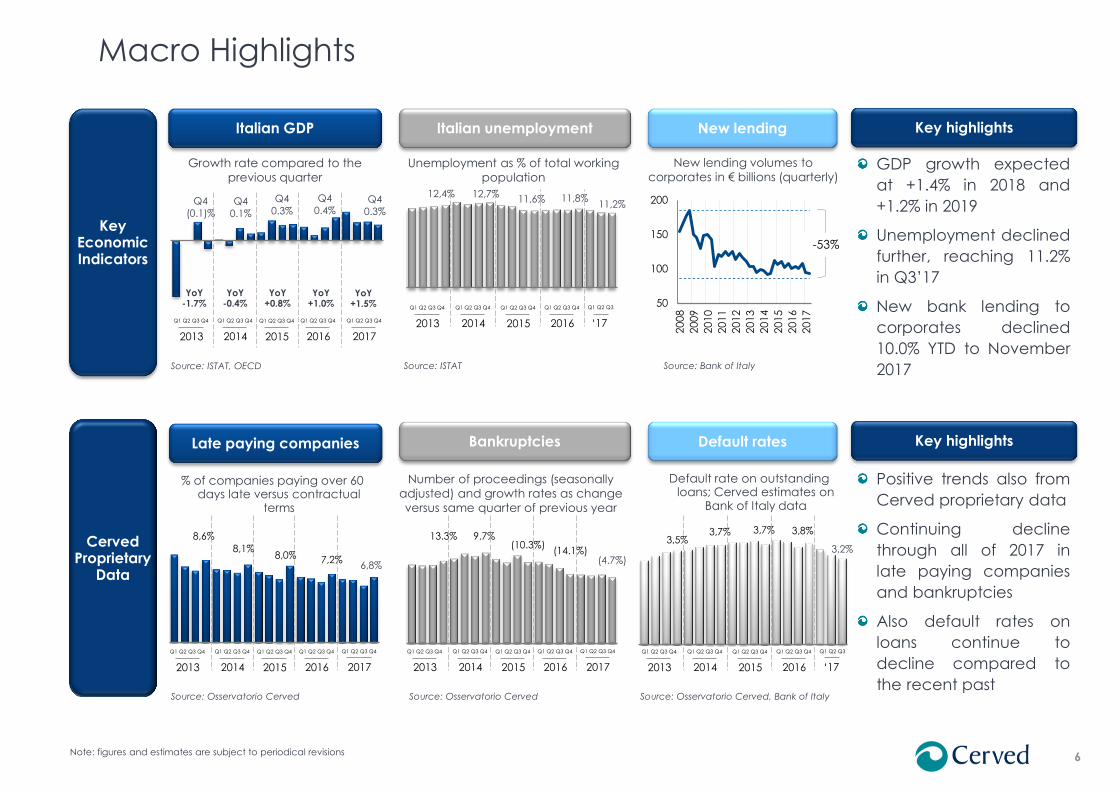
Macro Highlights
Note: figures and estimates are subject to periodical revisions
Key Economic Indicators
Cerved Proprietary
Data
GDP growth expected
at +1.4% in 2018 and
+1.2% in 2019
Unemployment declined
further, reaching 11.2%
in Q3’17
New bank lending to
corporates declined
10.0% YTD to November
2017
Positive trends also from
Cerved proprietary data
Continuing decline
through all of 2017 in
late paying companies
and bankruptcies
Also default rates on
loans continue to
decline compared to
the recent past
Key highlights
Key highlights
Source: Bank of Italy
12,4% 12,7% 11,6% 11,8%
11,2%
8,6%
8,1% 8,0% 7,2%
6,8%
Italian unemployment Italian GDP New lending
% of companies paying over 60 days late versus contractual
terms
Number of proceedings (seasonally
adjusted) and growth rates as change
versus same quarter of previous year
Growth rate compared to the
previous quarter
New lending volumes to
corporates in € billions (quarterly)
Late paying companies Bankruptcies Default rates
Default rate on outstanding loans; Cerved estimates on
Bank of Italy data
Source: Osservatorio Cerved
50
100
150
200
2008
2009
2010
2011
2012
2013
2014
2015
2016
2017
13.3% 9.7% (10.3%)
(14.1%) (4.7%)
Source: Osservatorio Cerved
3,5% 3,7% 3,7% 3,8%
3,2%
Source: Osservatorio Cerved, Bank of Italy
Q4
(0.1)%
Q4
0.1%
Q4
0.3%
Q4
0.4% Q4
0.3%
Source: ISTAT, OECD
YoY +0.8%
YoY -0.4%
YoY -1.7%
Source: ISTAT
-53%
YoY +1.0%
Unemployment as % of total working
population
Q1 Q2 Q3 Q4
2013
Q1 Q2 Q3 Q4
2014
Q1 Q2 Q3 Q4
2015
Q1 Q2 Q3 Q4
2016
Q1 Q2 Q3 Q4
2013
Q1 Q2 Q3 Q4
2014
Q1 Q2 Q3 Q4
2015
Q1 Q2 Q3 Q4
2016 ‘17
Q1 Q2 Q3
Q1 Q2 Q3 Q4
2013
Q1 Q2 Q3 Q4
2014
Q1 Q2 Q3 Q4
2015
Q1 Q2 Q3 Q4
2016 ‘17
Q1 Q2 Q3 Q1 Q2 Q3 Q4
2013
Q1 Q2 Q3 Q4
2014
Q1 Q2 Q3 Q4
2015
Q1 Q2 Q3 Q4
2016
YoY +1.5%
Q1 Q2 Q3 Q4
2017
Q1 Q2 Q3 Q4
2017
Q1 Q2 Q3 Q4
2013
Q1 Q2 Q3 Q4
2014
Q1 Q2 Q3 Q4
2015
Q1 Q2 Q3 Q4
2016
Q1 Q2 Q3 Q4
2017
7
Highlights 1
Table of Contents
Business Review 2
Financial Review 3
Appendices 4

8
Total
Snapshot of 2017 Divisional Results
Credit Info
Financial Inst.
Credit Info
Corporate
Credit Management
Marketing Solutions
127 129
148 157
+2.2%
+5.7%
+11.7%
+16.1%
+6.5% (+5.6% organic)
+2.0%
+13.2%
+14.0%
+4.0% (+3.7% organic)
8 9
24 28
21 25
85 95
F.I.: double-digit growth in appraisals, up-
selling and new customer acquisition in BI
Corporate: launch of new products and
continuing focus on sales force effectiveness
which positively impacted consumption
EBITDA: minor margin compression mainly due
to strong growth in lower-margin segments
Revenues: met targets despite limited NPL
portfolio intake during 2017, re-scoping of the
remarketing segment
EBITDA: minor margin accretion due to mix
effect and operational improvements
Revenues: PayClick full-year consolidation
and strong trajectory, softer growth in the
legacy business
EBITDA: margin uplift in legacy business
compensating dilution from PayClick
consolidation
Drivers Adjusted EBITDA1) Revenues Area
147 150
Consolidated and divisional figures in line with company strategic outlook 2016-2018
Note: 1) Adjusted EBITDA excludes provisions of €1.8m related to the Long Term Incentive Plan
+4.1%

9
Business Review – Topics
Operational and Strategic Update for 2017 and Key Actions for 2018
Business
Corporate
Credit Information – Financial Institutions
Credit Information – Corporate
Credit Management
Marketing Solutions
Capital Structure
Investor Relations
Mergers & Acquisitions
10
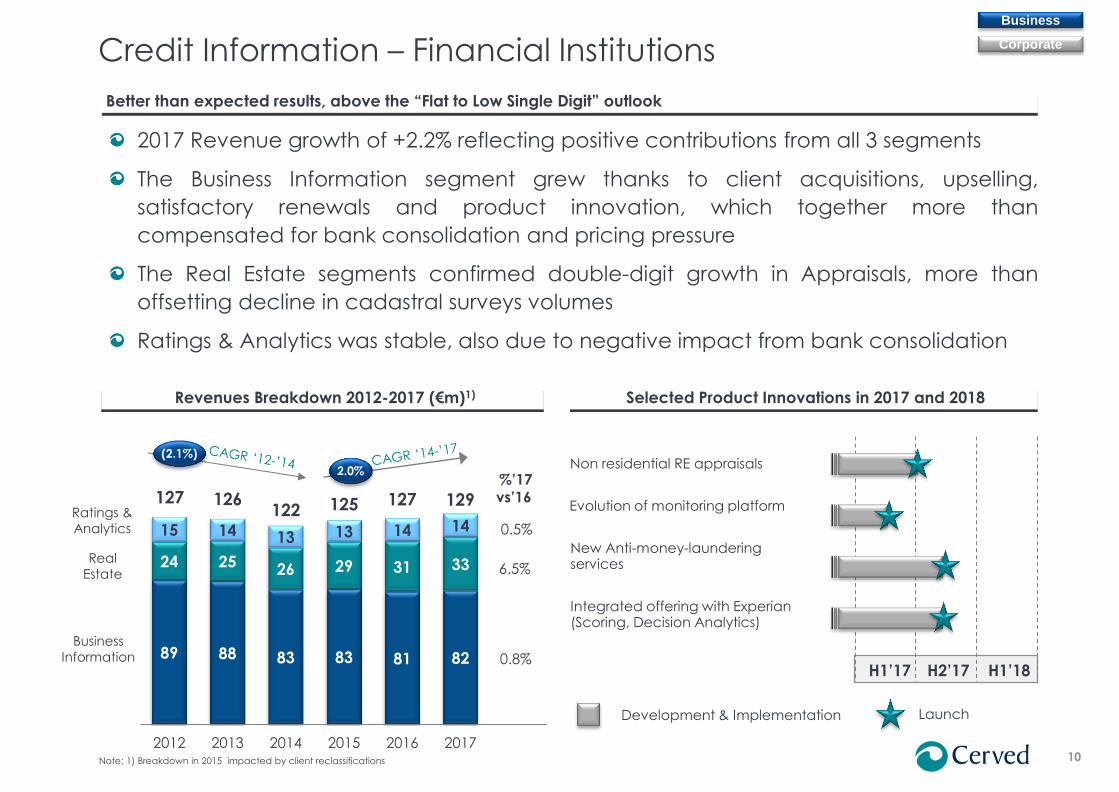
2017 Revenue growth of +2.2% reflecting positive contributions from all 3 segments
The Business Information segment grew thanks to client acquisitions, upselling,
satisfactory renewals and product innovation, which together more than
compensated for bank consolidation and pricing pressure
The Real Estate segments confirmed double-digit growth in Appraisals, more than
offsetting decline in cadastral surveys volumes
Ratings & Analytics was stable, also due to negative impact from bank consolidation
Credit Information – Financial Institutions
Better than expected results, above the “Flat to Low Single Digit” outlook
Business
Corporate
Revenues Breakdown 2012-2017 (€m)1) Selected innovation and product expansion initiatives
89 88 83 83 81 82
24 25 26 29 31 33
15 14 13 13 14 14
2012 2013 2014 2015 2016 2017
127 126 122 125 127
0.8%
%’17
vs’16
6.5%
0.5%
2.0%
(2.1%)
Note: 1) Breakdown in 2015 impacted by client reclassifications
Business
Information
Real
Estate
Ratings &
Analytics
129
H2’17 H1’18 H1’17
Non residential RE appraisals
Evolution of monitoring platform
New Anti-money-laundering services
Integrated offering with Experian (Scoring, Decision Analytics)
Selected Product Innovations in 2017 and 2018
Development & Implementation Launch

11
4,2% 5,8%
5,1% 6,7%
Lost
Clients
Existing
Clients
New
Clients
Y-o-Y
Consumption
Note: 1) Consumption of points and services in 2017 compared to 2016 for Credit Information products by c. 20k corporate clients
2017 Revenue growth of +5.7% reflected the positive contribution of new product
launches and continuous effort of sales force excellence
Very strong Q4 (+9.3%) which compensated for the weak Q3 (+0.4%), in part due to
delays in the finalization of specific projects with large accounts
Product innovation and commercial effort on excellence remain a key area of focus in
2018
Credit Information – Corporates
Revenues on the high end of expectations of “Mid Single Digit Growth”
Business
Corporate
Consumption of Credit Information Points & Services 2017 vs 2016 1) Selected Product Innovations in 2017 and 2018
H2’17 H1’18 H1’17
Cerved Credit Suite
New Payline Decision systems
Industry-specific solutions & value propositions
New Foreign Report platform
Development & Implementation Launch
Integration of Credit Collection features into Credit Info platforms (Payline Collection & Credit Collection Score)

12
33%
Work-out
47%
Legal
Services
12%
Asset
Remark'ng
9%
2017 Revenue growth of +11.7%, with all segments performing in double-digit territory,
exception made for remarketing which is being re-scoped (eg. yacht business)
During 2017 AuMs almost doubled with the Barclays deal while NPLs growth was below
expectations due to delay in major portfolios’ transactions
Higher margins in 2017 mainly driven by business mix and operational improvements
Current focus on finalizing partnerships with Quaestio, BMPS and BP Bari, and on-
boarding new portfolios for more than €20bn
Significant recruiting effort on-going to support AuMs growth
Revenues in line with expectations despite limited new NPL portfolio intakes impacting 2017
Evolution of AuMs in 2015-2017 (€bn) Revenues Breakdown 2017PF1)
Credit Management Business
Corporate
Receivables &
Performing Loans
(33%)
NPL-related
activities
(67%)
12,0 13,3
11,0
1,7 1,0
25,1
FY'15 FY'16 Barclays New
Portfolios
Other Net
Changes
FY'17
Notes: Receivables under management of €0.7bn, €0.6bn and €0.8bn in 2015, 2016 and 2017; FY’17 excludes AuMs from BPB transaction Note: 1) partnership with Barclays considered on a full year basis
13
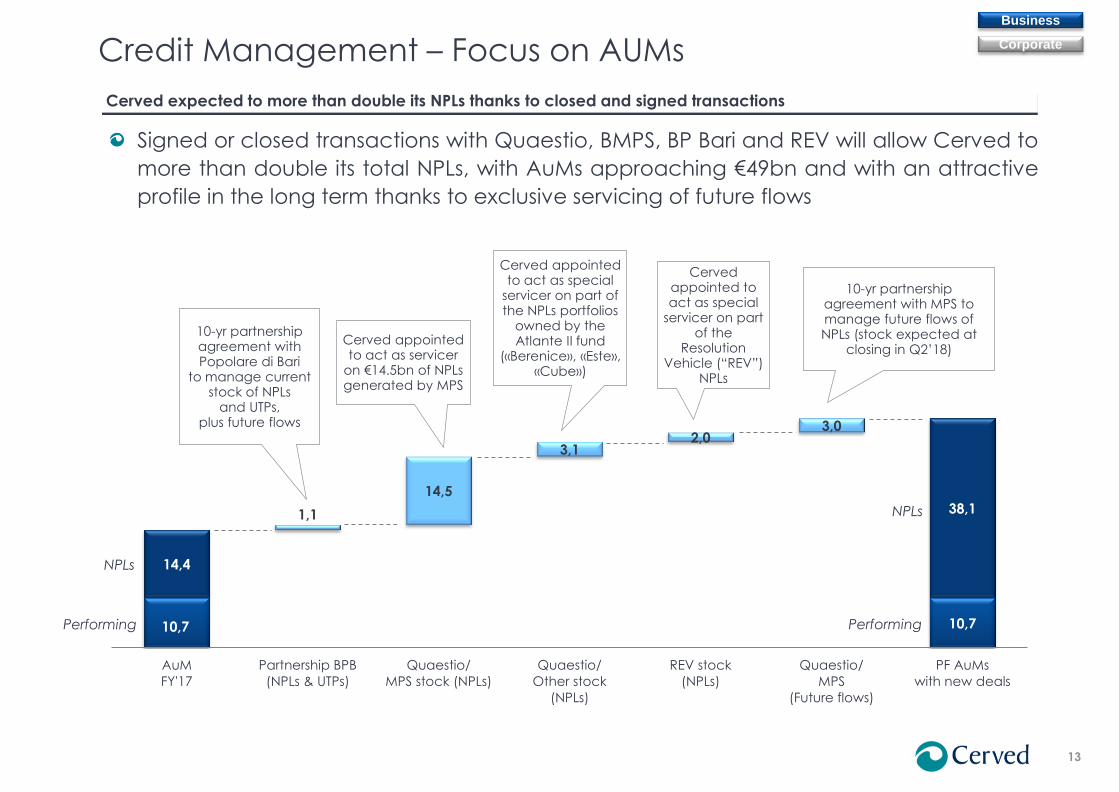
10,7 10,7
14,4
38,1 1,1
14,5
3,1 2,0
3,0
AuM
FY'17
Partnership BPB
(NPLs & UTPs)
Quaestio/
MPS stock (NPLs)
Quaestio/
Other stock
(NPLs)
REV stock
(NPLs)
Quaestio/
MPS
(Future flows)
PF AuMs
with new deals
Credit Management – Focus on AUMs Business
Corporate
Signed or closed transactions with Quaestio, BMPS, BP Bari and REV will allow Cerved to
more than double its total NPLs, with AuMs approaching €49bn and with an attractive
profile in the long term thanks to exclusive servicing of future flows
Cerved expected to more than double its NPLs thanks to closed and signed transactions
10-yr partnership agreement with Popolare di Bari
to manage current stock of NPLs
and UTPs, plus future flows
Cerved appointed to act as servicer
on €14.5bn of NPLs generated by MPS
10-yr partnership agreement with MPS to manage future flows of NPLs (stock expected at
closing in Q2’18)
Cerved appointed to act as special
servicer on part of the NPLs portfolios
owned by the Atlante II fund
(«Berenice», «Este», «Cube»)
Cerved appointed to act as special
servicer on part of the
Resolution Vehicle (“REV”)
NPLs
NPLs
Performing
NPLs
Performing
14
Marketing Solutions Market Map Revenues Breakdown 2017 (€m)
Marketing Solutions
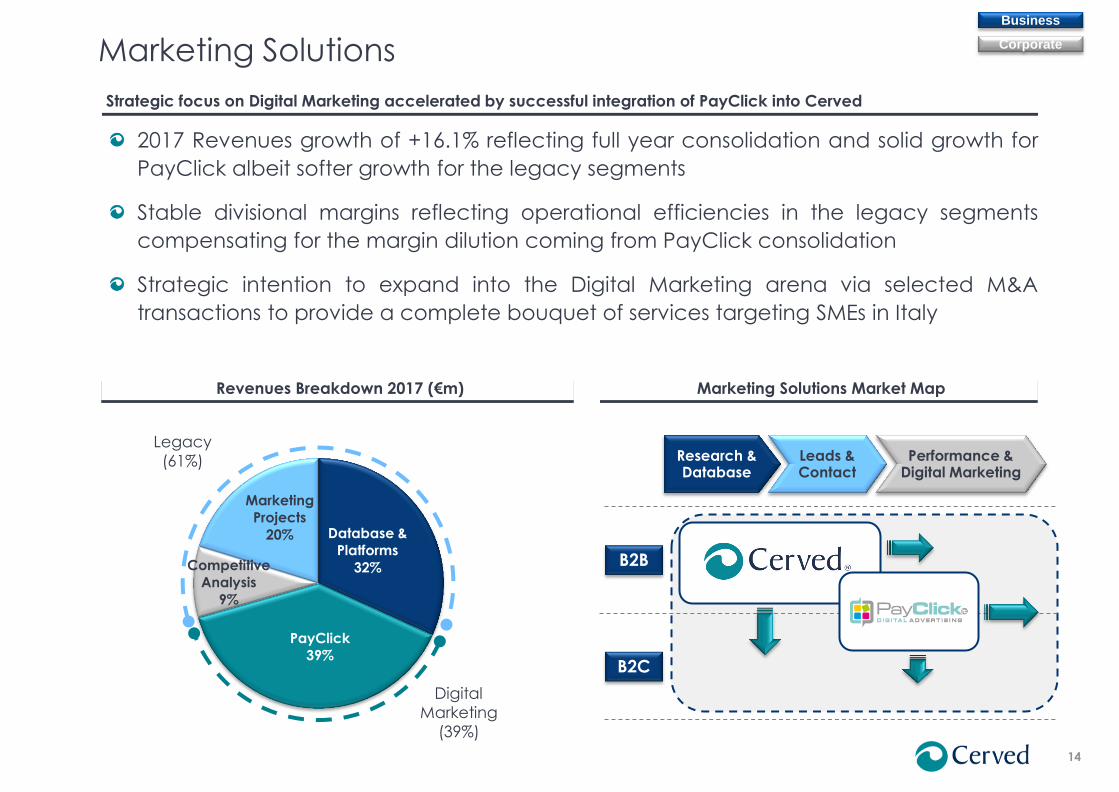
Strategic focus on Digital Marketing accelerated by successful integration of PayClick into Cerved
Business
Corporate
2017 Revenues growth of +16.1% reflecting full year consolidation and solid growth for
PayClick albeit softer growth for the legacy segments
Stable divisional margins reflecting operational efficiencies in the legacy segments
compensating for the margin dilution coming from PayClick consolidation
Strategic intention to expand into the Digital Marketing arena via selected M&A
transactions to provide a complete bouquet of services targeting SMEs in Italy
Database &
Platforms
32%
PayClick
39%
Competitive
Analysis
9%
Marketing
Projects
20%
Research & Database
Performance & Digital Marketing
Leads & Contact
B2B
B2C
Legacy
(61%)
Digital
Marketing
(39%)

15
Net Debt Bridge Quarterly Leverage 2016 vs 2017
Capital Structure
Strong cash flow generation provides strong support for M&A strategy, dividend payout and deleverage
Deleverage to 2.5x at year-end 2017 (2.6x proforma for BP Bari transaction) confirms
Cerved’s strong cash generation capabilities
Board of Directors proposed dividend of €52.7m (+9.3% vs €48.2m paid in May 2016)
equating to 53.6% of 2017 Adjusted Net Income
Residual leverage capacity to 3.0x long-term target to be retained for M&A, share
buybacks and interest savings (25 bps savings under 2.85x)
Completed i) extension of €200m of TLB to end 2023 (from Jan 2022), ii) reduction of
margins, iii) removal of security package and iv) switch of TLA from amortizing to bullet
Corporate
Business
523
474
(143)
16 22
48 2 4
Ne
t D
eb
t
20
16
Op
. C
ash
Flo
w
Ca
sh-In
tere
sts
Ca
sh-T
axe
s
Ne
t d
ivid
en
ds
M&
A
No
n-R
ec
. &
Oth
er
ite
ms
Ne
t D
eb
t
20
17
3,1x 3,2x
3,1x
2,9x 2,8x 2,8x
2,7x
2,5x
Q1
'16
Q2
'16
Q3
'16
Q4
'16
Q1
'17
Q2
'17
Q3
'17
Q4
'17
Margin Ratchet
2.85x
Note: Q4 leverage excludes €18.0m cash-out occurred on January 2nd 2018 for the acquisition of the BP Bari servicing platform
16
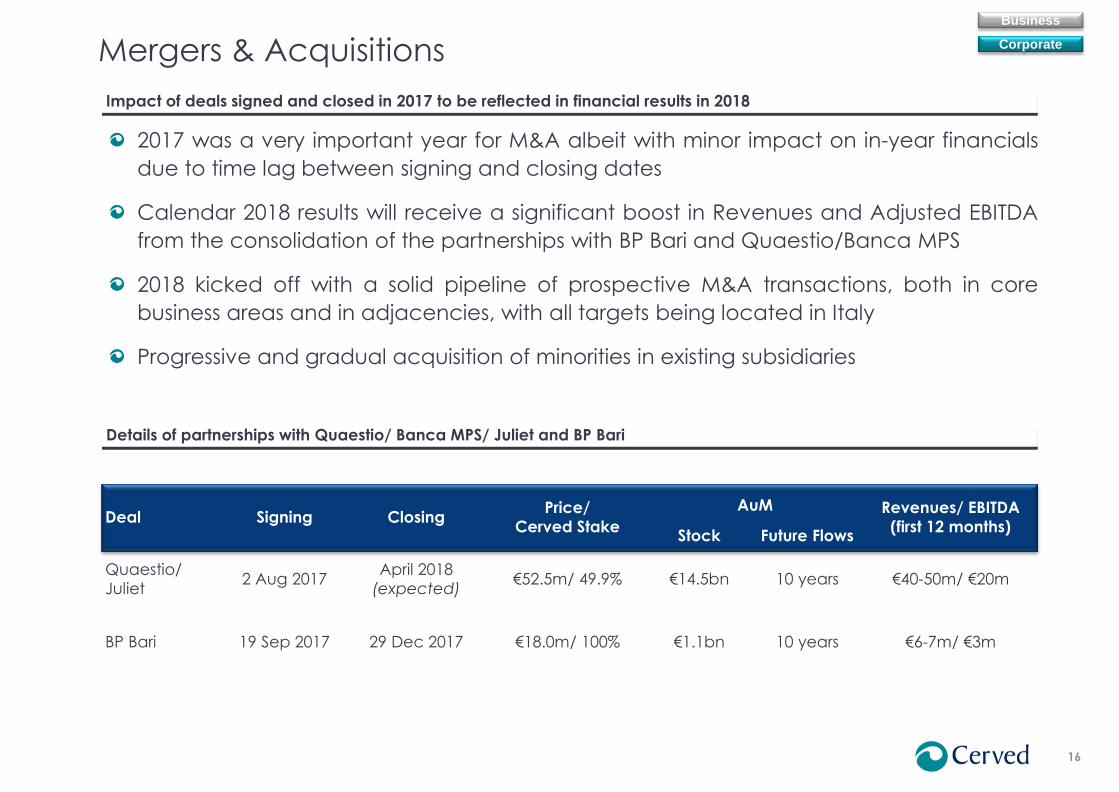
Deal Signing Closing Price/
Cerved Stake
AuM Revenues/ EBITDA
(first 12 months) Stock Future Flows
Quaestio/
Juliet 2 Aug 2017
April 2018
(expected) €52.5m/ 49.9% €14.5bn 10 years €40-50m/ €20m
BP Bari 19 Sep 2017 29 Dec 2017 €18.0m/ 100% €1.1bn 10 years €6-7m/ €3m
Details of partnerships with Quaestio/ Banca MPS/ Juliet and BP Bari
Mergers & Acquisitions
Impact of deals signed and closed in 2017 to be reflected in financial results in 2018
2017 was a very important year for M&A albeit with minor impact on in-year financials
due to time lag between signing and closing dates
Calendar 2018 results will receive a significant boost in Revenues and Adjusted EBITDA
from the consolidation of the partnerships with BP Bari and Quaestio/Banca MPS
2018 kicked off with a solid pipeline of prospective M&A transactions, both in core
business areas and in adjacencies, with all targets being located in Italy
Progressive and gradual acquisition of minorities in existing subsidiaries
Corporate
Business

17
Date Event Venue
Feb 27-28 Roadshow (Mediobanca) London
Mar 28 Equity Conference (HSBC) Paris
Apr 9 Annual General Meeting – Cerved Milan
Apr tbd Roadshow (Equita SIM) Switzerland
May 3 Mid-Small Cap Conf. (GS) London
May 7 Q1 2018 Results – Cerved Conf call
May 16-17 Italian Equity Conference (Kepler) Milan
Jun tbd Investor Day 2018 – Cerved London &
Milan
Jun 26 Business Services Conference (GS) London
Jun 27 CEO Conference (Mediobanca) Milan
Jul 30 H1 2018 Results – Cerved Conf call
Date Event Venue
Aug 1-3 US Roadshow (tbd) NY & Boston
Sep 5 Industrial Day (Borsa Italiana) Milan
Sep 12 Mid-Small Caps (JPM) London
Sep 28 Italian Conference (JPM) Milan
Oct tbd Roadshow (Kepler) Scandinavia
Oct 29 9M 2018 Results – Cerved Conf call
Nov 28 Mid Cap Conference (Exane) London
Nov-Dec Roadshow (tbd) Benelux
Nov-Dec Roadshow (tbd) Paris &
Frankfurt
Financial Calendar and Tentative Conferences and Roadshows in 2018
Investor Relations
Continued focus on providing clearer and insightful information to the financial community
Investor Relations team and capabilities reinforced in light of MiFid II regulation and
continuing effort to improve visibility of Cerved within the financial community
Investor Day II to be hosted in London in June, with a follow-up event in Cerved’s
headquarters in Milan to offer a more granular look into Cerved’s products and
services range (exact dates to be defined)
Corporate
Business
18
Highlights 1
Table of Contents
Appendices 4
Business Review 2
Financial Review 3
19
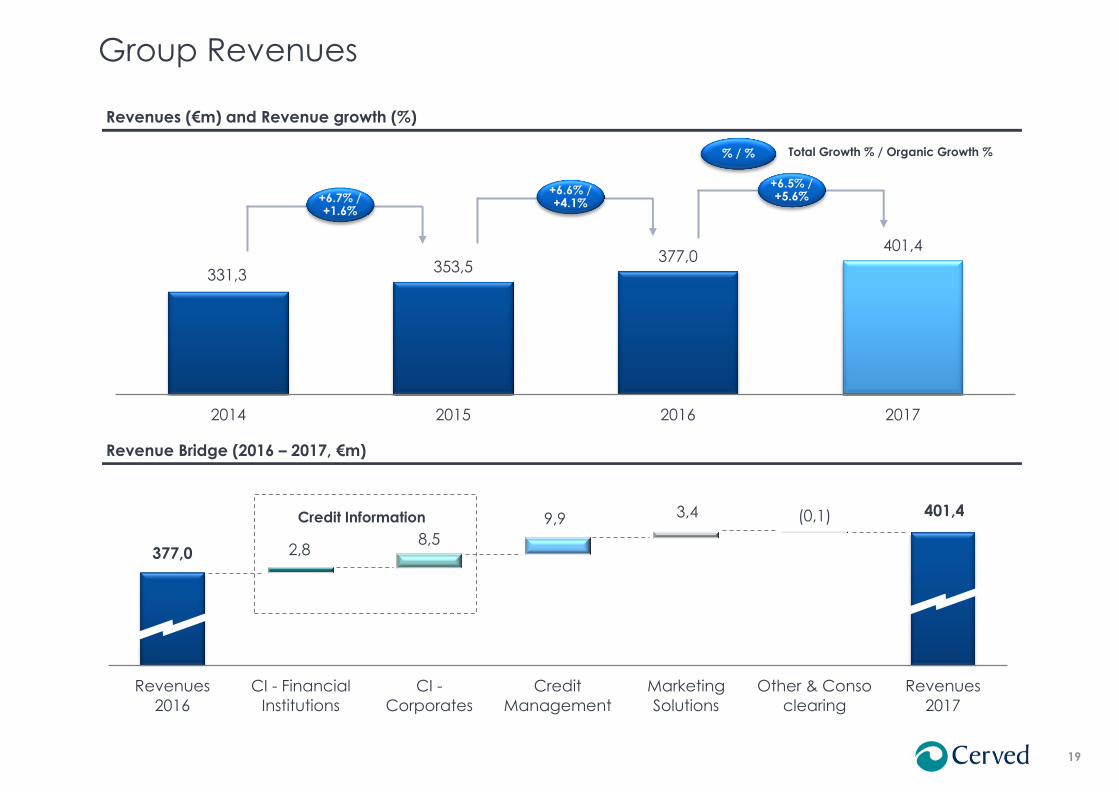
Group Revenues
Revenue Bridge (2016 – 2017, €m)
Revenues (€m) and Revenue growth (%)
331,3 353,5
377,0 401,4
2014 2015 2016 2017
377,0
401,4
2,8 8,5
9,9 3,4 (0,1)
Revenues
2016
CI - Financial
Institutions
CI -
Corporates
Credit
Management
Marketing
Solutions
Other & Conso
clearing
Revenues
2017
Credit Information
% / % Total Growth % / Organic Growth %
+6.5% / +5.6% +6.7% /
+1.6%
+6.6% / +4.1%
20
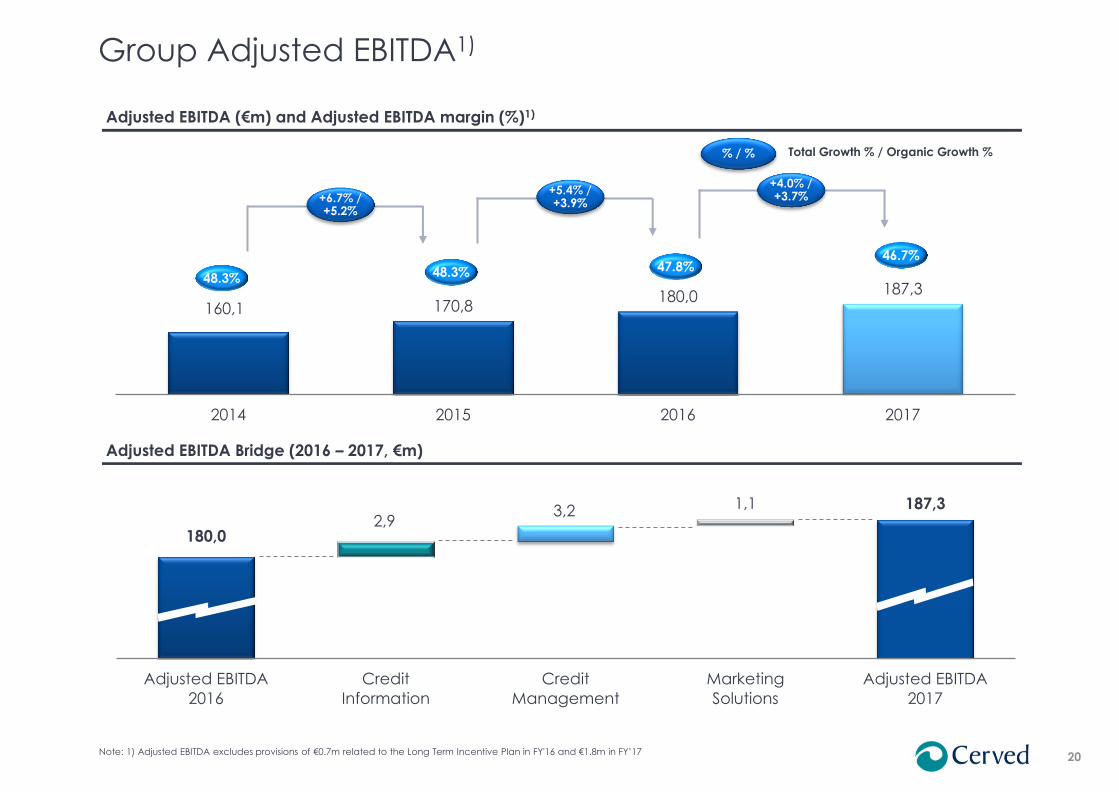
180,0
187,3 2,9
3,2 1,1
Adjusted EBITDA
2016
Credit
Information
Credit
Management
Marketing
Solutions
Adjusted EBITDA
2017
160,1 170,8 180,0 187,3
2014 2015 2016 2017
Group Adjusted EBITDA1)
Adjusted EBITDA Bridge (2016 – 2017, €m)
Adjusted EBITDA (€m) and Adjusted EBITDA margin (%)1)
48.3% 48.3%
% / % Total Growth % / Organic Growth %
46.7% 47.8%
+6.7% / +5.2%
+4.0% / +3.7%
Note: 1) Adjusted EBITDA excludes provisions of €0.7m related to the Long Term Incentive Plan in FY'16 and €1.8m in FY’17
+5.4% / +3.9%

21
53,3 75,0 84,7 94,6
2014 2015 2016 2017
Note: 1) Breakdown between Corporates and Financial Institutions could be slightly different from past figures due to the reclassification of some clients within segments 2) Adjusted EBITDA excludes provisions of €0.7m related to the Long Term Incentive Plan in FY'16 and €1.8m in FY’17
Group Divisional Performance
Credit Information Credit Management Marketing Solutions
122,0 125,4 126,6 129,4
142,7 141,7 148,1 156,5
264,7 267,1 274,7 286,0
2014 2015 2016 2017
Re
ve
nu
e
Ad
just
ed
EB
ITD
A2)
142,1 145,4 147,5 150,4
2014 2015 2016 2017
11,2
19,5 24,4
27,6
2014 2015 2016 2017
14,7 13,8 21,1
24,5
2014 2015 2016 2017
6,8 5,9 8,2 9,3
2014 2015 2016 2017
45.9% 42.7%
21.0%
26.0%
53.7% 54.4% 53.7%
Fin. Inst.
Corp.
% YoY Growth % Adjusted EBITDA margin % % CAGR
37.9%
29.2% 52.6%
%
28.8%
38.7%
1)
+14.0%
+9.9%
CAGR ‘14-16
+13.2%
+47.8%
CAGR ‘14-16
+1.9%
CAGR ‘14-16
+2.0%
+16.1%
+19.7%
CAGR ‘14-16
+11.7%
+26.1%
CAGR ‘14-16
+1.9%
CAGR ‘14-16
+4.1%
22
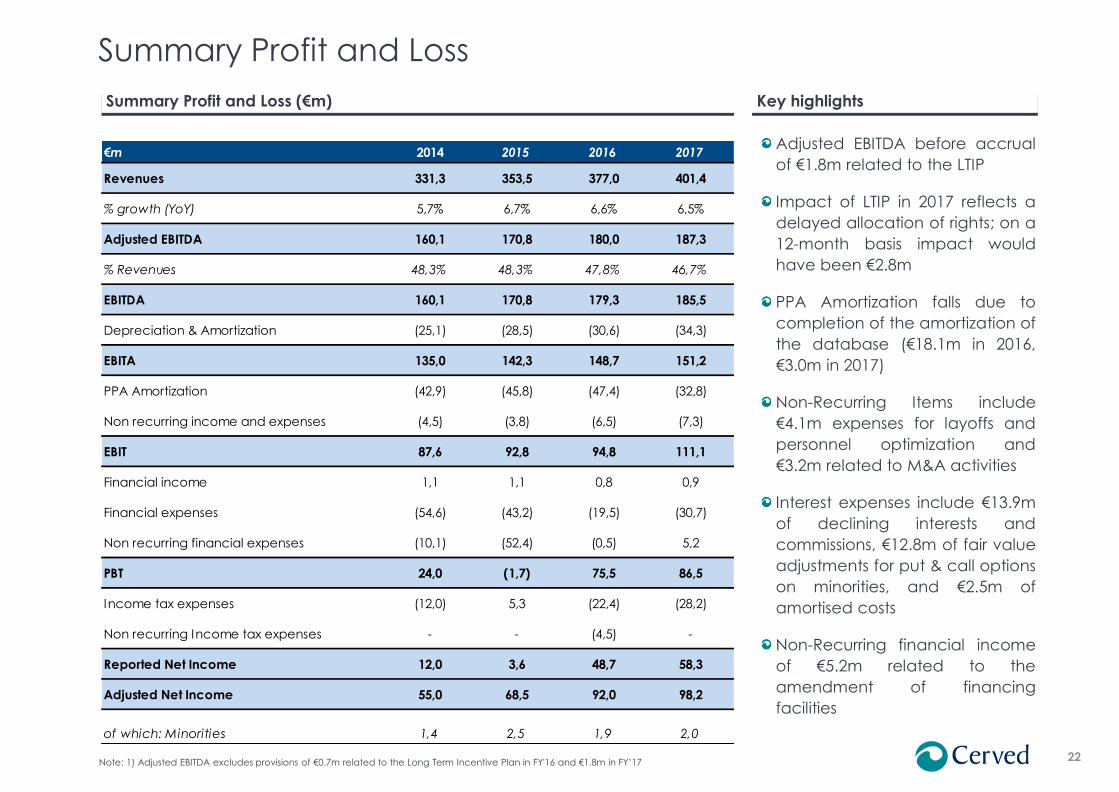
€m 2014 2015 2016 2017
Revenues 331,3 353,5 377,0 401,4
% growth (YoY) 5,7% 6,7% 6,6% 6,5%
Adjusted EBITDA 160,1 170,8 180,0 187,3
% Revenues 48,3% 48,3% 47,8% 46,7%
EBITDA 160,1 170,8 179,3 185,5
Depreciation & Amortization (25,1) (28,5) (30,6) (34,3)
EBITA 135,0 142,3 148,7 151,2
PPA Amortization (42,9) (45,8) (47,4) (32,8)
Non recurring income and expenses (4,5) (3,8) (6,5) (7,3)
EBIT 87,6 92,8 94,8 111,1
Financial income 1,1 1,1 0,8 0,9
Financial expenses (54,6) (43,2) (19,5) (30,7)
Non recurring financial expenses (10,1) (52,4) (0,5) 5,2
PBT 24,0 (1,7) 75,5 86,5
Income tax expenses (12,0) 5,3 (22,4) (28,2)
Non recurring Income tax expenses - - (4,5) -
Reported Net Income 12,0 3,6 48,7 58,3
Adjusted Net Income 55,0 68,5 92,0 98,2
of which: Minorities 1,4 2,5 1,9 2,0
Adjusted EBITDA before accrual
of €1.8m related to the LTIP
Impact of LTIP in 2017 reflects a
delayed allocation of rights; on a
12-month basis impact would
have been €2.8m
PPA Amortization falls due to
completion of the amortization of
the database (€18.1m in 2016,
€3.0m in 2017)
Non-Recurring Items include
€4.1m expenses for layoffs and
personnel optimization and
€3.2m related to M&A activities
Interest expenses include €13.9m
of declining interests and
commissions, €12.8m of fair value
adjustments for put & call options
on minorities, and €2.5m of
amortised costs
Non-Recurring financial income
of €5.2m related to the
amendment of financing
facilities
Summary Profit and Loss (€m)
Summary Profit and Loss
Key highlights
Note: 1) Adjusted EBITDA excludes provisions of €0.7m related to the Long Term Incentive Plan in FY'16 and €1.8m in FY’17

23
Net Working Capital reached
12.5% of Revenues in 2017
compared to 10.8% in 2016
Trade Receivables increased by
€7.0m mainly due to the
sustained growth in the Credit
Management division, albeit
declined from 41.1% to 40.3% as
a percentage of Revenues
Trade Payables increased by
€7.5m reflecting the impact of
higher costs and revised supplier
management terms
Reduction of €9.6m in Deferred
Revenues largely attributable to
the Corporate division, and
reflecting customer mix (large
corporate clients less linked to
prepaid points) and gap
between consumption and sales
of prepaid points
0,7 2,0 1,7 2,0
145,3 139,8 154,9
161,9
(32,4) (30,0) (38,5) (46,0)
(73,3) (74,0) (77,3) (67,7)
40,4 37,8 40,9 50,2
2014 2015 2016 2017
Inventories Trade receivables Trade payables
Deferred revenues Net Working Capital
Net Working Capital
11.7%
Net Working Capital (€m)
NWC as % of Revenues 1) %
10.7% 10.8% 12.5%
Note: 1) NWC/Revenues based on pro-forma Revenues for the previous 12 months
Key highlights
24
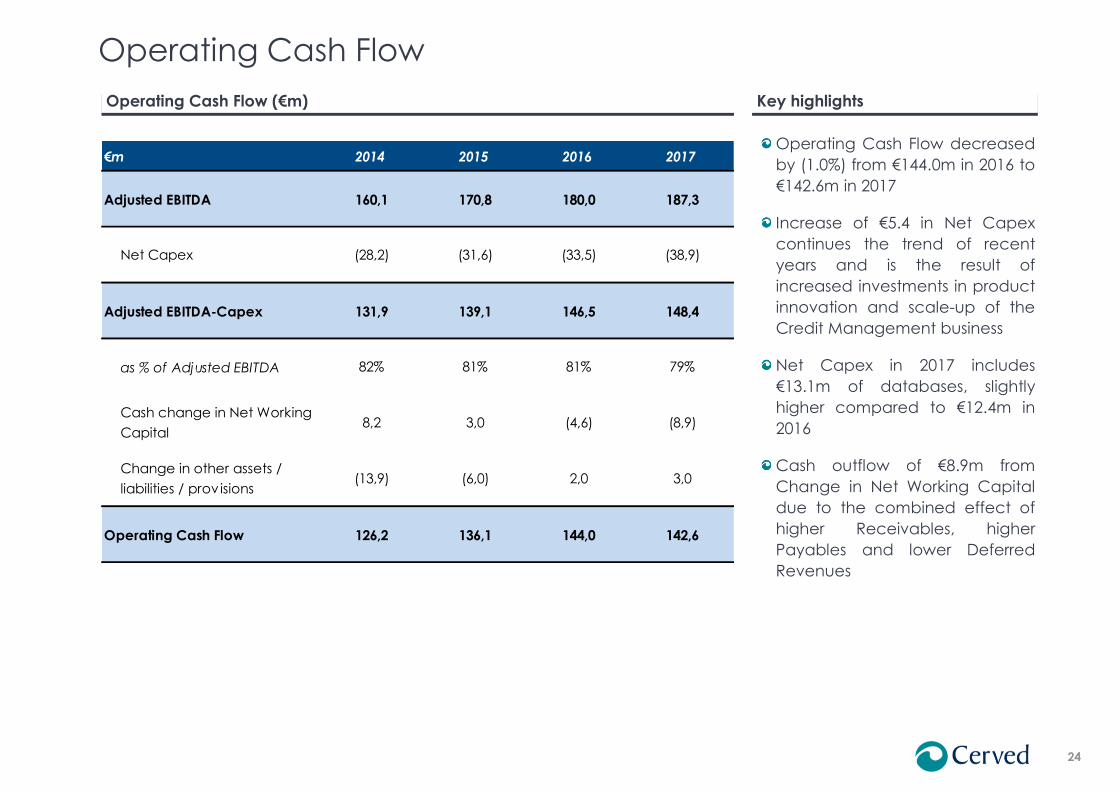
€m 2014 2015 2016 2017
Adjusted EBITDA 160,1 170,8 180,0 187,3
Net Capex (28,2) (31,6) (33,5) (38,9)
Adjusted EBITDA-Capex 131,9 139,1 146,5 148,4
as % of Adjusted EBITDA 82% 81% 81% 79%
Cash change in Net Working
Capital8,2 3,0 (4,6) (8,9)
Change in other assets /
liabilities / provisions(13,9) (6,0) 2,0 3,0
Operating Cash Flow 126,2 136,1 144,0 142,6
Operating Cash Flow decreased
by (1.0%) from €144.0m in 2016 to
€142.6m in 2017
Increase of €5.4 in Net Capex
continues the trend of recent
years and is the result of
increased investments in product
innovation and scale-up of the
Credit Management business
Net Capex in 2017 includes
€13.1m of databases, slightly
higher compared to €12.4m in
2016
Cash outflow of €8.9m from
Change in Net Working Capital
due to the combined effect of
higher Receivables, higher
Payables and lower Deferred
Revenues
Operating Cash Flow (€m)
Operating Cash Flow
Key highlights
25
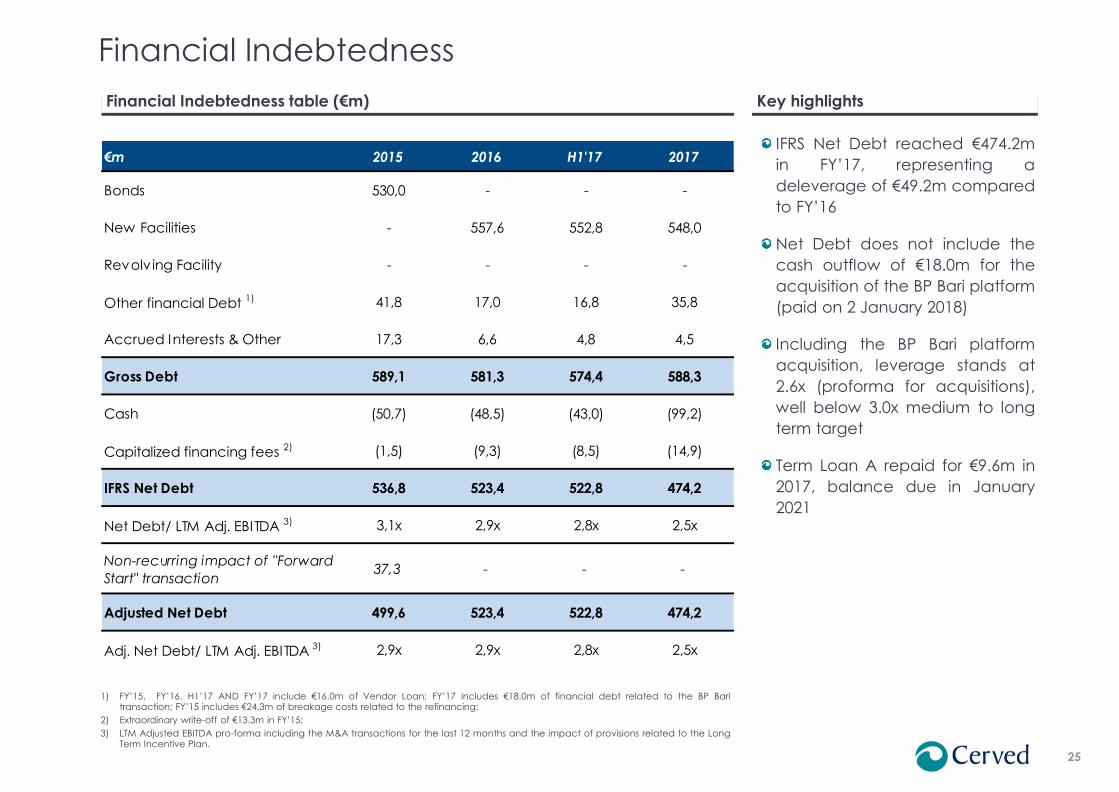
€m 2015 2016 H1'17 2017
Bonds 530,0 - - -
New Facilities - 557,6 552,8 548,0
Revolv ing Facility - - - -
Other financial Debt 1) 41,8 17,0 16,8 35,8
Accrued Interests & Other 17,3 6,6 4,8 4,5
Gross Debt 589,1 581,3 574,4 588,3
Cash (50,7) (48,5) (43,0) (99,2)
Capitalized financing fees 2) (1,5) (9,3) (8,5) (14,9)
IFRS Net Debt 536,8 523,4 522,8 474,2
Net Debt/ LTM Adj. EBITDA 3) 3,1x 2,9x 2,8x 2,5x
Non-recurring impact of "Forward
Start" transaction37,3 - - -
Adjusted Net Debt 499,6 523,4 522,8 474,2
Adj. Net Debt/ LTM Adj. EBITDA 3) 2,9x 2,9x 2,8x 2,5x
Financial Indebtedness
Financial Indebtedness table (€m)
1) FY’15, FY’16, H1’17 AND FY’17 include €16.0m of Vendor Loan; FY’17 includes €18.0m of financial debt related to the BP Bari transaction; FY’15 includes €24.3m of breakage costs related to the refinancing;
2) Extraordinary write-off of €13.3m in FY’15;
3) LTM Adjusted EBITDA pro-forma including the M&A transactions for the last 12 months and the impact of provisions related to the Long Term Incentive Plan.
Key highlights
IFRS Net Debt reached €474.2m
in FY’17, representing a
deleverage of €49.2m compared
to FY’16
Net Debt does not include the
cash outflow of €18.0m for the
acquisition of the BP Bari platform
(paid on 2 January 2018)
Including the BP Bari platform
acquisition, leverage stands at
2.6x (proforma for acquisitions),
well below 3.0x medium to long
term target
Term Loan A repaid for €9.6m in
2017, balance due in January
2021

26
Appendices 4
Highlights 1
Table of Contents
Financial Review 3
Business Review 2

0 73
132
0 128 142
109 189 255
191 191 191
0 103 188
16 159 189
221 221 221
92 188 210
27
129,4
156,5 24,5
94,6
Revenues PF FY’17
(€ and % Group)
Credit Information
Corporate Financial Institution
+3.1% +21.1% +18.5% +2.0%
39%
23%
6%
32%
Credit Management Marketing Solutions
Scope of Business
Growth FY ’17 vs’16
CAGR % ‘14-’17
Products and services sold to financial institutions and corporations to assess the solvency, creditworthiness and financial
condition of commercial counterparties and clients
Based on Italy’s largest and most comprehensive database on corporates
Market analysis, lead generation and
performance marketing products and services arising
from Cerved’s database
Servicing of all types of performing,
NPLs and problematic receivables on behalf
of banks, investors, finance companies,
utilities and corporates
+5.7% +11.7% +16.1% +2.2%
The Italian Leader in the Credit Information Market
Note: figures includes intercompanies
Key Drivers
Pricing pressure
Cross-selling
New bank lending
Underpenetration
Industrial production
Credit checks
Growth of NPLs
Bank outsourcing
Collection levels
Cross-selling
Consolidation
Product innovation
0 73
132
0 128 142
109 189 255
191 191 191
0 103 188
16 159 189
221 221 221
92 188 210
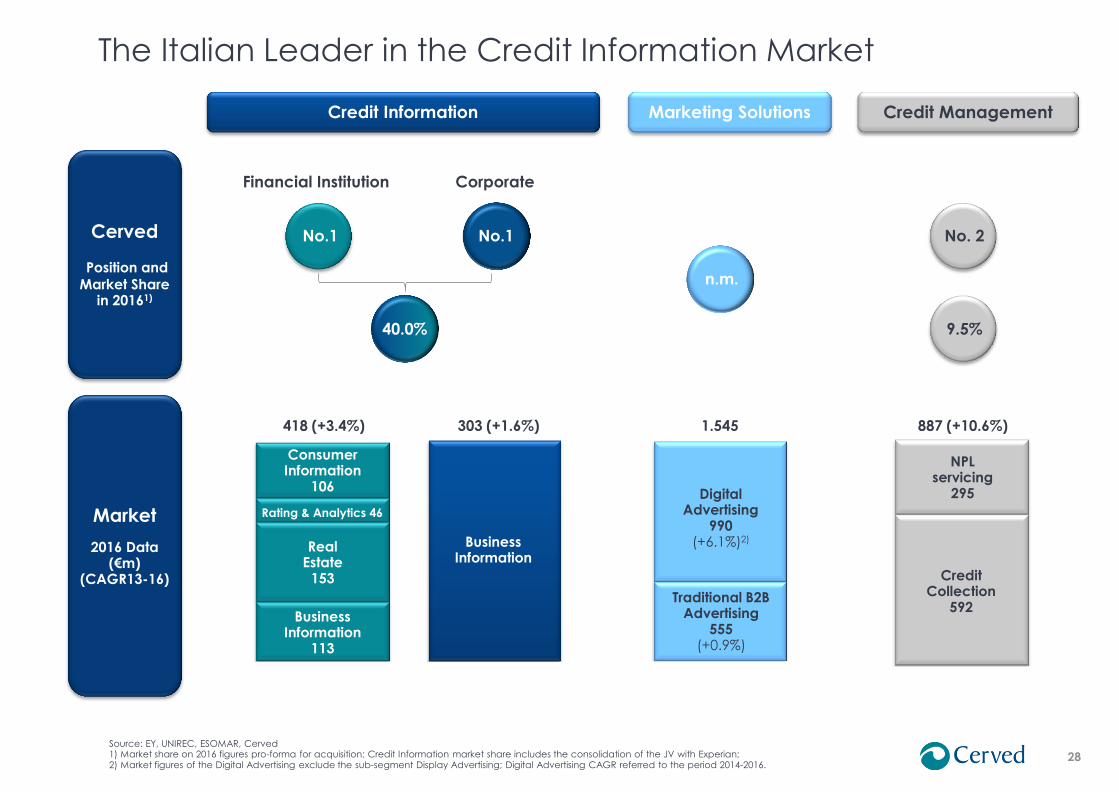
28
2% 42%
303 (+1.6%)
Business Information
1.545 887 (+10.6%)
Cerved
Position and
Market Share in 20161)
418 (+3.4%)
l% 40.0% 9.5%
n.m.
No.1 No. 2 No.1
Market
2016 Data (€m)
(CAGR13-16)
NPL servicing
295
Credit Collection
592 Business
Information 113
Rating & Analytics 46
Real Estate
153
Consumer Information
106
Source: EY, UNIREC, ESOMAR, Cerved 1) Market share on 2016 figures pro-forma for acquisition; Credit Information market share includes the consolidation of the JV with Experian; 2) Market figures of the Digital Advertising exclude the sub-segment Display Advertising; Digital Advertising CAGR referred to the period 2014-2016.
Corporate Financial Institution
Credit Information Marketing Solutions
The Italian Leader in the Credit Information Market
Credit Management
Digital Advertising
990 (+6.1%)2)
Traditional B2B Advertising
555 (+0.9%)
29
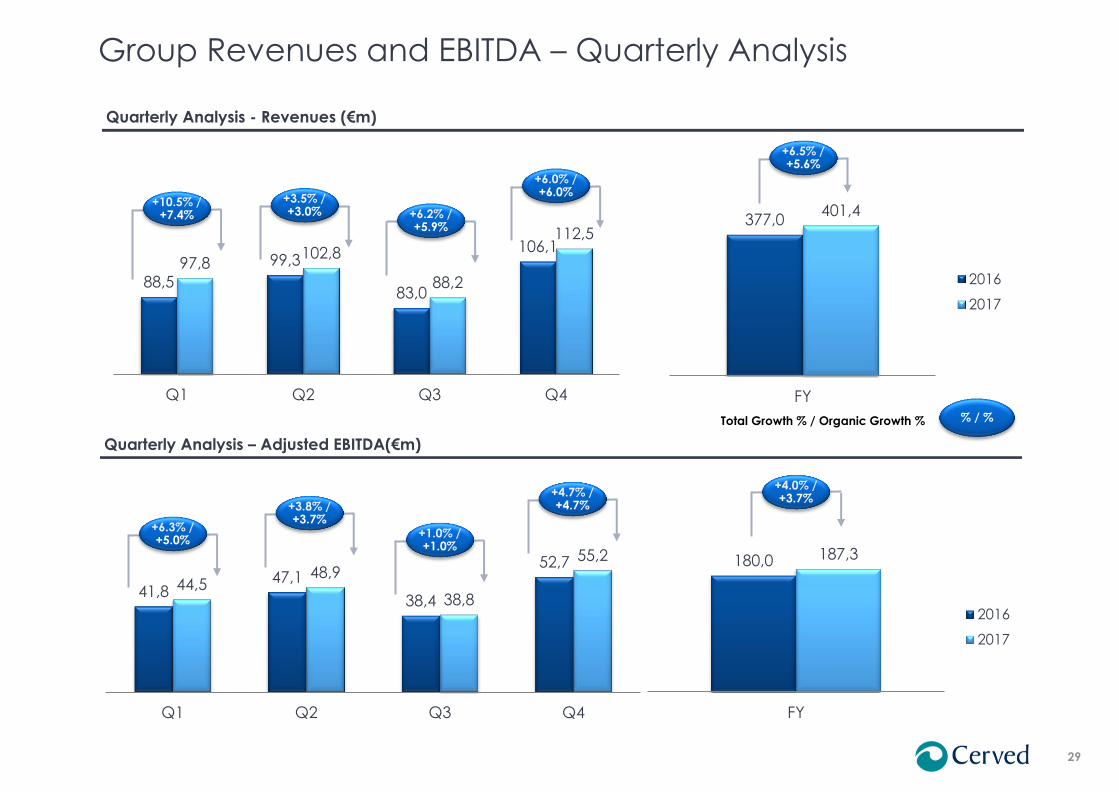
Group Revenues and EBITDA – Quarterly Analysis
180,0 187,3
FY
2016
2017
377,0 401,4
FY
2016
2017
Quarterly Analysis - Revenues (€m)
Quarterly Analysis – Adjusted EBITDA(€m)
88,5
99,3
83,0
106,1 97,8
102,8
88,2
112,5
Q1 Q2 Q3 Q4
41,8 47,1
38,4
52,7
44,5 48,9
38,8
55,2
Q1 Q2 Q3 Q4
Total Growth % / Organic Growth % % / %
+10.5% / +7.4%
+3.5% / +3.0%
+6.5% / +5.6%
+6.3% / +5.0%
+3.8% / +3.7%
+4.0% / +3.7%
+6.2% / +5.9%
+1.0% / +1.0%
+6.0% / +6.0%
+4.7% / +4.7%

30
Credit Information – Revenues (€m)
Credit Information – Quarterly Analysis
68,6 70,9 60,9 74,3
274,7
71,7 73,0 62,1 79,2
286,0
Q1 Q2 Q3 Q4 FY
2016
2017
32,0 32,0 30,0 32,6
126,6
32,7 32,0 31,0 33,6
129,4
Q1 Q2 Q3 Q4 FY
Credit Information – Financial Institutions – Rev (€m)
36,6 38,9 30,9 41,7
148,1
39,0 40,9 31,1 45,6
156,5
Q1 Q2 Q3 Q4 FY
2016 2017
Credit Information – Corporate – Rev (€m)
36,9 37,4 31,5 41,6
147,5
38,3 39,5 31,1 41,6
150,4
Q1 Q2 Q3 Q4 FY
2016
2017
Credit Information – Adjusted EBITDA (€m)
+3.6% +5.6%
+4.4% +3.0% +2.0%
+2.1% +0.1%
+2.2%
+6.5% +5.3%
+0.4% +3.5%
+5.7%
+4.1%
(1.3%) (0.2%)
+2.0%
+6.6%
+9.3% +3.1%

31
Credit Mgmt and Marketing Solutions – Quarterly Analysis
1,1 2,0
1,6
3,4
8,2
1,7 2,0 1,7
3,9
9,3
EBITDA Q1 EBITDA Q2 EBITDA Q3 EBITDA Q4 EBITDA FY
2016
2017
3,8
7,6 5,3
7,7
24,4
4,5 7,4 6,0
9,8
27,6
EBITDA Q1 EBITDA Q2 EBITDA Q3 EBITDA Q4 EBITDA FY
2016
2017
17,4 23,9
18,3 25,1
84,7
21,5 24,5 22,0 26,7
94,6
Rev Q1 Rev Q2 Rev Q3 Rev Q4 Rev FY
3,1 5,7 4,7
7,6
21,1
5,6 6,4 5,0
7,5
24,5
Rev Q1 Rev Q2 Rev Q3 Rev Q4 Rev FY
Credit Management – Revenues and Adjusted EBITDA (€m)
Marketing Solutions – Revenues and Adjusted EBITDA (€m)
+23.3% +2.4%
+11.7%
+18.2%
(3.0%)
+26.8%
+79.8% +11.7%
+16.1%
+57.4% (2.8%)
+6.7%
+14.0%
+7.0%
+19.8% +13.3%
+13.2%
+6.5%
(0.8%)
+13.5%

32
€m 2014 2015 2016 2017
Total Revenues (including other income) 331,6 353,7 377,1 401,7
Cost of raw material and other materials (7,0) (8,3) (7,4) (7,1)
Cost of Serv ices (76,3) (78,9) (84,9) (98,5)
Personnel costs (73,7) (81,5) (91,7) (96,8)
Other operating costs (8,2) (8,5) (8,6) (8,7)
Impairment of receivables and other provisions (6,3) (5,7) (4,5) (3,2)
Adjusted EBITDA 160,1 170,8 180,0 187,3
Performance Share Plan - - (0,7) (1,8)
EBITDA 160,1 170,8 179,3 185,5
Depreciation & amortization (25,1) (28,5) (30,6) (34,3)
EBITA 135,0 142,3 148,7 151,2
PPA Amortization (42,9) (45,8) (47,4) (32,8)
Non-recurring Income and expenses (4,5) (3,8) (6,5) (7,3)
EBIT 87,6 92,8 94,8 111,1
PBT 24,0 (1,7) 75,5 86,5
Income tax expenses (12,0) 5,3 (22,4) (28,2)
Non-recurring Income tax expenses - - (4,5) -
Reported Net Income 12,0 3,6 48,7 58,3
Adjusted Net Income 55,0 68,5 92,0 98,2
of which: Minorities 1,4 2,5 1,9 2,0
Profit and Loss
Source: Company Information; for further details refer to Cerved Information Solutions S.p.A. Annual and Quarterly Reports

33
€m 2014 2015 2016 2017
Intangible assets 472,4 459,7 423,7 395,9
Goodwill 718,8 718,8 732,5 750,4
Tangible assets 17,3 16,4 19,8 20,6
Financial assets 14,9 8,3 8,7 9,0
Fixed assets 1.223,4 1.203,1 1.184,7 1.175,9
Inventories 0,7 2,0 1,7 2,0
Trade receivables 145,3 139,8 154,9 161,9
Trade payables (32,4) (30,0) (38,5) (46,0)
Deferred revenues (73,3) (74,0) (77,3) (67,7)
Net working capital 40,4 37,8 40,9 50,2
Other receivables 7,1 7,6 7,7 6,7
Other payables (26,1) (32,2) (53,9) (85,9)
Net corporate income tax items (18,8) (1,0) 0,3 (7,3)
Employees Leaving Indemnity (13,1) (12,5) (13,1) (13,3)
Provisions (11,1) (8,5) (7,3) (6,0)
Deferred taxes (1) (109,1) (88,7) (91,9) (90,0)
Net Invested Capital 1.092,7 1.105,6 1.067,4 1.030,3
IFRS Net Debt (2) 487,6 536,8 523,4 474,2
Group Equity 605,1 568,8 543,9 556,0
Total Sources 1.092,7 1.105,6 1.067,4 1.030,3
Balance Sheet
Source: Company Information; for further details refer to Cerved Information Solutions S.p.A. Annual and Quarterly Reports (1) Non cash item; (2) Net of capitalized financing fees

34
€m 2014 2015 2016 2017
Adjusted EBITDA 160,1 170,8 180,0 187,3
Net Capex (28,2) (31,6) (33,5) (38,9)
Adjusted EBITDA-Capex 131,9 139,1 146,5 148,4
as % of Adjusted EBITDA 82% 81% 81% 79%
Cash change in Net Working Capital 8,2 3,0 (4,6) (8,9)
Change in other assets / liabilities (13,9) (6,0) 2,0 3,0
Operating Cash Flow 126,2 136,1 144,0 142,6
Interests paid (51,7) (40,3) (29,2) (16,3)
Cash taxes (24,1) (40,2) (27,3) (22,5)
Non recurring items 1) (3,4) (3,2) (8,8) (9,2)
Cash Flow (before debt and equity movements) 46,9 52,3 78,7 94,6
Net Div idends 1,0 (40,1) (44,4) (47,8)
Acquisitions / deferred payments / earnout (20,9) (23,5) (27,9) (2,4)
IPO Capital Increase (net of IPO costs) 220,2 - - -
Other (0,1) (1,1) - -
IPO debt drawdown / (repayment) (254,5) - - -
"Forward-Start" Refinancing and "Amendment" - - (35,5) (2,9)
Net Cash Flow of the Period (7,5) (12,3) (29,1) 41,5
Cash Flow
Source: Company Information; for further details refer to Cerved Information Solutions S.p.A. Annual and Quarterly Reports (1) FY 2016 figure Includes €2.2m cash outflow for the new headquarters

35
€m 2014 2015 2016 2017
Reported Net Income 12,0 3,6 48,7 58,3
Non recurring income and expenses 4,5 3,8 6,5 7,3
Non recurring financial charges 10,1 52,4 0,5 (5,2)
Capitalized financing fees 3,4 2,9 2,2 2,5
PPA Amortization 42,9 45,8 47,4 32,8
IRS termination 1,0 - - -
Fair Value adjustment of options - - - 12,8
Fiscal Impact of above components (18,9) (28,4) (17,7) (10,4)
Adjustments 43,0 76,4 38,8 39,8
Impact of IRES change treatment - (11,5) - -
Non recurring income tax expenses - - 4,5 -
Adjusted Net Income 55,0 68,5 92,0 98,2
Adjusted Net Income Bridge
Source: Company Information; for further details refer to Cerved Information Solutions S.p.A. Annual and Quarterly Reports

Cerved Information Solutions S.p.A. Via dell’Unione Europea, 6A/6B –
20097 San Donato Milanese Tel. +39 02 77541
company.cerved.com


![Investment Outlook - AXYS Group · UBS: 6.70: Mkt Summary & Highlights ... [12% of TMT ex UTIN] closed unmoved WoW at Rs88.50, ... Investment Outlook ...](https://static.documents.pub/doc/80x56/5b0400ce7f8b9aba168cadf4/investment-outlook-axys-670-mkt-summary-highlights-12-of-tmt-ex-utin.jpg)


