An Introduction to Space Instrumentation, Edited by K. Oyama and C. Z. Cheng, 139–153. Retarding Potential Analyzer (RPA) for Sounding Rocket H. K. Fang 1,2 and C. Z Cheng 2,3 1 Department of Physics, National Cheng Kung University, No. 1 Ta-Hsueh Rd., Tainan 70101, Taiwan 2 Plasma and Space Science Center, National Cheng Kung University, No. 1 Ta-Hsueh Rd., Tainan 70101, Taiwan 3 Institute of Space and Plasma Sciences, National Cheng Kung University, No. 1 Ta-Hsueh Rd., Tainan 70101, Taiwan Problems associated with Retarding Potential Analyzer (RPA), which can be used to measure ion tempera- ture/and density in the lower E region where ion temperature is 200–300 K, are discussed. Two major factors which need to be taken care of to get accurate ion temperature of extremely low values are the effect of mesh size of the grids to be used and the effect of electrode contamination. An electrode baking and vacuum sealing mechanisms are designed to keep the electrode surface clean. The effect of mesh sizes on the calculation of ion temperature is discussed by using simulation studies as well as laboratory experiments. The study suggests that the uniformity of the electric field in the RPA sensor is critical. The manuscript describes the principle of the RPA, the effect of the mesh size using computer simulation studies, and the mechanical design of the sensor sealing to remove electrode contamination. Key words: Lower ionosphere, ion temperature, electrode contamination, mesh size effect. 1. Introduction Retarding Potential Analyzer (RPA) or Ion Trap, which can measure the ion temperature (T i ), the ion composition and density ( N i ) of individual ion species in the ionosphere, is one of the powerful tools to measure ionospheric parame- ters. Accordingly RPA has been flown in many low earth or- biting (LEO) satellites such as OGO 6 (Hanson et al., 1970), Atmosphere explorer (Hanson et al., 1973), Dynamic Ex- plore (Hanson et al., 1993), FORMOSAT 1 (Chao and Su, 1999, 2000; Chao et al., 2003), and DMSP (Defence Mete- orologiacal Satellite Program) satellites which routinely in- stalled Retarding Potential Analyzer (Bankov et al., 2009). RPA was also installed in Pioneer Venus Orbitor (Knud- sen et al., 1979), Viking 1 and 2 Mars landers (Hanson and Mantas, 1988). Although RPA is useful for satellite measurements, RPA has not been flown in sounding rockets frequently (Minami and Takeya, 1982). The reason is that RPA makes use of the satellite velocity (7–8 km/sec), which is usually much higher than the ion thermal velocity except for hydrogen ions. However, the velocity of the rocket (1–2 km/sec) is much slower than the satellite velocity. The ram direction speed, which is needed to perform reliable T i measurement, changes during the rocket flight, and therefore the data anal- ysis needs information on the rocket attitude with respect to the rocket motion. Another reason why RPA was not used for sounding rocket experiments very often is that the ion temperature in the height range where the rocket can survey (100–300 km) is less than 1/10 of the T i value in the satellite altitude. In order to measure T i of 200 K at the height of 100 km with enough accuracy, three factors need to be taken into ac- count. One factor is the electrode contamination. Because T i is very low (∼0.02 eV), the effect of electrode contam- Copyright c TERRAPUB, 2013. ination becomes much more serious at the rocket altitude than at the satellite altitude, and without doubt, the elec- trodes need to be free from the contamination. Another fac- tor is the frequency response of the amplifier. The rocket moves in the ionosphere with a velocity of 1–2 km. If we need to get 1 km height resolution, we need to sweep the operation voltage in 1 second. Because the sounding rocket usually has a spin rate of 1–3 Hz, the signal from RPA might be modulated by the rocket spin. Accordingly the voltage sweeping rate needs to be higher than 1 Hz to avoid the spin modulation of the RPA signal. (Even though RPA is formed symmetric and located at the front of rockets, the spin rate is still an important issue, considering the instabilities and precession motion while rocket flight.) Thus, RPA needs to pick up very small current (10 −9 − 10 −11 A) with high fre- quency response of 5–10 Hz. This constraint requires spe- cial attention to the electronic circuit design. The third fac- tor is the size of the meshes which are used for the voltage grids, which determines the uniformity of the electric field inside the sensor. In this manuscript we mainly discuss the problems associated with the electrode contamination and mesh of the electrodes. Then, we describe future tasks that need to be pursued. 2. Principle of RPA Measurement The DC Langmuir probe collects both ion and electron currents, and therefore T i cannot be measured by the DC Langmuir probe. To measure T i , we need to pick up only the ion current from the ambient plasma. In order to sepa- rate the ion current from the ambient plasma, basically we have two options: (1) we first repel electrons by a grid mesh with a sufficient negative voltage with respect to the plasma potential, and measure the ion current by changing the col- lector voltage, (2) we sweep the grid voltage, and the col- lector is biased negatively to repel electrons. However, only two electrodes (one grid and one collector) cannot provide accurate measurement due to three reasons. One reason is 139
Transcript
An Introduction to Space Instrumentation,Edited by K. Oyama and C. Z. Cheng, 139–153.
Retarding Potential Analyzer (RPA) for Sounding Rocket
H. K. Fang1,2 and C. Z Cheng2,3
1Department of Physics, National Cheng Kung University, No. 1 Ta-Hsueh Rd., Tainan 70101, Taiwan2Plasma and Space Science Center, National Cheng Kung University, No. 1 Ta-Hsueh Rd., Tainan 70101, Taiwan
3Institute of Space and Plasma Sciences, National Cheng Kung University, No. 1 Ta-Hsueh Rd., Tainan 70101, Taiwan
Problems associated with Retarding Potential Analyzer (RPA), which can be used to measure ion tempera-ture/and density in the lower E region where ion temperature is 200–300 K, are discussed. Two major factorswhich need to be taken care of to get accurate ion temperature of extremely low values are the effect of meshsize of the grids to be used and the effect of electrode contamination. An electrode baking and vacuum sealingmechanisms are designed to keep the electrode surface clean. The effect of mesh sizes on the calculation of iontemperature is discussed by using simulation studies as well as laboratory experiments. The study suggests thatthe uniformity of the electric field in the RPA sensor is critical. The manuscript describes the principle of theRPA, the effect of the mesh size using computer simulation studies, and the mechanical design of the sensorsealing to remove electrode contamination.Key words: Lower ionosphere, ion temperature, electrode contamination, mesh size effect.
1. IntroductionRetarding Potential Analyzer (RPA) or Ion Trap, which
can measure the ion temperature (Ti ), the ion compositionand density (Ni ) of individual ion species in the ionosphere,is one of the powerful tools to measure ionospheric parame-ters. Accordingly RPA has been flown in many low earth or-biting (LEO) satellites such as OGO 6 (Hanson et al., 1970),Atmosphere explorer (Hanson et al., 1973), Dynamic Ex-plore (Hanson et al., 1993), FORMOSAT 1 (Chao and Su,1999, 2000; Chao et al., 2003), and DMSP (Defence Mete-orologiacal Satellite Program) satellites which routinely in-stalled Retarding Potential Analyzer (Bankov et al., 2009).RPA was also installed in Pioneer Venus Orbitor (Knud-sen et al., 1979), Viking 1 and 2 Mars landers (Hanson andMantas, 1988).
Although RPA is useful for satellite measurements, RPAhas not been flown in sounding rockets frequently (Minamiand Takeya, 1982). The reason is that RPA makes use ofthe satellite velocity (7–8 km/sec), which is usually muchhigher than the ion thermal velocity except for hydrogenions. However, the velocity of the rocket (1–2 km/sec) ismuch slower than the satellite velocity. The ram directionspeed, which is needed to perform reliable Ti measurement,changes during the rocket flight, and therefore the data anal-ysis needs information on the rocket attitude with respect tothe rocket motion. Another reason why RPA was not usedfor sounding rocket experiments very often is that the iontemperature in the height range where the rocket can survey(100–300 km) is less than 1/10 of the Ti value in the satellitealtitude.
In order to measure Ti of 200 K at the height of 100 kmwith enough accuracy, three factors need to be taken into ac-count. One factor is the electrode contamination. BecauseTi is very low (∼0.02 eV), the effect of electrode contam-
ination becomes much more serious at the rocket altitudethan at the satellite altitude, and without doubt, the elec-trodes need to be free from the contamination. Another fac-tor is the frequency response of the amplifier. The rocketmoves in the ionosphere with a velocity of 1–2 km. If weneed to get 1 km height resolution, we need to sweep theoperation voltage in 1 second. Because the sounding rocketusually has a spin rate of 1–3 Hz, the signal from RPA mightbe modulated by the rocket spin. Accordingly the voltagesweeping rate needs to be higher than 1 Hz to avoid the spinmodulation of the RPA signal. (Even though RPA is formedsymmetric and located at the front of rockets, the spin rateis still an important issue, considering the instabilities andprecession motion while rocket flight.) Thus, RPA needs topick up very small current (10−9 − 10−11 A) with high fre-quency response of 5–10 Hz. This constraint requires spe-cial attention to the electronic circuit design. The third fac-tor is the size of the meshes which are used for the voltagegrids, which determines the uniformity of the electric fieldinside the sensor. In this manuscript we mainly discuss theproblems associated with the electrode contamination andmesh of the electrodes. Then, we describe future tasks thatneed to be pursued.
2. Principle of RPA MeasurementThe DC Langmuir probe collects both ion and electron
currents, and therefore Ti cannot be measured by the DCLangmuir probe. To measure Ti , we need to pick up onlythe ion current from the ambient plasma. In order to sepa-rate the ion current from the ambient plasma, basically wehave two options: (1) we first repel electrons by a grid meshwith a sufficient negative voltage with respect to the plasmapotential, and measure the ion current by changing the col-lector voltage, (2) we sweep the grid voltage, and the col-lector is biased negatively to repel electrons. However, onlytwo electrodes (one grid and one collector) cannot provideaccurate measurement due to three reasons. One reason is
139
140 H. K. FANG AND C. Z CHENG: RETARDING POTENTIAL ANALYZER (RPA) FOR SOUNDING ROCKET
Fig. 1. Principle of a planar gridded RPA and its operation potential profile.
that the secondary electron current from the collector is usu-ally added to the ion current and it is sometimes larger thanor comparable with the true ion current. Another reason isthat the sweeping voltage which penetrates into the plasmainfluences on the measurement of other parameters. Thethird reason is that one single mesh cannot guarantee uni-form electric field inside the sensor.
In order to overcome the difficulties which spoil the mea-surement accuracies as described above, the RPA sensorneeds to be composed of several stainless steel meshes andone stainless steel collector. The reason why we choosestainless steel for electrodes is because of its ability to pre-vent oxidized. An illustration of the RPA sensor is shownin Fig. 1 where G1∼G4 indicate four different meshes anddifferent potentials are applied to these meshes. In the idealcase, the potential is uniform on the mesh to allow ionspenetrating though. Ions, which are selected, will be col-lected on the current collector (C). In reality, the potentialon the meshes is not uniform because of the gap in the finemesh structure. To form a more uniform electric field themesh should have thinner pinholes or more grids, However,this will decrease the particle transparency and results in asmaller collected current. So we would better use as fewerpinholes as possible and try to form a uniform field at themost needed meshes in the sensor. A detailed discussion ofthe effects of the meshes is given in Section 4.
The ion flux measured by the collector at different re-tarding potentials (Va) generates a current signals (IC ). Themeasured IC − Va curve is a function of the ion parameters(Ti , ni , vD), where ni is the ion density, vD is the bulk ionflow velocity, and under some assumptions and by curvefittings, the ion parameters can be obtained.
As shown in Fig. 2, the y-z coordinate plane is chosenas the sensor entrance opening plane and the x-axis pointsto the third direction to form a rectangular coordinate. Ifthe ambient ions have a drift-Maxwellian distribution witha bulk flow velocity vD , and flow into the sensor openingfrom an angle θi , then the ion current flowing into the sensorcan be represented as:
IC(Va) = eηSni
∫ ∞
−∞
∫ ∞
−∞
∫ ∞
Cvx f (�v)dvx dvydvz (1)
where S is the surface area of the sensor opening, e is the
Fig. 2. Illustration of the flowing of ions into the sensor.
ion charge and η is the grid transparency, and vc is thecritical velocity for ions to penetrate through the mesh atthe retarding potential Va and is given by
e(Va − VS) = 1
2miv
2C (2)
where VS is the sheath potential, and mi is the ion mass.Note that in Eq. (1) we have neglected effects of the meshgeometry, the non-uniform potential field on the meshes,the ion acceleration by the potential inside the sensor, andthe ion detention in the sensor, etc. This integral representsthe ion flux seen by the sensor in the x-direction (normal tothe mesh plane). To evaluate Eq. (1) we consider the ionswith a normalized drift-Maxwellian distribution functiongiven by
f (�v) = α exp{−β[(vx − vD cos θi )
2
+(vy − vD sin θi )2 + v2
z ]}
where α = (mi/2πkTi )3/2, β = mi/2kTi , and vD is the ion
drift velocity. Then, the integral in Eq. (1) can be carriedout and the ion current is given by
IC(Va) = eηSni
{vD cos θi
2
[1 + er f
(√mi
2kTi
(vD cos θi −
√2e(Va − VS)
mi
))]+
√kTi
2πmi
exp
−
√
mi
2kTi
(vD cos θi −
√2e(Va − VS)
mi
)2
(3)
H. K. FANG AND C. Z CHENG: RETARDING POTENTIAL ANALYZER (RPA) FOR SOUNDING ROCKET 141
Fig. 3. Characteristics of I–V curves at different ion temperatures (Ti ).
Fig. 4. Characteristics of I–V curves at different ion drift velocities (vD).
Fig. 5. Characteristics of I–V curves at different ion incident angles (θi ).
where er f indicates the error function. For ion measure-ments on sounding rockets, several parameters in Eq. (3)need to be measured by instruments. The particle incidentangle θi can be obtained by using the sun sensor and themagnetometer. The rocket velocity vR can be calculatedfrom the rocket trajectory which is obtained by the ground-based radar. Parameters such as the sensor entrance surfacearea S and the mesh transparency η should be checked in
laboratory experiments. By putting these numbers, the ionparameters Ti and ni at different heights in the ionospherecan be obtained by curve fittings. (Fitting methods will bedescribed later.)
An example of the relation between the applied retard-ing potential (Va) and the ion current at collector (Ic) withdifferent ion temperatures is plotted in Fig. 3, assuming themass of Nitrogen ions (N+
2 ).
142 H. K. FANG AND C. Z CHENG: RETARDING POTENTIAL ANALYZER (RPA) FOR SOUNDING ROCKET
Fig. 6. RPA instrument test arrangements in SPOC.
Equation (3) suggests that when the ion temperature (Ti )increases, the width and height of the exponential partwill be larger and the slope of the error function will besmoother. So as Ti increases, the I–V curve becomessmoother as shown in Fig. 3, and more ions are measuredas the retarding potential is lower. When the ion drift ve-locity (vD) increases, the center of the exponential part andthe deepest position of the error function part will shift to-wards higher Va region. When the ion drift velocity is high,we need to apply higher retarding potential to prevent ionsfrom penetrating in. Higher drift velocity also causes largerion flux measured at the collector. The I–V curve at differ-ent drift velocity (vD) is plotted in Fig. 4.
For ions flowing into the sensor from different incidentangles, the flow velocity in the normal direction is changed.The I–V curves at different incident angles (θi ) are plottedin Fig. 5.
3. Derivation of Ion ParametersTo obtain the ion parameters (Ti , ni , vD), we can fit the
measured I–V curve by the theoretical I–V curve derived byassuming that the ions have a drift-Maxwellian distribution.However, we can obtain the ion distribution directly fromthe measured I–V curves. Eq. (1) can be rewritten as
IC(Va) = eηSni
∫ ∞
−∞
∫ ∞
−∞
∫ ∞
Cvx f (�v)dvx dvydvz
= eηSni
∫ ∞
vC
f (vx )vx dvx
= 2eηSni
mi
∫ ∞
EC
f (Ex )d Ex
= 2e2ηSni
mi
∫ ∞
Va−VS
f (Va − VS)dVa . (4)
Then, the 1-D ion energy distribution function can be ob-tained from the measured I–V curve by differentiating Eq.
(4):
d IC
dVa= 2e2ηs Ni
mi
d
dVa
∫ ∞
Va−VS
f (Va − VS)dVa
= −2e2ηs Ni
mif (Va − VS). (5)
Or, the measured ion energy distribution function is givenby
f (Va − VS)experiment = − mi
2e2ηSni
d IC(Va)
dVa. (6)
It is also easier to fit the measured distribution by a 1-D drift-Maxwellian distribution function or in combina-tion with a high energy tail distribution. The 1-D drift-Maxwellian distribution function can be written in terms ofthe applied retarding potential by
f (Va − VS)theory
=√
mi
2πkTiexp
− mi
2πkTi
(√2e(Va − VS)
mi− vD
)2 .
(7)
By fitting the measured distribution function (Eq. (6)) witha 1-D drift-Maxwellian distribution (Eq. (7)), we can get theion parameters Ti and vD .
To determine the ion density ni , we compare the maxi-mum value of the ion distribution function given by Eqs. (6)and (7). The maximum value of these two formulas shouldbe the same if these two distribution functions are the same.Accordingly, we obtain
f (Va − VS)theory,Max.
=√
mi
2πkTi= − mi
2e2ηSni
(d IC(Va)
dVa
)Max.
. (8)
H. K. FANG AND C. Z CHENG: RETARDING POTENTIAL ANALYZER (RPA) FOR SOUNDING ROCKET 143
Fig. 7. Plasma emitter in SPOC, and the background neutral gases can be Ar or N2.
The ion density can then be calculated from the above equa-tion by
ni = − 1
e2ηS
√πmi kTi
2
(d IC(Va)
dVa
)Max.
. (9)
4. Laboratory ExperimentsIn order to check the performance (e.g. gain of ampli-
fiers, system stray capacitance effect, noise level . . . etc.)of the RPA, we conducted laboratory experiments by usingthe Space Plasma Operation Chamber (SPOC) at the Plasmaand Space Science Center, National Cheng Kung Univer-sity. The dimension of the chamber is 2 m in diameter and 3m in length, and the pressure inside the chamber reaches be-low 10−6 Torr in a day without loading with one cryogenicpump and one turbo-molecular pump. The initial pump-ing is done by an oil-free mechanical pump, which meansthat experimenters do not need to worry contamination due
Fig. 8. An I–V curve measured by the RPA system in SPOC.
144 H. K. FANG AND C. Z CHENG: RETARDING POTENTIAL ANALYZER (RPA) FOR SOUNDING ROCKET
Fig. 9. Flow chart of the data analysis method (differentiation of measured I–V curves).
Fig. 10. Examples of the Langmuir probe measurement.
to the pumping system. The chamber is the second largestspace plasma simulation chamber among Asian countriesand has the highest performance in all aspects such as stableplasma production as well as the stability of vacuum pres-sure. Two back diffusion type plasma sources are attachedat both ends of the chamber. The plasma sources can pro-duce plasma conditions similar to the ionospheric plasmawith density of 104–106 els/cc, and electron temperature of1000–3000 K. In the chamber there is a sensor moving sys-tem that can move instruments along the chamber axis aswell as vertically by using two motors. The movement inthe vertical direction is done by flexible metal tether. Mo-tions for both directions are computer controlled, and thelocation of the sensor can be either programmed or man-ually controlled. The maximum weight of the sensors tobe hung at the end of the wire is around 500 gm. A neutralmass spectrometer is also attached to monitor the neural gas
residue.The chamber has a gas reservoir which can reduce the
pressure from the original gas container cylinders. Twogas (normally nitrogen and oxygen) injection is availableat the same time. The pressure inside the chamber is wellcontrolled by the mass flow meter.4.1 Experimental setup in SPOC
We assembled RPA instrument in the SPOC and the ex-perimental setup is shown in Fig. 6. The RPA is placed ona rotation platform to change its look angle with respect tothe plasma emitter. The pre-amplifier and the control boardare put in metal boxes located right behind the RPA sensor.Outside the chamber is a data acquisition board similar tothe one on rockets, with the same sampling rate and dataresolution.
The plasma emitter used for plasma production in thischamber is illustrated in Fig. 7. The plasma is produced
H. K. FANG AND C. Z CHENG: RETARDING POTENTIAL ANALYZER (RPA) FOR SOUNDING ROCKET 145
Fig. 11. The measured ion temperature and ion density at RPA different look-angle with respect to the plasma emitter in the Space Plasma OperationChamber.
Fig. 12. The sheath potential VS and the ion bulk drift velocity vD in the measured ion energy distribution function.
Fig. 13. Relation between the ion drift velocity vD and the plasma sheath potential VS , and VS and the fitted ion temperature Ti .
based on the principle of “back-diffusion plasma emitter.”By heating up the Nickel filaments with painted BaCO3,thermal electrons with Te ∼ 1000–1100 K (∼melting tem-perature of Nickels) are emitted. Those electrons are ac-celerated by the electric potentials applied on a metal gridand a plate, and collide with neutral particles (N2 or Ar) inthe region between the grid and the plate. Then, the valenceelectrons of neutral particles are separated from the neutralsby high energy electron bombardments, and ions are gener-ated. Then, ions are accelerated by the electric field fromthe difference of electric potentials applied on the grid andthe plate, and they fly into the chamber and then electronsfollow the ions into the chamber. Then, the chamber is filledwith ions (N+
2 or Ar+), electrons and neutral particles (in the
plasma generation period, the background neutral pressureis ∼ 2 × 10⁻⁴ Torr), forming an environment similar to theEarth lower altitude ionosphere. (However, there is surelyplasma beam component existing on the direction of plasmaemitters in the chamber.)4.2 Experimental results and data analysis methods
An example of the measured I–V curve by the RPA sys-tem is shown in Fig. 8, in which the red points are the mea-sured data. It is clear that there are noises due to the elec-tronics or other factors. To obtain the ion energy distribu-tion function by differentiating the measured current (accu-mulated ion flux), we need to remove the noises.
Figure 9 shows the flow chart of the data analysis for datanoise reduction and data processing results at each step. To
146 H. K. FANG AND C. Z CHENG: RETARDING POTENTIAL ANALYZER (RPA) FOR SOUNDING ROCKET
Fig. 14. Different grid sizes of the RPA meshes.
Fig. 15. The RPA sensor with different meshes.
remove the noises, we first perform a band-pass filtering ofthe measured data to remove high frequency noises (thosenoises are amplified most in the differentiation). Then weperform a cubic spline fit to the filtered I–V curve, andthe fitted spline function is differentiated to obtain the ionenergy distribution function, which is then fitted with adrift-Maxwellian distribution.
In Fig. 9 the left bottom panel shows an example of thefiltered ion current, and the right bottom panel shows themeasured ion energy distribution function (red curve) andthe fitted result (black-dotted curve). Following the discus-sion above, the measured ion energy distribution functionis first shifted by a plasma sheath potential energy (eVS),which is estimated from the Langmuir probe measurement,and then fitted with a drift-Maxwellian. The fitted result ofthis example is Ti ∼ 310 K and vD ∼ 2250 m/s. For thechamber plasmas, since the neutral density is much higherthan the ion density, Ti should be the same as the neu-tral temperature (∼room temperature). From the Langmuirprobe (with same electrode material as the RPA) measureddata shown in Fig. 10, the plasma potential is Vplasma ∼ 2.4V and the floating potential is V f ∼ 1.7 V, so the sheath
potential that accelerates ions (Vplasma − V f ) is about 0.7V. This corresponds to a drift velocity of 2200 m/s for N+
2ions (miv
2D/2 = e(Vplasma − V f )), which is about the same
as the fitted vD value. This 2250 m/s drift is caused by thepotential of the sheath around the RPA. (The potential dif-ferences in the region between “G1” and “sheath” in Fig.1.) It is to be noted that for measurements on rockets, vD
is also caused by the rocket ram velocity in addition to theacceleration by the sheath potential.
Since ions can be either accelerated or decelerated in thesensor due to many factors such as the potential differencebetween the floating potential V f and the ground, the po-tential difference between the ground and the collector, thenon-uniform grids on the meshes, the charge effects fromion detention, etc. Those factors can cause a shift in themeasured ion distribution function and thus measurementerrors. For example, because the sheath expansion effectcan cause the mesh grid potential to leak, the measured I–Vcurve is not saturated even when the retarding potential issmall as shown in Fig. 8. This makes the left part of themeasured energy distribution function shown in the rightbottom panel in Fig. 9 not well-fitted. So, we only fit the
H. K. FANG AND C. Z CHENG: RETARDING POTENTIAL ANALYZER (RPA) FOR SOUNDING ROCKET 147
Fig. 16. The RPA Measurement results by using meshes of different sizes.
right part of the distribution function (the “thermal” part)and obtain Ti . The sheath expansion effect as well as the po-tential leak effects caused by mesh grids will be discussedin details later.
Following the data analysis method described above, themeasured ion temperature and the ion density at differentlook-angle with respect to the plasma emitter in the SpacePlasma Operation Chamber is shown in Fig. 11.
When the RPA sensor opening is facing the plasma emit-ter (look-angle = 0 degree), both the ion temperature andthe ion density become larger. It seems reasonable thatthe ion density is larger when the RPA faces the emitter,considering the wake effect caused by the sensor structure.The measured ion temperature is also higher when the RPAsensor opening faces the emitter. This might come fromthe high energy tail of ion energy distribution function inchamber beam component. Eventually the ions diffuse intothe whole chamber, and they will be at the same tempera-ture as the neutral particles at the room temperature. Notethat when the RPA sensor opening faces the side-wall (look-angle = −90 degree), the measured Ti is close to the room
Fig. 17. The fitted Ti and vD values versus the plasma density for differentmesh size.
temperature.The asymmetry of the measured Ti on the look-angle may
come from two reasons: (1) the plasma condition is changedafter the IEA rotates from −90 degree to 90 degree; (2) theasymmetry of plasma condition caused by the experimentalarrangements (the RPA structure, the chamber asymmetries,etc.).4.3 Further considerations and discussions
In this Section, we will discuss the sources of errorsof the measured ion parameters from the curve fitting. A1-D drift Maxwellian energy distribution function is usedto fit the measured ion energy distribution, which is ex-pressed by Eq. (7). The unknown parameters in this for-mula are Vs , vD and Ti . To obtain Ti by curve fitting, wefirst determine vD from the Langmuir probe measurements(miv
2D/2 = e(Vplasma − V f )), then we decide the sheath po-
tential VS , and then fit the measured ion energy distributionto get Ti . An example the fitted ion parameters are sensi-tive to the choice of VS value is shown in Fig. 12. The leftcurve in Fig. 12 shows an example of the drift-Maxwelliandistribution versus the applied retarding potential that is ob-tained by choosing VS = 0, Ti = 150 K and vD = 3500m/s. However, if we fit this energy distribution function byassuming that the plasma sheath potential is Vs = 1 V, weget 301 ± 1 K for Ti and 2332 ± 0.5 m/s for vD , respec-tively. This computer calculation shows that the fitted ionparameters are quite sensitive to the sheath potential VS , andtherefore we need to know the difference between the am-
148 H. K. FANG AND C. Z CHENG: RETARDING POTENTIAL ANALYZER (RPA) FOR SOUNDING ROCKET
Fig. 18. The RPA system overview for sounding rocket mission.
Fig. 19. The RPA sensor flight model.
bient plasma potential and the floating potential of the firstgrid accurately.
Figure 13 shows vD versus VS , and Ti versus VS . Thus,we can obtain Ti by fitting the measured data in Fig. 12 withdifferent assumed values of vD .
From Fig. 13, when vD has an error of 500 m/s (whichis equivalent to an error in “Vplasma − V f ” of about 0.4V measured by the Langmuir Probe), the fitted Ti error isabout 80 K.
Another important feature should be noted in Fig. 13 isthat the fitted Ti and vD have opposite tendency. In otherwords, if we get higher fitted vD values (e.g. due to plasmaand floating measurement error), the fitted Ti will be lower.
We will see this effect clearly in the experimental resultspresented later.
5. Effect of Grid Mesh on Ti
5.1 Experimental arrangementsThe experimental measurements by the RPA are per-
formed to investigate the grid effects. We have used fourdifferent mesh sizes and performed ion measurements inthe SPOC. Figure 14 shows the photos and dimensions ofmeshes with different sizes. Those meshes are manufac-tured by photo-etching processes with a tolerance of ∼0.02mm.
Using the mesh structures shown in Fig. 15, we conduct
H. K. FANG AND C. Z CHENG: RETARDING POTENTIAL ANALYZER (RPA) FOR SOUNDING ROCKET 149
Fig. 20. The RPA pre-amplifier circuit diagram.
Fig. 21. The RPA second-stage amplifier circuit diagram.
RPA measurements with two different sizes of mesh at thesame time in the SPOC. The experimental arrangement issimilar to the one shown in Fig. 6, and the sensors are placedon a rotation platform, and the circuit (including amplifiersand noise filters) is placed in a metal box located behind thesensor (Fig. 15).
Since we can only put two RPAs in the chamber at thesame time, the RPA with mesh size 1 (the smallest mesh) ischosen as the reference, and we use a different size of meshin the other RPA sensor in each experiment. Thus, we willconduct three experiments with mesh sizes 1 and 2, meshsizes 1 and 3, and mesh sizes 1 and 4, respectively.5.2 Experimental results
The measured I–V curves with different mesh sizes atsimilar plasma conditions are shown in Fig. 16. The greenand yellow-dashed curves in each panel are measured withmesh size 1 (smallest), and the red and blue-dashed curvesin the top, middle and bottom panels are measured withmesh sizes 2, 3 and 4, respectively. Although the results inthese three figures are not measured in the same experimentperiod, but the ion saturation current (at retarding potential
= 0 V) measured by the RPA with mesh size 1 in thesethree panels are quite similar, and thus the ion density isalso similar in these three experimental measurements.
In Fig. 16, we can see that as the mesh grid size increases,the measured ion current (proportional to the incident ionfluxes) also increases. In comparing measurements withmesh sizes 1 and 4, there’s about a factor of two differ-ences in the measured ion fluxes. The calculated opticaltransparency for mesh size 1 and 4 are 0.59 (0.95) and 0.77(0.955), respectively. Although the ion optical transparencyis higher for larger sized meshes, the main reason for themeasured ion flux differences may not just come from themesh transparency. The main reason of the difference inthe measured ion fluxes may be due to the mesh alignmentdifficulty for meshes with smaller grid size. Besides thedifficulty in manufacturing meshes with uniform grid forsmaller grid size, it is also harder to align two meshes be-cause of the grid differences between the smaller meshes.The orbit transparency decreases as a result of mesh non-alignments. Furthermore, the ion lensing effects may alsobecome more serious for meshes with smaller grid-size be-
150 H. K. FANG AND C. Z CHENG: RETARDING POTENTIAL ANALYZER (RPA) FOR SOUNDING ROCKET
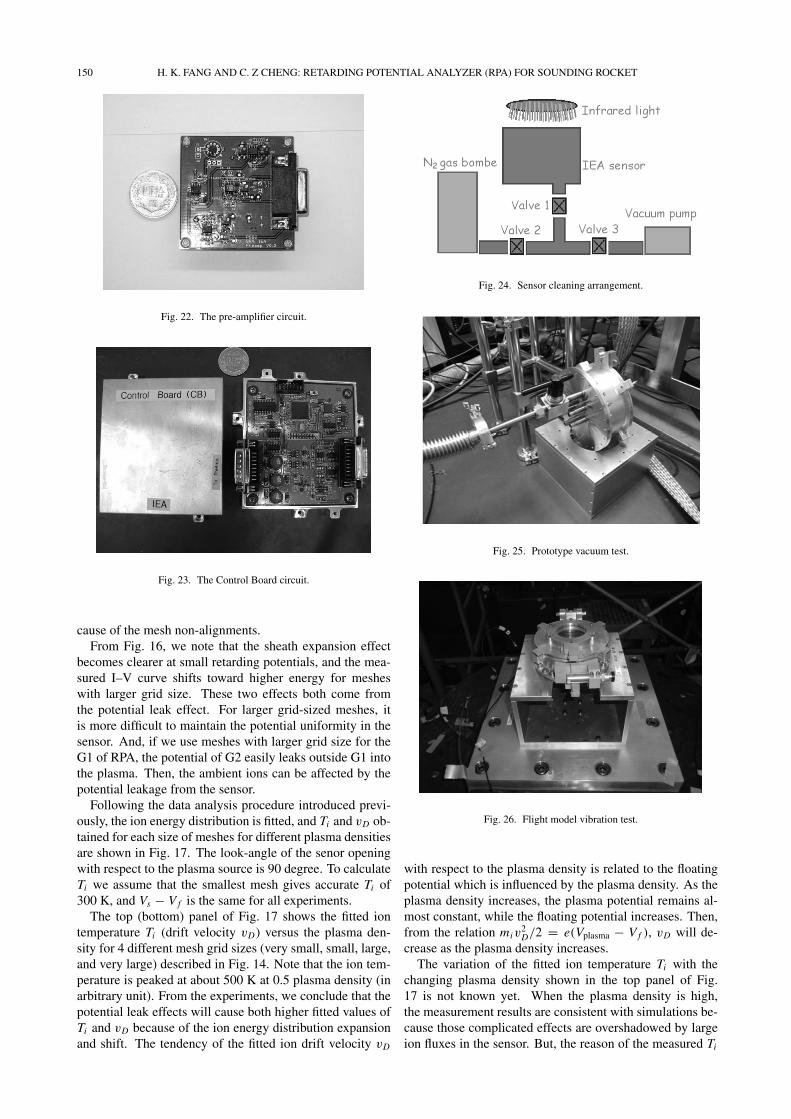
Fig. 22. The pre-amplifier circuit.
Fig. 23. The Control Board circuit.
cause of the mesh non-alignments.From Fig. 16, we note that the sheath expansion effect
becomes clearer at small retarding potentials, and the mea-sured I–V curve shifts toward higher energy for mesheswith larger grid size. These two effects both come fromthe potential leak effect. For larger grid-sized meshes, itis more difficult to maintain the potential uniformity in thesensor. And, if we use meshes with larger grid size for theG1 of RPA, the potential of G2 easily leaks outside G1 intothe plasma. Then, the ambient ions can be affected by thepotential leakage from the sensor.
Following the data analysis procedure introduced previ-ously, the ion energy distribution is fitted, and Ti and vD ob-tained for each size of meshes for different plasma densitiesare shown in Fig. 17. The look-angle of the senor openingwith respect to the plasma source is 90 degree. To calculateTi we assume that the smallest mesh gives accurate Ti of300 K, and Vs − V f is the same for all experiments.
The top (bottom) panel of Fig. 17 shows the fitted iontemperature Ti (drift velocity vD) versus the plasma den-sity for 4 different mesh grid sizes (very small, small, large,and very large) described in Fig. 14. Note that the ion tem-perature is peaked at about 500 K at 0.5 plasma density (inarbitrary unit). From the experiments, we conclude that thepotential leak effects will cause both higher fitted values ofTi and vD because of the ion energy distribution expansionand shift. The tendency of the fitted ion drift velocity vD
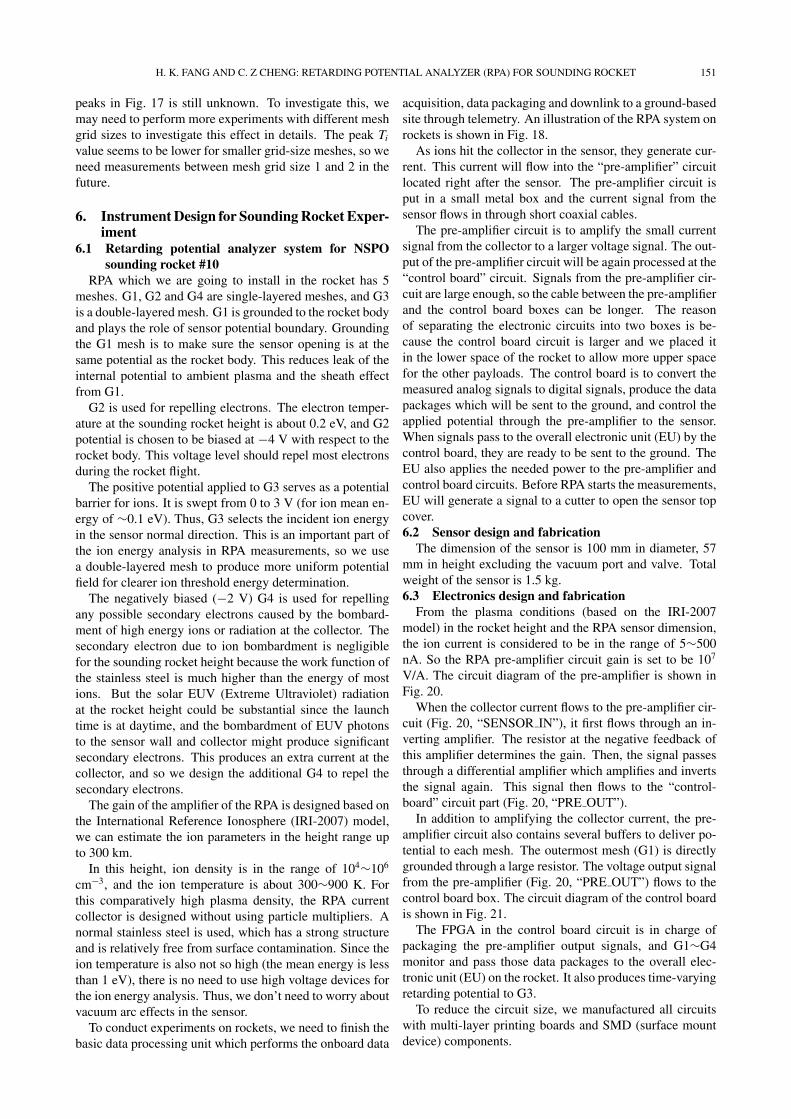
Fig. 24. Sensor cleaning arrangement.
Fig. 25. Prototype vacuum test.
Fig. 26. Flight model vibration test.
with respect to the plasma density is related to the floatingpotential which is influenced by the plasma density. As theplasma density increases, the plasma potential remains al-most constant, while the floating potential increases. Then,from the relation miv
2D/2 = e(Vplasma − V f ), vD will de-
crease as the plasma density increases.The variation of the fitted ion temperature Ti with the
changing plasma density shown in the top panel of Fig.17 is not known yet. When the plasma density is high,the measurement results are consistent with simulations be-cause those complicated effects are overshadowed by largeion fluxes in the sensor. But, the reason of the measured Ti
H. K. FANG AND C. Z CHENG: RETARDING POTENTIAL ANALYZER (RPA) FOR SOUNDING ROCKET 151
peaks in Fig. 17 is still unknown. To investigate this, wemay need to perform more experiments with different meshgrid sizes to investigate this effect in details. The peak Ti
value seems to be lower for smaller grid-size meshes, so weneed measurements between mesh grid size 1 and 2 in thefuture.
6. Instrument Design for Sounding Rocket Exper-iment
6.1 Retarding potential analyzer system for NSPOsounding rocket #10
RPA which we are going to install in the rocket has 5meshes. G1, G2 and G4 are single-layered meshes, and G3is a double-layered mesh. G1 is grounded to the rocket bodyand plays the role of sensor potential boundary. Groundingthe G1 mesh is to make sure the sensor opening is at thesame potential as the rocket body. This reduces leak of theinternal potential to ambient plasma and the sheath effectfrom G1.
G2 is used for repelling electrons. The electron temper-ature at the sounding rocket height is about 0.2 eV, and G2potential is chosen to be biased at −4 V with respect to therocket body. This voltage level should repel most electronsduring the rocket flight.
The positive potential applied to G3 serves as a potentialbarrier for ions. It is swept from 0 to 3 V (for ion mean en-ergy of ∼0.1 eV). Thus, G3 selects the incident ion energyin the sensor normal direction. This is an important part ofthe ion energy analysis in RPA measurements, so we usea double-layered mesh to produce more uniform potentialfield for clearer ion threshold energy determination.
The negatively biased (−2 V) G4 is used for repellingany possible secondary electrons caused by the bombard-ment of high energy ions or radiation at the collector. Thesecondary electron due to ion bombardment is negligiblefor the sounding rocket height because the work function ofthe stainless steel is much higher than the energy of mostions. But the solar EUV (Extreme Ultraviolet) radiationat the rocket height could be substantial since the launchtime is at daytime, and the bombardment of EUV photonsto the sensor wall and collector might produce significantsecondary electrons. This produces an extra current at thecollector, and so we design the additional G4 to repel thesecondary electrons.
The gain of the amplifier of the RPA is designed based onthe International Reference Ionosphere (IRI-2007) model,we can estimate the ion parameters in the height range upto 300 km.
In this height, ion density is in the range of 104∼106
cm−3, and the ion temperature is about 300∼900 K. Forthis comparatively high plasma density, the RPA currentcollector is designed without using particle multipliers. Anormal stainless steel is used, which has a strong structureand is relatively free from surface contamination. Since theion temperature is also not so high (the mean energy is lessthan 1 eV), there is no need to use high voltage devices forthe ion energy analysis. Thus, we don’t need to worry aboutvacuum arc effects in the sensor.
To conduct experiments on rockets, we need to finish thebasic data processing unit which performs the onboard data
acquisition, data packaging and downlink to a ground-basedsite through telemetry. An illustration of the RPA system onrockets is shown in Fig. 18.
As ions hit the collector in the sensor, they generate cur-rent. This current will flow into the “pre-amplifier” circuitlocated right after the sensor. The pre-amplifier circuit isput in a small metal box and the current signal from thesensor flows in through short coaxial cables.
The pre-amplifier circuit is to amplify the small currentsignal from the collector to a larger voltage signal. The out-put of the pre-amplifier circuit will be again processed at the“control board” circuit. Signals from the pre-amplifier cir-cuit are large enough, so the cable between the pre-amplifierand the control board boxes can be longer. The reasonof separating the electronic circuits into two boxes is be-cause the control board circuit is larger and we placed itin the lower space of the rocket to allow more upper spacefor the other payloads. The control board is to convert themeasured analog signals to digital signals, produce the datapackages which will be sent to the ground, and control theapplied potential through the pre-amplifier to the sensor.When signals pass to the overall electronic unit (EU) by thecontrol board, they are ready to be sent to the ground. TheEU also applies the needed power to the pre-amplifier andcontrol board circuits. Before RPA starts the measurements,EU will generate a signal to a cutter to open the sensor topcover.6.2 Sensor design and fabrication
The dimension of the sensor is 100 mm in diameter, 57mm in height excluding the vacuum port and valve. Totalweight of the sensor is 1.5 kg.6.3 Electronics design and fabrication
From the plasma conditions (based on the IRI-2007model) in the rocket height and the RPA sensor dimension,the ion current is considered to be in the range of 5∼500nA. So the RPA pre-amplifier circuit gain is set to be 107
V/A. The circuit diagram of the pre-amplifier is shown inFig. 20.
When the collector current flows to the pre-amplifier cir-cuit (Fig. 20, “SENSOR IN”), it first flows through an in-verting amplifier. The resistor at the negative feedback ofthis amplifier determines the gain. Then, the signal passesthrough a differential amplifier which amplifies and invertsthe signal again. This signal then flows to the “control-board” circuit part (Fig. 20, “PRE OUT”).
In addition to amplifying the collector current, the pre-amplifier circuit also contains several buffers to deliver po-tential to each mesh. The outermost mesh (G1) is directlygrounded through a large resistor. The voltage output signalfrom the pre-amplifier (Fig. 20, “PRE OUT”) flows to thecontrol board box. The circuit diagram of the control boardis shown in Fig. 21.
The FPGA in the control board circuit is in charge ofpackaging the pre-amplifier output signals, and G1∼G4monitor and pass those data packages to the overall elec-tronic unit (EU) on the rocket. It also produces time-varyingretarding potential to G3.
To reduce the circuit size, we manufactured all circuitswith multi-layer printing boards and SMD (surface mountdevice) components.
152 H. K. FANG AND C. Z CHENG: RETARDING POTENTIAL ANALYZER (RPA) FOR SOUNDING ROCKET
6.4 Additional technical considerations and environ-mental tests
The process of cleaning the RPA sensor is shown in Fig.24. An infrared light beam shines through the glass windowto the sensor top is used for evaporating the water moleculeson the collector and meshes. At the same time, the sensoris evacuated through the valves on the bottom. After thesensor is cleaned, dry N2 gas is injected into the sensor toabout 0.5 atm. pressures. The procedures are to open thevalve 1 and the valve 3, evacuate the sensor with infraredlight irradiation, then close the valve 3, open the valve2, and inject dry N2 gas, then close the valve 2 and thevalve 1, and finally the RPA sensor is cleaned and readyfor deployment.
To make sure that the sensor is maintained at 0.5 atm.pressure before deployment, a vacuum test is performed(Fig. 25). Since the rocket vibrates while launching, tomake sure that the sensor will not be broken under thisviolent vibration, a vibrational test is also performed (Fig.26).6.5 Future works
In the near future, more investigations of mesh trans-parency and mesh alignments should be done. Althoughmeshes with small grid sizes show better measurement ac-curacy, the small grid structure may produce rather seriousmesh structure effect. To eliminate this, we need to try somespecial mesh structures to conduct measurements.
Besides the discussion in Chapter 4, more simulationsand experiments are needed to investigate the grid effectsin more details of a “planar-gridded retarding potential an-alyzer”.
For the RPA measurements by using sounding rocketsduring daytime, the effects of the secondary electrons fromthe collector should also be carefully checked because thesolar EUV radiation produces the secondary electrons fromthe collector and the grid mesh in front of the collector.The check can be done by using a Deutrium lamp, whichis commercially available.
ReferencesAhnert, K. and M. Abel (2007) Numerical differentiation of experimental
data: Local versus global methods, Computer Physics Communications,177, 764–774.
Bankov, L., R. Heelis, M. Parrot, J.-J. Berthelier, P. Marinov, and A. Vas-sileva (2009) WN4 effect on longitudinal distribution of different ionspecies in the topside ionosphere at low latitudes by means of DEME-TER, DMSP-F13, DMSP-F15 data, Ann Geophys., 27, 2893–2902.
Bevington, P. R. (1969) Data Reduction and Error Analysis for the Physi-cal Sciences, McGraw-Hill Book Company.
Chao, C. K. and S.-Y. Su (1999) On accuracy of RPA measurements of ionfluxes, Adv. Space Res., 23, 8, 1537–1540.
Chao, C. K. and S.-Y. Su (2000) Charged particle motion inside the retard-ing potential analyzer, Physics of Plasmas, 7, 101.
Chao, C. K., S.-Y. Su, and H. C. Yeh (2003) Grid effects on the derived iontemperature and ram velocity from the simulated results of the retardingpotential analyzer data, Adv. Space Res., 32, 11, 2361–2366.
Chen, F. F. (1984) Introduction to plasma physics and controlled fusion, inPlasma Physics, 2nd ed., Vol. 1, Plenum Press.
Golden, P. D., E. J. Yadlowsky, and E. C. Whipper, Jr. (1973) Errors inion and electron temperature measurements due to grid plane poten-tial nonuniformities in retarding potential analyzers, J. Geophys. Res.,78(16), 2907–2916.
Hanke, M. and O. Scherzer (2001) Inverse problems light: Numericaldifferentiation, textitThe American Mathematical Monthly, 108, 6, 512–521.
Hanson, W. and G. Mantas (1988) Viking electron temperature measure-ments: Evidence for a magnetic field in the martian ionosphere, J. Geo-phys. Res., 93(A7), 7538–7544.
Hanson, W. B. and S. Sanatani (1973) Large ni gradients below the equa-torial F peak, J. Geophys. Res., 78, 7, 1167–1173.
Hanson, W. B., D. D. Mckibbin, and G. W. Sharp (1964) Some iono-spheric measurements with satellite-borne ion traps, textitJ. Geophys.Res., 69(13), 2747–2763.
Hanson, W. B., S. Sanatani, D. Zuccaro, and T. W. Flowerday (1970)Plasma measurements with the retarding potential analyzer on Ogo 6,J. Geophys. Res., 75(28), 5483–5501.
Hanson, W. B., D. R. Frame, and J. E. Midgley (1972) Errors in retardingpotential analyzers caused by nonuniformity of the grid-plane potential,J. Geophys. Res., 77(10), 1914–1922.
Hanson, W. B., D. R. Zuccaro, C. R. Lippincott, and S. Sanatani (1973)The retarding potential analyzer on atmosphere explorer, Radio Science,8, 4, 333–339.
Hanson, W. B., S. Sanatani, and J. H. Hoffman (1981) Ion sputtering fromsatellite surfaces, J. Geophys. Res., 86, 11350–11356.
Hanson, W. B., W. R. Coley, and R. A. Heelis (1993) A comparison ofin situ measurements of E and -VxB from dynamics explorer 2, J.Geophys. Res., 98(A12), 21501–21516.
Heelis, R. A. and W. B. Hanson (1988) Measurements of thermal ion driftvelocity and temperature using planar sensors, Measurement Techniquesin Space Plasmas: Particles, American Geophysical Union.
Hutchinson, I. H. (1987) Principles of Plasma Diagnostics, CambridgeUniversity Press.
International Reference Ionosphere—IRI-2007, CCMC, NASA.Klenzing, J. H., G. D. Earla, and R. A. Heelis (2008) Errors in ram velocity
and temperature measurements inferred from satellite-borne retardingpotential analyzers, Physics of Plasmas, 15, 6.
Klenzing, J. H., G. D. Earla, R. A. Heelis, and W. R. Coley (2009) Astatistical analysis of systematic errors in temperature and ram velocityestimates from satellite-borne retarding potential analyzers, Physics ofPlasmas, 16, 5.
Knudsen, W. C. (1966) Evaluation and demonstration of the use of retard-ing potential analyzers for measuring several ionospheric quantities, J.Geophys. Res., 71(19), 4669–4678.
Knudsen, W. C. (1992) Finite grid radius and thickness effects on retardingpotential analyzer measured suprathermal electron density and temper-ature, J. Geophys. Res., 97(A9), 13767–13775.
Knudsen, W. C., K. S Penner, R. C. Whiten, J. R. Spreiter, K. C. Miller,and V. Novak (1979) Thermal structure of major ion composition of theVenus ionosphere, first RPA experiments from Venus orbitor, Science,203, 757–763.
Marrese, C. M., N. Majumdar, J. Haas, G. Williams, L. B. King, and A.D. Gallimore (1997) Development of a single-orifice retarding potentialanalyzer for hall thruster plume characterization, International ElectricPropulsion Conference.
Mcclure, J. P., W. B. Hanson, and J. H. Hoffman (1977) Plasma bubblesand irregularities in the equatorial ionosphere, J. Geophys. Res., 82,2650–2656.
Minami. S. and Y. Takeya (1982) Ion temperature determination in theionosphere by retarding potential analyzer aboard sounding rocket, J.Geophys. Res., 87, 713–730.
Oyama, K.-I. (1976) A systematic investigation of several phenomenaassociated with contaminated Langmuir probes, Planet. Space Sci., 24,2, 183–190.
Oyama, K.-I. and K. Hirao (1976a) Application of glass-sealed Langmuirprobe to ionospheric study, Rev. Sci. Instr., 47, 101–107.
Oyama, K.-I. and K. Hirao (1976b) Evidence of a distorted energy distri-bution in ionospheric plasma, Planet. Space Sci., 24, 900–904.
Oyama, K.-I. and S. Kobyashi (1985) Effect of electrode contaminationupon measurement of solar wind, Jpn. J. Appl. Phys., 24, 793–794.
Oyama, K.-I., K. Hattori, and C. H. Lin (2008) Seismo-ionospheric GPSTEC anomalies observed before the 12 May 2002 Mw7.9 Wenchuanearthquake, J. Geophys. Res., 114.
Parker, L. W. and E. C. Whipple, Jr. (1970) Theory of spacecraft sheathstructure, potential, and velocity effects on ion measurements by trapsand mass spectrometers, J. Geophys. Res., 75, 25, 4720–4733.
Parks, G. K. (1995) Physics of Space Plasmas: An Introduction, WestviewPress.
Sanmartin, J. R. and O. Lopez-Rebollal (2000a) A correction to Whipple’slaw for ion-trap current, Spacecraft Charging Technology Conference.
Sanmartin, J. R. and O. Lopez-Rebollal (2000b) A new basic effects in
H. K. FANG AND C. Z CHENG: RETARDING POTENTIAL ANALYZER (RPA) FOR SOUNDING ROCKET 153
retarding potential analyzers, Physics of Plasmas, 7.Spirkin, A. and N. A. Gatsonis (2004) Unstructured 3D PIC simulations of
the flow in a retarding potential analyzer, Computer Physics Communi-cations, 164, 1–3, 383–389.
Whipple, E. C., Jr. (1976) Observation of photoelectrons and secondaryelectrons reflected from a potential barrier in the vicinity of ATS 6, J.Geophys. Res., 81, 4, 715–719.
Whipple, E. C., Jr., J. M. Warnock, and R. H. Winkler (1974) Effectof satellite potential on direct ion density measurements through the
plasmapause, J. Geophys. Res., 79, 1, 179–186.Zuccaro, D. R. and B. J. Holt (1982) A technique for establishing a refer-
ence potential on satellites in planetary ionospheres, J. Geophys. Res.,87, A10, 8327–8329.