122
Consolidated Interim Report as of June 30, 2005 Terna Group RETE ELETTRICA NAZIONALE Board Meeting held on September 7, 2005
Consolidated Interim Report as of June 30, 2005
Terna Group
RETE ELETTRICA NAZIONALE
Board Meeting held on September 7, 2005
Table of contents
Report on operations ..................................................................................................1
Consolidated accounting schedules
Consolidated income statement..........................................................................34
Consolidated balance sheet................................................................................35
Consolidated statement of changes in the shareholders’ equity ........................36
Consolidated statement of cash flows and explanatory notes ...........................37
Notes to the consolidated financial statements
Accounting policies and standards .....................................................................40
Information on the consolidated income statement............................................50
Disclosure by geographic area ...........................................................................55
Information on the consolidated balance sheet
Assets.............................................................................................................56
Liabilities and shareholders’ equity................................................................62
Off-balance sheet commitments and risks..........................................................75
Events subsequent to June 30, 2005..................................................................77
Transactions with related parties ........................................................................80
Attachments
IFRS reconciliation tables as of June 30, 2004 ..................................................83
Terna SpA accounting schedules .......................................................................88
Reconciliation between Terna SpA’ shareholders’ equity and
net result for the period and the corresponding consolidated balances ............91
Glossary ..............................................................................................................92
Transition to the international accounting standards (IFRS)...........................1
Report on Operations
Board of Directors, Board of Statutory Auditors and Independent Auditors
Introduction
Terna Group results
Terna and the financial markets
Significant events during the first half of 2005
Subsidiary companies
Operating and financial review
- Consolidated income statement
- Consolidated balance sheet
o Investments
o Plant and equipment
Research & Development activities
Human resources
Related parties
Corporate Governance
Outlook for the rest of 2005

2
Board of Directors, Board of Statutory Auditors and Independent Auditors
Board of Directors
Chairman
Fulvio Conti
Chief Executive Officer
Sergio Mobili
Directors
Luca Arnaboldi
Paolo Cantarella
Davide Croff
Claudio Machetti
Salvatore Machì
Massimo Romano
Paolo Ruzzini
Secretary to the Board
Filomena Passeggio
Board of Statutory Auditors
Chairman of the Board of Statutory Auditors
Giovanni Ferreri
Acting Auditors
Giancarlo Russo Corvace
Roberto Tasca
Alternate Auditors
Vito Di Battista
Bruno Franceschetti
Independent Auditors
KPMG SpA
3
Introduction Pursuant to the provisions of Article 81 of the CONSOB Regulation No. 11971/1999, as amended by
Resolution No. 14990 dated April 14, 2005, the Terna Group took steps to draw up the interim report as
of June 30, 2005 in accordance with the international accounting standards (International Financial
Reporting Standards - IFRS).
The attachment “Transition to the international accounting standards (IFRS)” contains the
reconciliations, whose balances have been subject to audit, as anticipated by international accounting
standard IFRS 1, accompanied by notes explaining the basis of presentation and the items included.
4
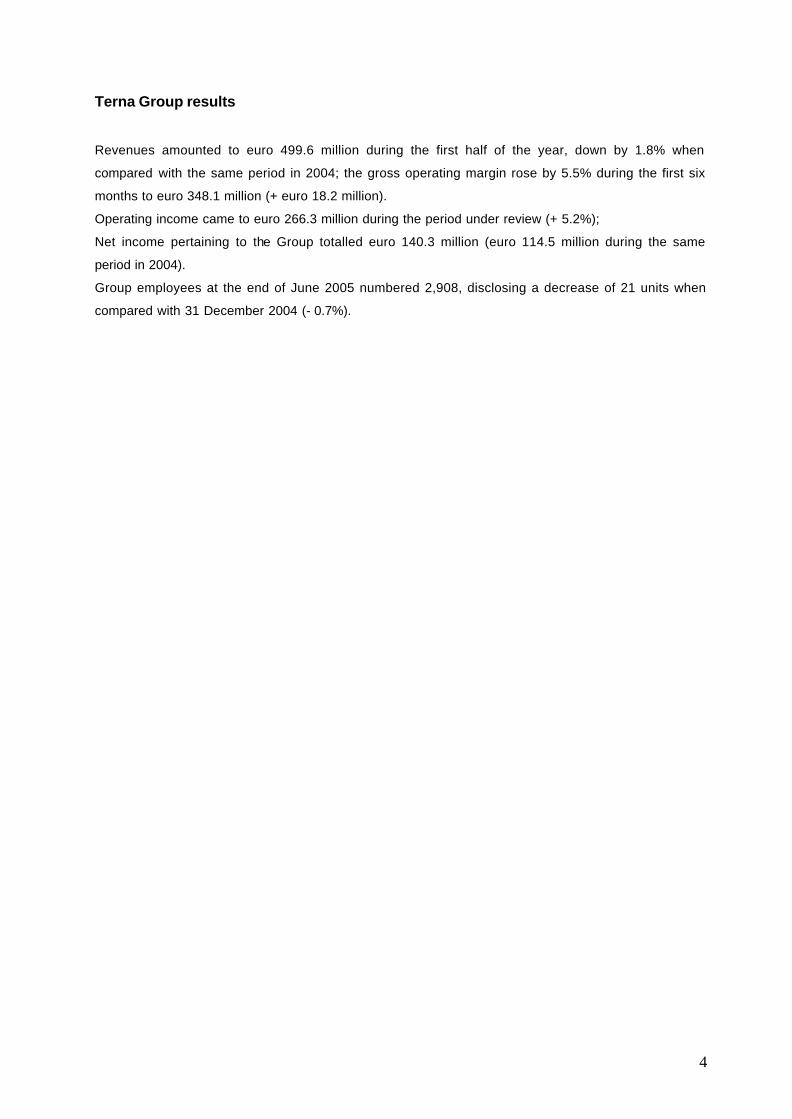
Terna Group results
Revenues amounted to euro 499.6 million during the first half of the year, down by 1.8% when
compared with the same period in 2004; the gross operating margin rose by 5.5% during the first six
months to euro 348.1 million (+ euro 18.2 million).
Operating income came to euro 266.3 million during the period under review (+ 5.2%);
Net income pertaining to the Group totalled euro 140.3 million (euro 114.5 million during the same
period in 2004).
Group employees at the end of June 2005 numbered 2,908, disclosing a decrease of 21 units when
compared with 31 December 2004 (- 0.7%).
5
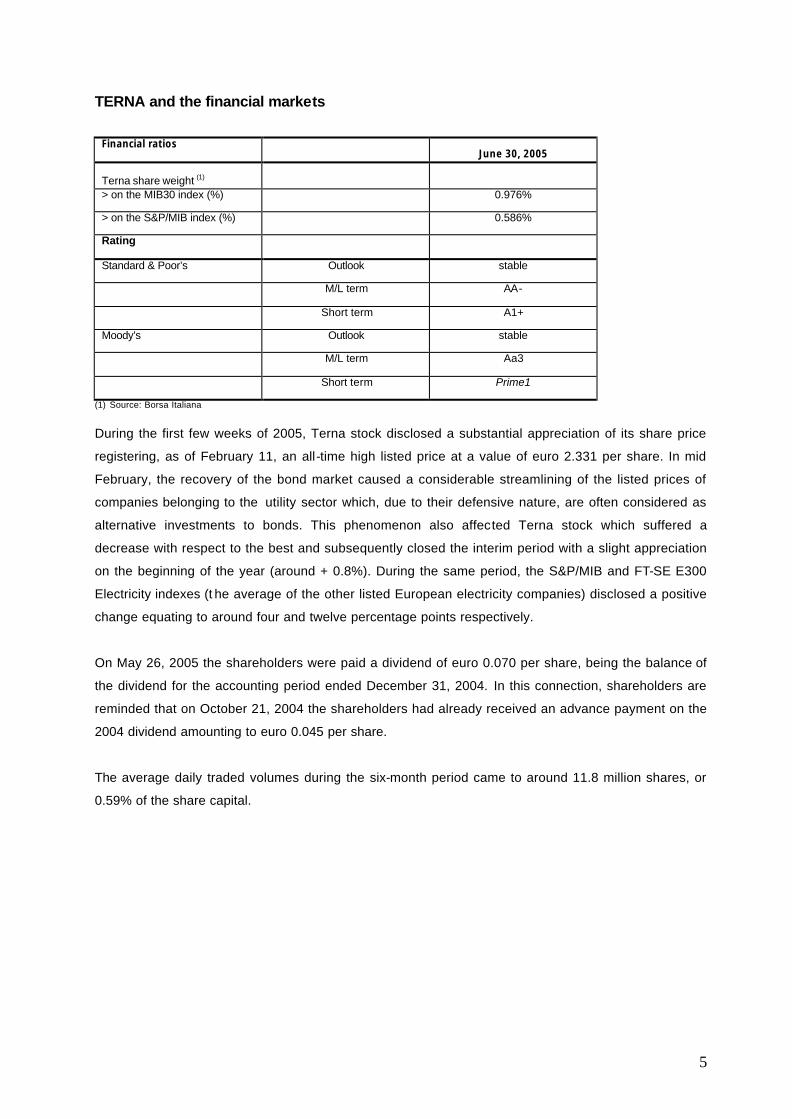
TERNA and the financial markets
Financial ratios
June 30, 2005 Terna share weight (1)
> on the MIB30 index (%) 0.976%
> on the S&P/MIB index (%) 0.586%
Rating
Standard & Poor’s Outlook stable
M/L term AA-
Short term A1+
Moody’s Outlook stable
M/L term Aa3
Short term Prime1
(1) Source: Borsa Italiana
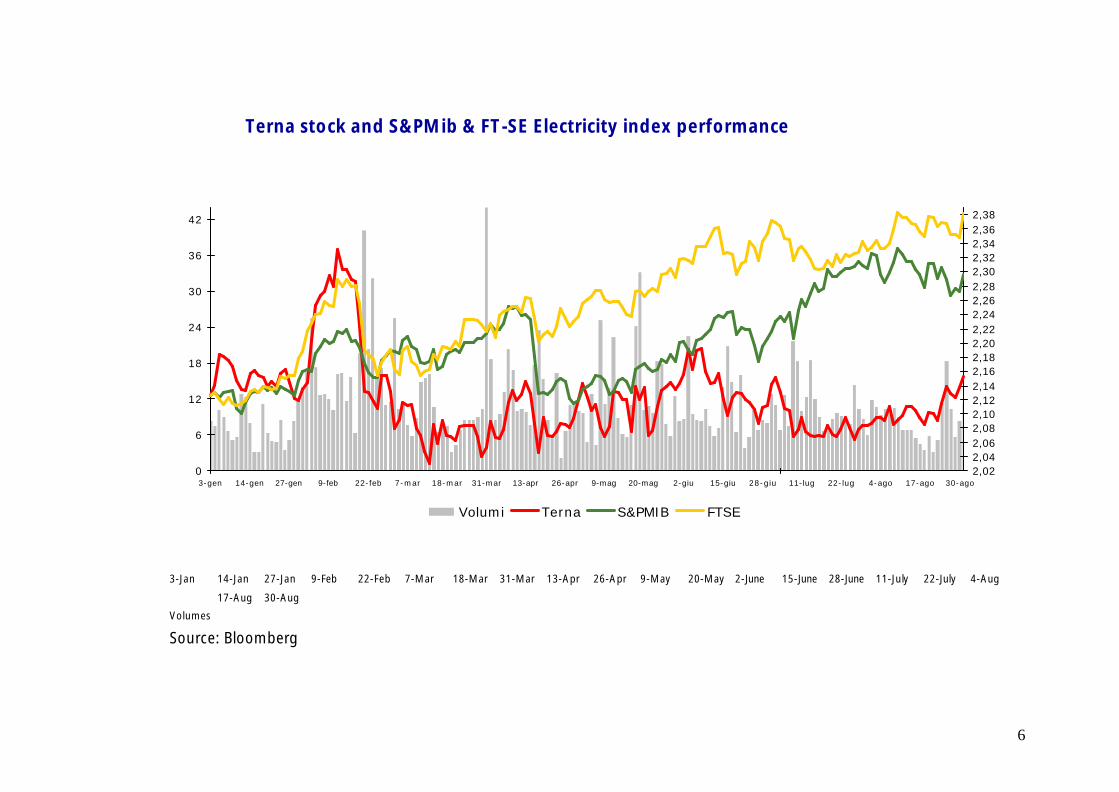
During the first few weeks of 2005, Terna stock disclosed a substantial appreciation of its share price
registering, as of February 11, an all-time high listed price at a value of euro 2.331 per share. In mid
February, the recovery of the bond market caused a considerable streamlining of the listed prices of
companies belonging to the utility sector which, due to their defensive nature, are often considered as
alternative investments to bonds. This phenomenon also affected Terna stock which suffered a
decrease with respect to the best and subsequently closed the interim period with a slight appreciation
on the beginning of the year (around + 0.8%). During the same period, the S&P/MIB and FT-SE E300
Electricity indexes (t he average of the other listed European electricity companies) disclosed a positive
change equating to around four and twelve percentage points respectively.
On May 26, 2005 the shareholders were paid a dividend of euro 0.070 per share, being the balance of
the dividend for the accounting period ended December 31, 2004. In this connection, shareholders are
reminded that on October 21, 2004 the shareholders had already received an advance payment on the
2004 dividend amounting to euro 0.045 per share.
The average daily traded volumes during the six-month period came to around 11.8 million shares, or
0.59% of the share capital.
6
3-Jan 14-Jan 27-Jan 9-Feb 22-Feb 7-Mar 18-Mar 31-Mar 13-Apr 26-Apr 9-May 20-May 2-June 15-June 28-June 11-July 22-July 4-Aug
17-Aug 30-Aug
Volumes
Source: Bloomberg
Terna stock and S&PMib & FT-SE Electricity index performance
0
6
12
18
24
30
36
42
3-gen 14-gen 27-gen 9-feb 22-feb 7-mar 18-mar 31-mar 13-apr 26-apr 9-mag 20-mag 2-giu 15-giu 28-giu 11-lug 22-lug 4-ago 17-ago 30-ago2,022,042,062,082,102,122,142,162,182,202,222,242,262,282,302,322,342,362,38
Volumi Terna S&PMIB FTSE
7
Significant events during the first half of 2005 Agreement for the acquisition of the ISO business segment
On February 28, 2005 Terna SpA and the ISO – Independent System Operator (GRTN SpA), in
observance of the matters laid down by the DPCM (Prime Minister’s Decree) dated May 11, 2004,
signed the agreement for the transfer to Terna of the ISO business segment, comprising the activities,
functions, assets and legal relationships as indicated by the same DPCM.
The purpose of the agreement is to integrate the ownership and management of the electricity NTN
(National Transmission Network).
The business segment being transferred includes around 580 resources, and comprises:
- the dispatch activities, or rather the management of the flows introduced onto and withdrawn
from the NTN in order to balance electricity supply and demand;
- the planning and development activities, or rather the definition of investment programs for
upgrading the NTN.
The parties have agreed a price of euro 68.3 million for the transfer of the business segment, net of
approximately euro 112 million in trade payables due to Terna. The overall valorization of the business
segment transferred therefore amounts to euro 180 million.
The date of efficacy of the unification between the ownership and management of the NTN is deferred
until the occurrence of the following abeyance conditions:
- the new concession by the Ministry of Production Activities for the performance of the electricity
transmission and dispatching activities within the national territory belonging to Terna;
- the approval, by the Ministry of Production Activities and the Energy Authority, of the Network
Code anticipated by the Prime Minister’s Decree;
- the issue by the Antitrust Authority of a favourable opinion on the transaction.
The first two abeyance conditions have take place.
With regards to the third condition, as of June 22, 2005 the Antitrust Authority launched a preliminary
investigation into the acquisition by Cassa Depositi e Prestiti of 29.99% of Terna’s share capital, as well
as into the acquisition by the latter of the ISO business segment.
By means of Ruling No. 14542 dated August 4, 2005, communicated to the parties on August 5, 2005,
the Antitrust Authority issued its authorization for the acquisition, by the company Cassa Depositi e
Prestiti (CdP), of 29.99% of the share capital of Terna and of the ISO business segment, obliging CDP
to observe the following measures:
a) the transfer, as from July 1, 2007 and within the subsequent 24 months, by CDP of the equity
investment held in ENEL S.p.A., as well as
b) provisionally and until the satisfaction of the afore-mentioned condition, the undertaking of the
following commitments:
- i) approval by the new Terna Board of Directors of a resolution which lays down suitable
procedures for enhancing the role of the Advisory Committee pursuant to Article 1 of the
D.P.C.M. dated May 11, 2004 in relation to the adoption and implementation of the NTN
development plans;
8
- ii) appointment of at least six of the seven Terna directors, due CDP in the event of a Board
of Directors comprising ten members, who are independents.
EIB loan
During March 2005, the Company obtained a line of credit from the European Investment Bank (EIB) for
a total of euro 300 million. On March 15, the first portion of euro 100 million was disbursed. The loan
anticipates a period of grace of 4 years and repayment period of 11 years, involving straight-line six-
monthly instalments. The residual part can be disbursed up until December 31, 2006.
The annual loan cost will be equal to a margin of 12 basis points to be added to the rate from period to
period determined by the Bank which in any event cannot exceed in total the Euribor rate plus 27 basis
points for the entire duration of the loan.
Placement of Terna shares via the ABB procedure
On March 31, Enel SpA transferred an equity investment of 13.86% in the subsidiary Terna by means of
an accelerated bookbuilding transaction targeted at Italian and foreign institutional investors. The
transaction closed at a final allocation price of euro 2.05 per share, essentially in line with the Terna
share stockmarket prices during the same period, and was settled by means of consignment of the
securities and payment of the price on April 5, 2005. As a result of this transaction, Enel’s equity
investment in Terna’s share capital comes to 36.142%.
General Shareholders’ Meeting
As of April 1, 2005 Terna’s General Shareholders’ Meeting was held in first calling. During the ordinary
session, it resolved on the approval of the 2004 statutory financial statements and the payment of the
dividend balance of euro cents 7 per share, being the balance of the advance payment of the euro cents
4.5 per share dividend already paid out in October 2004. The balance of the dividend was made
available for payment as from May 26, 2005, with the “detachment date” of coupon No. 2 coinciding with
May 23, 2005. With regards to the additional resolutions adopted by the meeting for the period under
review, reference should be made to the matters described in the section “Corporate Governance”.
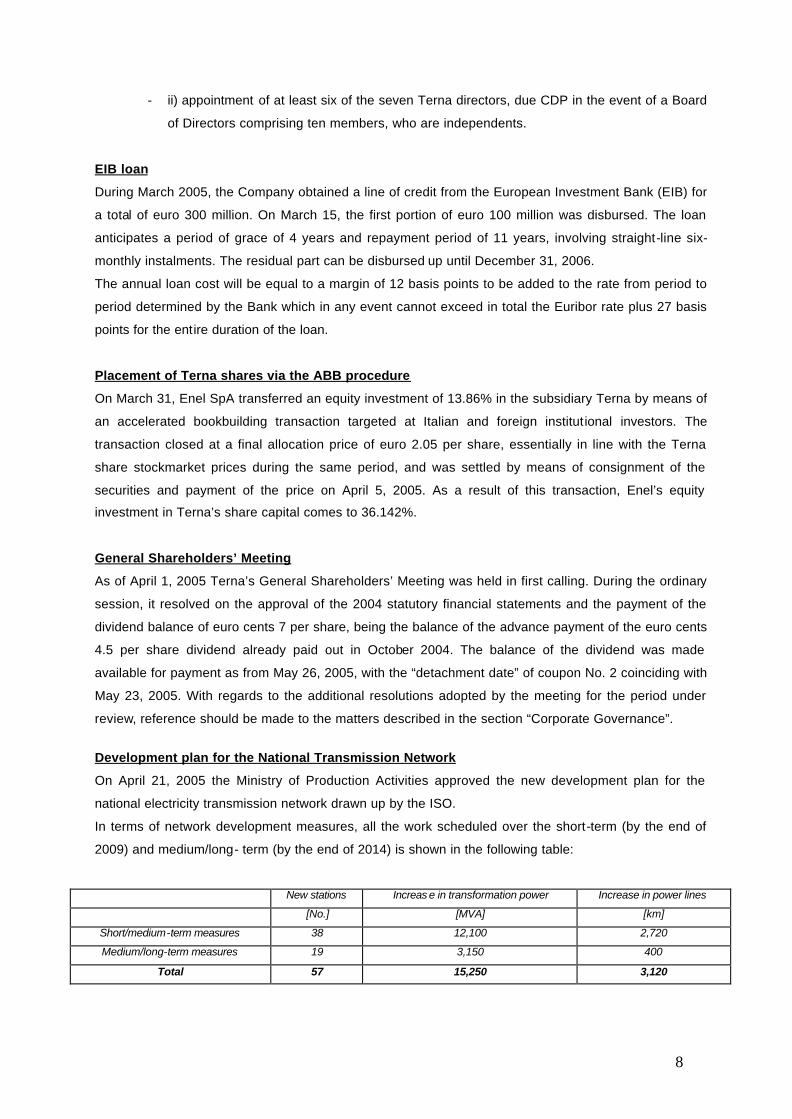
Development plan for the National Transmission Network
On April 21, 2005 the Ministry of Production Activities approved the new development plan for the
national electricity transmission network drawn up by the ISO.
In terms of network development measures, all the work scheduled over the short-term (by the end of
2009) and medium/long- term (by the end of 2014) is shown in the following table:
New stations Increas e in transformation power Increase in power lines
[No.] [MVA] [km]
Short/medium-term measures 38 12,100 2,720
Medium/long-term measures 19 3,150 400
Total 57 15,250 3,120
9
In addition to the development measures, this Plan anticipates a change in the NTN perimeter during
2005 as a result of the acquisitions and disposals of network elements which almost exclusively concern
Terna.
Specifically, as a result of the afore-mentioned change resolved by the ISO and approved by the MAP,
Terna will have to
• acquire approximately 52 km of 150-132 kV lines and 11 stations including 2 220 kV and 9 132 kV;
• dispose of around 48 km of line and 3 150-132 kV stations.
Reimbursement of TSN preference shares
Further to the resolution adopted by TSN’s Board of Directors and after having obtained the
authorization of BNDES, 175,000,000 redeemable TSN preference shares were reimbursed during April
for a total of R$ 164.7 million. The reimbursement resulted in Terna S.p.A. collecting around euro 49
million.
10
Subsidiary companies
ANEEL resolutions and authorizations
On June 30, 2005 ANEEL established the new values of the Concession Fee (RAP) in force as from
July 1, 2005 until June 30, 2006. The TSN and Novatrans fees were respectively set at R$ 245 million
and R$ 269 million, reflecting the adjustment for inflation (IGPM rate) accumulated between June 2004
and May 2005, equating to 9.0752%. ANEEL also acknowledged an additional one-off increase, to be
received in 12 monthly instalments as from July 2005 relating mainly to the adjustment for the additional
PIS/COFINS rates paid by the companies up until May 30, 2005, amounting to around R$ 13 million for
TSN and R$ 14 million for Novatrans.
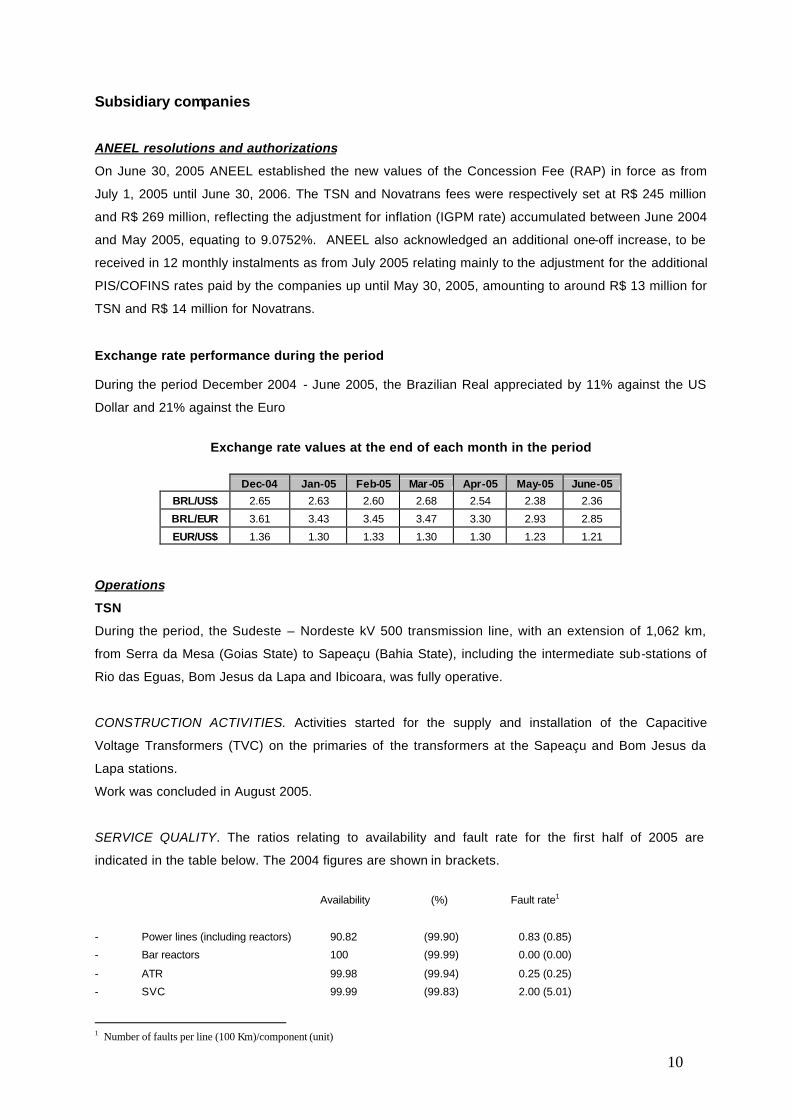
Exchange rate performance during the period During the period December 2004 - June 2005, the Brazilian Real appreciated by 11% against the US
Dollar and 21% against the Euro
Exchange rate values at the end of each month in the period
Dec-04 Jan-05 Feb-05 Mar -05 Apr-05 May-05 June-05
BRL/US$ 2.65 2.63 2.60 2.68 2.54 2.38 2.36
BRL/EUR 3.61 3.43 3.45 3.47 3.30 2.93 2.85
EUR/US$ 1.36 1.30 1.33 1.30 1.30 1.23 1.21
Operations
TSN
During the period, the Sudeste – Nordeste kV 500 transmission line, with an extension of 1,062 km,
from Serra da Mesa (Goias State) to Sapeaçu (Bahia State), including the intermediate sub-stations of
Rio das Eguas, Bom Jesus da Lapa and Ibicoara, was fully operative.
CONSTRUCTION ACTIVITIES. Activities started for the supply and installation of the Capacitive
Voltage Transformers (TVC) on the primaries of the transformers at the Sapeaçu and Bom Jesus da
Lapa stations.
Work was concluded in August 2005.
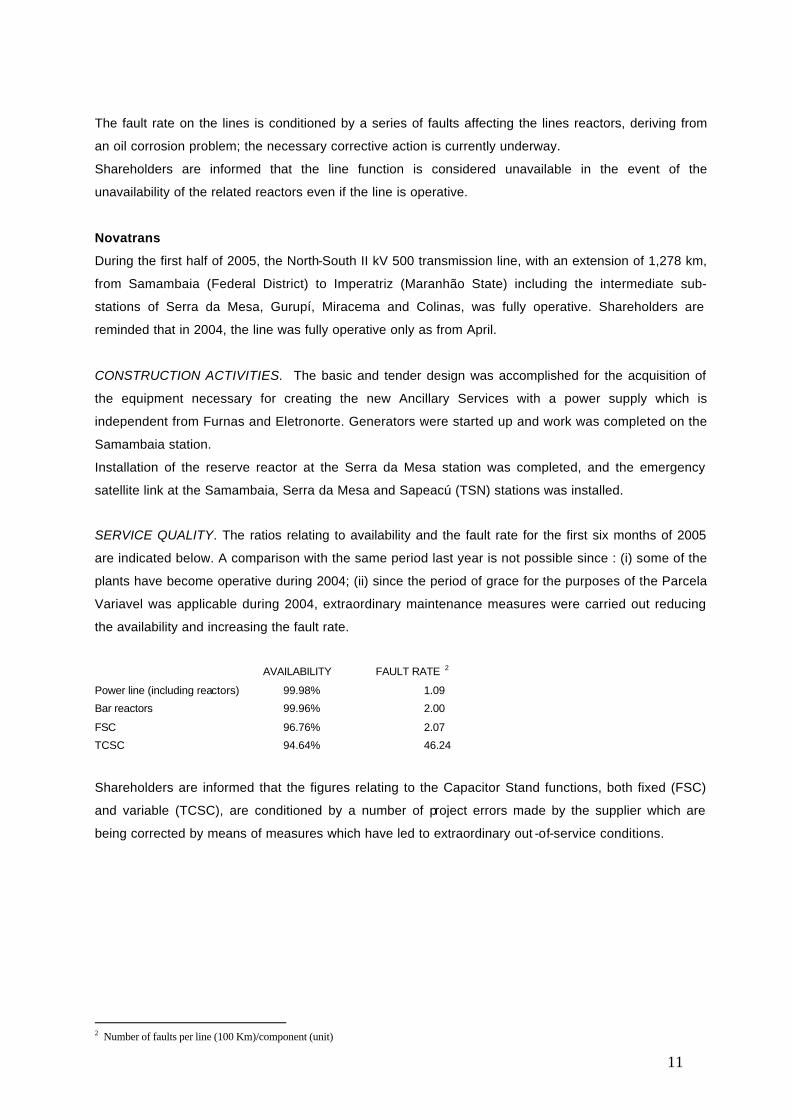
SERVICE QUALITY. The ratios relating to availability and fault rate for the first half of 2005 are
indicated in the table below. The 2004 figures are shown in brackets.
Availability (%) Fault rate1
- Power lines (including reactors) 90.82 (99.90) 0.83 (0.85)
- Bar reactors 100 (99.99) 0.00 (0.00)
- ATR 99.98 (99.94) 0.25 (0.25)
- SVC 99.99 (99.83) 2.00 (5.01)
1 Number of faults per line (100 Km)/component (unit)
11
The fault rate on the lines is conditioned by a series of faults affecting the lines reactors, deriving from
an oil corrosion problem; the necessary corrective action is currently underway.
Shareholders are informed that the line function is considered unavailable in the event of the
unavailability of the related reactors even if the line is operative.
Novatrans
During the first half of 2005, the North-South II kV 500 transmission line, with an extension of 1,278 km,
from Samambaia (Federal District) to Imperatriz (Maranhão State) including the intermediate sub-
stations of Serra da Mesa, Gurupí, Miracema and Colinas, was fully operative. Shareholders are
reminded that in 2004, the line was fully operative only as from April.
CONSTRUCTION ACTIVITIES. The basic and tender design was accomplished for the acquisition of
the equipment necessary for creating the new Ancillary Services with a power supply which is
independent from Furnas and Eletronorte. Generators were started up and work was completed on the
Samambaia station.
Installation of the reserve reactor at the Serra da Mesa station was completed, and the emergency
satellite link at the Samambaia, Serra da Mesa and Sapeacú (TSN) stations was installed.
SERVICE QUALITY. The ratios relating to availability and the fault rate for the first six months of 2005
are indicated below. A comparison with the same period last year is not possible since : (i) some of the
plants have become operative during 2004; (ii) since the period of grace for the purposes of the Parcela
Variavel was applicable during 2004, extraordinary maintenance measures were carried out reducing
the availability and increasing the fault rate.
AVAILABILITY FAULT RATE 2
Power line (including reactors) 99.98% 1.09
Bar reactors 99.96% 2.00
FSC 96.76% 2.07
TCSC 94.64% 46.24
Shareholders are informed that the figures relating to the Capacitor Stand functions, both fixed (FSC)
and variable (TCSC), are conditioned by a number of project errors made by the supplier which are
being corrected by means of measures which have led to extraordinary out -of-service conditions.
2 Number of faults per line (100 Km)/component (unit)
12
Operating and financial review
Form and content of the consolidated accounting schedules and operating review
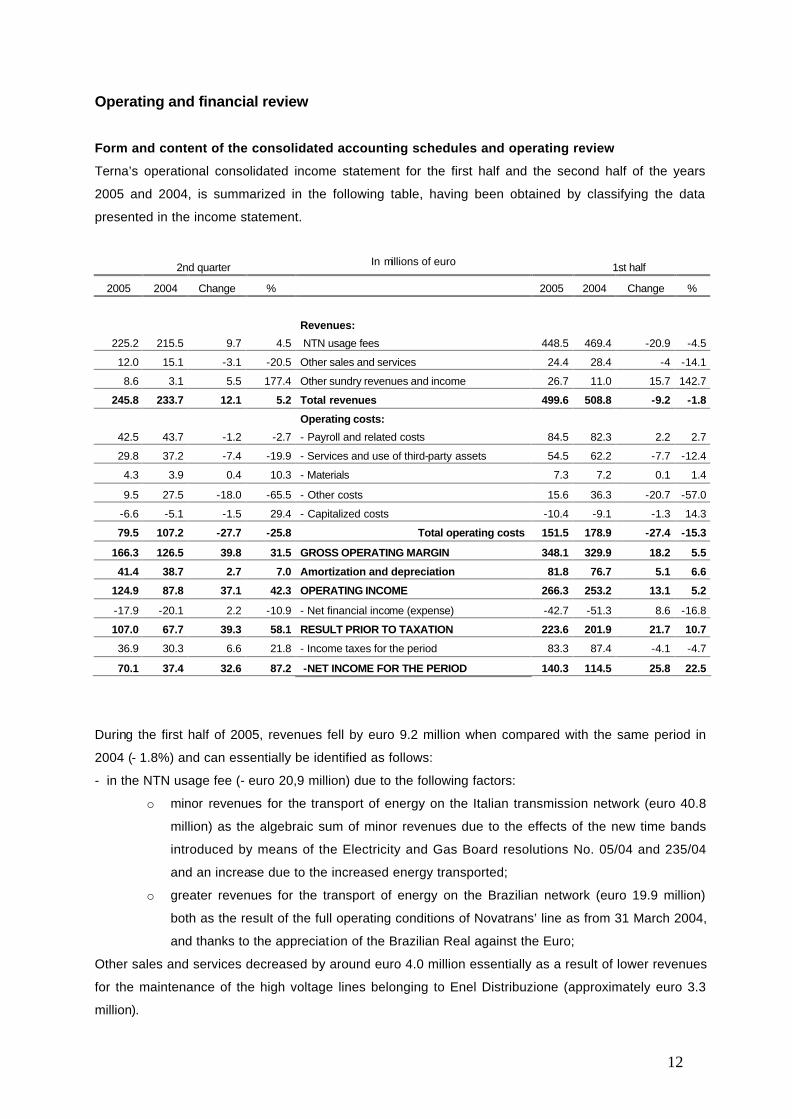
Terna’s operational consolidated income statement for the first half and the second half of the years
2005 and 2004, is summarized in the following table, having been obtained by classifying the data
presented in the income statement.
2nd quarter In millions of euro 1st half
2005 2004 Change %
2005 2004 Change %
Revenues:
225.2 215.5 9.7 4.5 NTN usage fees 448.5 469.4 -20.9 -4.5
12.0 15.1 -3.1 -20.5 Other sales and services 24.4 28.4 -4 -14.1
8.6 3.1 5.5 177.4 Other sundry revenues and income 26.7 11.0 15.7 142.7
245.8 233.7 12.1 5.2 Total revenues 499.6 508.8 -9.2 -1.8
Operating costs:
42.5 43.7 -1.2 -2.7 - Payroll and related costs 84.5 82.3 2.2 2.7
29.8 37.2 -7.4 -19.9 - Services and use of third-party assets 54.5 62.2 -7.7 -12.4
4.3 3.9 0.4 10.3 - Materials 7.3 7.2 0.1 1.4
9.5 27.5 -18.0 -65.5 - Other costs 15.6 36.3 -20.7 -57.0
-6.6 -5.1 -1.5 29.4 - Capitalized costs -10.4 -9.1 -1.3 14.3
79.5 107.2 -27.7 -25.8 Total operating costs 151.5 178.9 -27.4 -15.3
166.3 126.5 39.8 31.5 GROSS OPERATING MARGIN 348.1 329.9 18.2 5.5
41.4 38.7 2.7 7.0 Amortization and depreciation 81.8 76.7 5.1 6.6
124.9 87.8 37.1 42.3 OPERATING INCOME 266.3 253.2 13.1 5.2
-17.9 -20.1 2.2 -10.9 - Net financial income (expense) -42.7 -51.3 8.6 -16.8
107.0 67.7 39.3 58.1 RESULT PRIOR TO TAXATION 223.6 201.9 21.7 10.7
36.9 30.3 6.6 21.8 - Income taxes for the period 83.3 87.4 -4.1 -4.7
70.1 37.4 32.6 87.2 -NET INCOME FOR THE PERIOD 140.3 114.5 25.8 22.5
During the first half of 2005, revenues fell by euro 9.2 million when compared with the same period in
2004 (- 1.8%) and can essentially be identified as follows:
- in the NTN usage fee (- euro 20,9 million) due to the following factors:
o minor revenues for the transport of energy on the Italian transmission network (euro 40.8
million) as the algebraic sum of minor revenues due to the effects of the new time bands
introduced by means of the Electricity and Gas Board resolutions No. 05/04 and 235/04
and an increase due to the increased energy transported;
o greater revenues for the transport of energy on the Brazilian network (euro 19.9 million)
both as the result of the full operating conditions of Novatrans’ line as from 31 March 2004,
and thanks to the appreciation of the Brazilian Real against the Euro;
Other sales and services decreased by around euro 4.0 million essentially as a result of lower revenues
for the maintenance of the high voltage lines belonging to Enel Distribuzione (approximately euro 3.3
million).
13
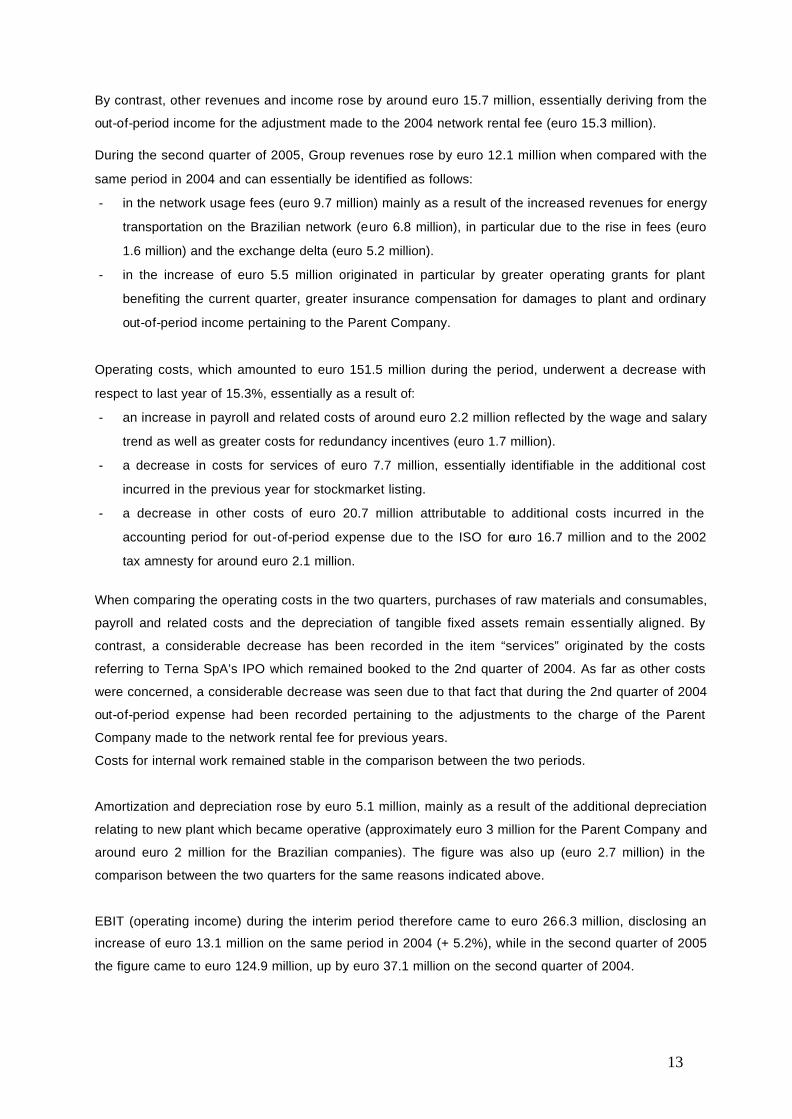
By contrast, other revenues and income rose by around euro 15.7 million, essentially deriving from the
out-of-period income for the adjustment made to the 2004 network rental fee (euro 15.3 million).
During the second quarter of 2005, Group revenues rose by euro 12.1 million when compared with the
same period in 2004 and can essentially be identified as follows:
- in the network usage fees (euro 9.7 million) mainly as a result of the increased revenues for energy
transportation on the Brazilian network (euro 6.8 million), in particular due to the rise in fees (euro
1.6 million) and the exchange delta (euro 5.2 million).
- in the increase of euro 5.5 million originated in particular by greater operating grants for plant
benefiting the current quarter, greater insurance compensation for damages to plant and ordinary
out-of-period income pertaining to the Parent Company.
Operating costs, which amounted to euro 151.5 million during the period, underwent a decrease with
respect to last year of 15.3%, essentially as a result of:
- an increase in payroll and related costs of around euro 2.2 million reflected by the wage and salary
trend as well as greater costs for redundancy incentives (euro 1.7 million).
- a decrease in costs for services of euro 7.7 million, essentially identifiable in the additional cost
incurred in the previous year for stockmarket listing.
- a decrease in other costs of euro 20.7 million attributable to additional costs incurred in the
accounting period for out-of-period expense due to the ISO for euro 16.7 million and to the 2002
tax amnesty for around euro 2.1 million.
When comparing the operating costs in the two quarters, purchases of raw materials and consumables,
payroll and related costs and the depreciation of tangible fixed assets remain essentially aligned. By
contrast, a considerable decrease has been recorded in the item “services” originated by the costs
referring to Terna SpA’s IPO which remained booked to the 2nd quarter of 2004. As far as other costs
were concerned, a considerable decrease was seen due to that fact that during the 2nd quarter of 2004
out-of-period expense had been recorded pertaining to the adjustments to the charge of the Parent
Company made to the network rental fee for previous years.
Costs for internal work remained stable in the comparison between the two periods.
Amortization and depreciation rose by euro 5.1 million, mainly as a result of the additional depreciation
relating to new plant which became operative (approximately euro 3 million for the Parent Company and
around euro 2 million for the Brazilian companies). The figure was also up (euro 2.7 million) in the
comparison between the two quarters for the same reasons indicated above.
EBIT (operating income) during the interim period therefore came to euro 266.3 million, disclosing an
increase of euro 13.1 million on the same period in 2004 (+ 5.2%), while in the second quarter of 2005
the figure came to euro 124.9 million, up by euro 37.1 million on the second quarter of 2004.
14
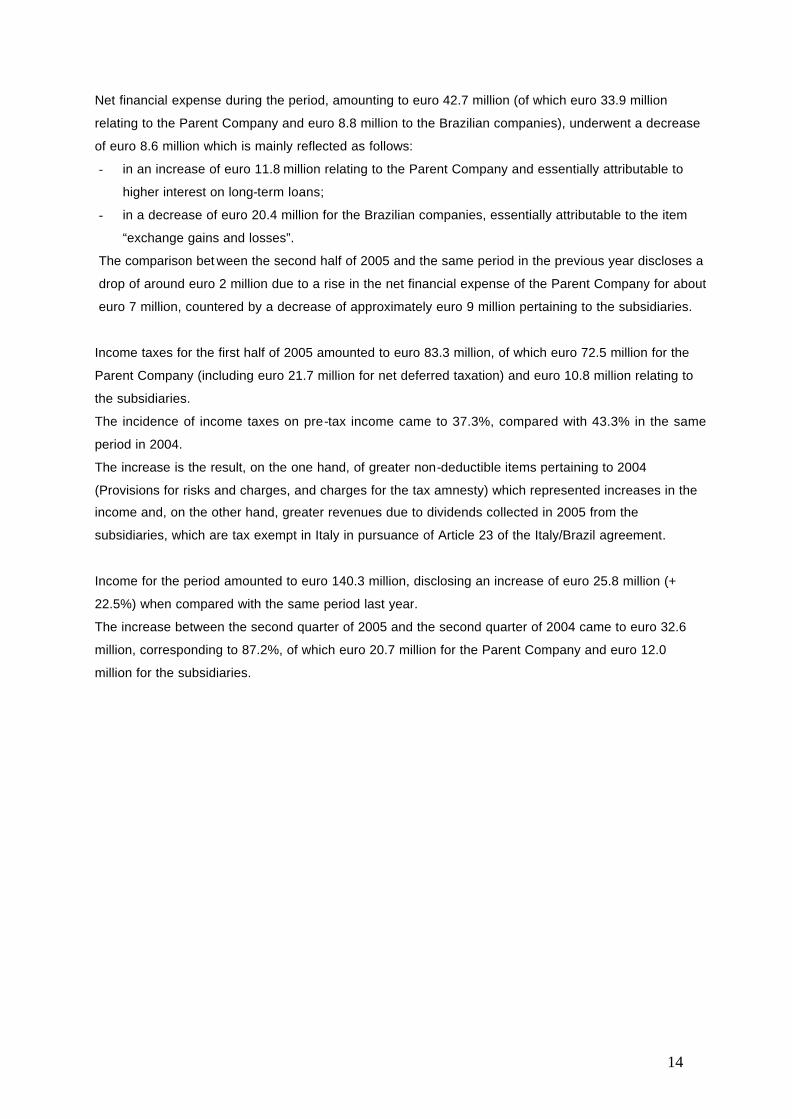
Net financial expense during the period, amounting to euro 42.7 million (of which euro 33.9 million
relating to the Parent Company and euro 8.8 million to the Brazilian companies), underwent a decrease
of euro 8.6 million which is mainly reflected as follows:
- in an increase of euro 11.8 million relating to the Parent Company and essentially attributable to
higher interest on long-term loans;
- in a decrease of euro 20.4 million for the Brazilian companies, essentially attributable to the item
“exchange gains and losses”.
The comparison bet ween the second half of 2005 and the same period in the previous year discloses a
drop of around euro 2 million due to a rise in the net financial expense of the Parent Company for about
euro 7 million, countered by a decrease of approximately euro 9 million pertaining to the subsidiaries.
Income taxes for the first half of 2005 amounted to euro 83.3 million, of which euro 72.5 million for the
Parent Company (including euro 21.7 million for net deferred taxation) and euro 10.8 million relating to
the subsidiaries.
The incidence of income taxes on pre-tax income came to 37.3%, compared with 43.3% in the same
period in 2004.
The increase is the result, on the one hand, of greater non-deductible items pertaining to 2004
(Provisions for risks and charges, and charges for the tax amnesty) which represented increases in the
income and, on the other hand, greater revenues due to dividends collected in 2005 from the
subsidiaries, which are tax exempt in Italy in pursuance of Article 23 of the Italy/Brazil agreement.
Income for the period amounted to euro 140.3 million, disclosing an increase of euro 25.8 million (+
22.5%) when compared with the same period last year.
The increase between the second quarter of 2005 and the second quarter of 2004 came to euro 32.6
million, corresponding to 87.2%, of which euro 20.7 million for the Parent Company and euro 12.0
million for the subsidiaries.
15
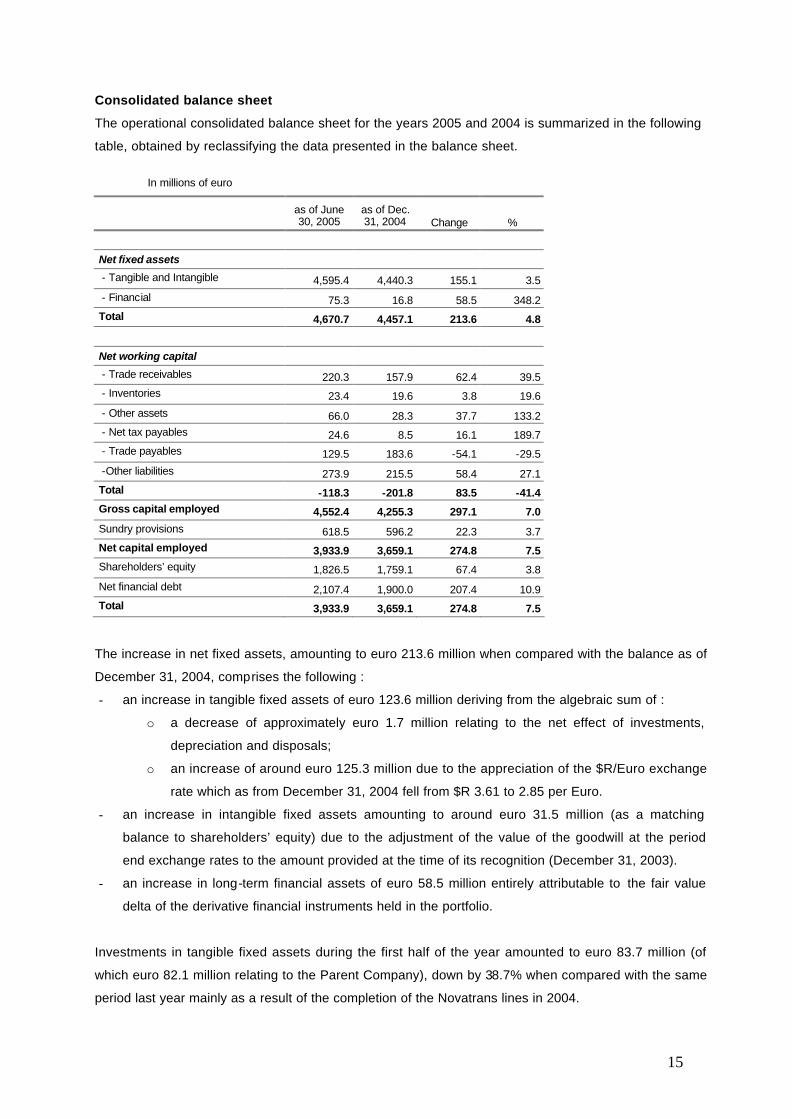
Consolidated balance sheet
The operational consolidated balance sheet for the years 2005 and 2004 is summarized in the following
table, obtained by reclassifying the data presented in the balance sheet.
In millions of euro
as of June 30, 2005
as of Dec. 31, 2004 Change %
Net fixed assets
- Tangible and Intangible 4,595.4 4,440.3 155.1 3.5
- Financial 75.3 16.8 58.5 348.2 Total 4,670.7 4,457.1 213.6 4.8
Net working capital - Trade receivables 220.3 157.9 62.4 39.5 - Inventories 23.4 19.6 3.8 19.6
- Other assets 66.0 28.3 37.7 133.2 - Net tax payables 24.6 8.5 16.1 189.7 - Trade payables 129.5 183.6 -54.1 -29.5
-Other liabilities 273.9 215.5 58.4 27.1 Total -118.3 -201.8 83.5 -41.4 Gross capital employed 4,552.4 4,255.3 297.1 7.0
Sundry provisions 618.5 596.2 22.3 3.7 Net capital employed 3,933.9 3,659.1 274.8 7.5 Shareholders’ equity 1,826.5 1,759.1 67.4 3.8
Net financial debt 2,107.4 1,900.0 207.4 10.9 Total 3,933.9 3,659.1 274.8 7.5
The increase in net fixed assets, amounting to euro 213.6 million when compared with the balance as of
December 31, 2004, comprises the following :
- an increase in tangible fixed assets of euro 123.6 million deriving from the algebraic sum of :
o a decrease of approximately euro 1.7 million relating to the net effect of investments,
depreciation and disposals;
o an increase of around euro 125.3 million due to the appreciation of the $R/Euro exchange
rate which as from December 31, 2004 fell from $R 3.61 to 2.85 per Euro.
- an increase in intangible fixed assets amounting to around euro 31.5 million (as a matching
balance to shareholders’ equity) due to the adjustment of the value of the goodwill at the period
end exchange rates to the amount provided at the time of its recognition (December 31, 2003).
- an increase in long-term financial assets of euro 58.5 million entirely attributable to the fair value
delta of the derivative financial instruments held in the portfolio.
Investments in tangible fixed assets during the first half of the year amounted to euro 83.7 million (of
which euro 82.1 million relating to the Parent Company), down by 38.7% when compared with the same
period last year mainly as a result of the completion of the Novatrans lines in 2004.
16
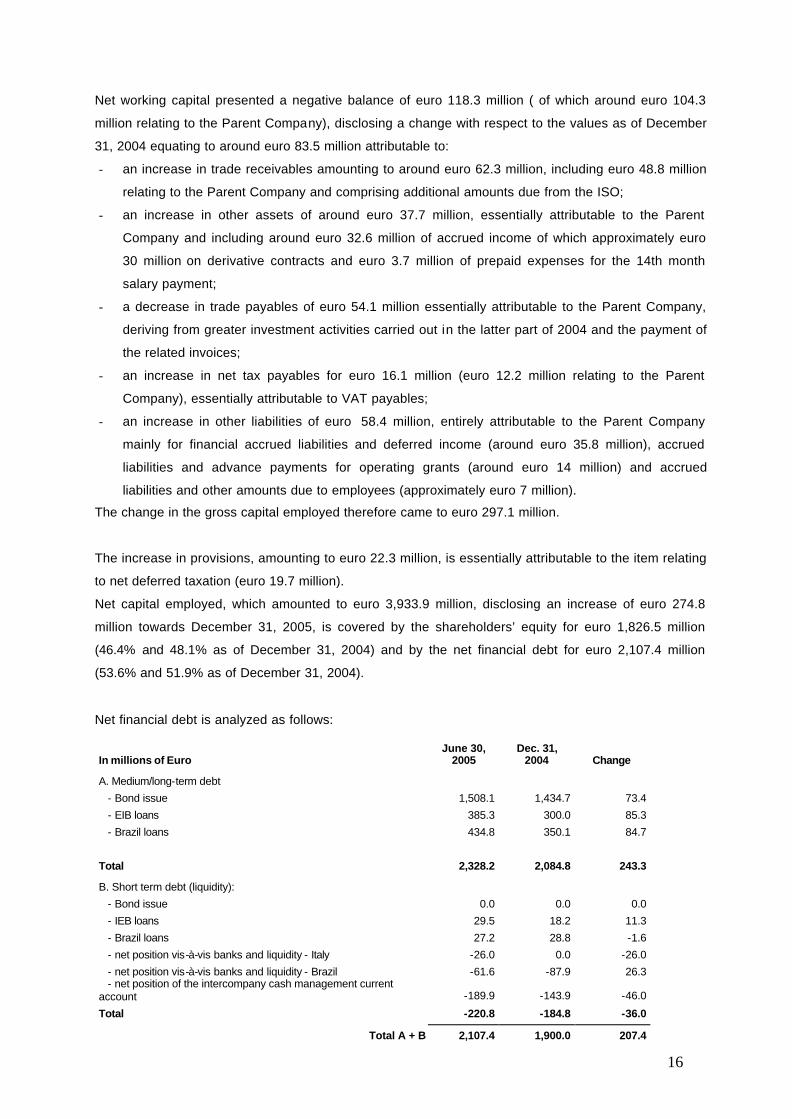
Net working capital presented a negative balance of euro 118.3 million ( of which around euro 104.3
million relating to the Parent Company), disclosing a change with respect to the values as of December
31, 2004 equating to around euro 83.5 million attributable to:
- an increase in trade receivables amounting to around euro 62.3 million, including euro 48.8 million
relating to the Parent Company and comprising additional amounts due from the ISO;
- an increase in other assets of around euro 37.7 million, essentially attributable to the Parent
Company and including around euro 32.6 million of accrued income of which approximately euro
30 million on derivative contracts and euro 3.7 million of prepaid expenses for the 14th month
salary payment;
- a decrease in trade payables of euro 54.1 million essentially attributable to the Parent Company,
deriving from greater investment activities carried out in the latter part of 2004 and the payment of
the related invoices;
- an increase in net tax payables for euro 16.1 million (euro 12.2 million relating to the Parent
Company), essentially attributable to VAT payables;
- an increase in other liabilities of euro 58.4 million, entirely attributable to the Parent Company
mainly for financial accrued liabilities and deferred income (around euro 35.8 million), accrued
liabilities and advance payments for operating grants (around euro 14 million) and accrued
liabilities and other amounts due to employees (approximately euro 7 million).
The change in the gross capital employed therefore came to euro 297.1 million.
The increase in provisions, amounting to euro 22.3 million, is essentially attributable to the item relating
to net deferred taxation (euro 19.7 million).
Net capital employed, which amounted to euro 3,933.9 million, disclosing an increase of euro 274.8
million towards December 31, 2005, is covered by the shareholders’ equity for euro 1,826.5 million
(46.4% and 48.1% as of December 31, 2004) and by the net financial debt for euro 2,107.4 million
(53.6% and 51.9% as of December 31, 2004).
Net financial debt is analyzed as follows:
In millions of Euro June 30,
2005 Dec. 31,
2004 Change A. Medium/long-term debt
- Bond issue 1,508.1 1,434.7 73.4
- EIB loans 385.3 300.0 85.3
- Brazil loans 434.8 350.1 84.7
Total 2,328.2 2,084.8 243.3
B. Short term debt (liquidity):
- Bond issue 0.0 0.0 0.0
- IEB loans 29.5 18.2 11.3
- Brazil loans 27.2 28.8 -1.6
- net position vis-à-vis banks and liquidity - Italy -26.0 0.0 -26.0
- net position vis-à-vis banks and liquidity - Brazil -61.6 -87.9 26.3 - net position of the intercompany cash management current account -189.9 -143.9 -46.0
Total -220.8 -184.8 -36.0
Total A + B 2,107.4 1,900.0 207.4
17
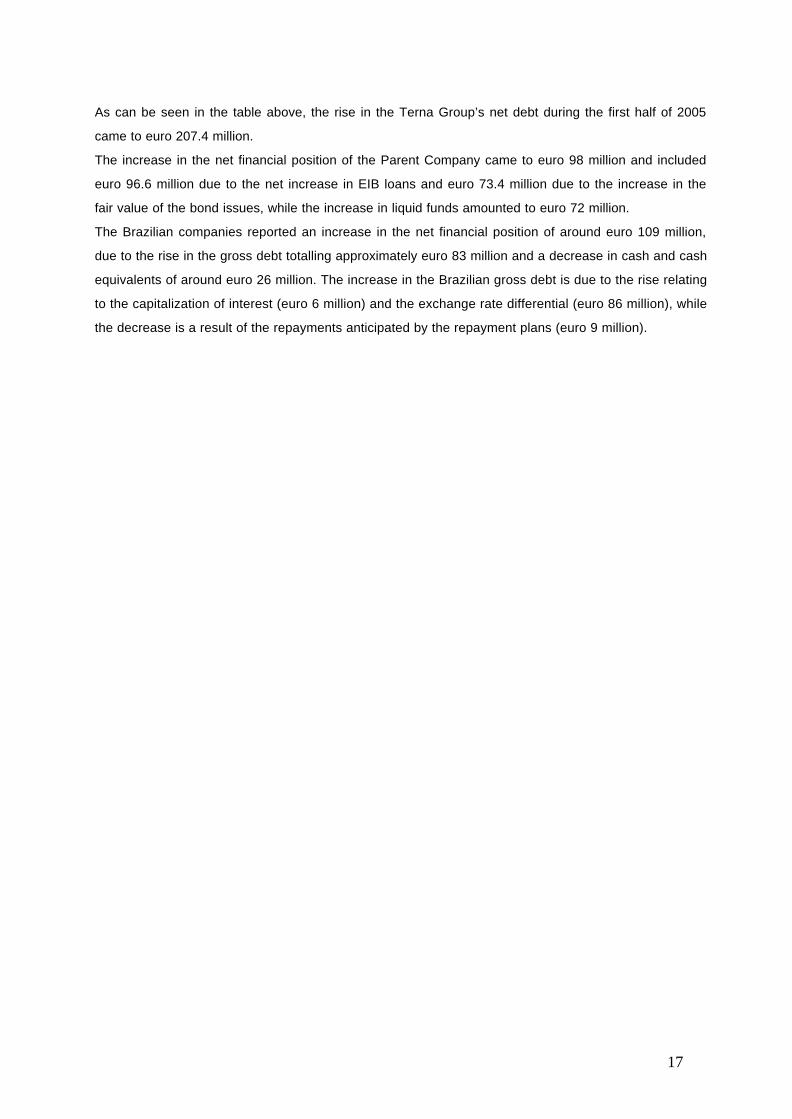
As can be seen in the table above, the rise in the Terna Group’s net debt during the first half of 2005
came to euro 207.4 million.
The increase in the net financial position of the Parent Company came to euro 98 million and included
euro 96.6 million due to the net increase in EIB loans and euro 73.4 million due to the increase in the
fair value of the bond issues, while the increase in liquid funds amounted to euro 72 million.
The Brazilian companies reported an increase in the net financial position of around euro 109 million,
due to the rise in the gross debt totalling approximately euro 83 million and a decrease in cash and cash
equivalents of around euro 26 million. The increase in the Brazilian gross debt is due to the rise relating
to the capitalization of interest (euro 6 million) and the exchange rate differential (euro 86 million), while
the decrease is a result of the repayments anticipated by the repayment plans (euro 9 million).
18
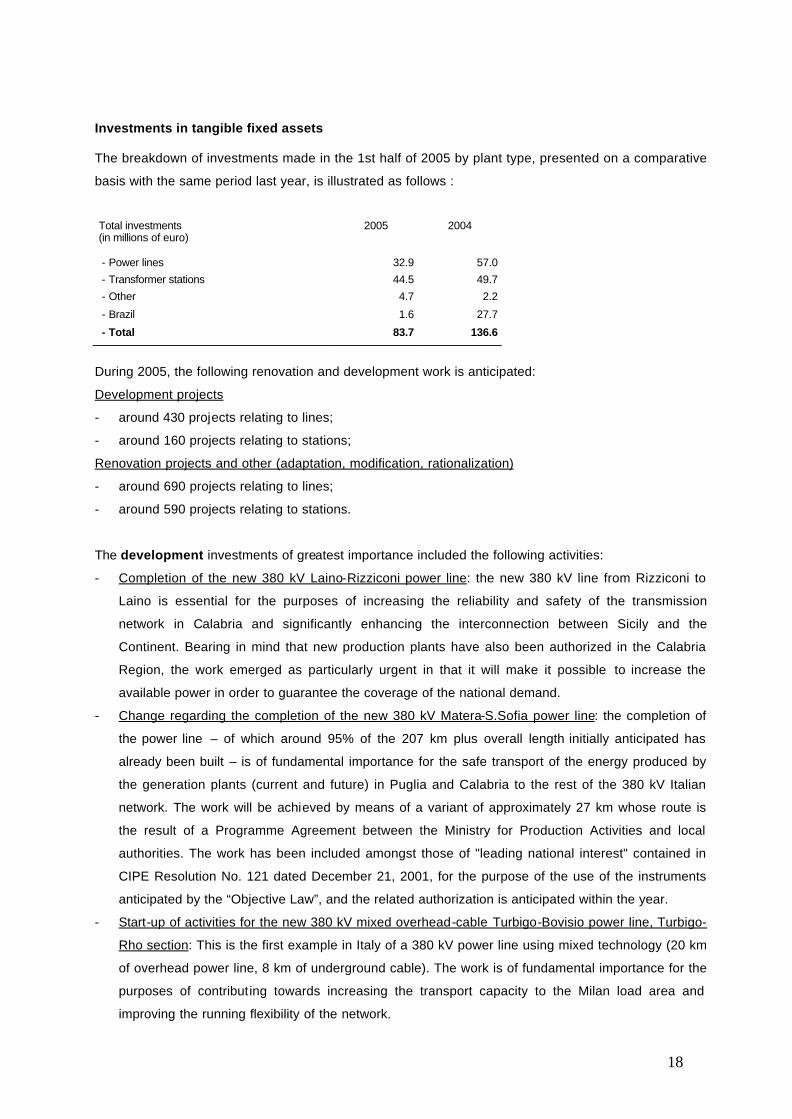
Investments in tangible fixed assets The breakdown of investments made in the 1st half of 2005 by plant type, presented on a comparative
basis with the same period last year, is illustrated as follows :
Total investments (in millions of euro)
2005 2004
- Power lines 32.9 57.0
- Transformer stations 44.5 49.7
- Other 4.7 2.2
- Brazil 1.6 27.7
- Total 83.7 136.6
During 2005, the following renovation and development work is anticipated:
Development projects
- around 430 projects relating to lines;
- around 160 projects relating to stations;
Renovation projects and other (adaptation, modification, rationalization)
- around 690 projects relating to lines;
- around 590 projects relating to stations.
The development investments of greatest importance included the following activities:
- Completion of the new 380 kV Laino-Rizziconi power line: the new 380 kV line from Rizziconi to
Laino is essential for the purposes of increasing the reliability and safety of the transmission
network in Calabria and significantly enhancing the interconnection between Sicily and the
Continent. Bearing in mind that new production plants have also been authorized in the Calabria
Region, the work emerged as particularly urgent in that it will make it possible to increase the
available power in order to guarantee the coverage of the national demand.
- Change regarding the completion of the new 380 kV Matera-S.Sofia power line: the completion of
the power line – of which around 95% of the 207 km plus overall length initially anticipated has
already been built – is of fundamental importance for the safe transport of the energy produced by
the generation plants (current and future) in Puglia and Calabria to the rest of the 380 kV Italian
network. The work will be achieved by means of a variant of approximately 27 km whose route is
the result of a Programme Agreement between the Ministry for Production Activities and local
authorities. The work has been included amongst those of "leading national interest" contained in
CIPE Resolution No. 121 dated December 21, 2001, for the purpose of the use of the instruments
anticipated by the “Objective Law”, and the related authorization is anticipated within the year.
- Start-up of activities for the new 380 kV mixed overhead-cable Turbigo-Bovisio power line, Turbigo-
Rho section: This is the first example in Italy of a 380 kV power line using mixed technology (20 km
of overhead power line, 8 km of underground cable). The work is of fundamental importance for the
purposes of contributing towards increasing the transport capacity to the Milan load area and
improving the running flexibility of the network.
19
- Creation of a new 150 kV underwater cable connection between Sardinia and Corsica (SARCO):
the aim of the project is the construction of the new 150 kV interconnecting power line S.Teresa
(Italy) - Bonifacio (Corsica) between the C.P. of Santa Teresa Gallura and the Italo-French territorial
waters.
- New 380 kV Ferrara station: this involves the creation of a new 380 kV switching station to be
connected incoming-outgoing to the "Ostiglia - Ferrara Focomorto" line, required for the connection
of the 800 MW combined cycle generation plant under construction belonging to SEF.
- New 380 kV Sparanise station: : construction of a new 380 kV switching station to be connected
incoming-outgoing to the "Garigliano - S. Maria C.V." line, required for the connection of the 800
MW combined cycle generation plant under construction belonging to CALENIA ENERGIA.
- Completion of the new 380 kV Feroleto section: Work continues for the realization, at the 150 kV
Feroleto station (currently connected by means of antenna to the 220 kV network), of a 380 kV
double bar section equipped with ATR 380/150 kV and connected incoming-outgoing to the 380 kV
“Rizziconi – Laino” power line (currently under construction). On a parallel, extension continues
(with two bays) of the current 150 kV section.
The renovation investments of greatest importance included the following activities:
- Reconstruction of the Verampio plant;
- Reconstruction of the 220 and 132 kV Pianezza sections;
- Reconstruction of the La Spezia plant;
- Reconstruction of the Verderio plant;
- Renovation and adaptation of the Soverzene plant;
- Adaptation of the Villavalle plant.
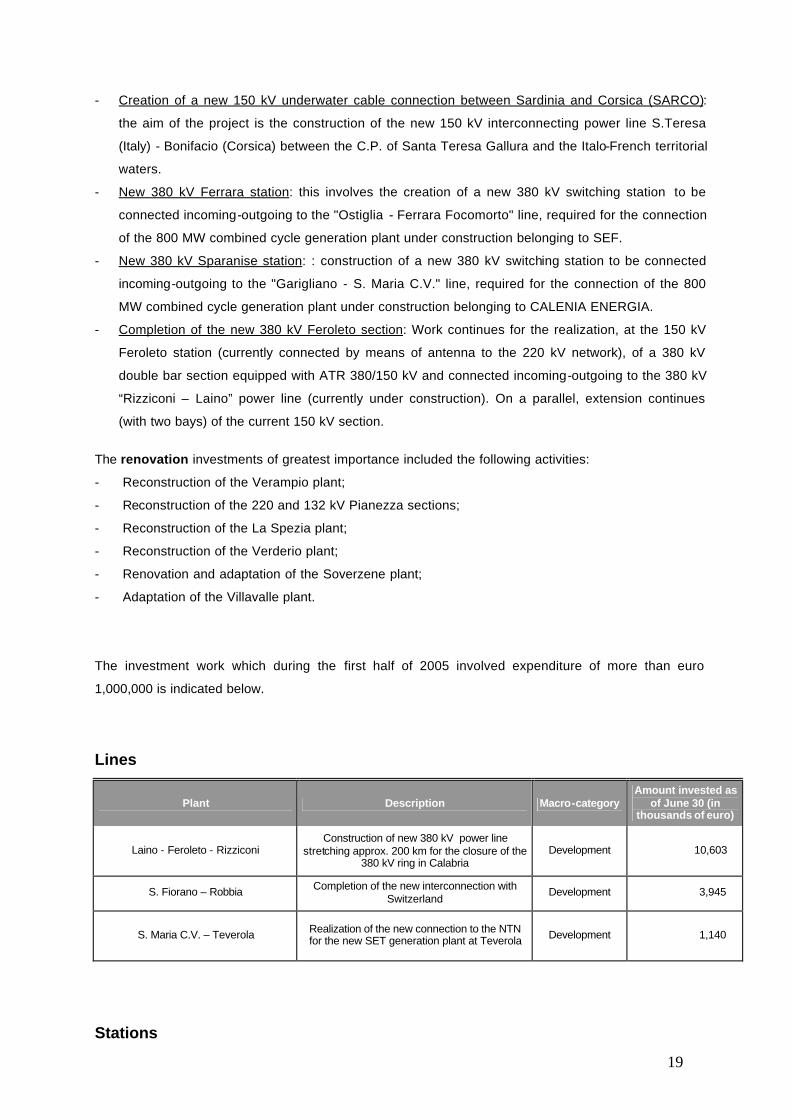
The investment work which during the first half of 2005 involved expenditure of more than euro
1,000,000 is indicated below.
Lines
Plant Description Macro-category Amount invested as
of June 30 (in thousands of euro)
Laino - Feroleto - Rizziconi Construction of new 380 kV power line
stretching approx. 200 km for the closure of the 380 kV ring in Calabria
Development 10,603
S. Fiorano – Robbia Completion of the new interconnection with Switzerland
Development 3,945
S. Maria C.V. – Teverola Realization of the new connection to the NTN for the new SET generation plant at Teverola Development 1,140
Stations
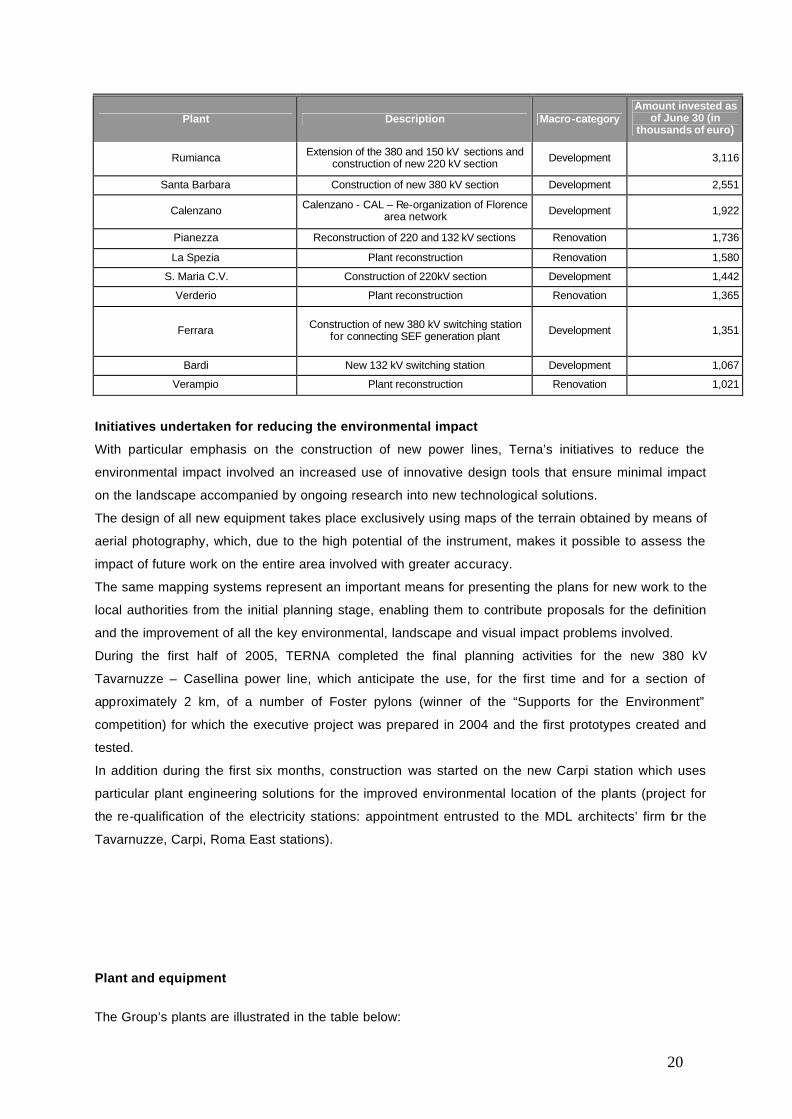
20
Plant Description Macro-category Amount invested as
of June 30 (in thousands of euro)
Rumianca Extension of the 380 and 150 kV sections and construction of new 220 kV section Development 3,116
Santa Barbara Construction of new 380 kV section Development 2,551
Calenzano Calenzano - CAL – Re-organization of Florence area network Development 1,922
Pianezza Reconstruction of 220 and 132 kV sections Renovation 1,736
La Spezia Plant reconstruction Renovation 1,580
S. Maria C.V. Construction of 220kV section Development 1,442
Verderio Plant reconstruction Renovation 1,365
Ferrara Construction of new 380 kV switching station for connecting SEF generation plant Development 1,351
Bardi New 132 kV switching station Development 1,067
Verampio Plant reconstruction Renovation 1,021
Initiatives undertaken for reducing the environmental impact
With particular emphasis on the construction of new power lines, Terna’s initiatives to reduce the
environmental impact involved an increased use of innovative design tools that ensure minimal impact
on the landscape accompanied by ongoing research into new technological solutions.
The design of all new equipment takes place exclusively using maps of the terrain obtained by means of
aerial photography, which, due to the high potential of the instrument, makes it possible to assess the
impact of future work on the entire area involved with greater accuracy.
The same mapping systems represent an important means for presenting the plans for new work to the
local authorities from the initial planning stage, enabling them to contribute proposals for the definition
and the improvement of all the key environmental, landscape and visual impact problems involved.
During the first half of 2005, TERNA completed the final planning activities for the new 380 kV
Tavarnuzze – Casellina power line, which anticipate the use, for the first time and for a section of
approximately 2 km, of a number of Foster pylons (winner of the “Supports for the Environment”
competition) for which the executive project was prepared in 2004 and the first prototypes created and
tested.
In addition during the first six months, construction was started on the new Carpi station which uses
particular plant engineering solutions for the improved environmental location of the plants (project for
the re-qualification of the electricity stations: appointment entrusted to the MDL architects’ firm for the
Tavarnuzze, Carpi, Roma East stations).
Plant and equipment
The Group’s plants are illustrated in the table below:

21
TERNA TSN NOVATRANS
N° Km N° Km N° Km
Stations 300 5 -
Transformers 567 14 -
Bays 3,918 29 10
Lines 34,979 1,077 1,278
Double -circuit lines 1,940 38,775 12 1,077 5 1,278
The number of stations has remained unchanged with respect to December 31, 2004.
With regards to the number of transformers, there was an overall reduction of 2 units due to the
following changes:
- 1 380/220 kV 400 MVA transformer out of service due to a fault at the Piossasco station as well
as 1 380/132 kV 160 MVA transformer at the Venaus station;
- the installation of a new 220/132 kV 160 MVA transformer at the Biella East station;
- the replacement at the Este station of the 220/132 kV 100 MVA transformer with another 160
MVA one.
Overall, the total transformation capacity dropped from 108,749 MVA at the end of 2004 to 108,409
MVA for the first half of 2005.
As far as power lines were concerned, an increase was seen in the length of double-circuit lines with
respect to December 31, 2004, by around 80 km. This increase was mainly due to the bringing onto
stream of the following new connections:
- 380 kV double-circuit power line (around 42 km) for interconnection with Switzerland (S. Fiorano
– Robbia);
- 150 kV Taloro 3 – Taloro 2 and Taloro 2 – Taloro 1 lines (for an approximate total of 14 km);
which were countered by the shutdown of several sections of the former 220 kV Este – Colunga
connection.
There were no changes at the plants in Brazil.
22
Research and development activities
As far as research activities which require professional skills were concerned, TERNA avails of the
collaboration of CESI S.p.A. in which it holds a 15% equity investment.
The related costs incurred during the period amounted to approximately euro 0.6 million.
Technological innovation
1. New plant engineering technologies
Installation of high temperature conductors with greater transport capacity
The ever rising need for an increase in the energy to be transported and the growing difficulties in
constructing new power lines, oblige the search for solutions capable of maximizing the exploitation of
the existing lines. During the first half of the year, it was ascertained that a possible solution might be
that of replacing the conductors with others of the same size but featuring an innovative technology
capable of permitting the transit of greater energy (up to 150%); in fact, these new conductors can
operate at extremely high temperatures without dilating too much and therefore without changing the
distances of the conductors from the ground thereby permitting the use of existing structures. The type
of conductors was identified and during the second half of the year steps will be taken to purchase the
conductors and install them experimentally on the 150kV Spoleto-Villavalle line; furthermore, once again
during the second half of the year, the performance of surveys is anticipated on the 380kV Benevento
Foggia line in order to then proceed with the executive planning of the replacement of the conductors
with other innovative models.
Technical experimentation for helicopter-borne laser detection
One of the main problems with regards to the management of the power lines is that of detecting the
distances of the conductors from the ground and above all else from possible interference (plants,
buildings, other structures) which may represent a danger.
The project consists in the experimentation of the detection of distances by means of a laser-gauging
system; the system, helicopter-mounted, carries out high speed laser scanning, sending back the
information with a degree of precision of just a few centimetres. The results can be used as the basis for
mechanical assessments and modification planning, both in order to evaluate the need for cutting back
plants and trees and for monitoring the occurrence of new structures. Lastly, the possibility of also
detecting physical anomalies affecting the conductors and other components will also be assessed.
During the first half of the year, a specific technique was set up for the performance of the surveys;
practical application on two power lines is anticipated during the second half of 2005.
Diffusion of on-line transformer monitoring systems
The transformers are the most important equipment both as a result of the impact on the business and
due to the elevated cost. The breakdown of a transformer always has serious consequences; therefore
it is appropriate to aim at the installation of expedient sensors which make it possible to identify the
23
occurrence of anomalies thereby permitting action to be taken before the fault occurs. The project
involves the installation of appropriate gas sensors dissolved in water, whose consistence is an
indicator of the presence of anomalies, linked up to the expert support system for maintenance, “MBI”.
During the first six months, the design and planning was carried out and the necessary equipment was
identified; installation is expected during the second half of the year.
New compact electricity station solutions
The need to create stations within limited spaces together with that of speeding up the construction
timescales, has led to the identification of compact technological solutions which nevertheless feature
contained costs. The project involves the identification of new integrated equipment which, opportunely
installed, makes it possible to construct electricity stations in smaller spaces, within shorter timescales
and, in relation to the lesser number of elementary components and the high level of integration, with a
lower expected fault rate. Overall, the solution would feature costs and realization timescales which are
lower, combined with greater reliability. During the first half of the year, the equipment was sourced, the
project created and work started; during the second half, installation is anticipated alongside the launch
of experimentation in the field at Villanova.
2. MBI system
The MBI (Monitoring & Business Intelligence) system is an expert information system supporting the
decisions concerning the maintenance of the plants. It is divided up into two sections: the first
supporting the short-term operations and therefore the scheduling and execution of the checks and
maintenance, the second supporting the decisions and on-going improvement providing specific reports
both on the efficacy and the efficiency of the measures and also the productivity of the activities. During
the first half of the year, the system was completed for the stations and the operating section brought on
stream for the lines. During the second half of the year, activation of the section supporting the
decisions for the lines is anticipated.
3. Introduction of New Operating Procedures (Work on live equipment)
Works carried out on live equipment are operating methods which make it possible to perform checks
and maintenance on the lines and stations, while keeping them in service and therefore improving the
availability of the electricity system.
Set-up of new methods in stations
The project involves the study and experimentation of methods for reviewing disconnecting switches
and high voltage connections in stations, which represent the most recurrent activities and therefore
those which have the greatest impact on out-of-service conditions. During the first half of the year, the
methods were studied; experimentation within the field is anticipated during the second half of 2005.
Industrialization of the replacement of guard cables
24
Recently, a method has been tried and tested for the replacement of the guard cables of the power lines
in service; the objective is to make the method simpler albeit in observance of the safety conditions
which must be ensured.
4. Computerization of flows and operating activities
SDSA (Automatic system supporting station design)
The system permits the automatic design of the electricity stations starting off from the single-wire
diagram using an extensive range of elementary modules - pre-defined for all the voltage levels - which
make up the technical library. In addition to the design, the system permits the automatic estimation, the
automatic issue of the purchase requests and the management of the entire design stage. The aim of
the system is to standardize and speed up the station designs phases. During the first half of the year,
the project was completed; the training of the staff and the bringing onto stream of the system is
anticipated during the second part of the year.
GIS Network (Geographic Information System)
This is an information system which permits the graphic representation of the electricity network on a
geographic system providing a wide range of information useful for the running and maintenance of the
electricity network. In addition to the exact positioning of the power line throughout the territory, the
system makes it possible to highlight all the possible interferences, all the technical information of the
individual components as well as the data relating to faults or anomalies which have occurred, and
measures underway. In conclusion, the system permits the handling of topics such as the ceraunic
level, pollution, seismicity, hydrography, etc. The objective is to facilitate the operating activities making
the salient information for the management of the network with reference to the territory available rapidly
to the technicians. During the first half of the year, the system was completed; during the second half,
the bringing onto stream and the development of a quick-to-use graphic interface is anticipated.
CMS (Contract Management System)
The CMS is a system supporting the general and detailed estimation operating activities for external
services, the adequacy checks on the offers and the subsequent negotiation, and the drawing up of the
final balance of the work on the power lines: The aim of the system is to increase the quality and the
reliability of the purveying and to reduce the costs of the outside resources.
The application with the use of a sophisticated system of libraries and models of the activities,
continually up-dated by the operating information gathered at the sites by means of the use of palm-top
computers, permits an accurate analysis of the costs of the activities useful for design engineers and
buyers.
The system also provides information useful for the subsequent reports supporting Vendor Rating,
Supplier Qualification, market analysis, the accomplishment of tenders and purveying in general.
SICAS Standard
25
The SICAS STANDARD project sets itself the objective of the migration of the current systems for the
protection, control and automation of the electricity stations, based on electro-mechanical technologies,
to the new distributed intelligence digital technologies, in compliance with the new international standard
IEC 61850, which ensures the inter-operativity between components of different manufacturers and the
maximum economy of scale.
The project has entered into the final stage, with three manufacturers of primary importance in the
automation industry: it is expected that trials for the certification of the related systems will be carried out
as from November 2005.
SICAS STANDARD’s impact on the management economy is of considerable interest, especially as a
result of the tangible possibility of integrating within one system all the functions carried out today by
separate devices, involving a consequent reduction in the overall investment costs. The benefits extend
to the running costs, since the new technologies and the specific engineering of the Terna project will
make it possible to carry out the majority of the checks and maintenance by means of remote
management systems.
26
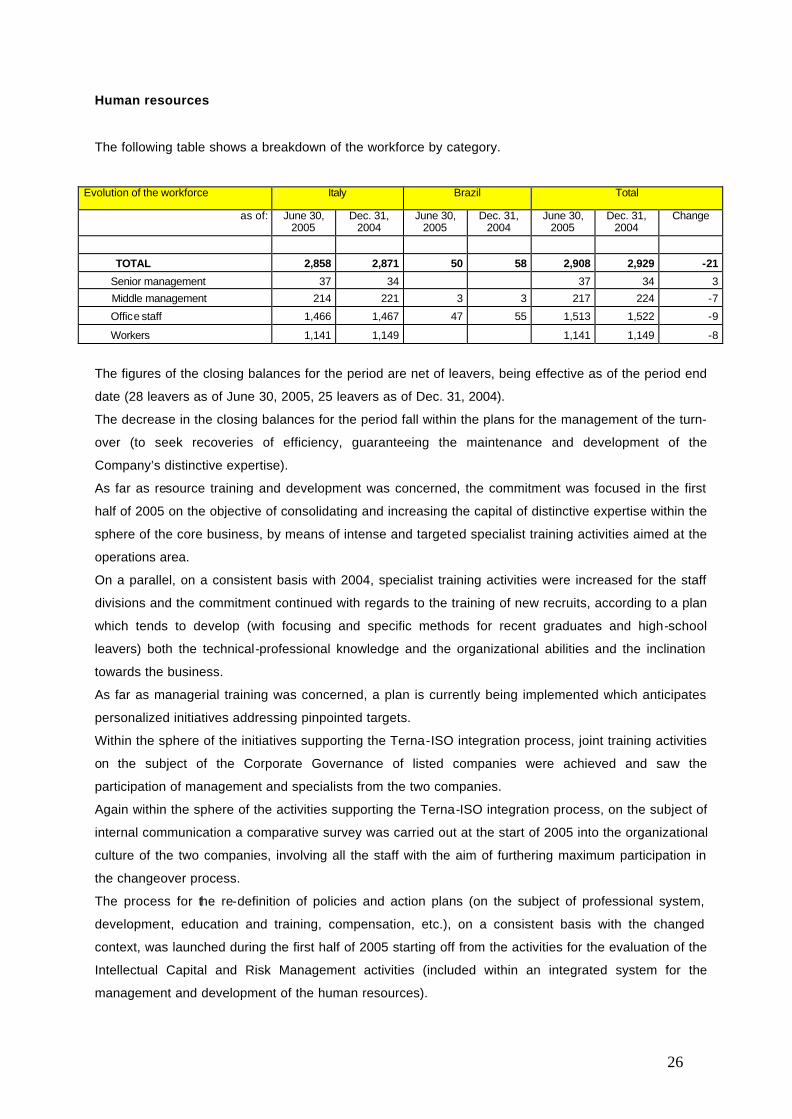
Human resources
The following table shows a breakdown of the workforce by category.
Evolution of the workforce Italy Brazil Total
as of: June 30, 2005
Dec. 31, 2004
June 30, 2005
Dec. 31, 2004
June 30, 2005
Dec. 31, 2004
Change
TOTAL 2,858 2,871 50 58 2,908 2,929 -21
Senior management 37 34 37 34 3
Middle management 214 221 3 3 217 224 -7
Office staff 1,466 1,467 47 55 1,513 1,522 -9
Workers 1,141 1,149 1,141 1,149 -8
The figures of the closing balances for the period are net of leavers, being effective as of the period end
date (28 leavers as of June 30, 2005, 25 leavers as of Dec. 31, 2004).
The decrease in the closing balances for the period fall within the plans for the management of the turn-
over (to seek recoveries of efficiency, guaranteeing the maintenance and development of the
Company’s distinctive expertise).
As far as resource training and development was concerned, the commitment was focused in the first
half of 2005 on the objective of consolidating and increasing the capital of distinctive expertise within the
sphere of the core business, by means of intense and targeted specialist training activities aimed at the
operations area.
On a parallel, on a consistent basis with 2004, specialist training activities were increased for the staff
divisions and the commitment continued with regards to the training of new recruits, according to a plan
which tends to develop (with focusing and specific methods for recent graduates and high-school
leavers) both the technical-professional knowledge and the organizational abilities and the inclination
towards the business.
As far as managerial training was concerned, a plan is currently being implemented which anticipates
personalized initiatives addressing pinpointed targets.
Within the sphere of the initiatives supporting the Terna-ISO integration process, joint training activities
on the subject of the Corporate Governance of listed companies were achieved and saw the
participation of management and specialists from the two companies.
Again within the sphere of the activities supporting the Terna-ISO integration process, on the subject of
internal communication a comparative survey was carried out at the start of 2005 into the organizational
culture of the two companies, involving all the staff with the aim of furthering maximum participation in
the changeover process.
The process for the re-definition of policies and action plans (on the subject of professional system,
development, education and training, compensation, etc.), on a consistent basis with the changed
context, was launched during the first half of 2005 starting off from the activities for the evaluation of the
Intellectual Capital and Risk Management activities (included within an integrated system for the
management and development of the human resources).
27
Long-term incentive systems
On the basis of the proposals presented by the Remuneration Committee, during the meeting held on
May 9, 2005, the Board of Directors voted for the adoption of the stock option Plan relating to the year
2005 and approved the related regulations.
The plan anticipates the offer of 9,950,000 options to be distributed, in total, to around 20 executives,
belonging to Terna Spa and/or its subsidiaries pursuant to Article 2359 of the Italian Civil Code, who
cover the most significant functions for the purposes of the achievement of the Company’s strategic
results. The overall number of the beneficiaries (20) also includes the ISO executives who will be
identified among those who will join Terna; the Plan will be extended to the latter individuals at the time
of the merger under the same terms and conditions, with the exception of the subscription price which
will be established at the time of the offer itself to the executives, according to the formalities indicated
below.
The approved regulations of the stock option plan:
1. anticipate that the strike price of each share is determined to the extent equating to the arithmetic
average of the reference prices of ordinary TERNA S.p.A. stock struck by Borsa Italiana S.p.A.’s
screen-based system in the period running from the date of the offer and the same day of the previous
calendar month;
2. define the following as the conditions for the exercise of the options – having the nature of
abeyance conditions – :
(a) the TERNA S.p.A. Group EBITDA relating to the year of allocation (2005) and indicated in the
Group budget approved by the Board of Directors, is to have been exceeded;
(b) the percentage change between the reference price of the TERNA S.p.A. stock reported by
Borsa Italiana S.p.A.’s screen-based system as of January 1, in the year in which the allocation of the
Options took place and the same price as of December 31, of the same year, must be greater than the
percentage change reported in the same period of time by the Reference Index (50% MIBTEL and 50%
FTSE 300 Electricity). For the purposes of this calculation, both the percentage change of the reference
price of the TERNA S.p.A. stock and the percentage change of the Reference Index will be adjusted in
order to take into account the effect of the distribution of the respective gross dividends (ordinary and
extraordinary including therein any bonus allocations of shares), within a logic of Total Shareholders'
Return.
Both exercise conditions must be met for the exercise of the options themselves by the beneficiaries to
be possible.
3. means that the subscription of the shares, at a price equating to the “strike price”, is the entire
responsibility of the beneficiaries, since the plan does not anticipate any concession in this connection.
4. lays down that the options, if the exercise conditions are achieved, can be exercised (i) in relation to
a portion of 30% as from the year following that of allocation, (ii) in relation to a portion of 60% as from
the second year following that of allocation and (iii) in relation to a portion of 100% as from the third year
following that of allocation. All the options allocated and which have become exercisable must be
exercised by March 31, 2010. The options can be effectively exercised only on open stockmarket days
28
including the last 10 days of each month, unless these fall within the 3 open stockmarket days prior to
the so-called “coupon detachment” or in the two “blocking periods”, lasting one month each, established
in proximity of the approval of the draft statutory financial statements and the interim report by the Board
of Directors.
During the first half of 2005, the application of the stock option plan led to the allocation of 3,899,000
options, characterized by a strike price of euro 2.098, to 9 executives of the Company. Verification of
the achievement of the exercise conditions, as described above, will be made by the Board of Directors
at the time of the approval of the draft financial statements for 2005.
The Board of Directors has also resolved to adopt - for the managers of the Company and the ISO who
will join Terna not involved or who will not be involved in the stock option plan – a long-term incentive
plan (LTI), linked to the achievement of challenging long-term performance objectives and the stock
performance, postponing the definition of the objectives for the disbursement of the incentives
established therein until the merger with the ISO.
Transactions with related parties
Related parties were identified taking as reference the provisions of the CONSOB Communication No.
2064231 dated September 30, 2002.
With regard to the Terna Group’s transactions during the first half of 2005, they are represented by
transactions with subsidiary companies and companies belonging to the ENEL Group.
The transactions carried out by Terna with related parties mainly concern the exchange of goods, the
provision of services the lending of financial resources, the coverage of insurance risks, as well as
administrative, tax, legal and corporate assistance.
All the transactions form part of the ordinary operations and are regulated on an arms’-length basis, in
other words at conditions which would be applied between two independent parties.
Lastly, shareholders are reminded that within the sphere of the corporate governance regulations which
the Terna Group has adopted, the conditions have been anticipated for ensuring that the transactions
with related parties are carried out in observance of the criteria of procedural and substantive
correctness.
Transactions with related parties are indicated in the explanatory notes within the commentary to the
individual balance sheet items.
29
Corporate Governance
Introduction The corporate governance system in existence within the Company is
consistent with the principles contained in the Code of Self-governance for
listed companies, with the recommendations formulated by the CONSOB on the
subject and, more generally, with the best practice established internationally.
This corporate governance system essentially has the aim of creating value for
the shareholders, in awareness of the social importance of the activities which
the Group is involved in and the consequent need to adequately consider, with
regards to related performance, all the interests involved.
The changes during the first half of 2005 are illustrated below. Shareholding set up
The Company’s share capital is entirely made up of ordinary shares, which are
completely unrestricted and endowed with the right to vote both during ordinary
general meetings of the shareholders and extraordinary sessions.
On the basis of the results of the shareholders’ register and the information
available, the only party – with the exception of Enel S.p.A., holder of 36.142%
of the share capital, whose management and co-ordination activities Terna is
subject to – who holds an interest in the share capital greater than 2%, is the
shareholder Assicurazioni Generali SpA who directly and indirectly via its
subsidiaries holds 5.296% of Terna’s share capital. There is no evidence of
shareholders’ agreements covering the Company’s shares.
Board of Directors Resignation of Directors
As from June 30, 2005 the Director Salvatore Sardo tendered his resignation
from office, in relation to the conclusion of his activities within the Enel Group.
Board of Statutory Auditors
In accordance with the provisions of the Company’s By-laws, the Board of
Statutory Auditors is made up of three acting Auditors and two alternate
Auditors, appointed for a period of three years; they can be re-elected on expiry
of their mandate.
All the members of the Board of Statutory Auditors must possess the requisites
of respectability and professionalism requested by special legislation
concerning the auditors of companies with listed shares, being supplemented
by means of specific provisions of the By-laws; furthermore, on the basis of said
By-laws, they cannot cover the office of acting auditor in more than four
companies which issue securities issued on organized markets.
30
On a similar basis to the matters laid down for the Board of Directors, the By-
laws anticipate that the appointment of the entire Board of Statutory Auditors
should take place by means of the “list voting” mechanism, aimed at
guaranteeing a presence within the supervisory body of an acting Auditor and
an alternate Auditor appointed by the minority shareholders. This system was
applied for the first time during the renewal of the Board of Statutory Auditors,
appointed by the ordinary shareholders’ meeting held on April 1, 2005; this
Board currently comprises the following acting Auditors: Giovanni Ferreri
(Chairman), Giancarlo Russo Corvace and Roberto Tasca, the first of which
confirmed in the office. The following individuals were also appointed as
alternate Auditors: Bruno Franceschetti and Vito Di Battista. The Board of
Statutory Auditors thus appointed will remain in office until approval of the
statutory financial statements for 2007.
A brief professional resume of the acting Auditors is presented below.
Ø Giovanni Ferreri, 70 years old, Chairman Graduate in law from the “La Sapienza” University in Rome, he passed his bar exams in 1961 and since 1975 has been a member of the counsel for the defence at the Supreme Court. He is also an auditor and joint-owner with Gianfranco Graziadei of the international law firm Graziadei – Ferreri, with head offices in Rome and branches in Milan, Munich and New York. He also covers the office of Deputy Chairman of A.S Roma SpA.
Ø Giancarlo Russo Corvace, 52 years old, Acting Auditor Graduate in business studies from Rome’s LUISS University, he also gained a Masters in Business Administration at the Scuola di Amministrazione Aziendale at Turin University. Business consultant and chartered accountant, until 1985 he carried out his own activities at the Department of Financial Affairs of Banca Nazionale del Lavoro and until 1988 covered the offices of Chief Executive Officer with the company Ifigest Fiduciaria Sim S.p.A. (now Banca Ifigest). Since 1989 he has been a partner of the law firm Graziadei - Ferreri at the Rome head offices.
Ø Roberto Tasca, 43 years old, Acting Auditor Graduate in Business Economics from the “Luigi Bocconi” commercial university. Since 2001 he has been an Extraordinary Professor of the Economics of Financial Brokers at the Faculty of Economics at Bologna University. Between 1992 and 2000 he covered various university lecturing positions at Bologna University and the Luigi Bocconi University in Milan. He is the author of numerous essays and monographs on various subjects dealing with the economics of financial brokerage, as well as a lecturer at SDA Bocconi and the University of Bologna for various Masters’ courses.
General shareholders’ meetings
During the first half of 2005, the general meeting of the shareholders’ held on
January 31, 2005, resolved, in extraordinary session, to approve the
amendments to the By-laws requested by the Decree of the Prime Minister
dated May 11, 2004 (“DPCM”), containing “Criteria, methods and conditions for
the unification of the ownership and the management of the National
Transmission Network”, in view of the unification of the ownership and the
31
management of the national electricity transmission network. The afore-
mentioned change to the By-laws will become applicable only as from the date
of transfer to Terna of the activities of the Gestore della Rete di Trasmissione
Nazionale SpA (ISO), in accordance with the matters anticipated by the afore-
mentioned DPCM.
During the extraordinary session, the general shareholders’ meeting held on
April 1, 2005 also resolved the approval of the By-law amendments concerning
the mandate granted to the Board of Directors to increase the share capital in
view of future stock option plans reserved for Company management. During
the same meeting, in ordinary session, the shareholder’s meeting resolved the
approval of the statutory financial statement for 2004 and the distribution of the
dividend as well as the renewal of the Board of Statutory Auditors, whose
mandate had expired, together with the related emoluments.
In relation to the matters anticipated by Consob resolution No. 14955 dated 23
March 2005 concerning the right to attend general shareholders’ meetings, the
Board meeting held on May 9, 2005 resolved the consequent adaptations to the
By-laws.
32
Outlook for the rest of 2005
During the remaining part of the accounting period, the revenue from the Terna SpA network rental will
follow the seasonal trend established by the Electricity and Gas Board (AEEG) with the time bands
introduced by resolution No. 05/04 and updated by resolution No. 235/04; this involves the
concentration of the more remunerative bands in the summer period. It is believed that the revenues of
the Terna Group for the remaining part of the year will remain at the levels seen last year. As far as
costs are concerned, a slight increase is foreseeable due to the increased concentration of activities in
the second half of the year and as a result of amortization/depreciation following the coming onto
stream of new plants.
The acquisition of the ISO business segment (possible as from 1° November) will have a lightly negative
overall impact on the results for the year, since the positive contribution of the business segment will be
counterbalanced by one-off negative effects such as the registration tax, costs for outside resources
linked to logistics and IT costs as well as additional charges relating to the long-term incentive systems.
The net financial debt is expected to rise with respect to the level seen at the end of June 2005, if one
takes into account the effect of the 2005 advance dividend payment, the acquisition of the ISO business
segment and the equity investment in Acea Trasmissione as well as additional investments in tangible
fixed assets anticipated in the remaining part of the year, net of the cash flow generated by current
operations.
Consolidated Accounting Schedules
TERNA Group - Consolidated Changes
INCOME STATEMENT for the
in millions of euro period
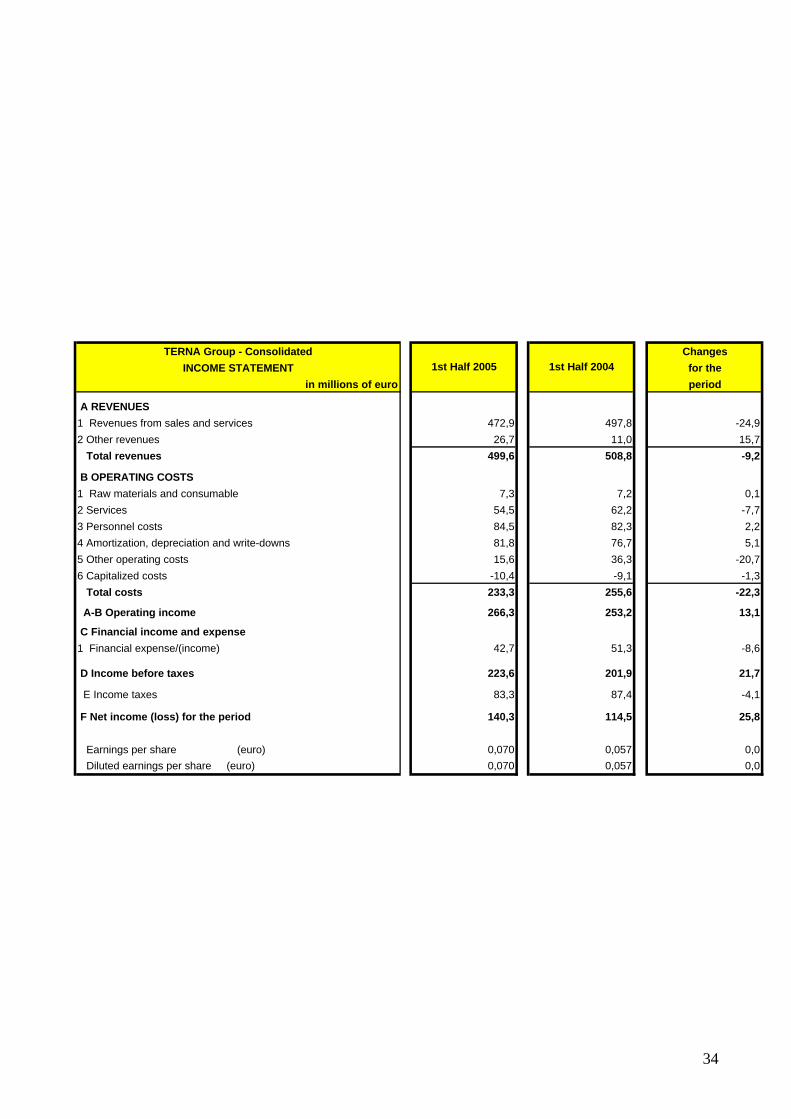
A REVENUES
1 Revenues from sales and services 472,9 497,8 -24,9
2 Other revenues 26,7 11,0 15,7
Total revenues 499,6 508,8 -9,2
B OPERATING COSTS
1 Raw materials and consumable 7,3 7,2 0,1
2 Services 54,5 62,2 -7,7
3 Personnel costs 84,5 82,3 2,2
4 Amortization, depreciation and write-downs 81,8 76,7 5,1
5 Other operating costs 15,6 36,3 -20,7
6 Capitalized costs -10,4 -9,1 -1,3
Total costs 233,3 255,6 -22,3
A-B Operating income 266,3 253,2 13,1
C Financial income and expense
1 Financial expense/(income) 42,7 51,3 -8,6
D Income before taxes 223,6 201,9 21,7
E Income taxes 83,3 87,4 -4,1
F Net income (loss) for the period 140,3 114,5 25,8
Earnings per share (euro) 0,070 0,057 0,0 Diluted earnings per share (euro) 0,070 0,057 0,0
1st Half 2005 1st Half 2004
34
TERNA Group - Consolidated Changes
BALANCE SHEET - ASSETS for the
in millions of euro period
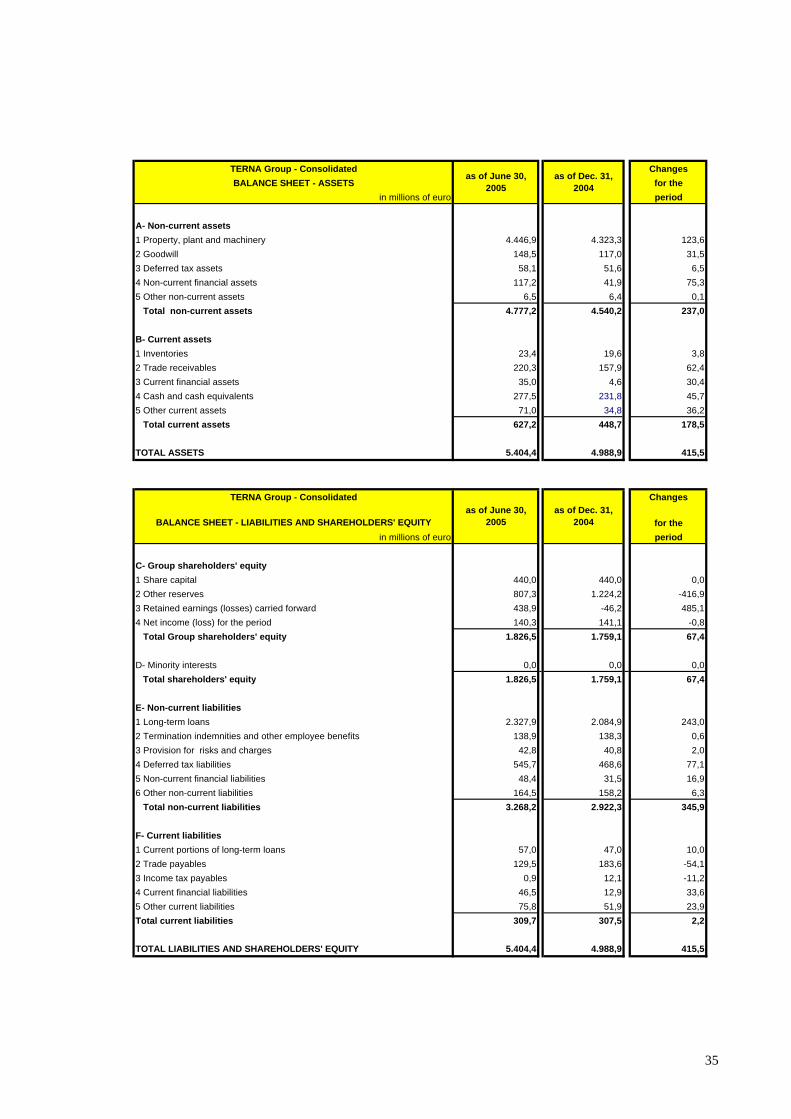
A- Non-current assets
1 Property, plant and machinery 4.446,9 4.323,3 123,6
2 Goodwill 148,5 117,0 31,5
3 Deferred tax assets 58,1 51,6 6,5
4 Non-current financial assets 117,2 41,9 75,3
5 Other non-current assets 6,5 6,4 0,1
Total non-current assets 4.777,2 4.540,2 237,0
B- Current assets
1 Inventories 23,4 19,6 3,8
2 Trade receivables 220,3 157,9 62,4
3 Current financial assets 35,0 4,6 30,4
4 Cash and cash equivalents 277,5 231,8 45,7
5 Other current assets 71,0 34,8 36,2
Total current assets 627,2 448,7 178,5
TOTAL ASSETS 5.404,4 4.988,9 415,5
TERNA Group - Consolidated Changes
BALANCE SHEET - LIABILITIES AND SHAREHOLDERS' EQUITY for the
in millions of euro period
C- Group shareholders' equity
1 Share capital 440,0 440,0 0,0
2 Other reserves 807,3 1.224,2 -416,9
3 Retained earnings (losses) carried forward 438,9 -46,2 485,1
4 Net income (loss) for the period 140,3 141,1 -0,8
Total Group shareholders' equity 1.826,5 1.759,1 67,4
D- Minority interests 0,0 0,0 0,0
Total shareholders' equity 1.826,5 1.759,1 67,4
E- Non-current liabilities
1 Long-term loans 2.327,9 2.084,9 243,0
2 Termination indemnities and other employee benefits 138,9 138,3 0,6
3 Provision for risks and charges 42,8 40,8 2,0
4 Deferred tax liabilities 545,7 468,6 77,1
5 Non-current financial liabilities 48,4 31,5 16,9
6 Other non-current liabilities 164,5 158,2 6,3
Total non-current liabilities 3.268,2 2.922,3 345,9
F- Current liabilities
1 Current portions of long-term loans 57,0 47,0 10,0
2 Trade payables 129,5 183,6 -54,1
3 Income tax payables 0,9 12,1 -11,2
4 Current financial liabilities 46,5 12,9 33,6
5 Other current liabilities 75,8 51,9 23,9
Total current liabilities 309,7 307,5 2,2
TOTAL LIABILITIES AND SHAREHOLDERS' EQUITY 5.404,4 4.988,9 415,5
as of June 30, 2005
as of Dec. 31, 2004
as of June 30, 2005
as of Dec. 31, 2004
35
36
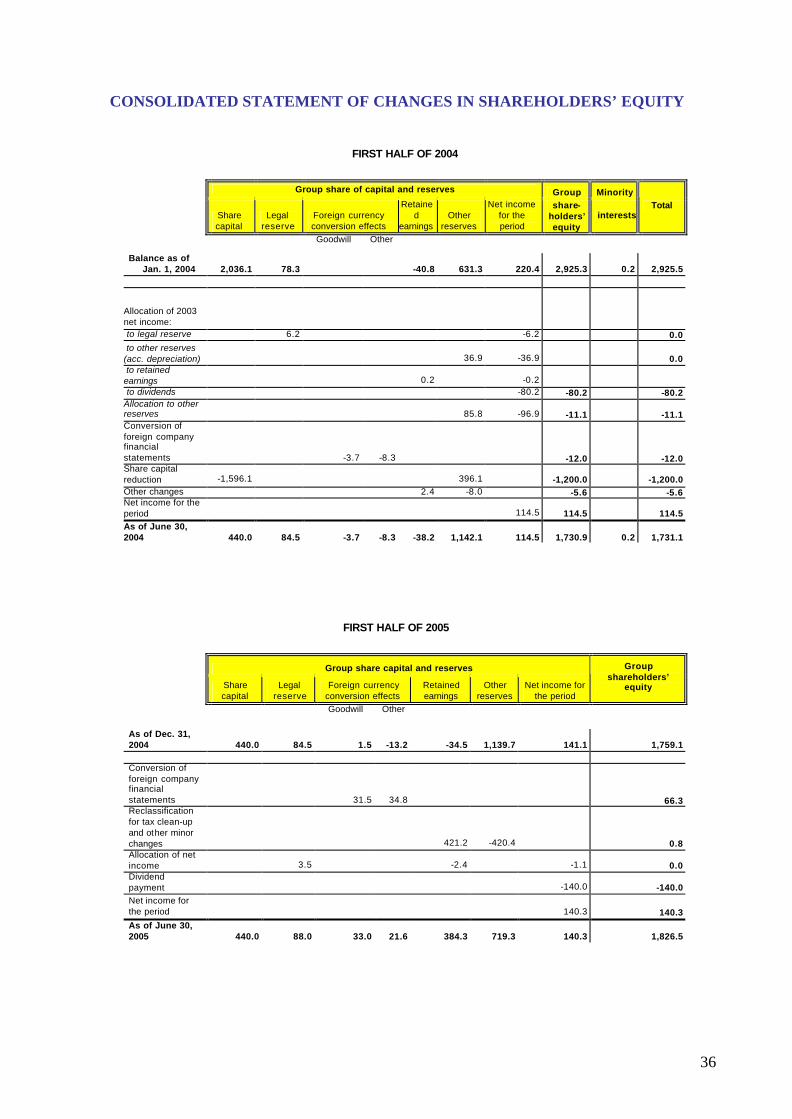
CONSOLIDATED STATEMENT OF CHANGES IN SHAREHOLDERS’ EQUITY
FIRST HALF OF 2004
Group share of capital and reserves Group Minority
Share capital
Legal reserve
Foreign currency conversion effects
Retained
earnings Other
reserves
Net income for the period
share-holders’ equity
interestsTotal
Goodwill Other
Balance as of
Jan. 1, 2004 2,036.1 78.3 -40.8 631.3 220.4 2,925.3 0.2 2,925.5
Allocation of 2003 net income: to legal reserve 6.2 -6.2 0.0 to other reserves (acc. depreciation) 36.9 -36.9 0.0 to retained earnings 0.2 -0.2 to dividends -80.2 -80.2 -80.2 Allocation to other reserves
85.8 -96.9 -11.1 -11.1
Conversion of foreign company financial statements -3.7 -8.3 -12.0 -12.0 Share capital reduction -1,596.1 396.1 -1,200.0 -1,200.0 Other changes 2.4 -8.0 -5.6 -5.6 Net income for the period 114.5 114.5 114.5 As of June 30, 2004 440.0 84.5 -3.7 -8.3 -38.2 1,142.1 114.5 1,730.9 0.2 1,731.1
FIRST HALF OF 2005
Group share capital and reserves
Share capital
Legal reserve
Foreign currency conversion effects
Retained earnings
Other reserves
Net income for the period
Group shareholders’
equity
Goodwill Other
As of Dec. 31, 2004 440.0 84.5 1.5 -13.2 -34.5 1,139.7 141.1 1,759.1
Conversion of foreign company financial statements 31.5 34.8 66.3 Reclassification for tax clean-up and other minor changes 421.2 -420.4 0.8 Allocation of net income 3.5 -2.4 -1.1 0.0 Dividend payment -140.0 -140.0 Net income for the period 140.3 140.3 As of June 30, 2005 440.0 88.0 33.0 21.6 384.3 719.3 140.3 1,826.5
37
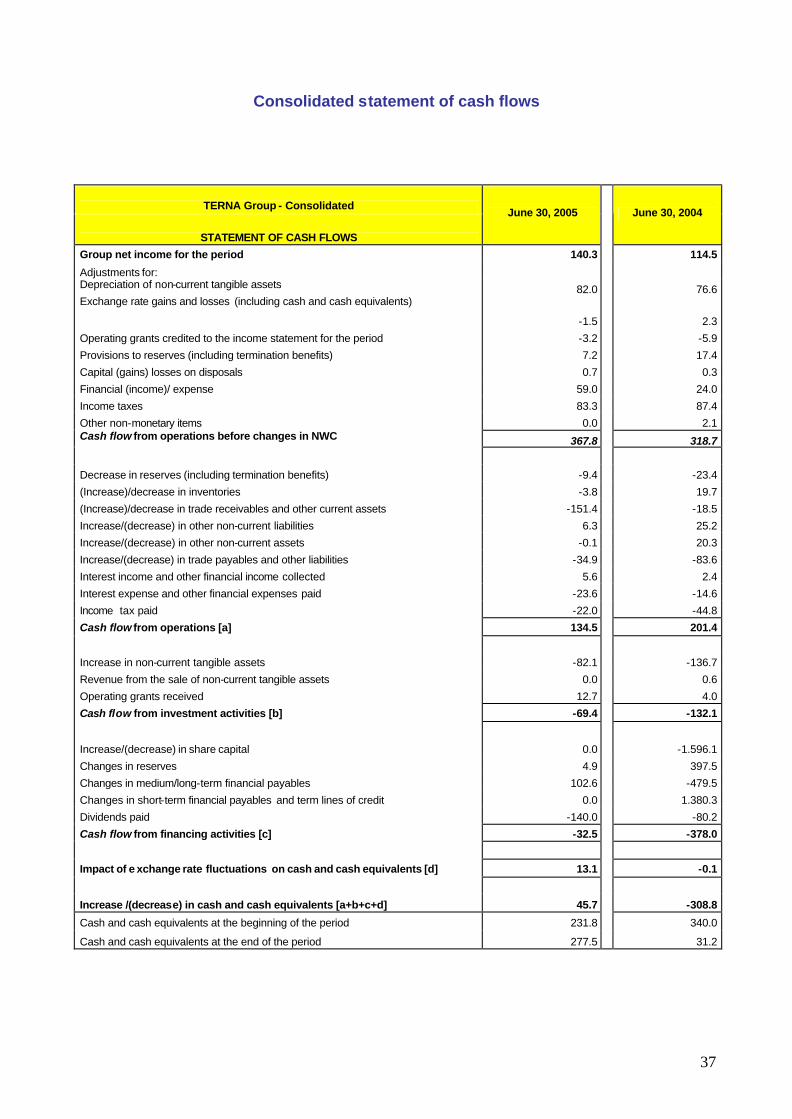
Consolidated statement of cash flows
TERNA Group - Consolidated
STATEMENT OF CASH FLOWS
June 30, 2005
June 30, 2004
Group net income for the period 140.3 114.5
Adjustments for: Depreciation of non-current tangible assets 82.0 76.6 Exchange rate gains and losses (including cash and cash equivalents)
-1.5 2.3
Operating grants credited to the income statement for the period -3.2 -5.9
Provisions to reserves (including termination benefits) 7.2 17.4
Capital (gains) losses on disposals 0.7 0.3
Financial (income)/ expense 59.0 24.0
Income taxes 83.3 87.4
Other non-monetary items 0.0 2.1 Cash flow from operations before changes in NWC 367.8 318.7
Decrease in reserves (including termination benefits) -9.4 -23.4
(Increase)/decrease in inventories -3.8 19.7
(Increase)/decrease in trade receivables and other current assets -151.4 -18.5
Increase/(decrease) in other non-current liabilities 6.3 25.2
Increase/(decrease) in other non-current assets -0.1 20.3
Increase/(decrease) in trade payables and other liabilities -34.9 -83.6
Interest income and other financial income collected 5.6 2.4
Interest expense and other financial expenses paid -23.6 -14.6
Income tax paid -22.0 -44.8
Cash flow from operations [a] 134.5 201.4
Increase in non-current tangible assets -82.1 -136.7
Revenue from the sale of non-current tangible assets 0.0 0.6
Operating grants received 12.7 4.0
Cash flow from investment activities [b] -69.4 -132.1
Increase/(decrease) in share capital 0.0 -1.596.1
Changes in reserves 4.9 397.5
Changes in medium/long-term financial payables 102.6 -479.5
Changes in short-term financial payables and term lines of credit 0.0 1.380.3
Dividends paid -140.0 -80.2
Cash flow from financing activities [c] -32.5 -378.0
Impact of e xchange rate fluctuations on cash and cash equivalents [d] 13.1 -0.1
Increase /(decrease) in cash and cash equivalents [a+b+c+d] 45.7 -308.8
Cash and cash equivalents at the beginning of the period 231.8 340.0
Cash and cash equivalents at the end of the period 277.5 31.2
38
Explanatory notes to the statement of cash flows
The liquidity generated by operations during the first half of the year came to approximately euro 134.5
million, attributable to operations before the changes in net working capital (self-financing for the period,
income taxes, financial income and expense) amounting to around euro 367.8 million, and to the decrease in
working capital of approximately euro 233.3 million.
During the first six months of the year, investment activities absorbed liquidity of around euro 69.4 million
and concerned investments in tangible fixed assets amounting to approximately euro 82 million.
Flows of shareholders’ equity disclose the balance of the 2004 dividend payment, while the change in net
financial debt was negative during the period by around euro 102.6 million.
The change in cash originated by the afore-mentioned appreciation of the exchange rate came to euro 13.1
million; as a result of these changes, the liquidity generated during the period under review amounted to euro
45.7 million.
Notes to the interim financial statements
40
ACCOUNTING POLICIES AND STANDARDS
Compliance with the IAS/IFRS
The consolidated interim report of the Terna Group as of June 30, 2005 has been drawn up in pursuance of
international accounting standard No. 34 applicable for interim financial disclosure, in accordance with the
matters laid down by Article 81 of the “Issuers’ Regulations” No. 11971/1999 and subsequent
amendments.
The Terna Group adopted the international accounting standards - International Financial Reporting
Standards (IFRS) – as from the 2005 accounting period; while the transition date to the IFRS was January
1, 2004. The last set of consolidated financial statements drawn up in accordance with the Italian
accounting principles refers to the accounting period ended December 31, 2004.
The consolidated accounting schedules and the related explanatory notes (hereinafter the consolidated
interim financial statements) have been drawn up in compliance with the International Financial Reporting
Standards in force as of the date of preparation of the same, inclusive of the IFRS recently adopted by the
International Accounting Standards Board (IASB), the International Accounting Standards (IAS) and the
interpretations of the International Financial Reporting Interpretations Committee (IFRIC) and the Standing
Interpretations Committee (SIC). It is assumed that these standards are those which will be in force at the
time of the preparation of the consolidated financial statements as of December 31, 2005; however, it may
also be that they do not coincide with those in force at the end of 2005 as a result of both the new
guidelines of the European Commission concerning their ratification and the issue of new standards or
interpretations by the competent bodies.
In these consolidated interim financial statements, the comparative data pertaining to the corresponding
periods in 2004 was reclassified in accordance with the international accounting standards; an attachment
illustrates the effects of the adoption of the IFRS on the balances as of June 30, 2004 originally published
and drawn up in accordance with the Italian accounting principles.
Reference should be made to the document “Transition to the international accounting standards (IFRS)”
attached to this interim report for the effects of the adoption of the IFRS on the Terna Group balance sheet
as of December 31, 2004 and as of the date of transition (January 1, 2004), on the 2004 income
statement, as well as on the choices made at the time of initial application.
Basis of presentation
The consolidated interim financial statements comprise the balance sheet, the income statement, the
cash flows statement, the statement of changes in shareholders’ equity and the explanatory notes.
The accounting policies and standards adopted are consistent with those used for the preparation of the
statements for transition to the IFRS as of January 1, 2004 and as of December 31, 2004.
Shareholders are informed that the income statement has been reclassified on the basis of the nature of
the costs, while the statement of cash flows is presented using the indirect method.
41
The consolidated interim financial statements are presented in euro and all the balances are expressed in
millions of euro unless otherwise indicated.
By virtue of the options offered by Italian Legislative Decree No. 38/2005, the Parent Company Terna SpA
has opted not to use the international accounting standards (IFRS) for the preparation of the statutory
financial statements as of December 31, 2005. The accounting schedules as of June 30, 2005 of the
Parent Company Terna SpA, attached to this interim report, have therefore been drawn up in accordance
with the Italian accounting principles.
Use of estimates
The drawing up of the consolidated interim financial statements, in accordance with the IFRS, requires us
to make estimates and assumptions which have an effect on the values of the financial statement assets
and liabilities and on the information relating to potential assets and liabilities as of the reference date. The
results which will finally be recorded may differ from these estimates. The estimates are used in order to
obtain the provisions for doubtful receivables, for inventory obsolescence, amortization and depreciation,
asset writedowns, employee benefits, taxes and other provisions to reserves. The estimates and
assumptions are periodically reviewed and the effects of each change are reflected in the income
statement.
Subsidiary companies
The scope of consolidation includes the Parent Company Terna SpA and the companies over which it
directly exercises control by means of all the voting rights.
The financial statements of the subsidiary companies are consolidated as from the date on which control
was acquired and until the date such control ceases.
The list of companies included within the scope of consolidation is presented as follows:
Company name Registered
offices Activities Share capital
Currenc
y
%
ownershi
p
T.S.N. - Transmissora
Sudeste Nordeste SA
(Brazil)
Rio de Janeiro
(Brazil)
Construction and maintenance of
electricity transmission networks R$ 250,000,000 R$ 100%
Novatrans Energia SA Rio de Janeiro
(Brazil)
Construction and maintenance of
electricity transmission networks R$ 373,135,465 R$ 100%
Method of consolidation
42
All the interim financial statements used for the preparation of the consolidated interim financial
statements have been drawn up as of June 30 and adjusted, where necessary, in order to render them
uniform with the accounting standards adopted by the Parent Company.
All the infragroup balances and the transactions, including any unrealized gains deriving from transactions
which have taken place between Group companies, are eliminated net of the theoretical tax effect, if
significant. Unrealized losses are eliminated except in the case when they represent reductions in value.
Translation of foreign currency balances
The interim financial statements of each consolidated company are drawn up using the functional currency
relating to the economic context in which each company operates.
In such financial statements, all the transactions in currency other than the functional currency are
recorded using the exchange rate in force as of the date of the transaction. Monetary assets and liabilities
denominated in currency other than the functional currency are subsequently adjusted to the exchange
rate in force as of the period end date presented.
Non-monetary assets and liabilities denominated in foreign currency and recorded at historical cost are
converted using the exchange rate in force as of the date of initial recognition of the transaction. Non-
monetary assets and liabilities denominated in foreign currency and recorded at fair value are converted
using the exchange rate in force as of the date of determination of this value.
Translation of foreign currency financial statements
For the purposes of the consolidated interim financial statements, the profit/loss, assets and liabilities are
expressed in euro which represents the functional currency of the Parent Company Terna SpA.
For the purposes of the preparation of the consolidated interim financial statements, the interim financial
statements in a functional currency other than the euro are converted into euro by applying the exchange
rate in force as of the period end date to the assets and liabilities – inclusive of goodwill and the
adjustments made at the time of consolidation - and the average exchange rates for the period to the
income statement items; the latter rates approximate the exchange rates in force as of the date of the
respective transactions. The related exchange differences are booked directly to the shareholders’ equity
and stated separately in a specific equity reserve.
Exchange differences are stated in the income statement at the time of the disposal of the subsidiary.
Property, plant and equipment
Tangible assets in use are stated at historical cost, inclusive of any directly chargeable related costs
necessary for the bringing into stream of the asset for the use which it was purchased for. The cost is
increased, in the presence of legal or constructive obligations, by the present value of the cost estimated
for the dismantling or removal of the asset.
43
If significant parts of tangible assets in use have different useful lives, the components identified are
recognised separately.
Some assets which had been subject to revaluation as of January 1, 2004 (the date of transition) or in
previous periods, are recorded on the basis of the value revalued as of the date of revaluation, considered
as substitute cost (deemed cost).
Tangible assets are stated net of the related accumulated depreciation and any impairment losses,
determined in accordance with the methods described below. The depreciation is calculated on a straight-
line basis with reference to the estimated useful life of the asset, which is reviewed annually and any
changes are reflected in perspective. The depreciation of assets under construction starts when the asset
is available for use.
The main rates calculated on the basis of the useful life are as follows:
Depreciation rates
Industrial and non-industrial buildings 2.50% - 4.00%
Power lines 2.50% - 4.50%
Switching sub-stations:
- Electrical equipment 2.00% - 3.00%
- Other electrical equipment 2.80 – 4.50%
- Automation and control systems 5.00 – 6.70%
Central systems for remote management and control:
- Electrical equipment and ancillary plant 5.00%
- Computers 10.00%
Land, both free from construction or attached to industrial and civil buildings, is not depreciated since it
has an unlimited useful life.
Construction in progress is stated at historical cost, inclusive of any related charges, net of any
impairment losses.
Tangible assets acquired under financial leases – whereby all risks and benefits linked to the ownership
are essentially transferred to the Group – are recognized as Group assets at their present value or, if
lower, at the present value of the minimum payments due for the leasing. The corresponding liability due to
the lessor is classified among the financial payables. The assets are depreciated by applying the
approaches and the rates indicated above.
44
Leases where the lessor essentially maintains all the risks and benefits associated with the ownership of
the assets, are classified as operating leases. The costs referring to operative leases are recorded on a
linear basis in the income statement over the duration of the lease agreement.
Goodwill
All the acquisitions are recorded on the basis of the purchase method.
Goodwill, deriving from the acquisition of subsidiary companies, represents the excess of the purchase
cost with respect to the fair value of the assets acquired net of the current and potential liabilities recorded
and is allocated to each of the cash generating units identified. After the initial registration, the goodwill is
not amortized and is reduced as a result of any impairment losses, determined in accordance with the
methods described below.
Goodwill deriving from acquisitions carried out prior to January 1, 2004 is stated at the value recorded for
this purpose in the last set of consolidated financial statements drawn up on the basis of the previous
accounting principles (31 December 2003).
Impairment losses
At each balance sheet date, tangible and intangible assets with a determinate life are tested for
impairment. The recoverable value of the goodwill is by contrast estimated as of each balance sheet date.
If an indication of impairment loss exists, steps are taken to estimate the estimated realizable value.
The estimated realizable value is represented either by the net sales price or the value in use, which ever
is higher.
When determining the value in use, the expected future financial flows are discounted back using a pre-
taxation discount rate which reflects the current market valuation of the cost of money stated in relation to
the period of the investment and to the specific risks of the asset. For an asset which does not generate
abundantly sufficient financial flows, the realizable value is determined in relation to the cash generating
unit which this asset belongs to.
An impairment loss is recognized in the income statement if the book value of the assets, or of the related
cash generating unit to which it is allocated, is higher than the estimated realizable value.
With the exception of goodwill, impairment losses are reversed if the reasons which generated them cease
to exist.
Inventories
Inventories are valued at cost or net estimated realizable value, whichever is the lower. The cost
configuration adopted is weighted average cost which includes any related charges applicable.
45
Financial instruments
Equity investments in other companies
Equity investments in other companies, classified as “available for sale”, are valued at fair value and any
gains or losses are charged directly against the shareholders’ equity. At the time of their disposal, such
cumulative gains and losses are released to the income statement.
When the fair value cannot be reliably calculated, equity investments in other companies are valued at
cost adjusted by impairment losses with any gains or losses recognised in the income statement.
These writedowns cannot be reinstated.
Financial assets
Financial assets which the Company intends or is able to hold until maturity, are recorded at the
amortized cost, using the interest rate method, net of any impairment loss.
Trade receivables
Trade receivables, whose maturity falls within normal commercial timescales, are not discounted back and
are recorded at cost (identified by their nominal amount) net of any impairment loss. The value reductions
are determined on the basis of the present value of the expected future cash flows.
Cash and cash equivalents
Cash and cash equivalents include the cash values, or rather those values which feature requisites of on-
demand or extremely short-term availability, favourable outcome and the absence of costs for their
collection.
For the purposes of the consolidated statement of cash flows, cash and cash equivalents are stated net of
bank overdrafts as of the period end date.
Trade payables
Trade payables, whose maturity falls within normal commercial timescales, are not discounted back and
are recorded at cost (identified by their normal amount).
Financial liabilities
Financial liabilities, with the exception of derivatives, are initially stated at fair value net of any directly
attributable transaction costs.
Subsequently, financial liabilities are valued on an amortized cost basis, using the original effective interest
rate method.
46
Derivative financial instruments
The Group holds derivative instruments for the purpose of hedging its exposure to interest rate fluctuation
risks. On a consistent basis with the chosen strategy, the Group has not set up any transactions on
derivatives for speculative purposes. However, in the event that these transactions cannot be qualified in
the accounts as hedging transactions, they are recorded as speculative transactions.
The derivatives are classified as hedging instruments when the relationship between the derivative and the
object of the hedge is formally documented and the effectiveness of the hedge, assessed periodically, is
high. When the hedging derivatives cover the risk of a fluctuation in the fair value of the instruments subject
to coverage (fair value hedge; e.g. coverage of the variability of the fair value of assets/liabilities at a fixed
rate), they are stated at fair value and the effects are booked to the income statement; on a consistent
basis, the instruments subject to hedging are adjusted in order to reflect the changes in the fair value
associated with the risk hedged. When the derivatives cover the risk of fluctuation in the cash flows of the
instruments subject to coverage (cash flow hedge; e.g. coverage of the variability of the cash flows of
assets/liabilities at variable rates as a result of the fluctuations in interest rates), the fluctuations in the fair
value are initially booked to shareholders’ equity and subsequently charged to the income statement on a
consistent basis with the economic effects produced by the transactions hedged.
The fluctuations in the fair value of the derivatives which do not satisfy the conditions for being qualified as
hedges are stated in the income statement.
Employee benefits
The liability relating to the benefits acknowledged employees and paid out at the time of or subsequent to
the termination of the employment relationship as well as relating to specific benefit programmes
(termination indemnities, Ima1, Isp2, Energy Discount, Asem health care and other benefits) or other long-
term benefits (Loyalty Bonus), is stated net of assets serving the plan and is determined, separately for
each plan, on the basis of actuarial assumptions estimating the amount of the future benefits which the
employees have accrued as of the reference date. The liability is recorded on an accruals basis over the
vesting period of the related rights. The valuation of the liability is made by independent actuaries.
Gains and losses deriving from the amendment of the actuarial assumptions are stated in the income
statement as a cost or revenue when their net cumulative value exceeds by more than 10% the higher
value between the total of the liabilities referring to each specific benefit plan and the fair value of the
assets serving the plan as of the balance sheet date (so-called “corridor approach”).
Provisions for risks and charges
1 Additional months’ payment allowance. 2 Indemnity replacing notice period.
47
The provisions made for risks and charges are recorded when, as of the balance sheet, a legal or implicit
obligation exists, which derives from a past event, and an outlay of resources is probable in order to satisfy
the obligation and the sum total of this outlay can be estimated. If the effect is significant, the provisions
are determined by discounting back the expected future financial flows to a pre-tax discount rate which
reflects the current market valuation of the cost of money in relation to the timescale and, if applicable, the
specific risk applicable to the obligation. When the amount is discounted back, the increase in the
provision due to the passing of time is recorded as financial expense. If the liability refers to tangible
assets (e.g. dismantling and recovery of sites), the provision is recorded as a matching balance to the
asset to which it refers; the recording of the expense in the income statement takes place by means of
the depreciation process of the tangible fixed assets to which the expense refers.
Grants
Grants, both from Government and from private third parties, are stated at fair value when there is
reasonable certainty that they will be received and the conditions anticipated for the attainment of the
same will be satisfied.
Grants received for specific expenditure are recorded among other liabilities and credited to the income
statement on a systematic basis over the same period during which the related costs accrue.
Grants received for specific assets whose value is recorded among fixed assets, are either directly
charged against the value of said fixed assets or stated among other liabilities and credited to the income
statement in relation to the depreciation period pertaining to the assets to which they refer.
Operating grants are recorded in full in the income statement at the time the conditions which allow their
booking are satisfied.
Revenues
Revenues are stated on the basis of the specific criteria illustrated below, in accordance with the type of
transaction involved:
§ revenues from the sale of goods are recorded when the significant risks and benefits pertaining to the
ownership of the same are tranferred to the purchaser;
§ revenues for the performance of services are stated with reference to the stage of completion of the
activities. In the event that it is impossible to reliably determine the value of the revenues, the latter are
recorded up to the extent of the costs incurred which we believe will be recovered.
Specifically, revenues deriving from fees for the remuneration of the National Transmission Grid (NTG), are
stated in accordance with the formalities established in the operating agreement with the ISO and
valorized on the basis of the tariffs established by the Italian Regulatory Authority for Electricity and Gas.
Financial income and expense
48
Financial income and expense is stated on an accruals basis with reference to the interest accrued on the
net carrying amount of the related financial assets and liabilities, using the effective interest rate method.
Dividends
These revenues are stated when the right of the shareholders to receive the dividends is established.
Income taxes
Current taxes are determined on the basis of the estimate of the taxable profit (tax loss) and in pursuance
of the tax legislation in force.
Deferred tax liabilities and assets are calculated on timing differences between the balance sheet values
recorded in the consolidated interim financial statements and the corresponding values recognized for tax
purposes, applying the tax rate in force or essentially in force as of the accounting reference date.
Their recording is made when the recovery is probable, in other words when it is foreseen that taxable
amounts sufficient for recovering the assets may become available in the future.
The recoverability of deferred tax assets is re-examined at each period end.
Share-based transaction
The cost of the services provided by the employees and remunerated by means of stock option plans is
determined on the basis of the fair value of the options granted to employees at the grant date.
The calculation method for determining the fair value takes into account all the characteristics of the
options (option, term, price and exercise conditions, etc.), as well as the Terna share price at the grant
date, the share volatility and the interest rate curve at grant date consistent with the duration of the plan.
The cost is stated in the income statement over the vesting period considering the best estimate possible
for the number of options which will become exercisable.
Risk Management
Whilst carrying out its activities, Terna is exposed to the risk of interest rate fluctuations.
In order to minimize this risk, Terna stipulates derivative contracts hedging both specific transactions and
its overall exposure, availing itself of the instruments offered by the market.
The transactions which, in observance of the risk management policies, satisfy the requisites established
by the accounting standards for the treatment under hedge accounting are designated as "hedging", while
those which, despite having been set up for hedging purposes, do not satisfy the requisites entailed by the
standards are classified as "trading/non-IFRS hedges". Terna does not enter into derivative contracts for
speculative purposes.
Financial assets and liabilities relating to derivative instruments are classified as follows:
§ Cash Flow Hedge Derivatives, relating to the hedging of the risk of fluctuation in cash flows associated
with a number of floating-rate medium/long-term loans.
49
§ Fair Value Hedge Derivatives, relating to the hedging of the risk of fluctuation in the fair value of fixed
rate liabilities.
§ Trading/Non- IFRS hedges Derivatives, relating to the hedging of the interest rate risk which does not
present the formal requisites required by IAS 39 in order to be booked as transactions hedging
specific assets, liabilities, commitments or future transactions.
The fair value is determined by using the official prices for the instruments on regulated markets. The fair
value of instruments which are not listed on organized markets is determined by discounting back the
expected cash flows to the market interest rate curve as of the accounting reference date and converting
the balances in currency other than euro using the period end exchange rates supplied by the European
Central Bank.
With the aim of reducing the total financial debt subject to interest rate fluctuations and reducing the
borrowing cost, various types of derivative contracts are used, in particular interest rate swaps and interest
rate collars.
As a rule, these contracts are set up with a notional and maturity date less or equal to those of the
underlying financial liabilities, so that each change in the fair value and/or in the expected cash flows of
these contracts is balanced by a corresponding change in the fair value and/or in the expected cash flows
of the underlying position.
The section “Explanatory notes” illustrates the notional value and the fair value of the derivatives
outstanding as of June 30, 2005, grouped together as current and non-current financial assets and
liabilities.
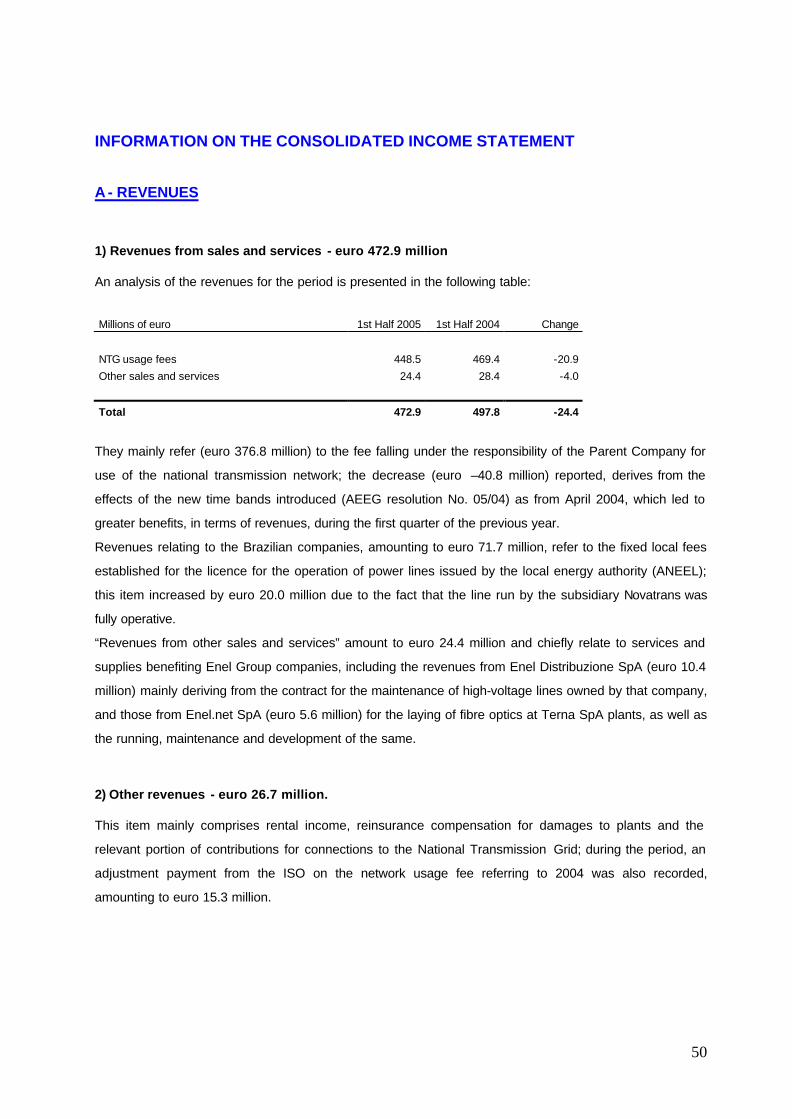
50
INFORMATION ON THE CONSOLIDATED INCOME STATEMENT
A - REVENUES
1) Revenues from sales and services - euro 472.9 million
An analysis of the revenues for the period is presented in the following table:
Millions of euro 1st Half 2005 1st Half 2004 Change
NTG usage fees 448.5 469.4 -20.9
Other sales and services 24.4 28.4 -4.0
Total 472.9 497.8 -24.4
They mainly refer (euro 376.8 million) to the fee falling under the responsibility of the Parent Company for
use of the national transmission network; the decrease (euro –40.8 million) reported, derives from the
effects of the new time bands introduced (AEEG resolution No. 05/04) as from April 2004, which led to
greater benefits, in terms of revenues, during the first quarter of the previous year.
Revenues relating to the Brazilian companies, amounting to euro 71.7 million, refer to the fixed local fees
established for the licence for the operation of power lines issued by the local energy authority (ANEEL);
this item increased by euro 20.0 million due to the fact that the line run by the subsidiary Novatrans was
fully operative.
“Revenues from other sales and services” amount to euro 24.4 million and chiefly relate to services and
supplies benefiting Enel Group companies, including the revenues from Enel Distribuzione SpA (euro 10.4
million) mainly deriving from the contract for the maintenance of high-voltage lines owned by that company,
and those from Enel.net SpA (euro 5.6 million) for the laying of fibre optics at Terna SpA plants, as well as
the running, maintenance and development of the same.
2) Other revenues - euro 26.7 million.
This item mainly comprises rental income, reinsurance compensation for damages to plants and the
relevant portion of contributions for connections to the National Transmission Grid; during the period, an
adjustment payment from the ISO on the network usage fee referring to 2004 was also recorded,
amounting to euro 15.3 million.
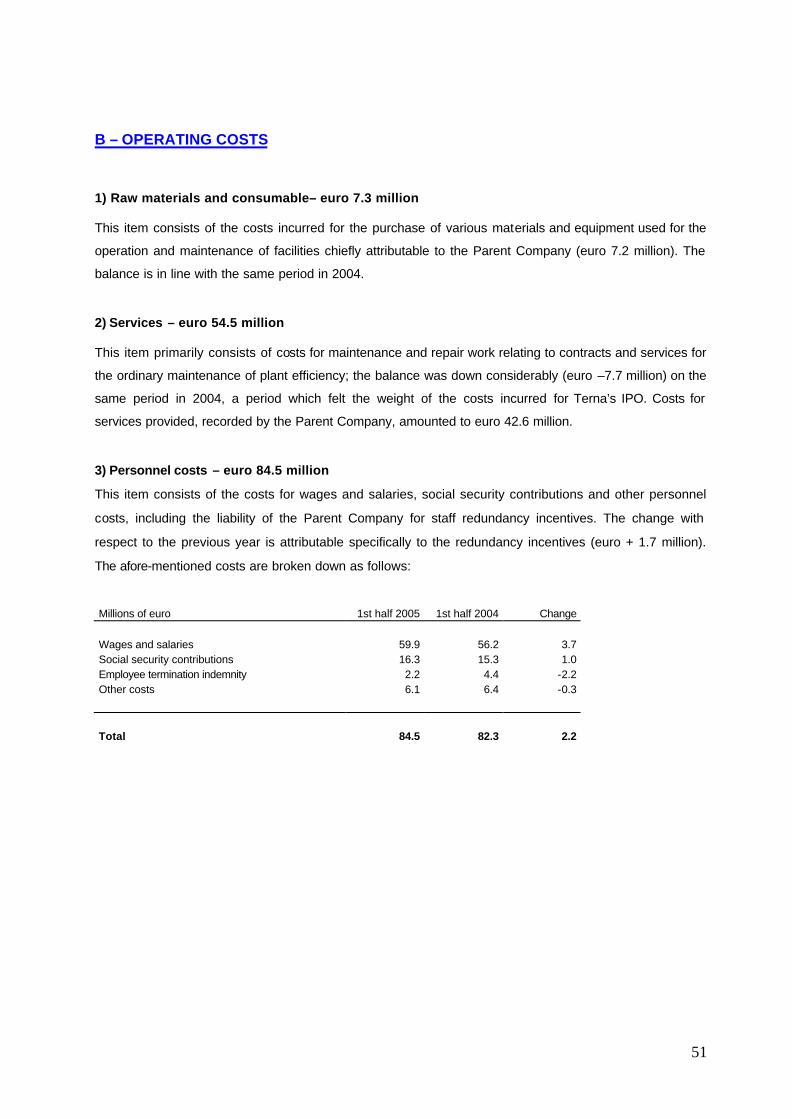
51
B – OPERATING COSTS
1) Raw materials and consumable– euro 7.3 million
This item consists of the costs incurred for the purchase of various materials and equipment used for the
operation and maintenance of facilities chiefly attributable to the Parent Company (euro 7.2 million). The
balance is in line with the same period in 2004.
2) Services – euro 54.5 million
This item primarily consists of costs for maintenance and repair work relating to contracts and services for
the ordinary maintenance of plant efficiency; the balance was down considerably (euro –7.7 million) on the
same period in 2004, a period which felt the weight of the costs incurred for Terna’s IPO. Costs for
services provided, recorded by the Parent Company, amounted to euro 42.6 million.
3) Personnel costs – euro 84.5 million
This item consists of the costs for wages and salaries, social security contributions and other personnel
costs, including the liability of the Parent Company for staff redundancy incentives. The change with
respect to the previous year is attributable specifically to the redundancy incentives (euro + 1.7 million).
The afore-mentioned costs are broken down as follows:
Millions of euro 1st half 2005 1st half 2004 Change Wages and salaries 59.9 56.2 3.7 Social security contributions 16.3 15.3 1.0 Employee termination indemnity 2.2 4.4 -2.2 Other costs 6.1 6.4 -0.3 Total 84.5 82.3 2.2
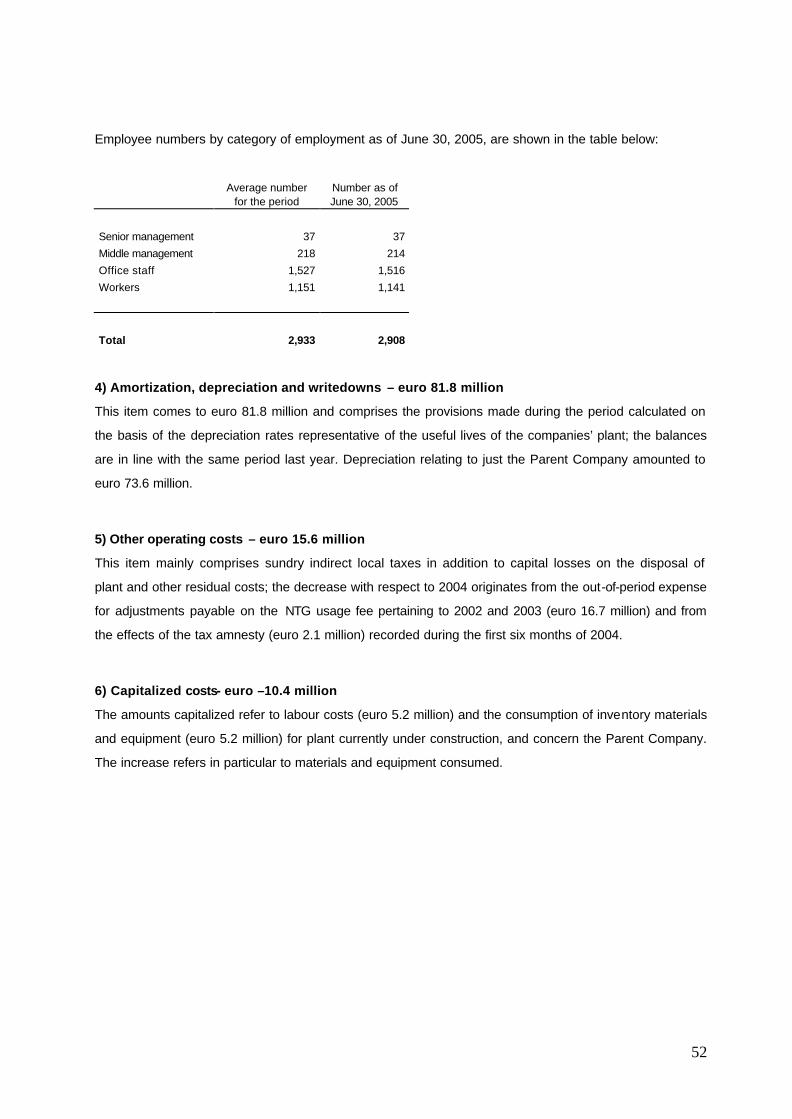
52
Employee numbers by category of employment as of June 30, 2005, are shown in the table below:
Average number
for the period Number as of June 30, 2005
Senior management 37 37
Middle management 218 214
Office staff 1,527 1,516
Workers 1,151 1,141
Total 2,933 2,908
4) Amortization, depreciation and writedowns – euro 81.8 million
This item comes to euro 81.8 million and comprises the provisions made during the period calculated on
the basis of the depreciation rates representative of the useful lives of the companies’ plant; the balances
are in line with the same period last year. Depreciation relating to just the Parent Company amounted to
euro 73.6 million.
5) Other operating costs – euro 15.6 million
This item mainly comprises sundry indirect local taxes in addition to capital losses on the disposal of
plant and other residual costs; the decrease with respect to 2004 originates from the out-of-period expense
for adjustments payable on the NTG usage fee pertaining to 2002 and 2003 (euro 16.7 million) and from
the effects of the tax amnesty (euro 2.1 million) recorded during the first six months of 2004.
6) Capitalized costs- euro –10.4 million
The amounts capitalized refer to labour costs (euro 5.2 million) and the consumption of inventory materials
and equipment (euro 5.2 million) for plant currently under construction, and concern the Parent Company.
The increase refers in particular to materials and equipment consumed.
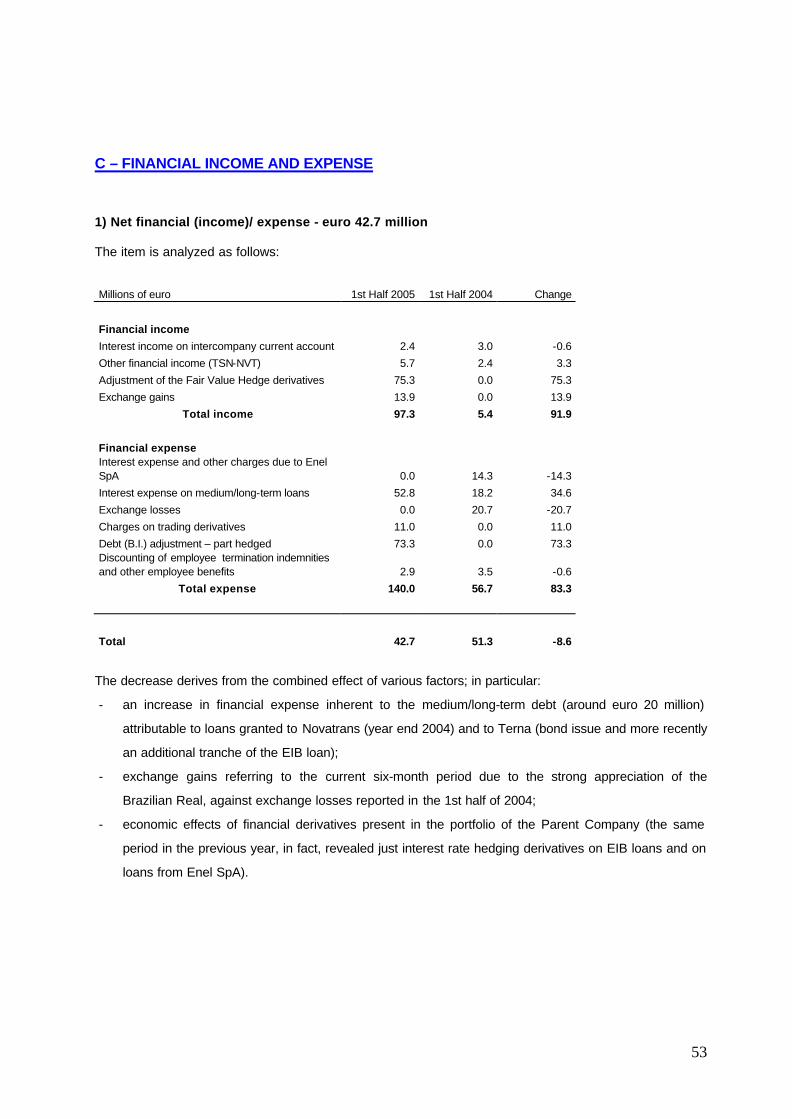
53
C – FINANCIAL INCOME AND EXPENSE
1) Net financial (income)/ expense - euro 42.7 million
The item is analyzed as follows:
Millions of euro 1st Half 2005 1st Half 2004 Change
Financial income
Interest income on intercompany current account 2.4 3.0 -0.6
Other financial income (TSN-NVT) 5.7 2.4 3.3
Adjustment of the Fair Value Hedge derivatives 75.3 0.0 75.3
Exchange gains 13.9 0.0 13.9
Total income 97.3 5.4 91.9
Financial expense Interest expense and other charges due to Enel SpA 0.0 14.3 -14.3
Interest expense on medium/long-term loans 52.8 18.2 34.6
Exchange losses 0.0 20.7 -20.7
Charges on trading derivatives 11.0 0.0 11.0
Debt (B.I.) adjustment – part hedged 73.3 0.0 73.3 Discounting of employee termination indemnities and other employee benefits 2.9 3.5 -0.6
Total expense 140.0 56.7 83.3
Total 42.7 51.3 -8.6
The decrease derives from the combined effect of various factors; in particular:
- an increase in financial expense inherent to the medium/long-term debt (around euro 20 million)
attributable to loans granted to Novatrans (year end 2004) and to Terna (bond issue and more recently
an additional tranche of the EIB loan);
- exchange gains referring to the current six-month period due to the strong appreciation of the
Brazilian Real, against exchange losses reported in the 1st half of 2004;
- economic effects of financial derivatives present in the portfolio of the Parent Company (the same
period in the previous year, in fact, revealed just interest rate hedging derivatives on EIB loans and on
loans from Enel SpA).
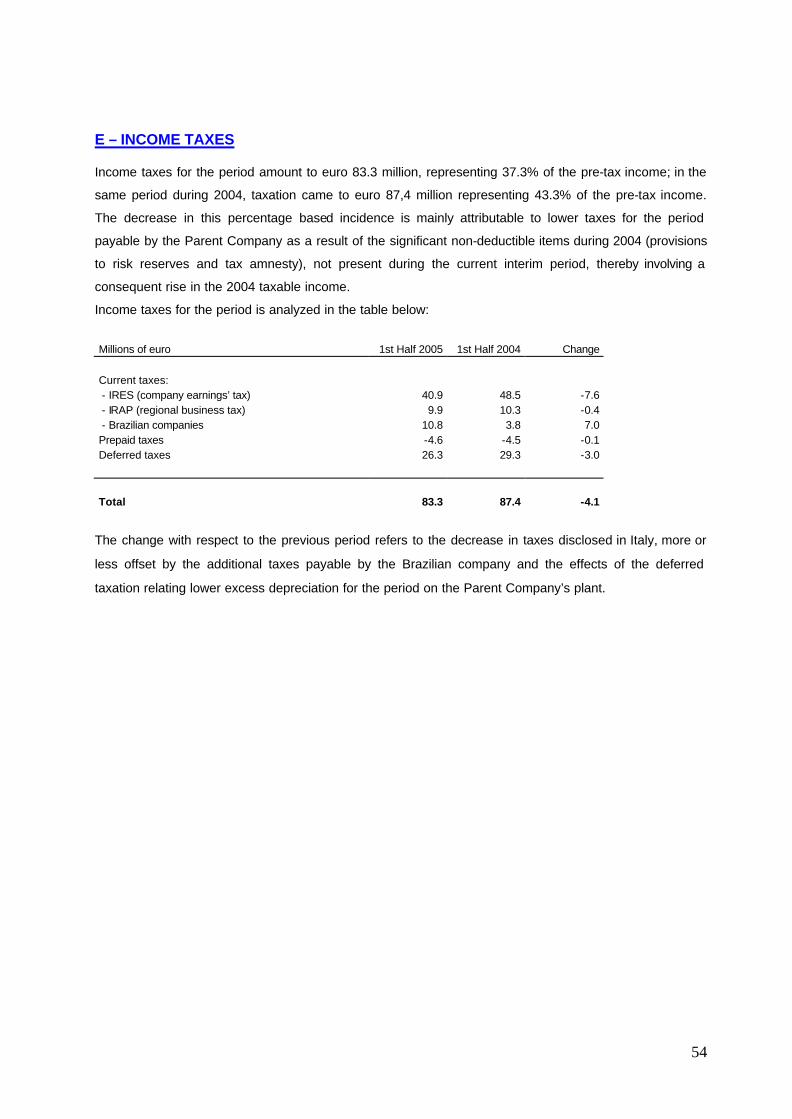
54
E – INCOME TAXES
Income taxes for the period amount to euro 83.3 million, representing 37.3% of the pre-tax income; in the
same period during 2004, taxation came to euro 87,4 million representing 43.3% of the pre-tax income.
The decrease in this percentage based incidence is mainly attributable to lower taxes for the period
payable by the Parent Company as a result of the significant non-deductible items during 2004 (provisions
to risk reserves and tax amnesty), not present during the current interim period, thereby involving a
consequent rise in the 2004 taxable income.
Income taxes for the period is analyzed in the table below:
Millions of euro 1st Half 2005 1st Half 2004 Change Current taxes: - IRES (company earnings’ tax) 40.9 48.5 -7.6 - IRAP (regional business tax) 9.9 10.3 -0.4 - Brazilian companies 10.8 3.8 7.0 Prepaid taxes -4.6 -4.5 -0.1 Deferred taxes 26.3 29.3 -3.0 Total 83.3 87.4 -4.1
The change with respect to the previous period refers to the decrease in taxes disclosed in Italy, more or
less offset by the additional taxes payable by the Brazilian company and the effects of the deferred
taxation relating lower excess depreciation for the period on the Parent Company’s plant.
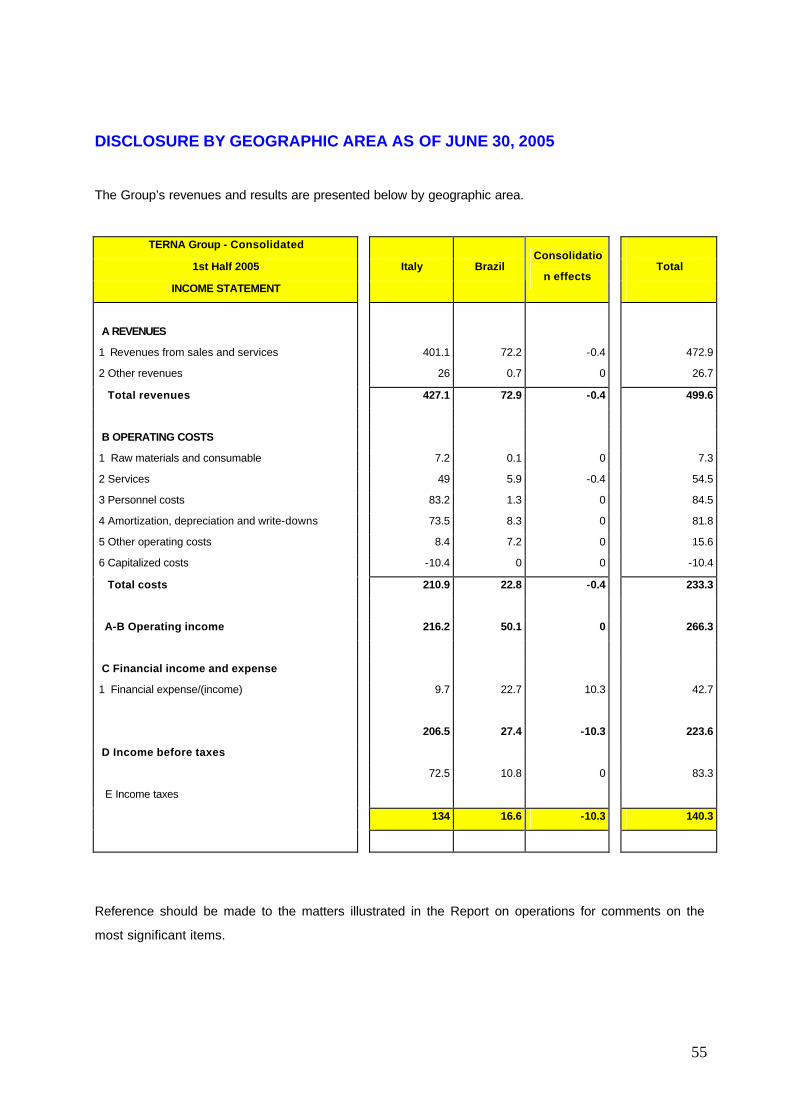
55
DISCLOSURE BY GEOGRAPHIC AREA AS OF JUNE 30, 2005
The Group’s revenues and results are presented below by geographic area.
TERNA Group - Consolidated
1st Half 2005 Italy Brazil Total
INCOME STATEMENT
Consolidatio
n effects
A REVENUES
1 Revenues from sales and services 401.1 72.2 -0.4 472.9
2 Other revenues 26 0.7 0 26.7
Total revenues 427.1 72.9 -0.4 499.6
B OPERATING COSTS
1 Raw materials and consumable 7.2 0.1 0 7.3
2 Services 49 5.9 -0.4 54.5
3 Personnel costs 83.2 1.3 0 84.5
4 Amortization, depreciation and write-downs 73.5 8.3 0 81.8
5 Other operating costs 8.4 7.2 0 15.6
6 Capitalized costs -10.4 0 0 -10.4
Total costs 210.9 22.8 -0.4 233.3
A-B Operating income 216.2 50.1 0 266.3
C Financial income and expense
1 Financial expense/(income) 9.7 22.7 10.3 42.7
206.5 27.4 -10.3 223.6
D Income before taxes
72.5 10.8 0 83.3
E Income taxes
134 16.6 -10.3 140.3
Reference should be made to the matters illustrated in the Report on operations for comments on the
most significant items.
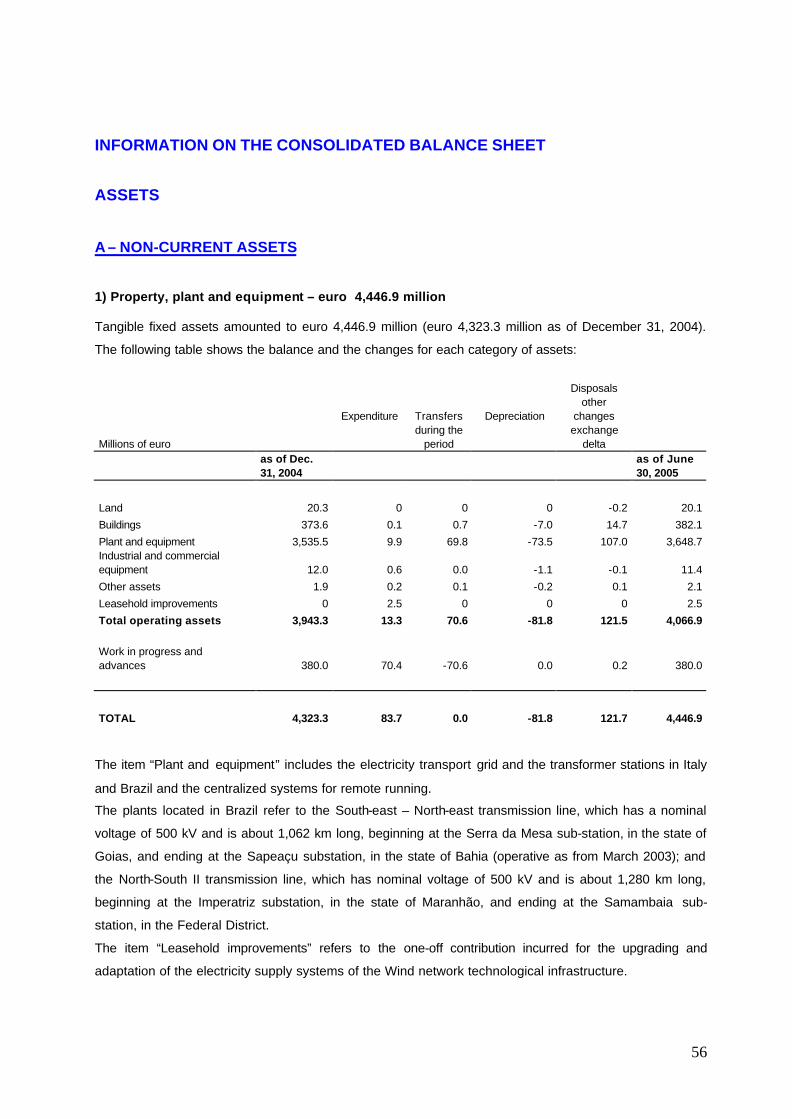
56
INFORMATION ON THE CONSOLIDATED BALANCE SHEET
ASSETS
A – NON-CURRENT ASSETS
1) Property, plant and equipment – euro 4,446.9 million
Tangible fixed assets amounted to euro 4,446.9 million (euro 4,323.3 million as of December 31, 2004).
The following table shows the balance and the changes for each category of assets:
Millions of euro
Expenditure Transfers during the
period
Depreciation
Disposals other
changes exchange
delta
as of Dec. 31, 2004
as of June 30, 2005
Land 20.3 0 0 0 -0.2 20.1
Buildings 373.6 0.1 0.7 -7.0 14.7 382.1
Plant and equipment 3,535.5 9.9 69.8 -73.5 107.0 3,648.7 Industrial and commercial equipment 12.0 0.6 0.0 -1.1 -0.1 11.4
Other assets 1.9 0.2 0.1 -0.2 0.1 2.1
Leasehold improvements 0 2.5 0 0 0 2.5
Total operating assets 3,943.3 13.3 70.6 -81.8 121.5 4,066.9
Work in progress and advances 380.0 70.4 -70.6 0.0 0.2 380.0
TOTAL 4,323.3 83.7 0.0 -81.8 121.7 4,446.9
The item “Plant and equipment” includes the electricity transport grid and the transformer stations in Italy
and Brazil and the centralized systems for remote running.
The plants located in Brazil refer to the South-east – North-east transmission line, which has a nominal
voltage of 500 kV and is about 1,062 km long, beginning at the Serra da Mesa sub-station, in the state of
Goias, and ending at the Sapeaçu substation, in the state of Bahia (operative as from March 2003); and
the North-South II transmission line, which has nominal voltage of 500 kV and is about 1,280 km long,
beginning at the Imperatriz substation, in the state of Maranhão, and ending at the Samambaia sub-
station, in the Federal District.
The item “Leasehold improvements” refers to the one-off contribution incurred for the upgrading and
adaptation of the electricity supply systems of the Wind network technological infrastructure.
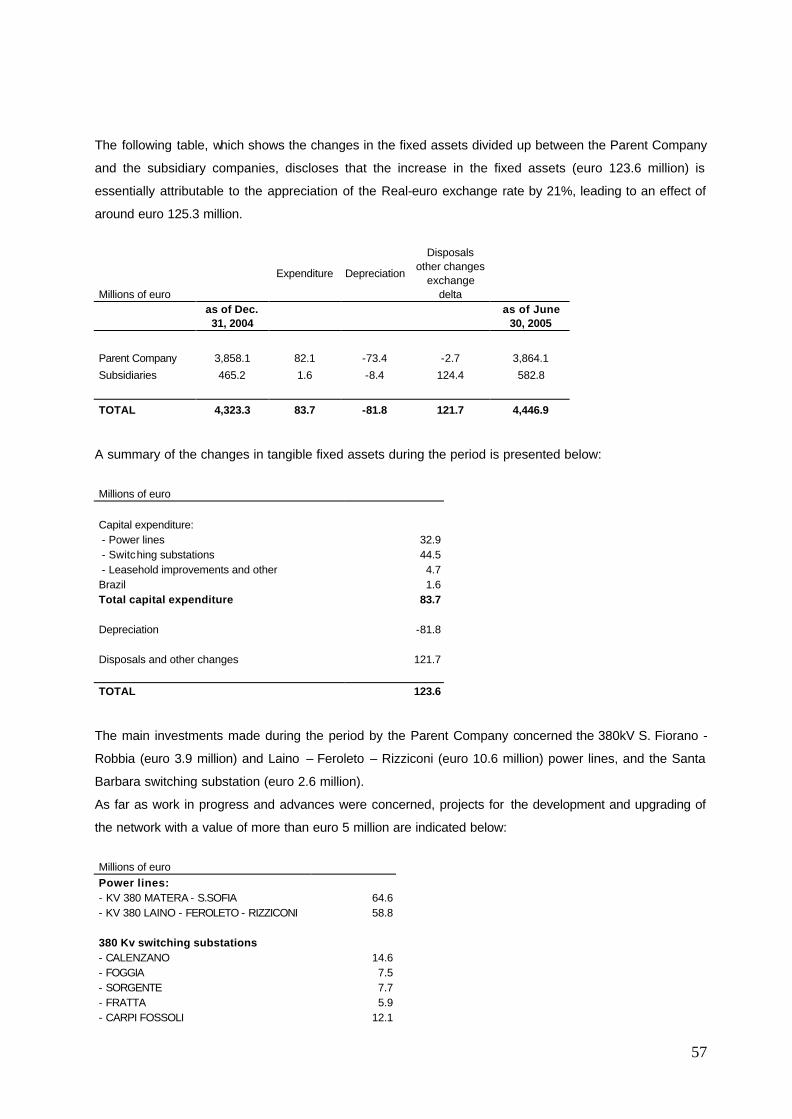
57
The following table, which shows the changes in the fixed assets divided up between the Parent Company
and the subsidiary companies, discloses that the increase in the fixed assets (euro 123.6 million) is
essentially attributable to the appreciation of the Real-euro exchange rate by 21%, leading to an effect of
around euro 125.3 million.
Millions of euro
Expenditure Depreciation
Disposals other changes
exchange delta
as of Dec. 31, 2004
as of June 30, 2005
Parent Company 3,858.1 82.1 -73.4 -2.7 3,864.1
Subsidiaries 465.2 1.6 -8.4 124.4 582.8
TOTAL 4,323.3 83.7 -81.8 121.7 4,446.9
A summary of the changes in tangible fixed assets during the period is presented below:
Millions of euro Capital expenditure: - Power lines 32.9 - Switching substations 44.5 - Leasehold improvements and other 4.7 Brazil 1.6 Total capital expenditure 83.7 Depreciation -81.8 Disposals and other changes 121.7 TOTAL 123.6
The main investments made during the period by the Parent Company concerned the 380kV S. Fiorano -
Robbia (euro 3.9 million) and Laino – Feroleto – Rizziconi (euro 10.6 million) power lines, and the Santa
Barbara switching substation (euro 2.6 million).
As far as work in progress and advances were concerned, projects for the development and upgrading of
the network with a value of more than euro 5 million are indicated below:
Millions of euro Power lines: - KV 380 MATERA - S.SOFIA 64.6 - KV 380 LAINO - FEROLETO - RIZZICONI 58.8 380 Kv switching substations - CALENZANO 14.6 - FOGGIA 7.5 - SORGENTE 7.7 - FRATTA 5.9 - CARPI FOSSOLI 12.1
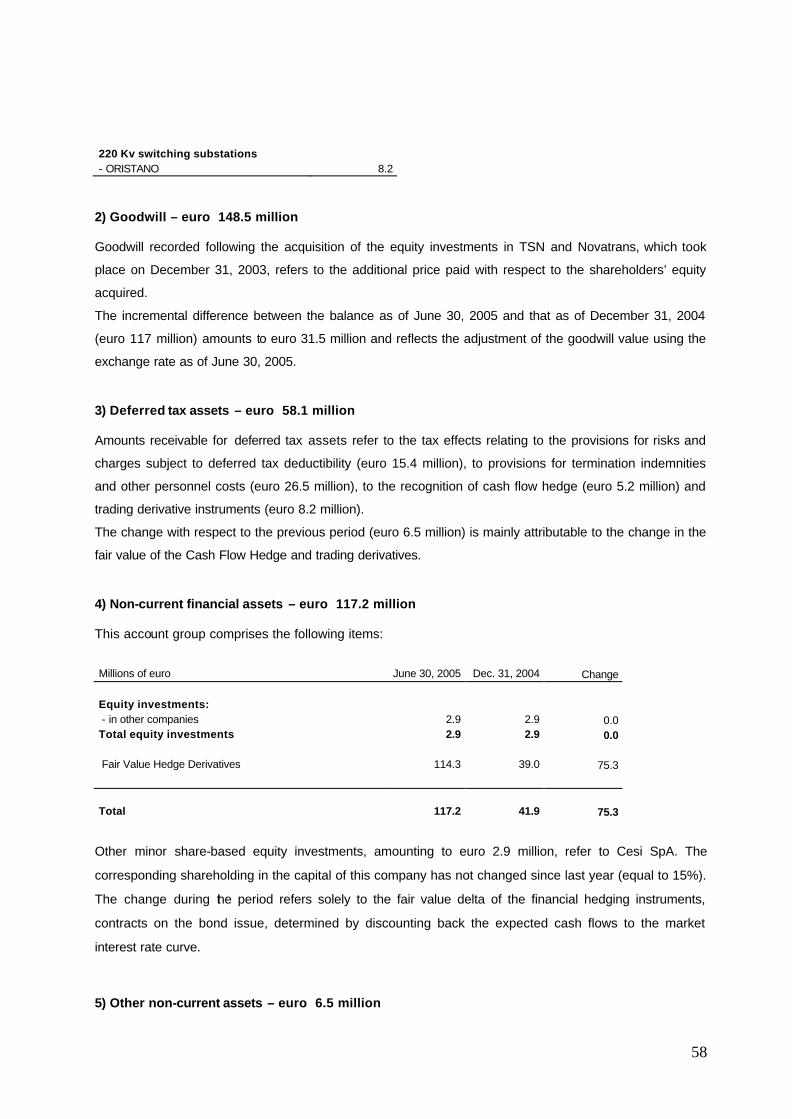
58
220 Kv switching substations - ORISTANO 8.2
2) Goodwill – euro 148.5 million
Goodwill recorded following the acquisition of the equity investments in TSN and Novatrans, which took
place on December 31, 2003, refers to the additional price paid with respect to the shareholders’ equity
acquired.
The incremental difference between the balance as of June 30, 2005 and that as of December 31, 2004
(euro 117 million) amounts to euro 31.5 million and reflects the adjustment of the goodwill value using the
exchange rate as of June 30, 2005.
3) Deferred tax assets – euro 58.1 million
Amounts receivable for deferred tax assets refer to the tax effects relating to the provisions for risks and
charges subject to deferred tax deductibility (euro 15.4 million), to provisions for termination indemnities
and other personnel costs (euro 26.5 million), to the recognition of cash flow hedge (euro 5.2 million) and
trading derivative instruments (euro 8.2 million).
The change with respect to the previous period (euro 6.5 million) is mainly attributable to the change in the
fair value of the Cash Flow Hedge and trading derivatives.
4) Non-current financial assets – euro 117.2 million
This account group comprises the following items:
Millions of euro June 30, 2005 Dec. 31, 2004 Change
Equity investments: - in other companies 2.9 2.9 0.0 Total equity investments 2.9 2.9 0.0
Fair Value Hedge Derivatives 114.3 39.0 75.3
Total 117.2 41.9 75.3
Other minor share-based equity investments, amounting to euro 2.9 million, refer to Cesi SpA. The
corresponding shareholding in the capital of this company has not changed since last year (equal to 15%).
The change during the period refers solely to the fair value delta of the financial hedging instruments,
contracts on the bond issue, determined by discounting back the expected cash flows to the market
interest rate curve.
5) Other non-current assets – euro 6.5 million
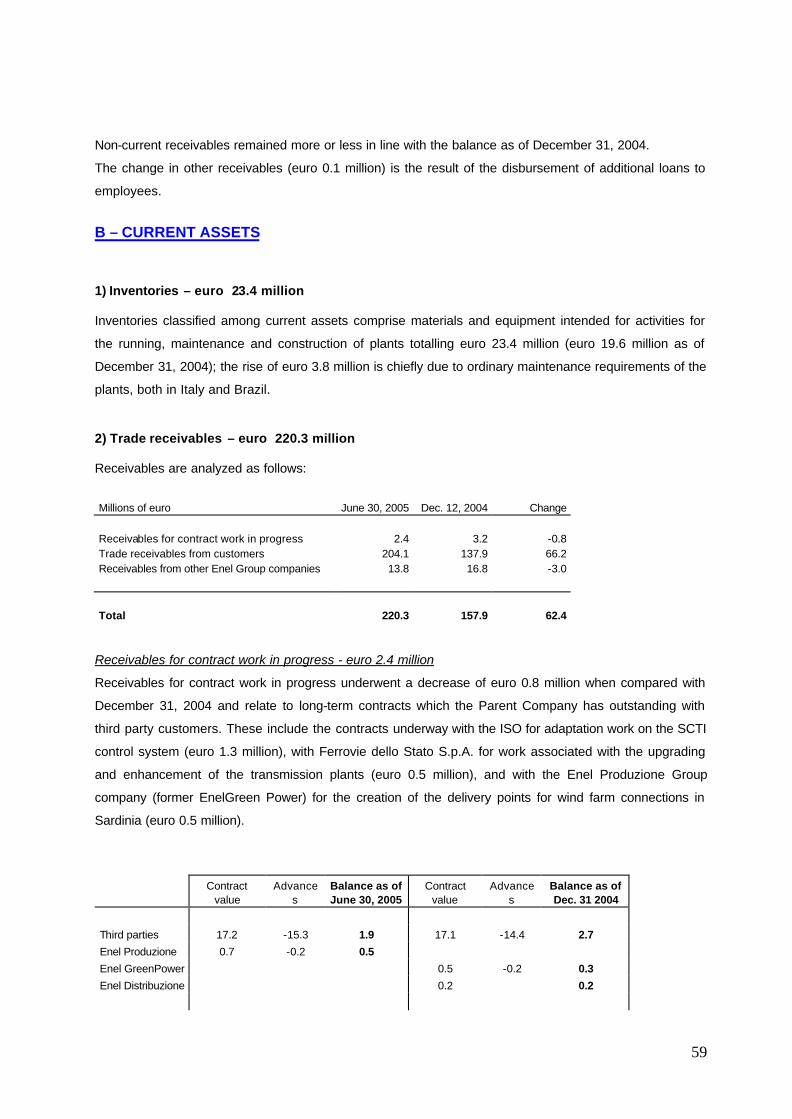
59
Non-current receivables remained more or less in line with the balance as of December 31, 2004.
The change in other receivables (euro 0.1 million) is the result of the disbursement of additional loans to
employees.
B – CURRENT ASSETS
1) Inventories – euro 23.4 million
Inventories classified among current assets comprise materials and equipment intended for activities for
the running, maintenance and construction of plants totalling euro 23.4 million (euro 19.6 million as of
December 31, 2004); the rise of euro 3.8 million is chiefly due to ordinary maintenance requirements of the
plants, both in Italy and Brazil.
2) Trade receivables – euro 220.3 million
Receivables are analyzed as follows:
Millions of euro June 30, 2005 Dec. 12, 2004 Change Receivables for contract work in progress 2.4 3.2 -0.8 Trade receivables from customers 204.1 137.9 66.2 Receivables from other Enel Group companies 13.8 16.8 -3.0 Total 220.3 157.9 62.4
Receivables for contract work in progress - euro 2.4 million
Receivables for contract work in progress underwent a decrease of euro 0.8 million when compared with
December 31, 2004 and relate to long-term contracts which the Parent Company has outstanding with
third party customers. These include the contracts underway with the ISO for adaptation work on the SCTI
control system (euro 1.3 million), with Ferrovie dello Stato S.p.A. for work associated with the upgrading
and enhancement of the transmission plants (euro 0.5 million), and with the Enel Produzione Group
company (former EnelGreen Power) for the creation of the delivery points for wind farm connections in
Sardinia (euro 0.5 million).
Contract
value Advance
s Balance as of June 30, 2005
Contract value
Advances
Balance as of Dec. 31 2004
Third parties 17.2 -15.3 1.9 17.1 -14.4 2.7
Enel Produzione 0.7 -0.2 0.5
Enel GreenPower 0.5 -0.2 0.3
Enel Distribuzione 0.2 0.2
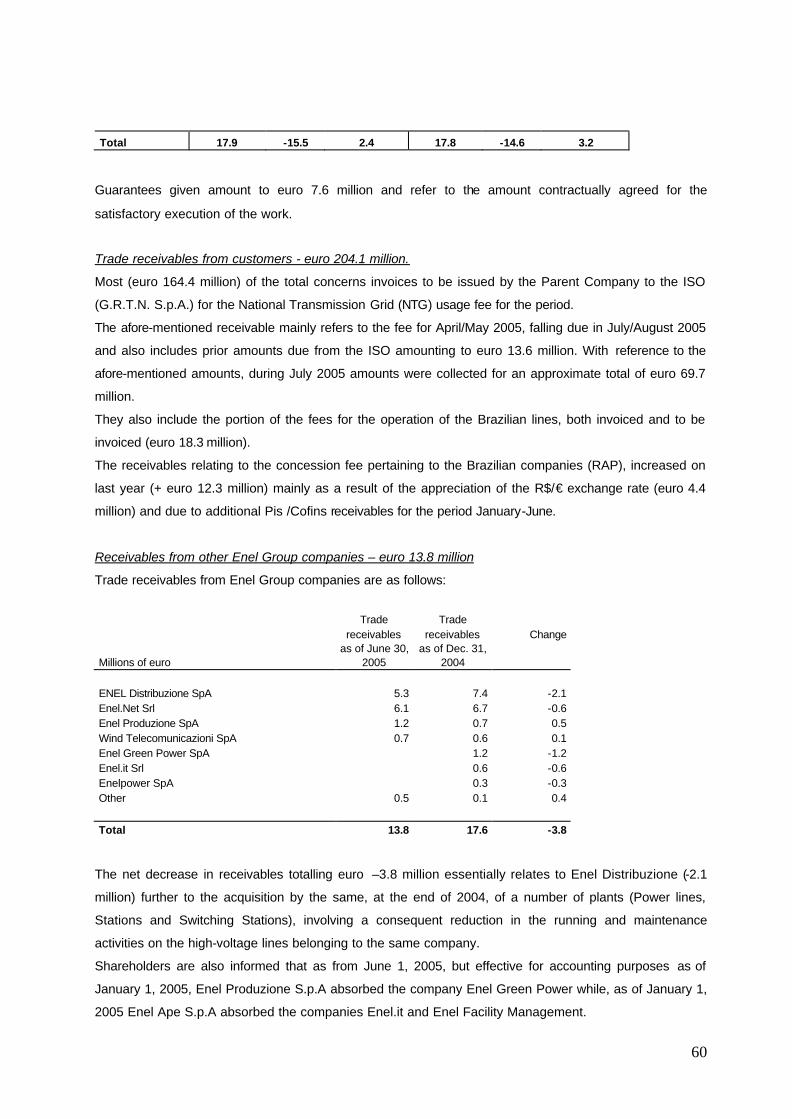
60
Total 17.9 -15.5 2.4 17.8 -14.6 3.2
Guarantees given amount to euro 7.6 million and refer to the amount contractually agreed for the
satisfactory execution of the work.
Trade receivables from customers - euro 204.1 million.
Most (euro 164.4 million) of the total concerns invoices to be issued by the Parent Company to the ISO
(G.R.T.N. S.p.A.) for the National Transmission Grid (NTG) usage fee for the period.
The afore-mentioned receivable mainly refers to the fee for April/May 2005, falling due in July/August 2005
and also includes prior amounts due from the ISO amounting to euro 13.6 million. With reference to the
afore-mentioned amounts, during July 2005 amounts were collected for an approximate total of euro 69.7
million.
They also include the portion of the fees for the operation of the Brazilian lines, both invoiced and to be
invoiced (euro 18.3 million).
The receivables relating to the concession fee pertaining to the Brazilian companies (RAP), increased on
last year (+ euro 12.3 million) mainly as a result of the appreciation of the R$/€ exchange rate (euro 4.4
million) and due to additional Pis /Cofins receivables for the period January-June.
Receivables from other Enel Group companies – euro 13.8 million
Trade receivables from Enel Group companies are as follows:
Trade Trade receivables receivables Change
Millions of euro as of June 30,
2005 as of Dec. 31,
2004 ENEL Distribuzione SpA 5.3 7.4 -2.1 Enel.Net Srl 6.1 6.7 -0.6 Enel Produzione SpA 1.2 0.7 0.5 Wind Telecomunicazioni SpA 0.7 0.6 0.1 Enel Green Power SpA 1.2 -1.2 Enel.it Srl 0.6 -0.6 Enelpower SpA 0.3 -0.3 Other 0.5 0.1 0.4 Total 13.8 17.6 -3.8
The net decrease in receivables totalling euro –3.8 million essentially relates to Enel Distribuzione (-2.1
million) further to the acquisition by the same, at the end of 2004, of a number of plants (Power lines,
Stations and Switching Stations), involving a consequent reduction in the running and maintenance
activities on the high-voltage lines belonging to the same company.
Shareholders are also informed that as from June 1, 2005, but effective for accounting purposes as of
January 1, 2005, Enel Produzione S.p.A absorbed the company Enel Green Power while, as of January 1,
2005 Enel Ape S.p.A absorbed the companies Enel.it and Enel Facility Management.
61
The nature of the main transactions with other Enel Group companies and the related economic values are
illustrated in the commentary to the income statement contained within these explanatory notes.
3) Current financial assets – euro 35.0 million
The balance of this item is chiefly attributable to deferred assets relating to the interest on Fair value
hedge derivatives (euro 32.6 million) and to the value of the accrued income on running current accounts
relating to the Parent Company bearing interest (rate of 1.979% as of June 30, 2005), within the sphere of
the centralized cash management contract (euro 2.4 million).
4) Cash and cash equivalents – euro 277.5 million
The balance of this item is equal to euro 277.5 million (euro 231.8 million as of December 31, 2004) and
largely comprises the credit balances of the current accounts held by the Brazilian companies (euro 61.6
million, of which euro 26.4 million held in fixed deposit accounts) and by the Parent Company (euro 25.9
million); it also includes the available credit balance on the intercompany account amounting to euro 189.9
million which is the main cause of the increase in the balance registered during the period.
5) Other current assets – euro 71.0 million
This item discloses a balance of euro 71.0 million (euro 34.8 million as of December 31, 2004) mainly
referable to the following amounts:
- tax receivables totalling euro 47.4 million relating mainly to Ires (euro 31.5 million) and Irap
advance taxes (euro 7.5 million) paid by the Parent Company. The item also includes taxes paid
abroad (Brazil and the Greek branch), which the Parent Company could deduct in the income tax
returns, and whose total amounts comes to euro 8.4 million;
- deferred costs referring specifically to the employees’ 14th month salary payment (euro 3.7
million) and the transfer of receivable contracts by Enel Distribuzione (euro 1.2 million);
- sundry receivables for a total of euro 18.7 million referring mainly (euro 10.1 million) to the credit
due from the Greek revenue authorities for indirect taxes (VAT) relating to the activities carried out
by the Terna branch in Greece, while the residual balance concerns items of minor significance
mostly relating to various advances given to employees and suppliers.
62
LIABILITIES AND SHAREHOLDERS’ EQUITY
C – SHAREHOLDERS’ EQUITY – euro 1,826.5 million
Comments on the changes in the consolidated shareholders’ equity during the first half of 2005 are
presented below:
Share capital – euro 440.0 million
TERNA SpA’s share capital is represented by 2,000,000,000 ordinary shares with a par value of euro 0.22
each, held by Enel S.p.A. for an interest holding of 36.142%; as far as the remaining 63.858% interest is
concerned (1,277,160,000 shares), it was apportioned following the public sale offer intended for public and
institutional investors and the subsequent accelerated bookbuilding transaction addressing Italian and
foreign institutional investors.
Legal reserve – euro 88.0 million
The legal reserve represents 20% of the Parent Company’s share capital.
Other reserves – euro 719.3 million
The other reserves underwent a net change of euro –420.4 million, essentially reflecting the following
changes:
• reclassification of the reserve pursuant to the so-called Vietti Law among the retained earnings (-
euro 421.3 million);
• adjustment to the fair value of the cash flow hedge derivative instruments net of the related tax
effect (- euro 4.0 million);
• provision to the capital reserve of the portion referring to the first half of 2005 (euro 4.9 million),
relating to the incentive obtained from the Brazilian Ministry of National Integration by the
subsidiaries TSN and Novatrans.
Retained earnings (losses carried forward) – euro 438.9 million
Retained earnings mainly refer to the reserve pursuant to the so-called Vietti Law (euro 421.3 million)
formed as of December 31, 2004 among the other reserves and reclassified during 2005 under retained
earnings. Other changes during the period essentially refer to the following events:
allocation to the legal reserve of euro 2.4 million by way of integration of the allocation to this reserve of the
surplus consolidated income for 2004, with respect to the dividend paid during the first half of 2005 (euro
140.0 million).
increase in the translation reserve (euro 66.3 million) as a result of the differences arising at the time of
consolidation of the foreign subsidiaries and essentially a consequence of the reduction in the exchange
rate of the Brazilian Real during the period. Within this sphere, the adjustment of the goodwill to the period
end exchange rate led to an increase in the item under review of euro 31.5 million.
63
Guarantees given amounted to euro 255.0 million and refer to the shares of the subsidiary companies TSN
and Novatrans, belonging to TERNA, given as security to the banks (BNDES – IDB) financing the
investment in Brazil.
The reconciliation of the shareholders’ equity and net income of the Parent Company as of June 30, 2005
with the corresponding consolidated amounts, is illustrated in the section “Statement of statutory and
consolidated reconciliation”.
64
E – NON-CURRENT LIABILITIES
The composition of non-current liabilities as of June 30, 2005 was as follows:
Millions of euro June 30, 2005 Dec. 31, 2004 Change Long-term loans 2,327.9 2,084.9 243.0 Termination indemnities and other employee benefits 138.9 138.3 0.6 Provisions for future risks and charges 42.8 40.8 2.0 Deferred tax liabilities 545.7 468.6 77.1 Non-current financial liabilities 48.4 31.5 16.9 Other non-current liabilities 164.5 158.2 6.3 Total 3,268.2 2,922.3 345.9
1) Long-term loans – euro 2,327.9 million
The item reflects the liability relating to the bond issues, medium/long-term bank loans and other
medium/long-term loans in euro and other currencies.
The table below provides a breakdown of the medium/long-term debt and the repayment plan as of June
30, 2005 with indication of the type of loan and interest rate, inclusive of the instalments falling due within
twelve months.
Balance Balance 2nd half 2007 2008 2009
Beyond
Millions of euro
Repayment period
Dec. 31, 2004
June 30, 2005
Current portion
Long-term portion
of 2006
Bond issue 2014-2024 1,435 1,508 0 1,508 0 0 0 0 1,508
EIB No. 20271 2014 68 65 7 58 3 7 7 7 34
EIB No. 21159 2016 250 250 23 227 11 23 23 23 147
EIB No. 22947 2020 0 100 0 100 0 0 0 5 95
BNDES 2016 332 411 22 389 12 26 30 34 287
IDB 2016 47 51 5 46 3 5 5 6 27
Total 2,132 2,385 57 2,328 30 61 65 74 2,098
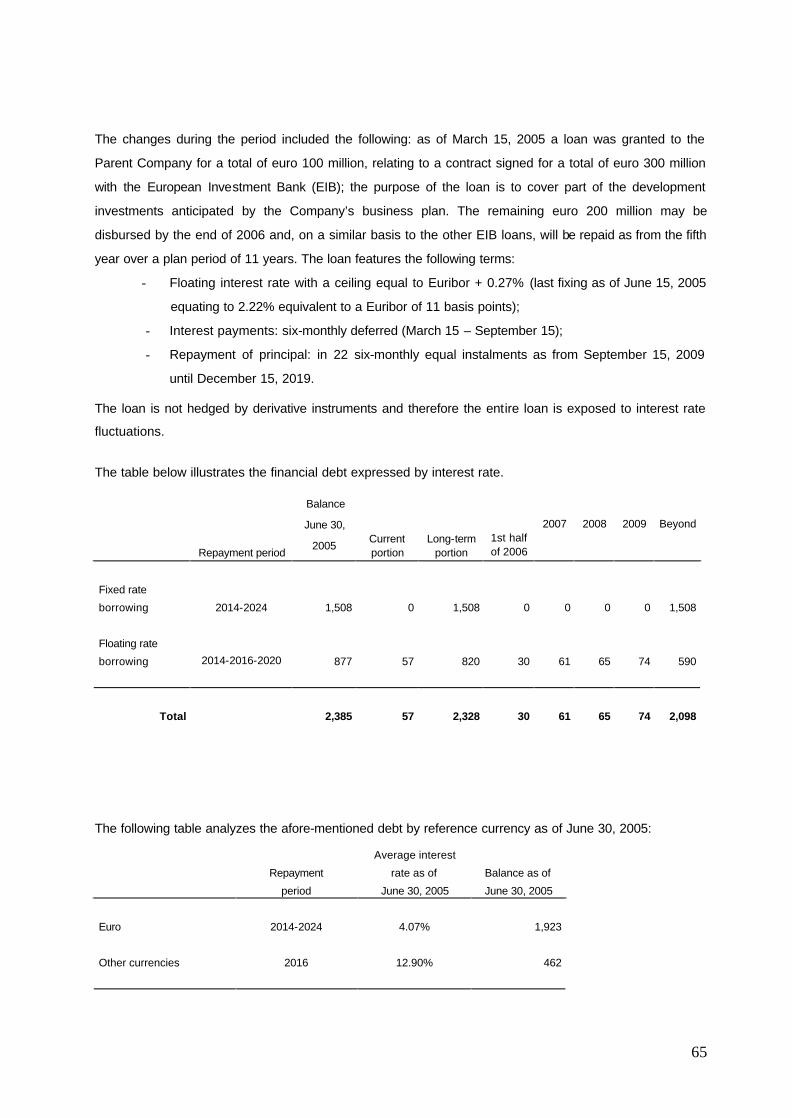
65
The changes during the period included the following: as of March 15, 2005 a loan was granted to the
Parent Company for a total of euro 100 million, relating to a contract signed for a total of euro 300 million
with the European Investment Bank (EIB); the purpose of the loan is to cover part of the development
investments anticipated by the Company’s business plan. The remaining euro 200 million may be
disbursed by the end of 2006 and, on a similar basis to the other EIB loans, will be repaid as from the fifth
year over a plan period of 11 years. The loan features the following terms:
- Floating interest rate with a ceiling equal to Euribor + 0.27% (last fixing as of June 15, 2005
equating to 2.22% equivalent to a Euribor of 11 basis points);
- Interest payments: six-monthly deferred (March 15 – September 15);
- Repayment of principal: in 22 six-monthly equal instalments as from September 15, 2009
until December 15, 2019.
The loan is not hedged by derivative instruments and therefore the entire loan is exposed to interest rate
fluctuations.
The table below illustrates the financial debt expressed by interest rate.
Repayment period
Balance
June 30,
2005 Current portion
Long-term portion
1st half of 2006
2007 2008 2009 Beyond
Fixed rate
borrowing 2014-2024 1,508 0 1,508 0 0 0 0 1,508
Floating rate
borrowing 2014-2016-2020 877 57 820 30 61 65 74 590
Total 2,385 57 2,328 30 61 65 74 2,098
The following table analyzes the afore-mentioned debt by reference currency as of June 30, 2005:
Average interest
Repayment rate as of Balance as of
period June 30, 2005 June 30, 2005
Euro 2014-2024 4.07% 1,923
Other currencies 2016 12.90% 462
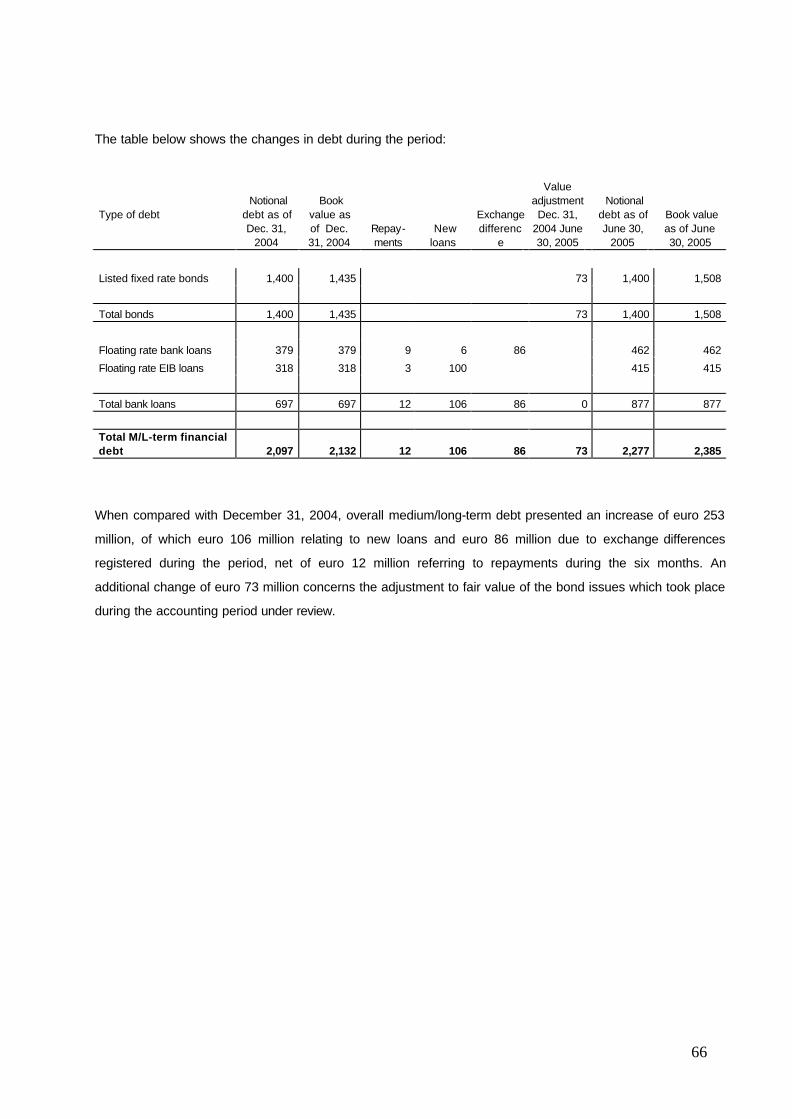
66
The table below shows the changes in debt during the period:
Type of debt Notional
debt as of Dec. 31,
2004
Book value as of Dec. 31, 2004
Repay-ments
New loans
Exchange differenc
e
Value adjustment Dec. 31,
2004 June 30, 2005
Notional debt as of June 30,
2005
Book value as of June 30, 2005
Listed fixed rate bonds 1,400 1,435 73 1,400 1,508
Total bonds 1,400 1,435 73 1,400 1,508
Floating rate bank loans 379 379 9 6 86 462 462
Floating rate EIB loans 318 318 3 100 415 415
Total bank loans 697 697 12 106 86 0 877 877
Total M/L-term financial debt 2,097 2,132 12 106 86 73 2,277 2,385
When compared with December 31, 2004, overall medium/long-term debt presented an increase of euro 253
million, of which euro 106 million relating to new loans and euro 86 million due to exchange differences
registered during the period, net of euro 12 million referring to repayments during the six months. An
additional change of euro 73 million concerns the adjustment to fair value of the bond issues which took place
during the accounting period under review.
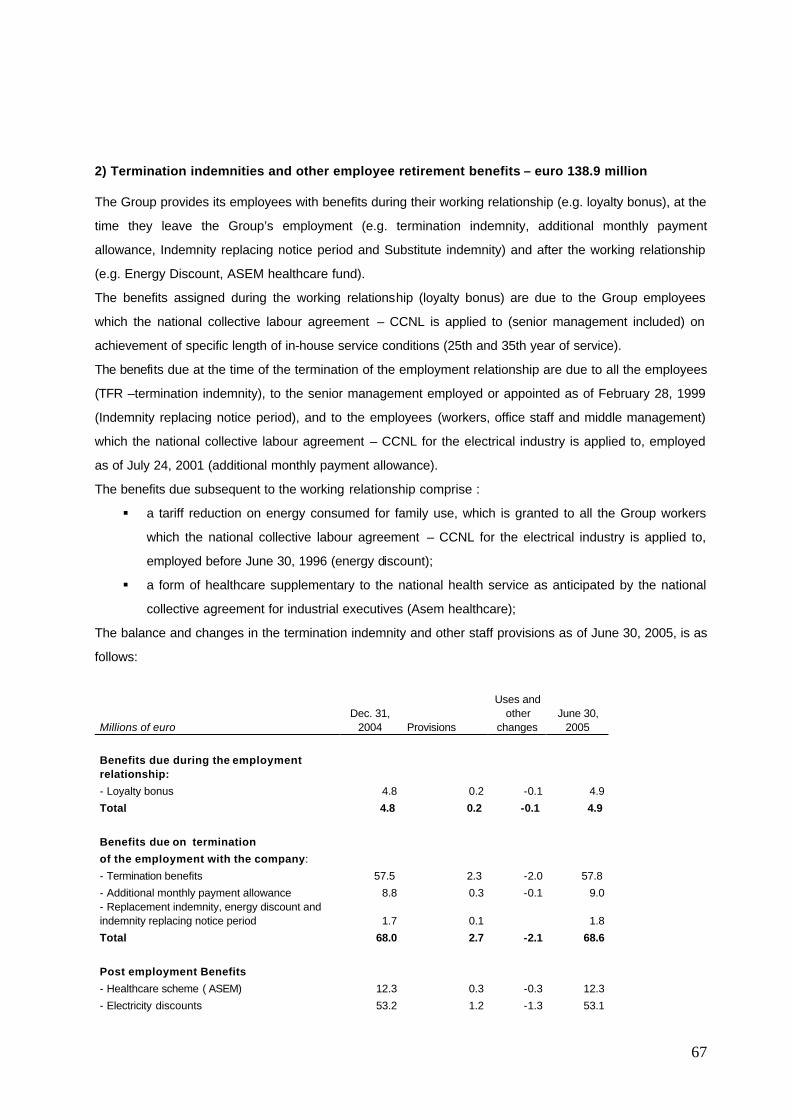
67
2) Termination indemnities and other employee retirement benefits – euro 138.9 million
The Group provides its employees with benefits during their working relationship (e.g. loyalty bonus), at the
time they leave the Group’s employment (e.g. termination indemnity, additional monthly payment
allowance, Indemnity replacing notice period and Substitute indemnity) and after the working relationship
(e.g. Energy Discount, ASEM healthcare fund).
The benefits assigned during the working relationship (loyalty bonus) are due to the Group employees
which the national collective labour agreement – CCNL is applied to (senior management included) on
achievement of specific length of in-house service conditions (25th and 35th year of service).
The benefits due at the time of the termination of the employment relationship are due to all the employees
(TFR –termination indemnity), to the senior management employed or appointed as of February 28, 1999
(Indemnity replacing notice period), and to the employees (workers, office staff and middle management)
which the national collective labour agreement – CCNL for the electrical industry is applied to, employed
as of July 24, 2001 (additional monthly payment allowance).
The benefits due subsequent to the working relationship comprise :
§ a tariff reduction on energy consumed for family use, which is granted to all the Group workers
which the national collective labour agreement – CCNL for the electrical industry is applied to,
employed before June 30, 1996 (energy discount);
§ a form of healthcare supplementary to the national health service as anticipated by the national
collective agreement for industrial executives (Asem healthcare);
The balance and changes in the termination indemnity and other staff provisions as of June 30, 2005, is as
follows:
Millions of euro
Dec. 31, 2004 Provisions
Uses and other
changes June 30,
2005
Benefits due during the employment relationship:
- Loyalty bonus 4.8 0.2 -0.1 4.9
Total 4.8 0.2 -0.1 4.9
Benefits due on termination
of the employment with the company:
- Termination benefits 57.5 2.3 -2.0 57.8
- Additional monthly payment allowance 8.8 0.3 -0.1 9.0 - Replacement indemnity, energy discount and indemnity replacing notice period 1.7 0.1 1.8
Total 68.0 2.7 -2.1 68.6
Post employment Benefits
- Healthcare scheme ( ASEM) 12.3 0.3 -0.3 12.3
- Electricity discounts 53.2 1.2 -1.3 53.1
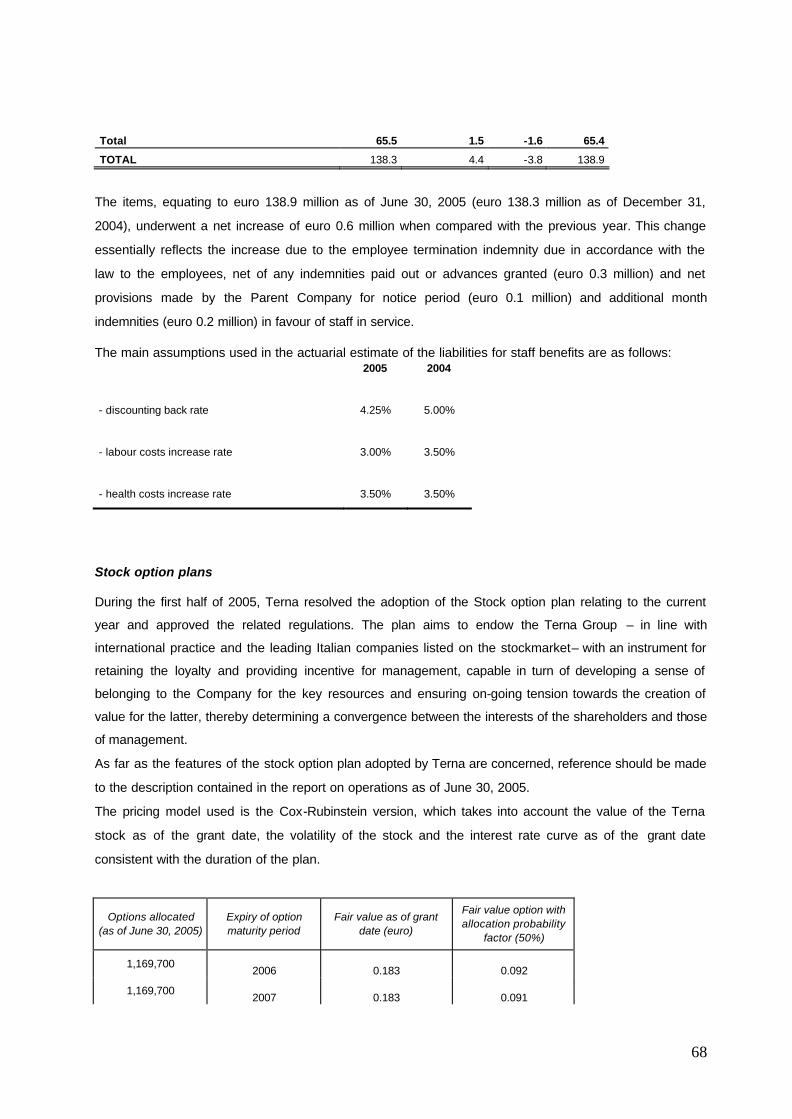
68
Total 65.5 1.5 -1.6 65.4
TOTAL 138.3 4.4 -3.8 138.9
The items, equating to euro 138.9 million as of June 30, 2005 (euro 138.3 million as of December 31,
2004), underwent a net increase of euro 0.6 million when compared with the previous year. This change
essentially reflects the increase due to the employee termination indemnity due in accordance with the
law to the employees, net of any indemnities paid out or advances granted (euro 0.3 million) and net
provisions made by the Parent Company for notice period (euro 0.1 million) and additional month
indemnities (euro 0.2 million) in favour of staff in service.
The main assumptions used in the actuarial estimate of the liabilities for staff benefits are as follows: 2005 2004
- discounting back rate 4.25% 5.00%
- labour costs increase rate 3.00% 3.50%
- health costs increase rate 3.50% 3.50%
Stock option plans
During the first half of 2005, Terna resolved the adoption of the Stock option plan relating to the current
year and approved the related regulations. The plan aims to endow the Terna Group – in line with
international practice and the leading Italian companies listed on the stockmarket– with an instrument for
retaining the loyalty and providing incentive for management, capable in turn of developing a sense of
belonging to the Company for the key resources and ensuring on-going tension towards the creation of
value for the latter, thereby determining a convergence between the interests of the shareholders and those
of management.
As far as the features of the stock option plan adopted by Terna are concerned, reference should be made
to the description contained in the report on operations as of June 30, 2005.
The pricing model used is the Cox-Rubinstein version, which takes into account the value of the Terna
stock as of the grant date, the volatility of the stock and the interest rate curve as of the grant date
consistent with the duration of the plan.
Options allocated (as of June 30, 2005)
Expiry of option maturity period
Fair value as of grant date (euro)
Fair value option with allocation probability
factor (50%)
1,169,700 2006 0.183 0.092
1,169,700 2007 0.183 0.091
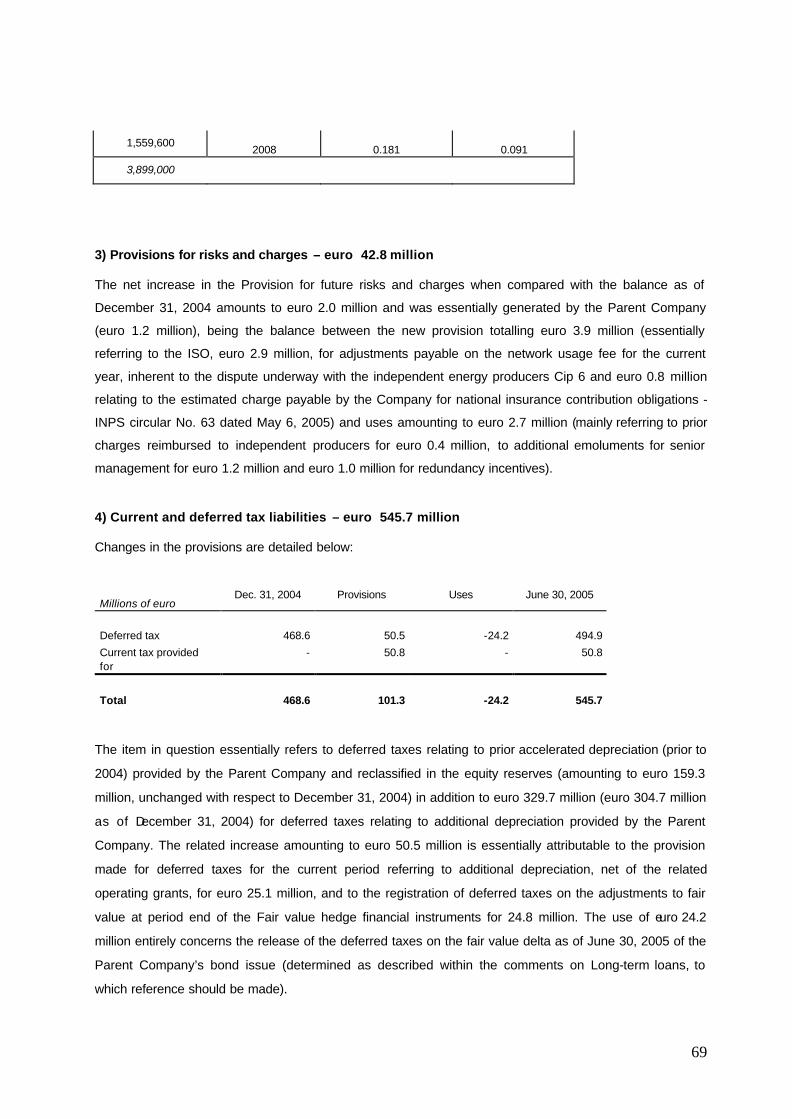
69
1,559,600 2008 0.181 0.091
3,899,000
3) Provisions for risks and charges – euro 42.8 million
The net increase in the Provision for future risks and charges when compared with the balance as of
December 31, 2004 amounts to euro 2.0 million and was essentially generated by the Parent Company
(euro 1.2 million), being the balance between the new provision totalling euro 3.9 million (essentially
referring to the ISO, euro 2.9 million, for adjustments payable on the network usage fee for the current
year, inherent to the dispute underway with the independent energy producers Cip 6 and euro 0.8 million
relating to the estimated charge payable by the Company for national insurance contribution obligations -
INPS circular No. 63 dated May 6, 2005) and uses amounting to euro 2.7 million (mainly referring to prior
charges reimbursed to independent producers for euro 0.4 million, to additional emoluments for senior
management for euro 1.2 million and euro 1.0 million for redundancy incentives).
4) Current and deferred tax liabilities – euro 545.7 million
Changes in the provisions are detailed below:
Millions of euro Dec. 31, 2004 Provisions Uses June 30, 2005
Deferred tax 468.6 50.5 -24.2 494.9
Current tax provided for
- 50.8 - 50.8
Total 468.6 101.3 -24.2 545.7
The item in question essentially refers to deferred taxes relating to prior accelerated depreciation (prior to
2004) provided by the Parent Company and reclassified in the equity reserves (amounting to euro 159.3
million, unchanged with respect to December 31, 2004) in addition to euro 329.7 million (euro 304.7 million
as of December 31, 2004) for deferred taxes relating to additional depreciation provided by the Parent
Company. The related increase amounting to euro 50.5 million is essentially attributable to the provision
made for deferred taxes for the current period referring to additional depreciation, net of the related
operating grants, for euro 25.1 million, and to the registration of deferred taxes on the adjustments to fair
value at period end of the Fair value hedge financial instruments for 24.8 million. The use of euro 24.2
million entirely concerns the release of the deferred taxes on the fair value delta as of June 30, 2005 of the
Parent Company’s bond issue (determined as described within the comments on Long-term loans, to
which reference should be made).
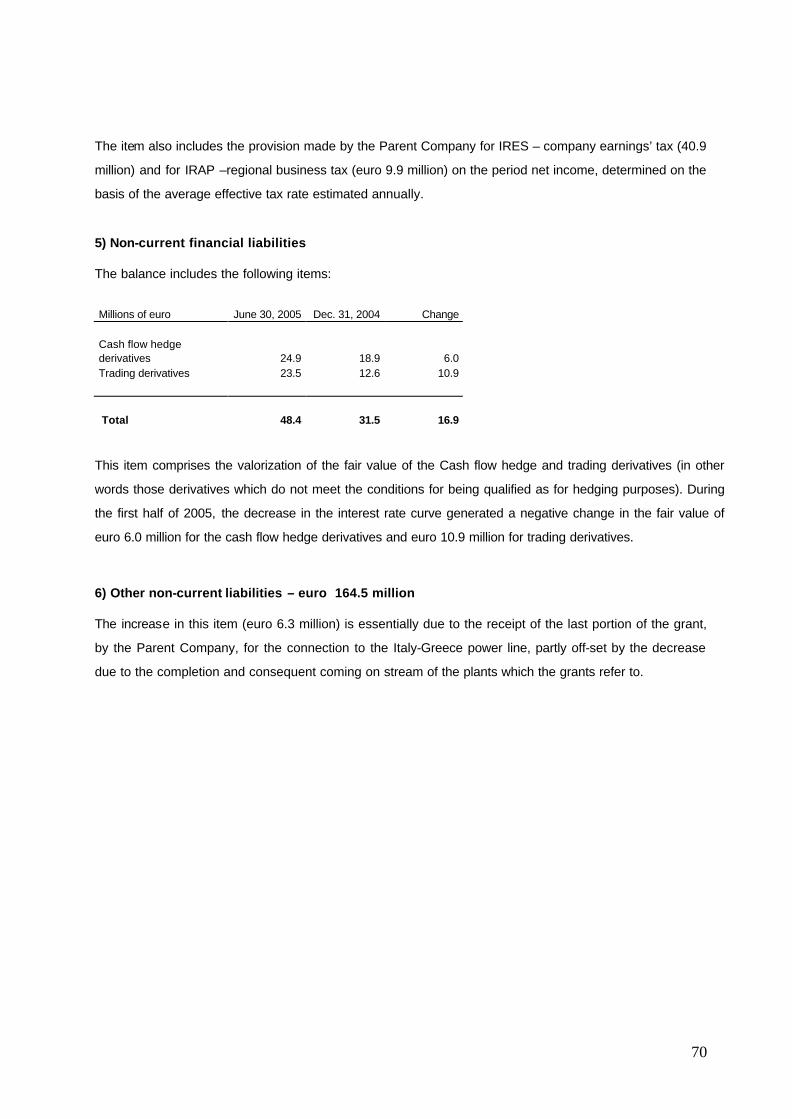
70
The item also includes the provision made by the Parent Company for IRES – company earnings’ tax (40.9
million) and for IRAP –regional business tax (euro 9.9 million) on the period net income, determined on the
basis of the average effective tax rate estimated annually.
5) Non-current financial liabilities
The balance includes the following items:
Millions of euro June 30, 2005 Dec. 31, 2004 Change Cash flow hedge derivatives 24.9 18.9 6.0 Trading derivatives 23.5 12.6 10.9 Total 48.4 31.5 16.9
This item comprises the valorization of the fair value of the Cash flow hedge and trading derivatives (in other
words those derivatives which do not meet the conditions for being qualified as for hedging purposes). During
the first half of 2005, the decrease in the interest rate curve generated a negative change in the fair value of
euro 6.0 million for the cash flow hedge derivatives and euro 10.9 million for trading derivatives.
6) Other non-current liabilities – euro 164.5 million
The increase in this item (euro 6.3 million) is essentially due to the receipt of the last portion of the grant,
by the Parent Company, for the connection to the Italy-Greece power line, partly off-set by the decrease
due to the completion and consequent coming on stream of the plants which the grants refer to.
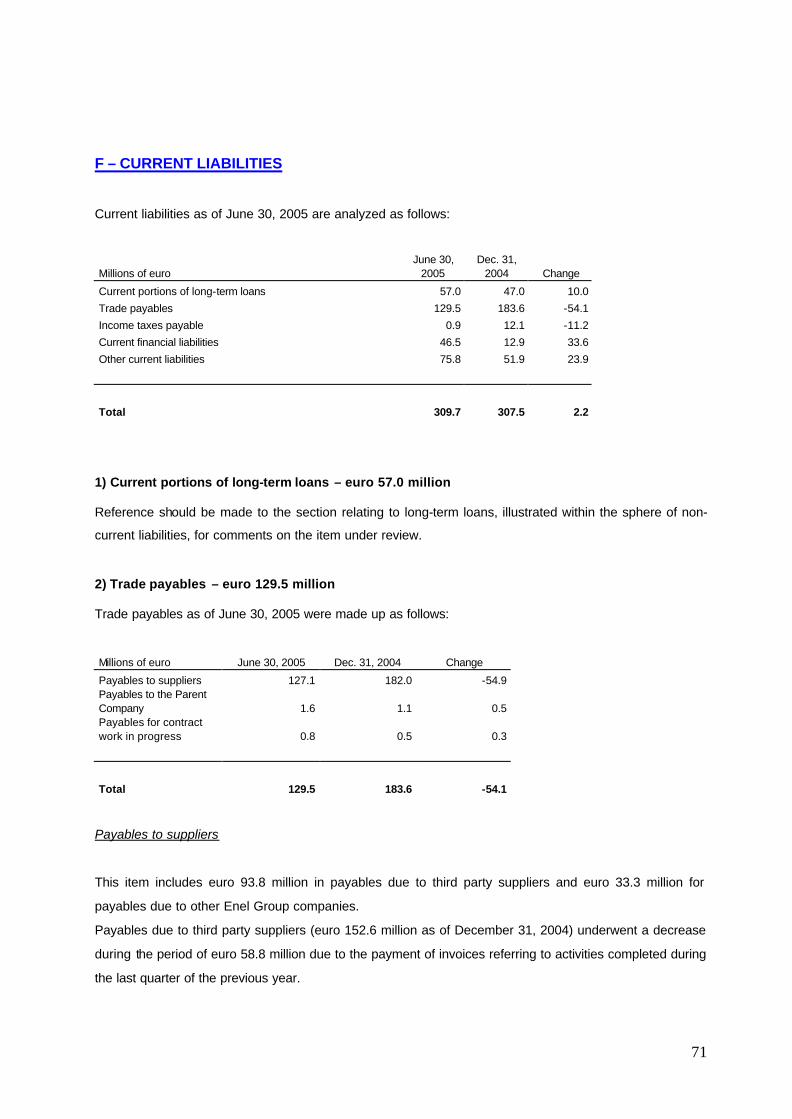
71
F – CURRENT LIABILITIES
Current liabilities as of June 30, 2005 are analyzed as follows:
Millions of euro June 30,
2005 Dec. 31,
2004 Change
Current portions of long-term loans 57.0 47.0 10.0
Trade payables 129.5 183.6 -54.1
Income taxes payable 0.9 12.1 -11.2
Current financial liabilities 46.5 12.9 33.6
Other current liabilities 75.8 51.9 23.9
Total 309.7 307.5 2.2
1) Current portions of long-term loans – euro 57.0 million
Reference should be made to the section relating to long-term loans, illustrated within the sphere of non-
current liabilities, for comments on the item under review.
2) Trade payables – euro 129.5 million
Trade payables as of June 30, 2005 were made up as follows:
Millions of euro June 30, 2005 Dec. 31, 2004 Change
Payables to suppliers 127.1 182.0 -54.9 Payables to the Parent Company 1.6 1.1 0.5 Payables for contract work in progress 0.8 0.5 0.3
Total 129.5 183.6 -54.1
Payables to suppliers
This item includes euro 93.8 million in payables due to third party suppliers and euro 33.3 million for
payables due to other Enel Group companies.
Payables due to third party suppliers (euro 152.6 million as of December 31, 2004) underwent a decrease
during the period of euro 58.8 million due to the payment of invoices referring to activities completed during
the last quarter of the previous year.
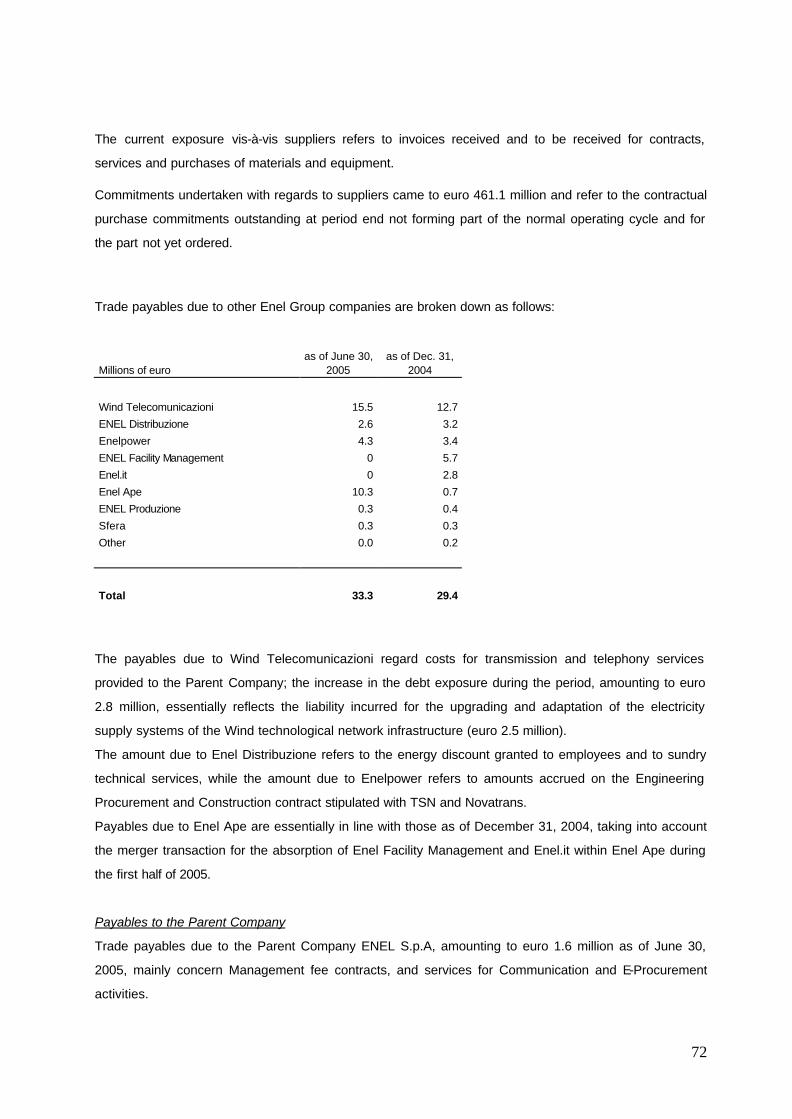
72
The current exposure vis-à-vis suppliers refers to invoices received and to be received for contracts,
services and purchases of materials and equipment.
Commitments undertaken with regards to suppliers came to euro 461.1 million and refer to the contractual
purchase commitments outstanding at period end not forming part of the normal operating cycle and for
the part not yet ordered.
Trade payables due to other Enel Group companies are broken down as follows:
Millions of euro as of June 30,
2005 as of Dec. 31,
2004
Wind Telecomunicazioni 15.5 12.7
ENEL Distribuzione 2.6 3.2
Enelpower 4.3 3.4
ENEL Facility Management 0 5.7
Enel.it 0 2.8
Enel Ape 10.3 0.7
ENEL Produzione 0.3 0.4
Sfera 0.3 0.3
Other 0.0 0.2
Total 33.3 29.4
The payables due to Wind Telecomunicazioni regard costs for transmission and telephony services
provided to the Parent Company; the increase in the debt exposure during the period, amounting to euro
2.8 million, essentially reflects the liability incurred for the upgrading and adaptation of the electricity
supply systems of the Wind technological network infrastructure (euro 2.5 million).
The amount due to Enel Distribuzione refers to the energy discount granted to employees and to sundry
technical services, while the amount due to Enelpower refers to amounts accrued on the Engineering
Procurement and Construction contract stipulated with TSN and Novatrans.
Payables due to Enel Ape are essentially in line with those as of December 31, 2004, taking into account
the merger transaction for the absorption of Enel Facility Management and Enel.it within Enel Ape during
the first half of 2005.
Payables to the Parent Company
Trade payables due to the Parent Company ENEL S.p.A, amounting to euro 1.6 million as of June 30,
2005, mainly concern Management fee contracts, and services for Communication and E-Procurement
activities.
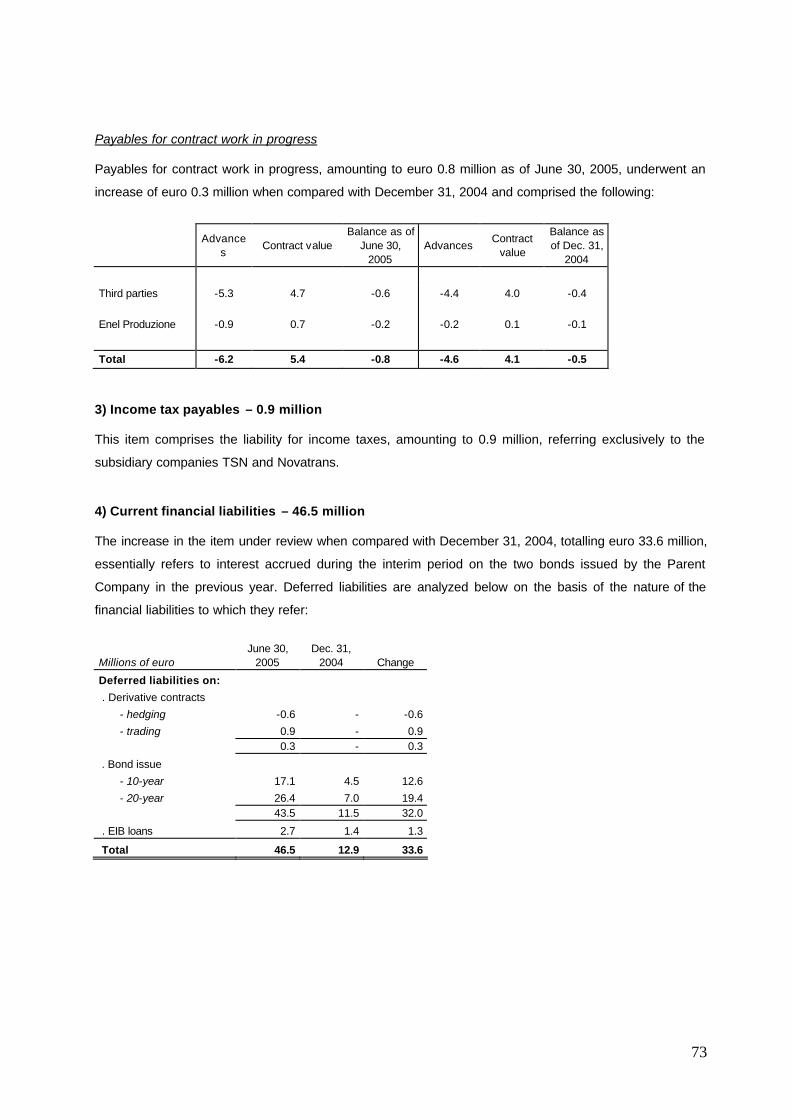
73
Payables for contract work in progress
Payables for contract work in progress, amounting to euro 0.8 million as of June 30, 2005, underwent an
increase of euro 0.3 million when compared with December 31, 2004 and comprised the following:
Advance
s Contract value
Balance as of June 30,
2005 Advances
Contract value
Balance as of Dec. 31,
2004
Third parties -5.3 4.7 -0.6 -4.4 4.0 -0.4 Enel Produzione -0.9 0.7 -0.2 -0.2 0.1 -0.1
Total -6.2 5.4 -0.8 -4.6 4.1 -0.5
3) Income tax payables – 0.9 million
This item comprises the liability for income taxes, amounting to 0.9 million, referring exclusively to the
subsidiary companies TSN and Novatrans.
4) Current financial liabilities – 46.5 million
The increase in the item under review when compared with December 31, 2004, totalling euro 33.6 million,
essentially refers to interest accrued during the interim period on the two bonds issued by the Parent
Company in the previous year. Deferred liabilities are analyzed below on the basis of the nature of the
financial liabilities to which they refer:
Millions of euro June 30,
2005 Dec. 31,
2004 Change
Deferred liabilities on:
. Derivative contracts
- hedging -0.6 - -0.6
- trading 0.9 - 0.9 0.3 - 0.3
. Bond issue
- 10-year 17.1 4.5 12.6
- 20-year 26.4 7.0 19.4 43.5 11.5 32.0
. EIB loans 2.7 1.4 1.3
Total 46.5 12.9 33.6
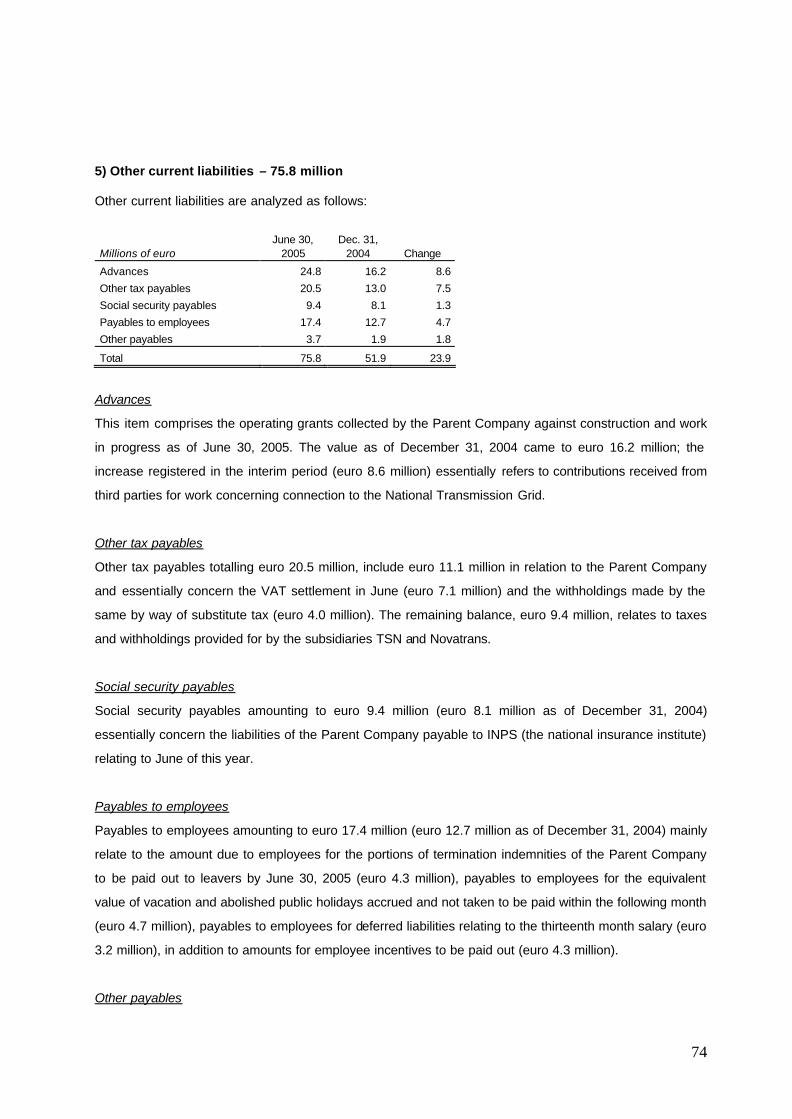
74
5) Other current liabilities – 75.8 million
Other current liabilities are analyzed as follows:
Millions of euro June 30,
2005 Dec. 31,
2004 Change
Advances 24.8 16.2 8.6
Other tax payables 20.5 13.0 7.5
Social security payables 9.4 8.1 1.3
Payables to employees 17.4 12.7 4.7
Other payables 3.7 1.9 1.8
Total 75.8 51.9 23.9
Advances
This item comprises the operating grants collected by the Parent Company against construction and work
in progress as of June 30, 2005. The value as of December 31, 2004 came to euro 16.2 million; the
increase registered in the interim period (euro 8.6 million) essentially refers to contributions received from
third parties for work concerning connection to the National Transmission Grid.
Other tax payables
Other tax payables totalling euro 20.5 million, include euro 11.1 million in relation to the Parent Company
and essentially concern the VAT settlement in June (euro 7.1 million) and the withholdings made by the
same by way of substitute tax (euro 4.0 million). The remaining balance, euro 9.4 million, relates to taxes
and withholdings provided for by the subsidiaries TSN and Novatrans.
Social security payables
Social security payables amounting to euro 9.4 million (euro 8.1 million as of December 31, 2004)
essentially concern the liabilities of the Parent Company payable to INPS (the national insurance institute)
relating to June of this year.
Payables to employees
Payables to employees amounting to euro 17.4 million (euro 12.7 million as of December 31, 2004) mainly
relate to the amount due to employees for the portions of termination indemnities of the Parent Company
to be paid out to leavers by June 30, 2005 (euro 4.3 million), payables to employees for the equivalent
value of vacation and abolished public holidays accrued and not taken to be paid within the following month
(euro 4.7 million), payables to employees for deferred liabilities relating to the thirteenth month salary (euro
3.2 million), in addition to amounts for employee incentives to be paid out (euro 4.3 million).
Other payables
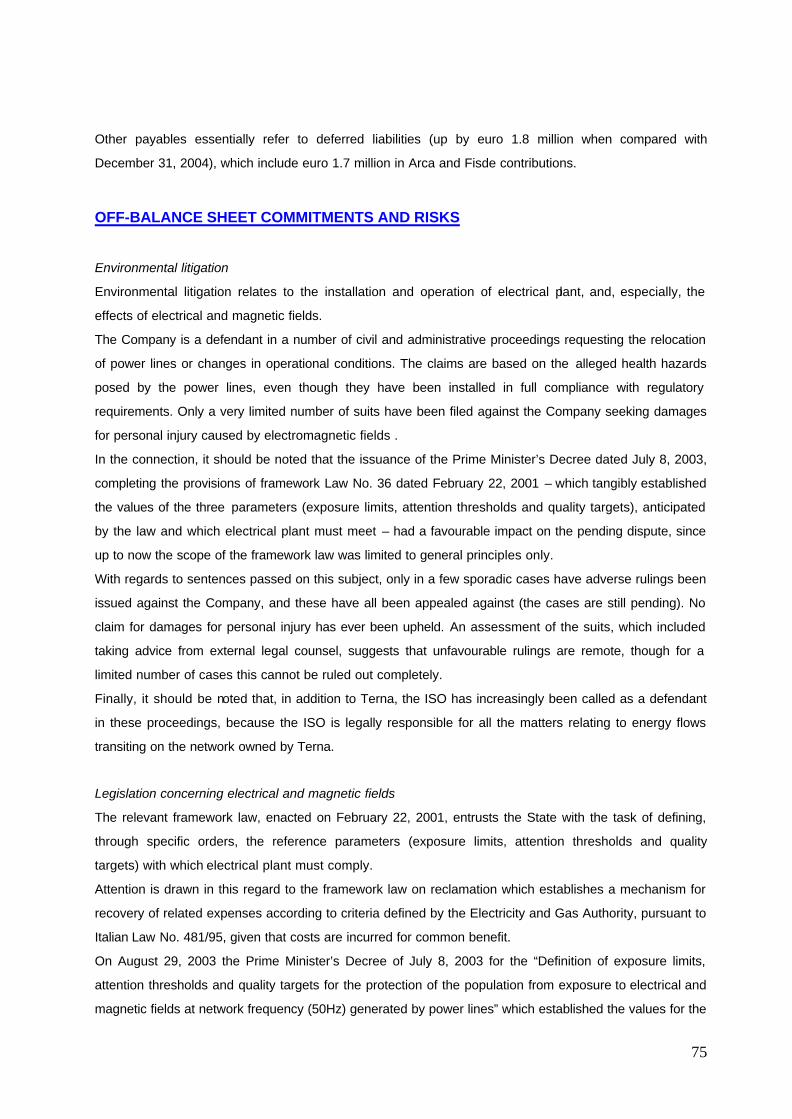
75
Other payables essentially refer to deferred liabilities (up by euro 1.8 million when compared with
December 31, 2004), which include euro 1.7 million in Arca and Fisde contributions.
OFF-BALANCE SHEET COMMITMENTS AND RISKS
Environmental litigation
Environmental litigation relates to the installation and operation of electrical plant, and, especially, the
effects of electrical and magnetic fields.
The Company is a defendant in a number of civil and administrative proceedings requesting the relocation
of power lines or changes in operational conditions. The claims are based on the alleged health hazards
posed by the power lines, even though they have been installed in full compliance with regulatory
requirements. Only a very limited number of suits have been filed against the Company seeking damages
for personal injury caused by electromagnetic fields .
In the connection, it should be noted that the issuance of the Prime Minister’s Decree dated July 8, 2003,
completing the provisions of framework Law No. 36 dated February 22, 2001 – which tangibly established
the values of the three parameters (exposure limits, attention thresholds and quality targets), anticipated
by the law and which electrical plant must meet – had a favourable impact on the pending dispute, since
up to now the scope of the framework law was limited to general principles only.
With regards to sentences passed on this subject, only in a few sporadic cases have adverse rulings been
issued against the Company, and these have all been appealed against (the cases are still pending). No
claim for damages for personal injury has ever been upheld. An assessment of the suits, which included
taking advice from external legal counsel, suggests that unfavourable rulings are remote, though for a
limited number of cases this cannot be ruled out completely.
Finally, it should be noted that, in addition to Terna, the ISO has increasingly been called as a defendant
in these proceedings, because the ISO is legally responsible for all the matters relating to energy flows
transiting on the network owned by Terna.
Legislation concerning electrical and magnetic fields
The relevant framework law, enacted on February 22, 2001, entrusts the State with the task of defining,
through specific orders, the reference parameters (exposure limits, attention thresholds and quality
targets) with which electrical plant must comply.
Attention is drawn in this regard to the framework law on reclamation which establishes a mechanism for
recovery of related expenses according to criteria defined by the Electricity and Gas Authority, pursuant to
Italian Law No. 481/95, given that costs are incurred for common benefit.
On August 29, 2003 the Prime Minister’s Decree of July 8, 2003 for the “Definition of exposure limits,
attention thresholds and quality targets for the protection of the population from exposure to electrical and
magnetic fields at network frequency (50Hz) generated by power lines” which established the values for the
76
three parameters provided by the framework law, was published in the Official Gazette of the Italian
Republic.
According to Company assessments, an estimated cost of over euro 400 million shall be incurred in
implementing appropriate investments. The relevant interventions are expected to commence in 2007 and
continue until at least 2014.
At regional legislative level, some regional authorities have formulated bills governing the matter, which
establish more restrictive limits compared to those prescribed by the Prime Minister’s Decree dated 1992,
and by the more recent prime Minister’s Decree of July 8, 2003.
However, it must be noted that on October 7, 2003 judgement No. 307 of the Constitutional Court was
published and this declared some regional laws on the matter of electromagnetic fields to be
constitutionally unlawful (amongst which the law of the Campania regional authority No. 13 dated
November 24, 2001). It also established the principle that derogation from the State law is not permitted,
even where this may involve higher standards being implemented by regional laws, as public health must
be uniformly guaranteed throughout the Italian territory.
Other pending litigation
A number of legal disputes are pending in relation to urban planning and environmental issues associated
with the construction and operation of a number of transmission lines. Adverse rulings could have
repercussions, but since the impact cannot be quantified at present, they have not been included under
the “Provision for disputes and sundry risks”. An assessment of the suits, which included taking advice
from external legal counsel, suggests that unfavourable rulings are remote, though for a limited number of
cases this cannot be ruled out completely. The effects of an adverse ruling could include not only the
payment of damages but also the costs involved in modifying power lines and the temporary unavailability
of the lines.
In any case, an adverse outcome would not jeopardize the operation of the power lines.
77
EVENTS SUBSEQUENT TO JUNE 30, 2005
Tariff review for 2006
During March 2005, the Lombardy TAR (Regional Administrative Court) by means of rulings No. 956, No.
958, No. 959, No. 960, No. 961, No. 962 and No. 963 partially annulled the Electricity and Gas Authority
(AEEG) resolution No. 05/04 and in particular the provisions which discipline the V1 tariff restriction,
pursuant to Article 8 of Attachment A of the afore-mentioned resolution, and the provisions concerning
connection contributions and fixed dues, pursuant to Article 9.1 of resolution No. 05/04.
The Authority decided to appeal to the Council of State against the afore-mentioned sentences, at the
same time presenting a petition for precautionary suspension. Pending the ruling by the Council of State
on the afore-mentioned suspension petition, by means of an announcement dated July 29, 2005, the
AEEG considered it opportune to defer the 2006 review of the fees for the electricity transmission and
distribution service, as well as the connection contributions and the fixed dues, anticipated by July 31, in
accordance with the Integrated Text and the AEEG resolution No. 05/04.
Antitrust authority
By means of ruling No. 14542 dated August 4, 2005, communicated to the parties on August 5, 2005, the
Competition and Market Authority (Antitrust authority) issued its authorization for the acquisition, by the
company Cassa Depositi e Prestiti (CdP), of 29.99% of Terna’s share capital and the ISO business
segment, obliging CDP to observe the following measures:
a) the transfer, as from July 1, 2007 and within the subsequent 24 months, by CDP of the equity
investment held in ENEL S.p.A., as well as
b) provisionally and until the satisfaction of the afore-mentioned condition, the undertaking of the
following commitments:
- i) approval by the new Terna Board of Directors of a resolution which lays down suitable
procedures for enhancing the role of the Advisory Committee pursuant to Article 1 of the
D.P.C.M. dated May 11, 2004 in relation to the adoption and implementation of the NTG
development plans;
- ii) appointment of at least six of the seven Terna directors, due CDP in the event of a Board of
Directors comprising ten members, who are independents.
78
Acea Trasmissione
On August 8, Terna and Acea SpA (Acea) signed the contract for the purchase by Terna of the entire
share capital of Acea Trasmissione SpA (Acea Trasmissione), a company wholly-owned by Acea.
Acea Trasmissione, which holds a portion of the National Transmission Grid (NTG), is owner of part of the
high-voltage power lines in Lazio, Umbria and Abruzzo and ensures the maintenance and the development
of the portion of NTG it owns.
By means of this acquisition, Terna launches the process for the unification of the National Transmission
Grid anticipated by Italian Law No. 290/2003, which disciplines the re-organization of the electricity sector,
and by the subsequent DPCM dated May 11, 2004.
The parties have agreed a price of euro 32.9 million for the transfer of the Acea Trasmissione equity
investment. Finalization of the transaction is dependant on authorization issued by the Antitrust authority.
Consultation document on the incentives for network re-unification
“Incentive instruments for aggregation of the ownership of the national transmission network”
Article 2 of the DPCM dated May 11, 2004 containing the criteria, methods and conditions for the
unification and the management of the National Transmission Grid, establishes that, in order to improve
the safety and the running efficiency of the NTG, the Authority assesses and, if necessary, arranges for
the adoption of incentive instruments – also tariff-based – aimed at furthering the complete unification of
the NTG ownership. In this connection, the Authority is provided with the faculty to differentiate the afore-
mentioned instruments if the unification of the ownership involves investment in Terna’s share capital by
the other owners, thereby encouraging the pluralist composition of the shareholding structure.
The afore-mentioned DPCM has set April 30, 2006 as the final date for the applicability of the incentive
instruments.
The AEEG has made an initial attempt at following up the DPCM by means of the publication on August
22, 2005 of a consultation document in which it illustrates the approaches which it intends to adopt in
relation to the definition of the incentives pursuant to Article 2 of the afore-mentioned DPCM.
The following two instruments are proposed in the document:
A. The application of an incentive/disincentive to be applied in the event that the merger transactions take
place, respectively, by/after April 30, 2006.
The sum total of the incentive/disincentive will be estimated by the ISO on the basis of conditions
established by the Authority so as to reflect the expected efficiency of the merger of the residual
portions of the NTG falling under the responsibility of the Unified Transmission Operator.
While the incentive is paid to the sellers by the Independent Operator and is recovered by the latter via
the tariff proceeds, the disincentive is imposed on the owners who are not re-unified thereby
decreasing their tariff proceeds.
79
B. The hypothesis of a further incentive measure provided by the increase of the RAB yield by 1% - 2%
for a period of 3 - 5 years extendable for an additional period of 2 – 3 years in the event that the seller
opts for investment in Terna share capital.
80
TRANSACTIONS WITH RELATED PARTIES
With regard to the Terna Group’s transactions during the first half of 2005, related parties are represented
by transactions with subsidiary companies and companies belonging to the ENEL Group.
The transactions carried out by Terna with related parties mainly concern the exchange of goods, the
provision of services, the lending of financial resources, the coverage of insurance risks, as well as
administrative, tax, legal and corporate assistance.
All the transactions form part of the ordinary operations and are regulated on an arms’-length basis, in
other words at conditions which would be applied between two independent parties.
Lastly, shareholders are reminded that within the sphere of the corporate governance regulations which the
Terna Group has adopted, the conditions have been anticipated for ensuring that the transactions with
related parties are carried out in observance of the criteria of procedural and substantive correctness.
Main income statement items
In millions of
euro Company and nature of transaction
Revenues for other sales and
services
11.6
ENEL Distribuzione- Services for running and maintenance of the
HV lines belonging to Enel Distribuzione
5.6
ENEL.Net – services relating to the support of the F.O. on plants
belonging to Terna as well as the running, maintenance and
development of the same
0.5
ENEL Produzione - services relating to jobs for the construction of
plants, as well as sundry services and maintenance on Enel
Produzione SpA plants.
1.1
WIND Telecomunicazioni - activities for teletransmission and
telephone equipment housing
0.1
Enelpower - sundry maintenance and services on Enelpower SpA
plants
Costs for services 11.2
WIND Telecomunicazioni - Wind Telecomunicazioni services for
telecommunications services and services for the development of
special projects (SCTI)
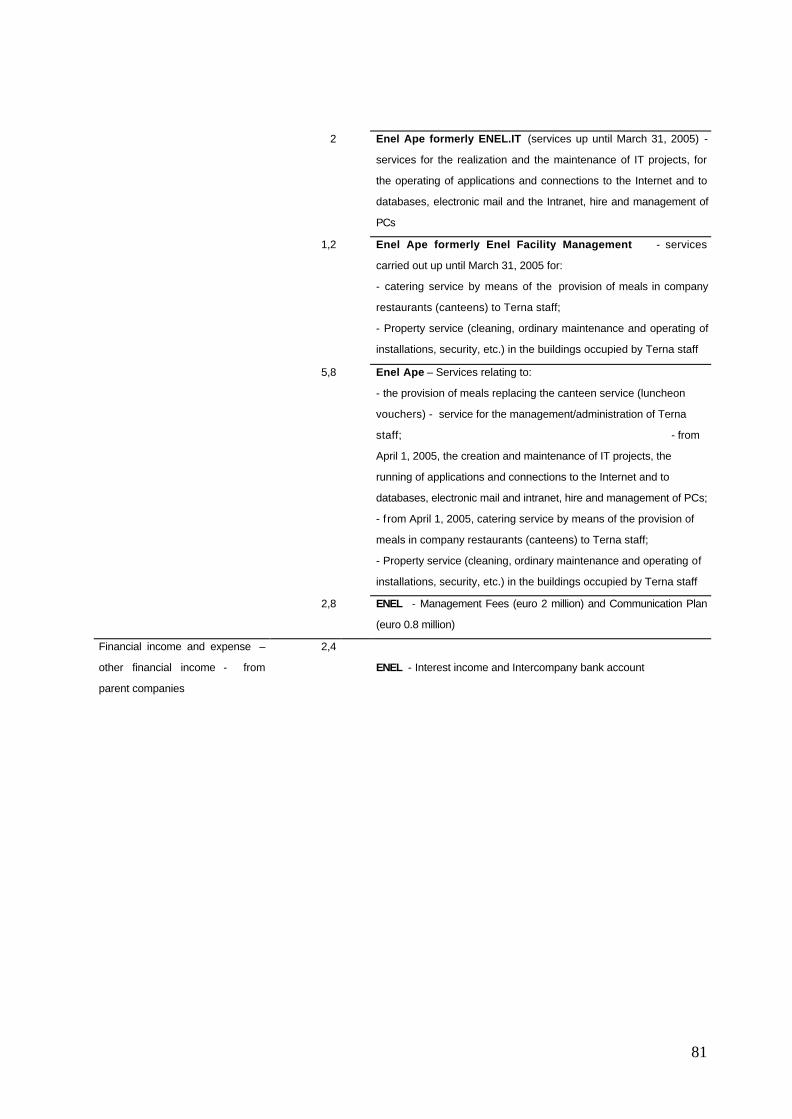
81
2
Enel Ape formerly ENEL.IT (services up until March 31, 2005) -
services for the realization and the maintenance of IT projects, for
the operating of applications and connections to the Internet and to
databases, electronic mail and the Intranet, hire and management of
PCs
1,2
Enel Ape formerly Enel Facility Management - services
carried out up until March 31, 2005 for:
- catering service by means of the provision of meals in company
restaurants (canteens) to Terna staff;
- Property service (cleaning, ordinary maintenance and operating of
installations, security, etc.) in the buildings occupied by Terna staff
5,8
Enel Ape – Services relating to:
- the provision of meals replacing the canteen service (luncheon
vouchers) - service for the management/administration of Terna
staff; - from
April 1, 2005, the creation and maintenance of IT projects, the
running of applications and connections to the Internet and to
databases, electronic mail and intranet, hire and management of PCs;
- f rom April 1, 2005, catering service by means of the provision of
meals in company restaurants (canteens) to Terna staff;
- Property service (cleaning, ordinary maintenance and operating of
installations, security, etc.) in the buildings occupied by Terna staff
2,8
ENEL - Management Fees (euro 2 million) and Communication Plan
(euro 0.8 million)
Financial income and expense –
other financial income - from
parent companies
2,4
ENEL - Interest income and Intercompany bank account

Attachments
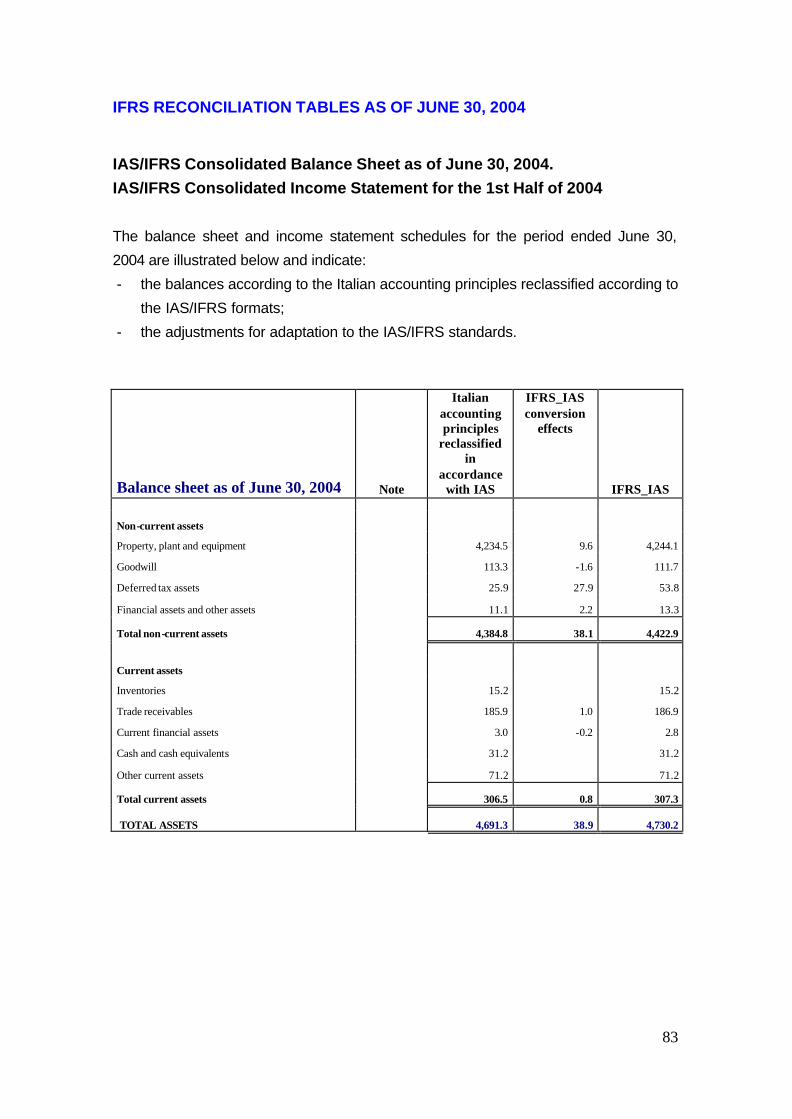
83
IFRS RECONCILIATION TABLES AS OF JUNE 30, 2004
IAS/IFRS Consolidated Balance Sheet as of June 30, 2004. IAS/IFRS Consolidated Income Statement for the 1st Half of 2004
The balance sheet and income statement schedules for the period ended June 30,
2004 are illustrated below and indicate:
- the balances according to the Italian accounting principles reclassified according to
the IAS/IFRS formats;
- the adjustments for adaptation to the IAS/IFRS standards.
Balance sheet as of June 30, 2004 Note
Italian accounting principles
reclassified in
accordance with IAS
IFRS_IAS conversion
effects
IFRS_IAS
Non-current assets
Property, plant and equipment 4,234.5 9.6 4,244.1
Goodwill 113.3 -1.6 111.7
Deferred tax assets 25.9 27.9 53.8
Financial assets and other assets 11.1 2.2 13.3
Total non-current assets 4,384.8 38.1 4,422.9
Current assets
Inventories 15.2 15.2
Trade receivables 185.9 1.0 186.9
Current financial assets 3.0 -0.2 2.8
Cash and cash equivalents 31.2 31.2
Other current assets 71.2 71.2
Total current assets 306.5 0.8 307.3
TOTAL ASSETS 4,691.3 38.9 4,730.2
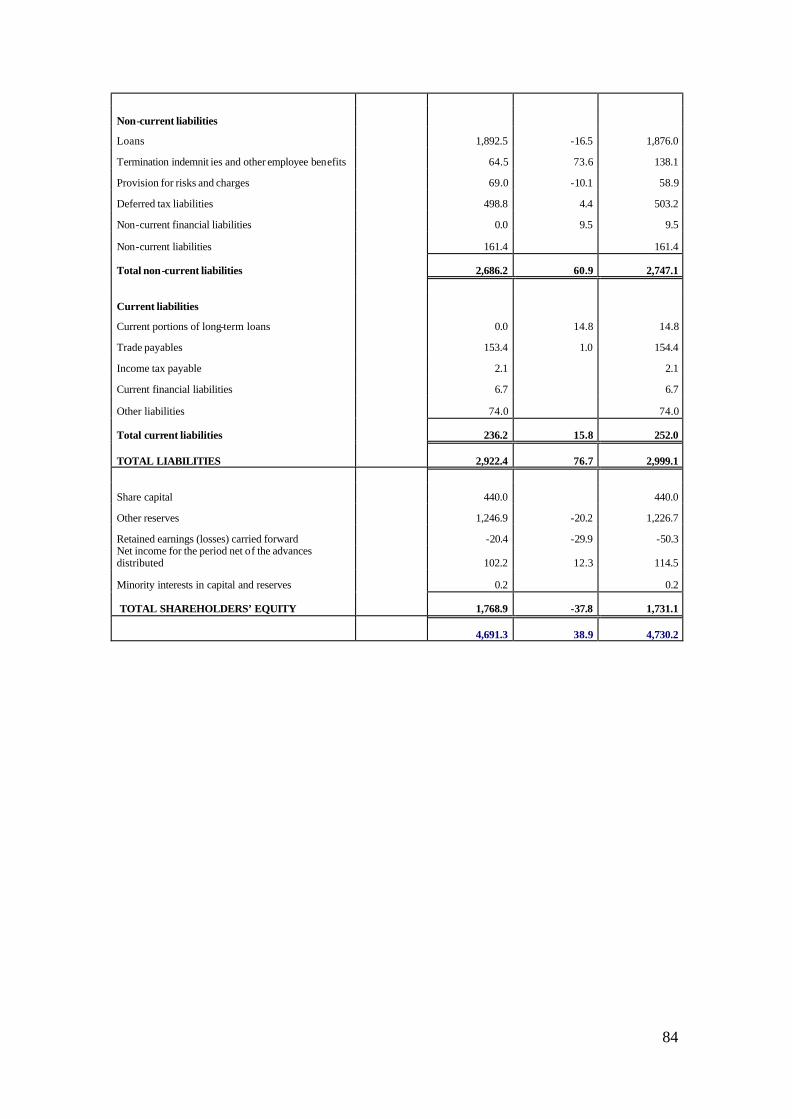
84
Non-current liabilities
Loans 1,892.5 -16.5 1,876.0
Termination indemnit ies and other employee benefits 64.5 73.6 138.1
Provision for risks and charges 69.0 -10.1 58.9
Deferred tax liabilities 498.8 4.4 503.2
Non-current financial liabilities 0.0 9.5 9.5
Non-current liabilities 161.4 161.4
Total non-current liabilities 2,686.2 60.9 2,747.1
Current liabilities
Current portions of long-term loans 0.0 14.8 14.8
Trade payables 153.4 1.0 154.4
Income tax payable 2.1 2.1
Current financial liabilities 6.7 6.7
Other liabilities 74.0 74.0
Total current liabilities 236.2 15.8 252.0
TOTAL LIABILITIES 2,922.4 76.7 2,999.1
Share capital 440.0 440.0
Other reserves 1,246.9 -20.2 1,226.7
Retained earnings (losses) carried forward -20.4 -29.9 -50.3 Net income for the period net of the advances distributed 102.2 12.3 114.5
Minority interests in capital and reserves 0.2 0.2
TOTAL SHAREHOLDERS’ EQUITY
1,768.9 -37.8 1,731.1
4,691.3 38.9 4,730.2
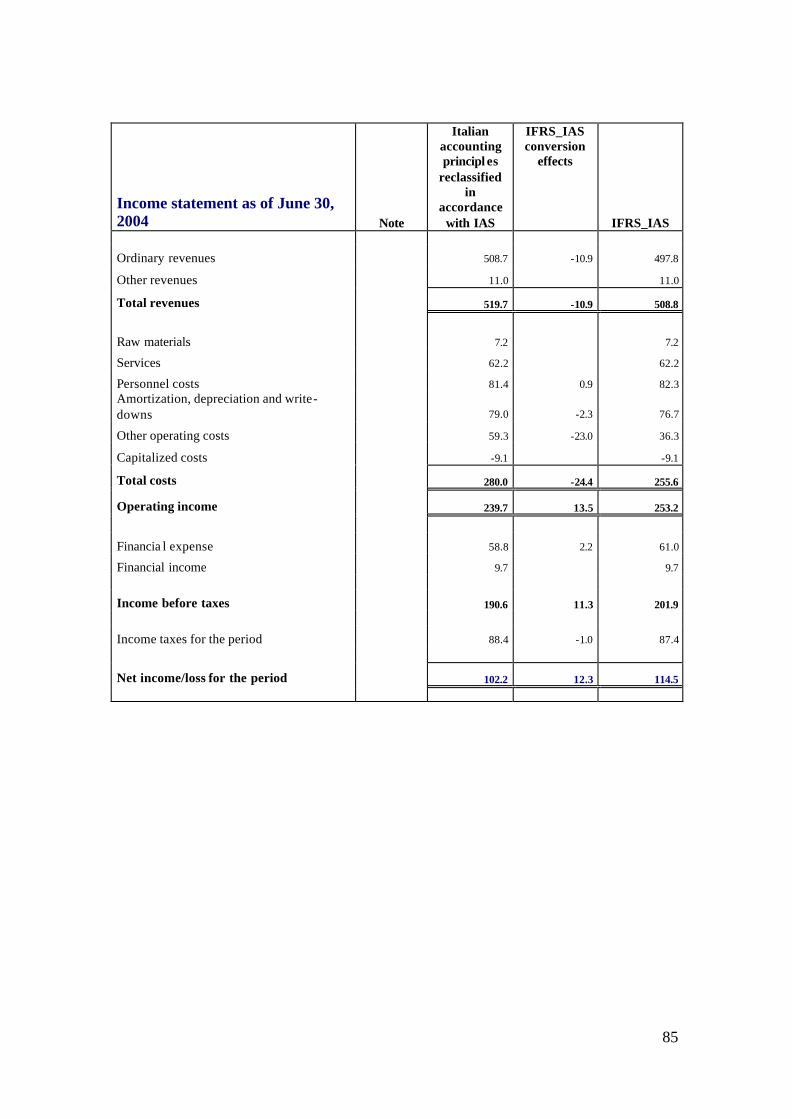
85
Income statement as of June 30, 2004 Note
Italian accounting principl es
reclassified in
accordance with IAS
IFRS_IAS conversion
effects
IFRS_IAS
Ordinary revenues 508.7 -10.9 497.8
Other revenues 11.0 11.0
Total revenues 519.7 -10.9 508.8
Raw materials 7.2 7.2
Services 62.2 62.2
Personnel costs 81.4 0.9 82.3 Amortization, depreciation and write-downs 79.0 -2.3 76.7
Other operating costs 59.3 -23.0 36.3
Capitalized costs -9.1 -9.1
Total costs 280.0 -24.4 255.6
Operating income 239.7 13.5 253.2
Financia l expense 58.8 2.2 61.0
Financial income 9.7 9.7
Income before taxes 190.6 11.3 201.9
Income taxes for the period 88.4 -1.0 87.4
Net income/loss for the period 102.2 12.3 114.5
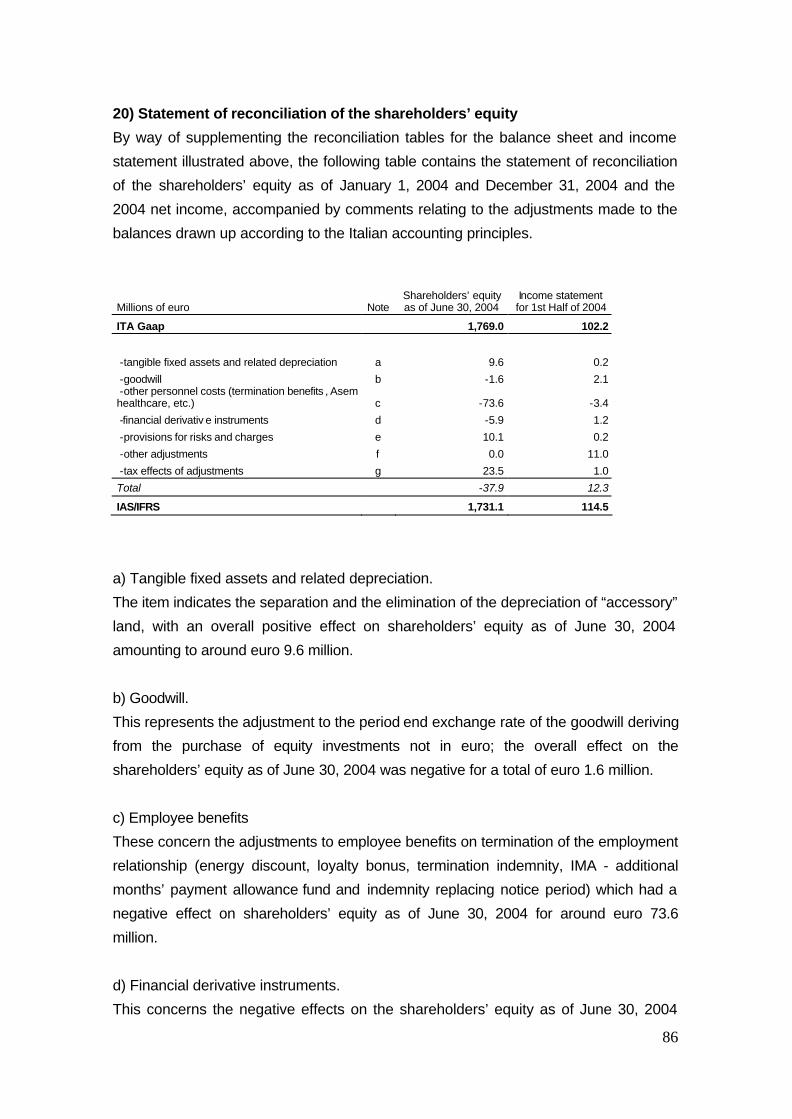
86
20) Statement of reconciliation of the shareholders’ equity
By way of supplementing the reconciliation tables for the balance sheet and income
statement illustrated above, the following table contains the statement of reconciliation
of the shareholders’ equity as of January 1, 2004 and December 31, 2004 and the
2004 net income, accompanied by comments relating to the adjustments made to the
balances drawn up according to the Italian accounting principles.
Millions of euro Note Shareholders’ equity as of June 30, 2004
Income statement for 1st Half of 2004
ITA Gaap 1,769.0 102.2
-tangible fixed assets and related depreciation a 9.6 0.2
-goodwill b -1.6 2.1 -other personnel costs (termination benefits , Asem healthcare, etc.) c -73.6 -3.4
-financial derivativ e instruments d -5.9 1.2
-provisions for risks and charges e 10.1 0.2
-other adjustments f 0.0 11.0
-tax effects of adjustments g 23.5 1.0
Total -37.9 12.3
IAS/IFRS 1,731.1 114.5
a) Tangible fixed assets and related depreciation.
The item indicates the separation and the elimination of the depreciation of “accessory”
land, with an overall positive effect on shareholders’ equity as of June 30, 2004
amounting to around euro 9.6 million.
b) Goodwill.
This represents the adjustment to the period end exchange rate of the goodwill deriving
from the purchase of equity investments not in euro; the overall effect on the
shareholders’ equity as of June 30, 2004 was negative for a total of euro 1.6 million.
c) Employee benefits
These concern the adjustments to employee benefits on termination of the employment
relationship (energy discount, loyalty bonus, termination indemnity, IMA - additional
months’ payment allowance fund and indemnity replacing notice period) which had a
negative effect on shareholders’ equity as of June 30, 2004 for around euro 73.6
million.
d) Financial derivative instruments.
This concerns the negative effects on the shareholders’ equity as of June 30, 2004
87
produced by the derivative instruments held in the portfolio, which amount to euro 5.9
million.
e) Provisions for risks and charges
The adjustment refers to the elimination of the provisions which are not recordable for
IAS/IFRS purposes with a sum total (positive effect) of approximately euro 10.1 million
on the shareholders’ equity as of June 30, 2004.
f) Other adjustments.
This concerns the reversal of the charges attributable to corrections of errors noted
during 2004, reclassified by direct deduction from shareholders’ equity in accordance
with the retrospective method.
g) Tax effect of the adjustments.
This originates from the tax effects of the adjustments to the income statement and
balance sheet items generating a positive effect on shareholders’ equity as of June 30,
2004 of euro 23.5 million.
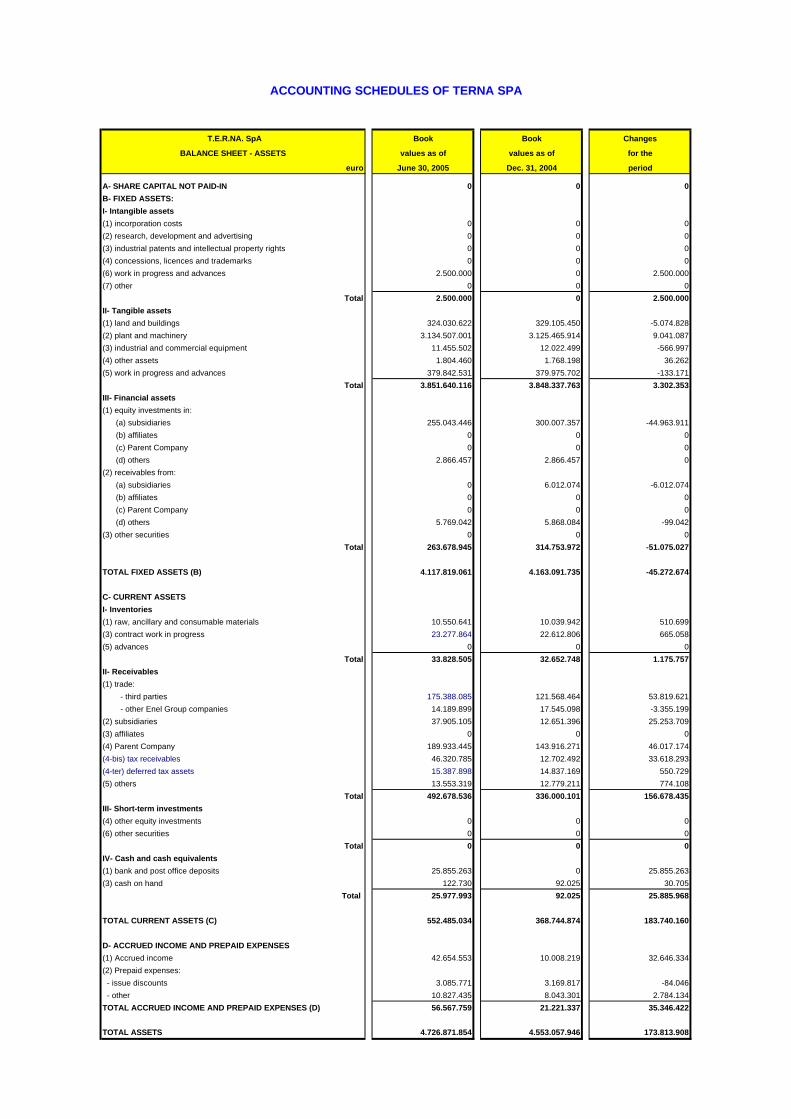
T.E.R.NA. SpA Book Book Changes
BALANCE SHEET - ASSETS values as of values as of for the
euro June 30, 2005 Dec. 31, 2004 period
A- SHARE CAPITAL NOT PAID-IN 0 0 0
B- FIXED ASSETS:
I- Intangible assets
(1) incorporation costs 0 0 0
(2) research, development and advertising 0 0 0
(3) industrial patents and intellectual property rights 0 0 0
(4) concessions, licences and trademarks 0 0 0
(6) work in progress and advances 2.500.000 0 2.500.000
(7) other 0 0 0
Total 2.500.000 0 2.500.000
II- Tangible assets
(1) land and buildings 324.030.622 329.105.450 -5.074.828
(2) plant and machinery 3.134.507.001 3.125.465.914 9.041.087
(3) industrial and commercial equipment 11.455.502 12.022.499 -566.997
(4) other assets 1.804.460 1.768.198 36.262
(5) work in progress and advances 379.842.531 379.975.702 -133.171
Total 3.851.640.116 3.848.337.763 3.302.353
III- Financial assets
(1) equity investments in:
(a) subsidiaries 255.043.446 300.007.357 -44.963.911
(b) affiliates 0 0 0
(c) Parent Company 0 0 0
(d) others 2.866.457 2.866.457 0
(2) receivables from:
(a) subsidiaries 0 6.012.074 -6.012.074
(b) affiliates 0 0 0
(c) Parent Company 0 0 0
(d) others 5.769.042 5.868.084 -99.042
(3) other securities 0 0 0
Total 263.678.945 314.753.972 -51.075.027
TOTAL FIXED ASSETS (B) 4.117.819.061 4.163.091.735 -45.272.674
C- CURRENT ASSETS
I- Inventories
(1) raw, ancillary and consumable materials 10.550.641 10.039.942 510.699
(3) contract work in progress 23.277.864 22.612.806 665.058
(5) advances 0 0 0
Total 33.828.505 32.652.748 1.175.757
II- Receivables
(1) trade:
- third parties 175.388.085 121.568.464 53.819.621
- other Enel Group companies 14.189.899 17.545.098 -3.355.199
(2) subsidiaries 37.905.105 12.651.396 25.253.709
(3) affiliates 0 0 0
(4) Parent Company 189.933.445 143.916.271 46.017.174
(4-bis) tax receivables 46.320.785 12.702.492 33.618.293
(4-ter) deferred tax assets 15.387.898 14.837.169 550.729
(5) others 13.553.319 12.779.211 774.108
Total 492.678.536 336.000.101 156.678.435
III- Short-term investments
(4) other equity investments 0 0 0
(6) other securities 0 0 0
Total 0 0 0
IV- Cash and cash equivalents
(1) bank and post office deposits 25.855.263 0 25.855.263
(3) cash on hand 122.730 92.025 30.705
Total 25.977.993 92.025 25.885.968
TOTAL CURRENT ASSETS (C) 552.485.034 368.744.874 183.740.160
D- ACCRUED INCOME AND PREPAID EXPENSES
(1) Accrued income 42.654.553 10.008.219 32.646.334
(2) Prepaid expenses:
- issue discounts 3.085.771 3.169.817 -84.046
- other 10.827.435 8.043.301 2.784.134
TOTAL ACCRUED INCOME AND PREPAID EXPENSES (D) 56.567.759 21.221.337 35.346.422
TOTAL ASSETS 4.726.871.854 4.553.057.946 173.813.908
ACCOUNTING SCHEDULES OF TERNA SPA
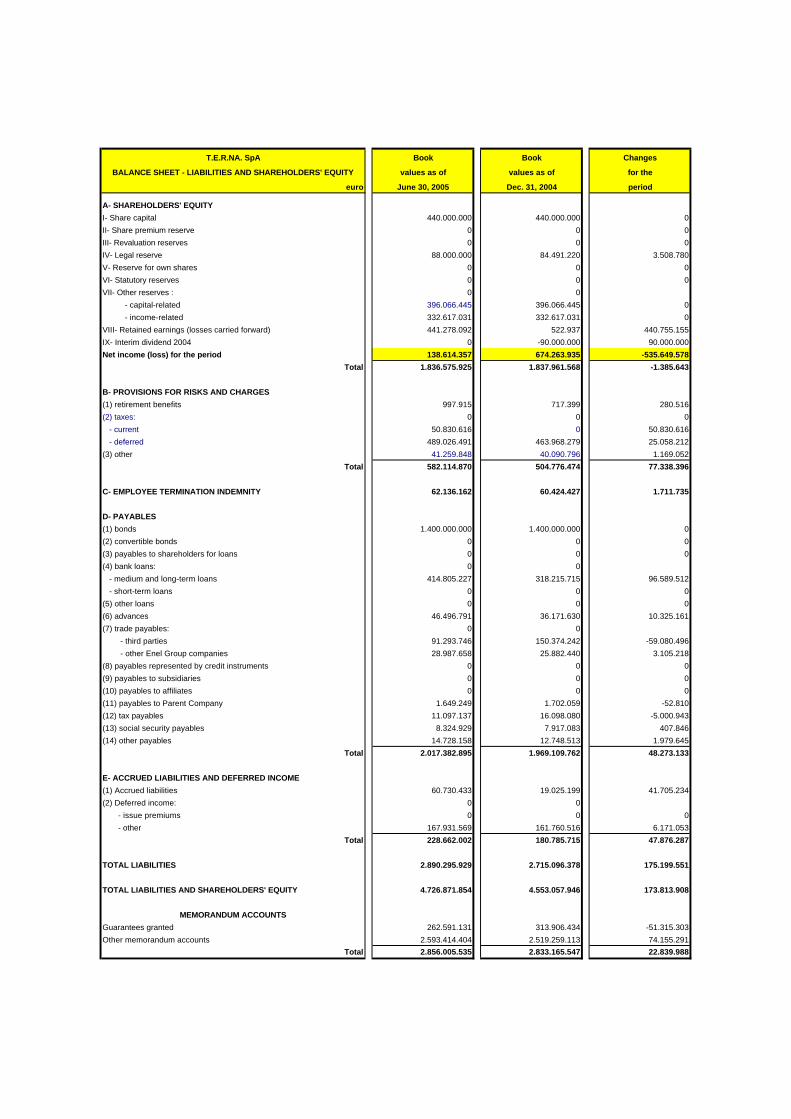
T.E.R.NA. SpA Book Book Changes
BALANCE SHEET - LIABILITIES AND SHAREHOLDERS' EQUITY values as of values as of for the
euro June 30, 2005 Dec. 31, 2004 period
A- SHAREHOLDERS' EQUITY
I- Share capital 440.000.000 440.000.000 0
II- Share premium reserve 0 0 0
III- Revaluation reserves 0 0 0
IV- Legal reserve 88.000.000 84.491.220 3.508.780
V- Reserve for own shares 0 0 0
VI- Statutory reserves 0 0 0
VII- Other reserves : 0 0
- capital-related 396.066.445 396.066.445 0
- income-related 332.617.031 332.617.031 0
VIII- Retained earnings (losses carried forward) 441.278.092 522.937 440.755.155
IX- Interim dividend 2004 0 -90.000.000 90.000.000
Net income (loss) for the period 138.614.357 674.263.935 -535.649.578
Total 1.836.575.925 1.837.961.568 -1.385.643
B- PROVISIONS FOR RISKS AND CHARGES
(1) retirement benefits 997.915 717.399 280.516
(2) taxes: 0 0 0
- current 50.830.616 0 50.830.616
- deferred 489.026.491 463.968.279 25.058.212
(3) other 41.259.848 40.090.796 1.169.052
Total 582.114.870 504.776.474 77.338.396
C- EMPLOYEE TERMINATION INDEMNITY 62.136.162 60.424.427 1.711.735
D- PAYABLES
(1) bonds 1.400.000.000 1.400.000.000 0
(2) convertible bonds 0 0 0
(3) payables to shareholders for loans 0 0 0
(4) bank loans: 0 0
- medium and long-term loans 414.805.227 318.215.715 96.589.512
- short-term loans 0 0 0
(5) other loans 0 0 0
(6) advances 46.496.791 36.171.630 10.325.161
(7) trade payables: 0 0
- third parties 91.293.746 150.374.242 -59.080.496
- other Enel Group companies 28.987.658 25.882.440 3.105.218
(8) payables represented by credit instruments 0 0 0
(9) payables to subsidiaries 0 0 0
(10) payables to affiliates 0 0 0
(11) payables to Parent Company 1.649.249 1.702.059 -52.810
(12) tax payables 11.097.137 16.098.080 -5.000.943
(13) social security payables 8.324.929 7.917.083 407.846
(14) other payables 14.728.158 12.748.513 1.979.645
Total 2.017.382.895 1.969.109.762 48.273.133
E- ACCRUED LIABILITIES AND DEFERRED INCOME
(1) Accrued liabilities 60.730.433 19.025.199 41.705.234
(2) Deferred income: 0 0
- issue premiums 0 0 0
- other 167.931.569 161.760.516 6.171.053
Total 228.662.002 180.785.715 47.876.287
TOTAL LIABILITIES 2.890.295.929 2.715.096.378 175.199.551
TOTAL LIABILITIES AND SHAREHOLDERS' EQUITY 4.726.871.854 4.553.057.946 173.813.908
MEMORANDUM ACCOUNTS
Guarantees granted 262.591.131 313.906.434 -51.315.303
Other memorandum accounts 2.593.414.404 2.519.259.113 74.155.291
Total 2.856.005.535 2.833.165.547 22.839.988
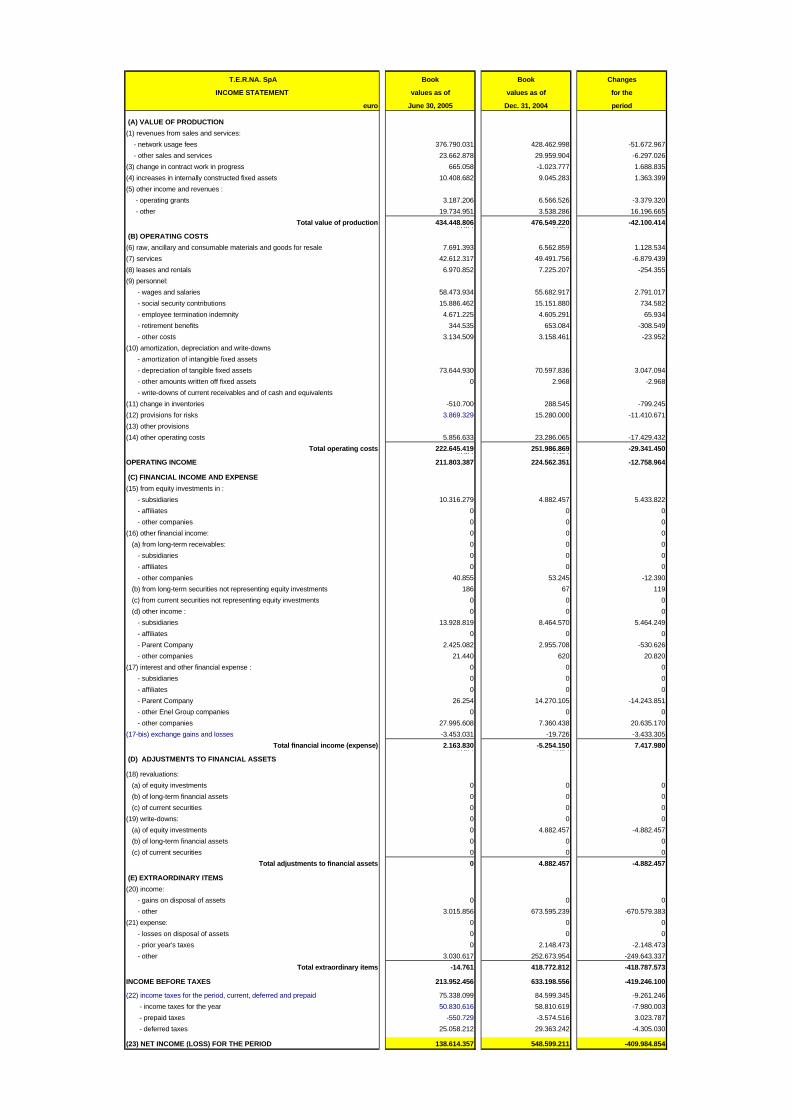
T.E.R.NA. SpA Book Book Changes
INCOME STATEMENT values as of values as of for the
euro June 30, 2005 Dec. 31, 2004 period
(A) VALUE OF PRODUCTION
(1) revenues from sales and services:
- network usage fees 376.790.031 428.462.998 -51.672.967
- other sales and services 23.662.878 29.959.904 -6.297.026
(3) change in contract work in progress 665.058 -1.023.777 1.688.835
(4) increases in internally constructed fixed assets 10.408.682 9.045.283 1.363.399
(5) other income and revenues :
- operating grants 3.187.206 6.566.526 -3.379.320
- other 19.734.951 3.538.286 16.196.665
Total value of production 434.448.806 476.549.220 -42.100.414#RIF! #RIF!
(B) OPERATING COSTS
(6) raw, ancillary and consumable materials and goods for resale 7.691.393 6.562.859 1.128.534
(7) services 42.612.317 49.491.756 -6.879.439
(8) leases and rentals 6.970.852 7.225.207 -254.355
(9) personnel:
- wages and salaries 58.473.934 55.682.917 2.791.017
- social security contributions 15.886.462 15.151.880 734.582
- employee termination indemnity 4.671.225 4.605.291 65.934
- retirement benefits 344.535 653.084 -308.549
- other costs 3.134.509 3.158.461 -23.952
(10) amortization, depreciation and write-downs
- amortization of intangible fixed assets
- depreciation of tangible fixed assets 73.644.930 70.597.836 3.047.094
- other amounts written off fixed assets 0 2.968 -2.968
- write-downs of current receivables and of cash and equivalents
(11) change in inventories -510.700 288.545 -799.245
(12) provisions for risks 3.869.329 15.280.000 -11.410.671
(13) other provisions
(14) other operating costs 5.856.633 23.286.065 -17.429.432
Total operating costs 222.645.419 251.986.869 -29.341.450#RIF! #RIF!
OPERATING INCOME 211.803.387 224.562.351 -12.758.964
(C) FINANCIAL INCOME AND EXPENSE
(15) from equity investments in :
- subsidiaries 10.316.279 4.882.457 5.433.822
- affiliates 0 0 0
- other companies 0 0 0
(16) other financial income: 0 0 0
(a) from long-term receivables: 0 0 0
- subsidiaries 0 0 0
- affiliates 0 0 0
- other companies 40.855 53.245 -12.390
(b) from long-term securities not representing equity investments 186 67 119
(c) from current securities not representing equity investments 0 0 0
(d) other income : 0 0 0
- subsidiaries 13.928.819 8.464.570 5.464.249
- affiliates 0 0 0
- Parent Company 2.425.082 2.955.708 -530.626
- other companies 21.440 620 20.820
(17) interest and other financial expense : 0 0 0
- subsidiaries 0 0 0
- affiliates 0 0 0
- Parent Company 26.254 14.270.105 -14.243.851
- other Enel Group companies 0 0 0
- other companies 27.995.608 7.360.438 20.635.170
(17-bis) exchange gains and losses -3.453.031 -19.726 -3.433.305
Total financial income (expense) 2.163.830 -5.254.150 7.417.980#RIF! #RIF!
(D) ADJUSTMENTS TO FINANCIAL ASSETS
(18) revaluations:
(a) of equity investments 0 0 0
(b) of long-term financial assets 0 0 0
(c) of current securities 0 0 0
(19) write-downs: 0 0 0
(a) of equity investments 0 4.882.457 -4.882.457
(b) of long-term financial assets 0 0 0
(c) of current securities 0 0 0
Total adjustments to financial assets 0 4.882.457 -4.882.457
(E) EXTRAORDINARY ITEMS
(20) income:
- gains on disposal of assets 0 0 0
- other 3.015.856 673.595.239 -670.579.383
(21) expense: 0 0 0
- losses on disposal of assets 0 0 0
- prior year's taxes 0 2.148.473 -2.148.473
- other 3.030.617 252.673.954 -249.643.337
Total extraordinary items -14.761 418.772.812 -418.787.573
INCOME BEFORE TAXES 213.952.456 633.198.556 -419.246.100
(22) income taxes for the period, current, deferred and prepaid 75.338.099 84.599.345 -9.261.246
- income taxes for the year 50.830.616 58.810.619 -7.980.003
- prepaid taxes -550.729 -3.574.516 3.023.787
- deferred taxes 25.058.212 29.363.242 -4.305.030
(23) NET INCOME (LOSS) FOR THE PERIOD 138.614.357 548.599.211 -409.984.854
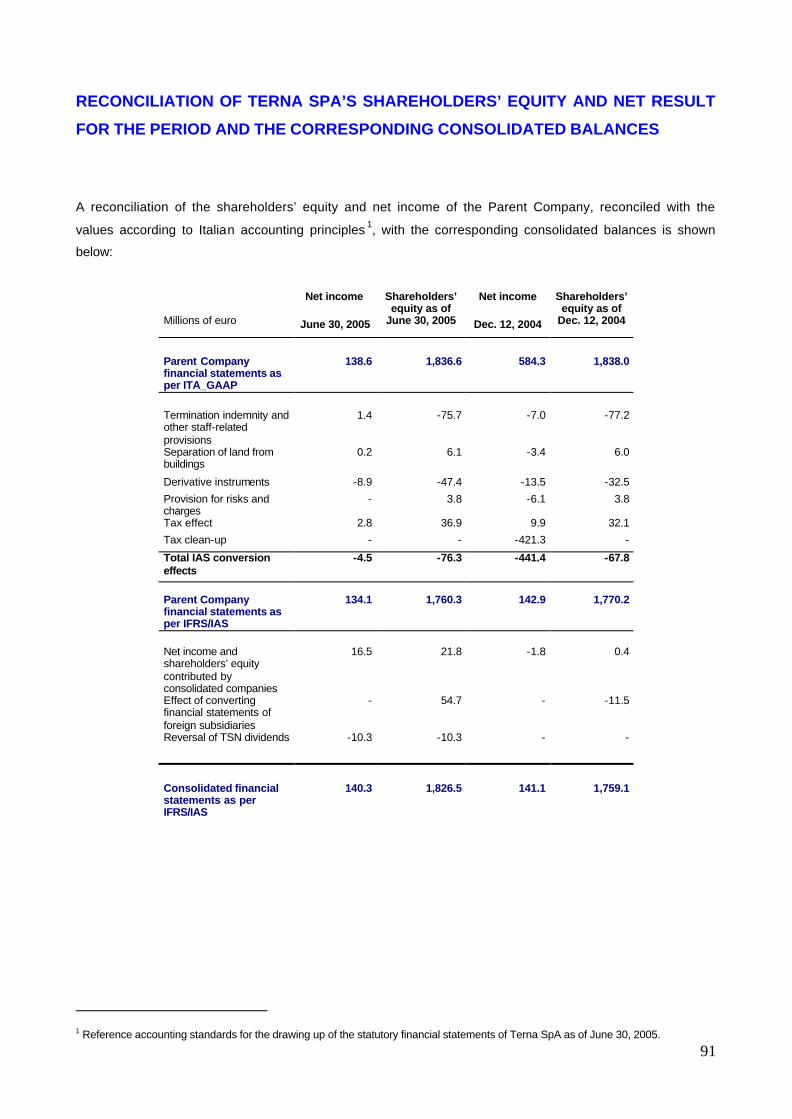
91
RECONCILIATION OF TERNA SPA’S SHAREHOLDERS’ EQUITY AND NET RESULT
FOR THE PERIOD AND THE CORRESPONDING CONSOLIDATED BALANCES
A reconciliation of the shareholders’ equity and net income of the Parent Company, reconciled with the
values according to Italian accounting principles 1, with the corresponding consolidated balances is shown
below:
Net income Net income
Millions of euro June 30, 2005
Shareholders’ equity as of
June 30, 2005 Dec. 12, 2004
Shareholders’ equity as of
Dec. 12, 2004
Parent Company financial statements as per ITA_GAAP
138.6 1,836.6 584.3 1,838.0
Termination indemnity and other staff-related provisions
1.4 -75.7 -7.0 -77.2
Separation of land from buildings
0.2 6.1 -3.4 6.0
Derivative instruments -8.9 -47.4 -13.5 -32.5
Provision for risks and charges
- 3.8 -6.1 3.8
Tax effect 2.8 36.9 9.9 32.1
Tax clean-up - - -421.3 -
Total IAS conversion effects
-4.5 -76.3 -441.4 -67.8
Parent Company financial statements as per IFRS/IAS
134.1 1,760.3 142.9 1,770.2
Net income and shareholders’ equity contributed by consolidated companies
16.5 21.8 -1.8 0.4
Effect of converting financial statements of foreign subsidiaries
- 54.7 - -11.5
Reversal of TSN dividends -10.3 -10.3 - -
Consolidated financial statements as per IFRS/IAS
140.3 1,826.5 141.1 1,759.1
1 Reference accounting standards for the drawing up of the statutory financial statements of Terna SpA as of June 30, 2005.
92
GLOSSARY
Cash-generating unit
A unit which generates financial flows: smallest group identifiable of activities which generate incoming
financial flows widely independent of the incoming financial flows generated by other activities or groups
of activities.
Deemed cost
Replaced cost value: amount used as the replaced cost value or amortized cost as of a set date. The
subsequent amortization must be calculated on the basis of the assumption that the entity had initially
stated the asset or the liability as of said set date and that the cost coincided, again as of that date, with
the replaced cost value.
Fair value
Fair value: amount at which an asset can be traded, or a liability discharged, in an unrestricted
transaction between informed and willing parties.
Impairment loss
Permanent loss in value: amounts by which the book value of an asset exceeds the value which can be
recovered.
Value in use
Usage value: current value of the estimated future financial flows which are expected to derive from the
on-going use of an asset and from the disposal at the end of its useful life.
Transition to the international accounting standards (IFRS)
2
Introduction
The TERNA Group has adopted the international accounting standards, International
Financial Reporting Standard, as from 2005, while the date of transition to the IFRS
was January 1, 2004. The last sets of financial statements (of the Parent Company and
consolidated) drawn up in accordance with the Italian accounting principles are those
relating to the accounting period ended December 31, 2004.
As required by IFRS 1 and by Article 81 of the Issuers’ Regulations No. 11971/1999
adopted by the Consob by means of Resolution No. 14990 dated April 14, 2005, this
attachment contains the tables illustrating the reconciliation between the values stated
previously in accordance with the Italian accounting principles and those reclassified in
accordance with the IFRS, accompanied by the related notes commenting on the
adjustments.
These tables have been drawn up exclusively for the purposes of the transition project
for the preparation of the first set of complete consolidated financial statements
pursuant to the IFRS ratified by the European Commission and are lacking the
comparative balances and the necessary explanatory notes which would be required
for a complete representation of the equity-financial situation and the consolidated
economic result of the Terna Group in compliance with the IFRS standards. It should also be noted that they have been prepared in accordance with the
International Financial Reporting Standards (IFRS) in force as of the date of
preparation of the same, including the IFRS recently adopted by the lnternational
Accounting Standards Board (IASB), the International Accounting Standards (IAS) and
the interpretations of the lnternational Financial Reporting Interpretations Committee
(IFRIC) and the Standing Interpretations Committee (SIC). These standards are those
which it is assumed will be in force as of December 31, 2005. However, these
standards may not coincide with those in force as of December 31, 2005 as a result of
both the new guidelines of the European Commission concerning their ratification and
the issue of new standards or interpretations by the competent bodies and, therefore,
the balances presented could undergo changes for the purposes of use as comparative
figures for the first complete consolidated financial statements drawn up in compliance
with the IFRS.
The most significant accounting standards and policies used for the preparation of the
reconciliation tables are illustrated below.
3
Consolidation method and procedures
The scope of consolidation includes the Parent Company Terna SpA and the
companies over which the latter directly exercises control by means of all the voting
rights.
The financial statements of the subsidiary companies are consolidated as from the date
on which control was acquired and until the date that said control ceases.
All the infragroup balances and the transactions, including any unrealized gains
deriving from transactions which have taken place between Group companies, are
eliminated net of the theoretical tax effect, if significant. Unrealized losses are
eliminated except in the case when they represent reductions in value.
Accounting standards and policies
Translation of foreign currency balances
The financial statements of each consolidated company are drawn up using the
reporting currency relating to the economic context in which each company operates.
In such financial statements, all the transactions in currency other than the functional
currency are recorded using the exchange rate in force as of the date of the
transaction. Monetary assets and liabilities denominated in currency other than the
functional currency are subsequently adjusted to the exchange rate in force as of the
period end date presented.
Non-monetary assets and liabilities denominated in foreign currency and recorded at
historical cost are converted using the exchange rate in force as of the date of initial
recognition of the transaction. Non-monetary assets and liabilities denominated in
foreign currency and recorded at fair value are converted using the exchange rate in
force as of the date of determination of this value.
Translation of foreign currency financial statements
For the purposes of the consolidated financial statements, the profi/loss, assets and
liabilities are expressed in euro which represents the functional currency of the Parent
Company Terna SpA.
For the purposes of the preparation of the consolidated financial statements, the
financial statements of the subsidiaries in a functional currency other than the euro are
converted into euro by applying the exchange rate in force as of the period end date to
the assets and liabilities – inclusive of goodwill and the adjustments made at the time of
consolidation - and the average exchange rates for the period to the income statement
items; the latter rates approximate the exchange rates in force as of the date of the
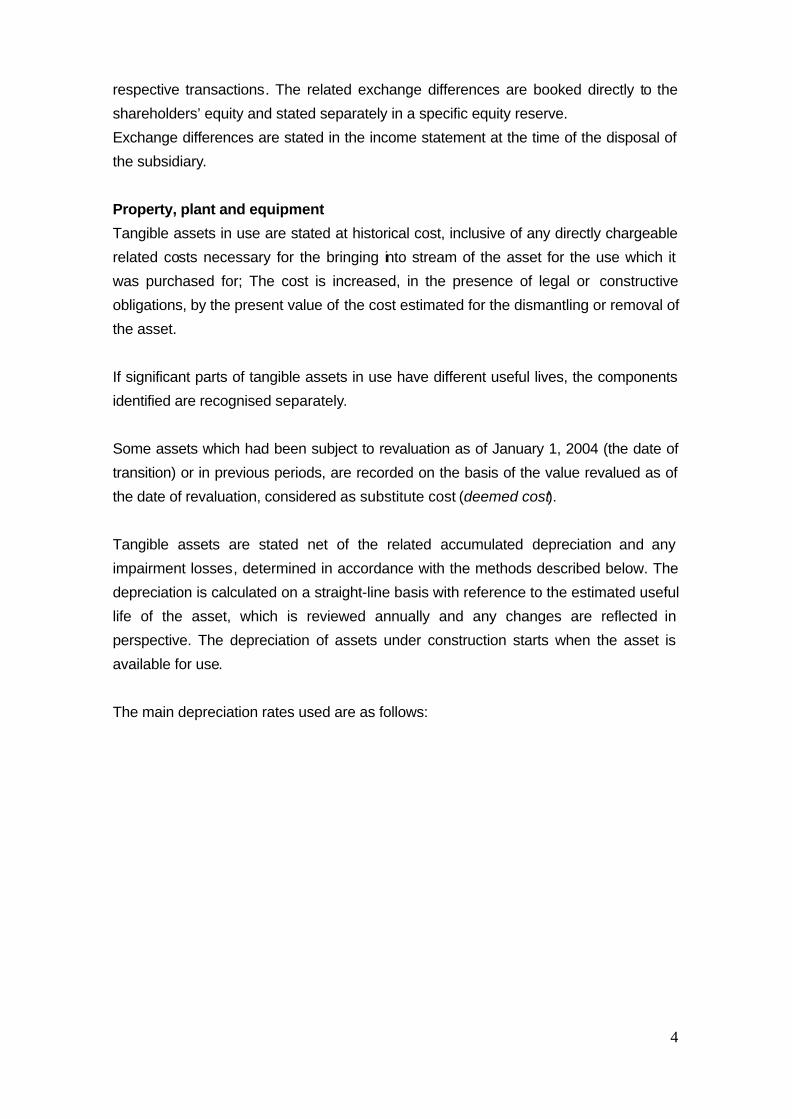
4
respective transactions. The related exchange differences are booked directly to the
shareholders’ equity and stated separately in a specific equity reserve.
Exchange differences are stated in the income statement at the time of the disposal of
the subsidiary.
Property, plant and equipment
Tangible assets in use are stated at historical cost, inclusive of any directly chargeable
related costs necessary for the bringing into stream of the asset for the use which it
was purchased for; The cost is increased, in the presence of legal or constructive
obligations, by the present value of the cost estimated for the dismantling or removal of
the asset.
If significant parts of tangible assets in use have different useful lives, the components
identified are recognised separately.
Some assets which had been subject to revaluation as of January 1, 2004 (the date of
transition) or in previous periods, are recorded on the basis of the value revalued as of
the date of revaluation, considered as substitute cost (deemed cost).
Tangible assets are stated net of the related accumulated depreciation and any
impairment losses, determined in accordance with the methods described below. The
depreciation is calculated on a straight-line basis with reference to the estimated useful
life of the asset, which is reviewed annually and any changes are reflected in
perspective. The depreciation of assets under construction starts when the asset is
available for use.
The main depreciation rates used are as follows:
5
Depreciation rates
Industrial and non-industrial buildings 2.50% - 4.00% Power lines 2.50% - 4.50% Switching sub-stations: - Electrical equipment 2.00% - 3.00%
- Other electrical equipment 2.80 – 4.50% - Automation and control systems 5.00 – 6.70% Central systems for remote management and control: - Electrical equipment and ancillary plant 5.00% - Computers 10.00%
Land, both free from construction or attached to industrial and civil buildings, is not
depreciated since it has an unlimited useful life.
Construction in progress is stated at historical cost, inclusive of any related charges,
net of any impairment losses.
Tangible assets acquired under financial leases – whereby all risks and benefits linked
to the ownership are essentially transferred to the Group – are recognized as Group
assets at their present value or, if lower, at the present value of the minimum payments
due for the leasing. The corresponding liability due to the lessor is classified among the
financial payables. The assets are depreciated by applying the approaches and the
rates indicated above.
Leases where the lessor essentially maintains all the risks and benefits associated with
the ownership of the assets, are classified as operating leases. The costs referring to
operative leases are recorded on a linear basis in the income statement over the
duration of the lease agreement.
Goodwill
All the acquisitions are recorded on the basis of the purchase method.
Goodwill, deriving from the acquisition of subsidiary companies, represents the excess
of the purchase cost with respect to the fair value of the assets acquired net of the
current and potential liabilities recorded and is allocated to each of the cash generating
units identified. After the initial registration, the goodwill is not amortized and is reduced
as a result of any impairment losses, determined in accordance with the methods
described below.
Goodwill deriving from acquisitions carried out prior to January 1, 2004 is stated at the
value recorded for this purpose in the last set of consolidated financial statements
drawn up on the basis of the previous accounting principles (31 December 2003).
6
Impairment losses
At each balance sheet, tangible and intangible assets with a determinate life are tested
for impairment. The recoverable value of the goodwill is by contrast estimated as of
each balance sheet date.
If an indication of value reductions exists, steps are taken to estimate the estimated
realizable value.
The estimated realizable value is represented either by the net sales price or the value
in use, which ever is higher.
When determining the value in use, the expected future financial flows are discounted
back using a pre-taxation discount rate which reflects the current market valuation of
the cost of money stated in relation to the period of the investment and to the specific
risks of the asset. For an asset which does not generate abundantly sufficient financial
flows, the realizable value is determined in relation of the cash generating unit which
this asset belongs to.
An impairment loss is recognized in the income statement if the book value of the
assets, or of the related cash generating unit to which it is allocated, is higher than the
estimated realizable value.
With the exception of goodwill, impairment losses are reversed if the reasons which
generated them cease to exist.
Inventories
Inventories are valued at cost or net estimated realizable value, whichever is the lower.
The cost configuration adopted is weighted average cost which includes any related
charges applicable.
7
Financial instruments
Equity investments in other companies
Equity investments in other companies, classified as “available for sale”, are valued at
fair value and any gains or losses are charged directly against the shareholders’ equity.
At the time of their disposal, such cumulative gains and losses are released to the
income statement.
When the fair value cannot be reliably calculated, equity investments in other
companies are valued at cost adjusted by impairment losses with any gain or losses
recognised in the income statement.
These write-downs cannot be reinstated.
Financial assets
Financial assets which the Company intends or is able to hold until maturity, are
recorded at the amortized cost, using the interest rate method, net of any impairment
losses.
Trade receivables
Trade receivables, whose maturity falls within normal commercial timescales, are not
discounted back and are recorded at cost (identified by their nominal amount) net of
any impairment losses. The value reductions are determined on the basis of the
present value of the expected future cash flows.
Cash and cash equivalents
Cash and cash equivalents include the cash values, or rather those values which
feature requisites of on-demand or extremely short-term availability, favourable
outcome and the absence of costs for their collection.
For the purposes of the consolidated statement of cash flows, cash and cash
equivalents are stated net of bank overdrafts as of the period end date.
Trade payables
Trade payables, whose maturity falls within normal commercial timescales, are not
discounted back and are recorded at cost (identified by their nominal amount).
Financial liabilities
Financial liabilities, with the exception of derivatives, are initially stated at fair value net
of any directly attributable transaction costs .
Subsequently, financial liabilities are valued on an amortized cost basis, using the
8
original effective interest rate method.
Derivative financial instruments
The Group holds derivative instruments for the purpose of hedging its exposure to
interest rate fluctuation risks. On a consistent basis with the chosen strategy, the Group
has not set up any transactions on derivatives for speculative purposes. However, in
the event that these transactions cannot be qualified in the accounts as hedging
transactions, they are recorded as speculative transactions.
The derivatives are classified as hedging instruments when the relationship between
the derivative and the object of the hedge is formally documented and the effectiveness
of the hedge, assessed periodically, is high. When the hedging derivatives cover the
risk of a fluctuation in the fair value of the instruments subject to coverage (fair value
hedge; e.g. coverage of the variability of the fair value of assets/liabilities at a fixed
rate), they are stated at fair value and the effects are booked to the income statement;
on a consistent basis, the instruments subject to hedging are adjusted in order to
reflect the changes in the fair value associated with the risk hedged. When the
derivatives cover the risk of fluctuation in the cash flows of the instruments subject to
coverage (cash flow hedge; e.g. coverage of the variability of the cash flows of
assets/liabilities at variable rates as a result of the fluctuations in interest rates), the
fluctuations in the fair value are initially booked to shareholders’ equity and
subsequently charged to the income statement on a consistent basis with the economic
effects produced by the transactions hedged.
The fluctuations in the fair value of the derivatives which do not satisfy the conditions
for being qualified as hedges are stated in the income statement.
Employee benefits
The liability relating to the benefits acknowledged employees and paid out at the time
of or subsequent to the termination of the employment relationship as well as relating
to specific benefit programmes (termination indemnities, Ima1, Isp2, Energy Discount,
Asem health care and other benefits) or other long-term benefits (Loyalty Bonus), is
stated net of assets serving the plan and is determined, separately for each plan, on
the basis of actuarial assumptions estimating the amount of the future benefits which
the employees have accrued as of the reference date. The liability is recorded on an
accruals basis over the vesting period of the related rights. The valuation of the liability
is made by independent actuaries.
1 Additional months’ payment allowance.
2 Indemnity replacing notice period.
9
Gains and losses deriving from the amendment of the actuarial assumptions are stated
in the income statement as a cost or revenue when their net cumulative value exceeds
by more than 10% the higher value between the total of the liabilities referring to each
specific benefit plan and the fair value of the assets serving the plan as of the balance
sheet date (so-called “corridor approach”).
Provisions for risks and charges
The provisions made for risks and charges are recorded when, as of the balance sheet
date, a legal or implicit obligation exists, which derives from a past event, and an outlay
of resources is probable in order to satisfy the obligation and the sum total of this outlay
can be estimated. If the effect is significant, the provisions are determined by
discounting back the expected future financial flows to a pre-tax discount rate which
reflects the current market valuation of the cost of money in relation to the timescale
and, if applicable, the specific risk applicable to the obligation. When the amount is
discounted back, the increase in the provision due to the passing of time is recorded as
financial expense. If the liability refers to tangible assets (e.g. dismantling and recovery
of sites), the provision is recorded as a matching balance to the asset to which it refers;
the recording of the expense in the income statement takes place by means of the
depreciation process of the tangible fixed assets to which the expense refers.
Grants
Grants, both from government and from private third parties, are stated at fair value
when there is reasonable certainty that they will be received and the conditions
anticipated for the attainment of the same will be satisfied.
Grants received for specific expenditure are recorded among other liabilities and
credited to the income statement on a systematic basis over the same period during
which the related costs accrue.
Grants received for specific assets whose value is recorded among fixed assets , are
either directly charged against the value of said fixed assets or stated among other
liabilities and credited to the income statement in relation to the depreciation period
pertaining to the assets to which they refer.
Operating grants are recorded in full in the income statement at the time the conditions
which allow their booking are satisfied.
Revenues
Revenues are stated on the basis of the specific criteria illustrated below, in
accordance with the type of transaction involved:
§ revenues from the sale of goods are recorded when the significant risks and
benefits pertaining to the ownership of the same are tranferred to the purchaser;
10
§ revenues for the performance of services are stated with reference to the stage of
completion of the activities. In the event that it is impossible to reliably determine
the value of the revenues, the latter are recorded up to the extent of the costs
incurred which we believe will be recovered.
Specifically, revenues deriving from fees for the remuneration of the National
Transmission Grid, are stated in accordance with the formalities established in the
operating agreement with the ISO and valorized on the basis of the tariffs established
by the Italian Regulatory Authority for Electricity and Gas.
Financial income and expense
Financial income and expense is stated on an accruals basis with reference to the
interest accrued on the net carrying amount of the related financial assets and
liabilities, using the effective interest rate method.
Dividends
These revenues are stated when the right of the shareholders to receive the dividends
is established.
Income taxes
Current taxes are determined on the basis of the estimate of the taxable profit (tax loss)
and in pursuance of the tax legislation in force.
Deferred tax liabilities and assets are calculated on timing differences between the
balance sheet values recorded in the consolidated balance sheet and the
corresponding values recognized for tax purposes, applying the tax rate in force or
essentially in force as of the accounting reference date.
The recording of prepaid tax assets is made when the recovery is probable, in other
words when it is foreseen that taxable amounts sufficient for recovering the assets may
become available in the future.
The recoverability of deferred tax assets is re-examined at each period end.
IFRS 1 adoption
In relation to the adoption of the international accounting standards, the Group has
applied the procedures laid down by the IFRS 1 – Initial adoption of the International
Financial Reporting Standards, availing itself of a number of exceptions.
The exceptions anticipated by lFRS 1 applicable to the Group are illustrated below,
with indication of those used for the drawing up of the opening balance sheet:
- company mergers: the Group has not applied IFRS 3 retrospectively to the
company merger transactions which took place before the date of transition to
11
the IFRS;
- valuation of property, plant and equipment at fair value or, alternatively, at
revalued cost as the replacement value of the cost: for some categories of
assets, the Group has applied the revalued cost as substitute cost (deemed
cost);
- employee benefits: the Group has decided to record all the cumulative actuarial
gains and losses existing as of January 1, 2004, despite having chosen to use
the corridor method for the subsequent actuarial gains and losses;
- reserve for net exchange differences deriving from the translation of the
financial statements of consolidated companies operating in countries not
included within the euro area: as permitted by IFRS 1, the Group has not
availed of the exception and has maintained the cumulative net exchange
differences deriving from previous translations of foreign company financial
statements as determined previously;
- classification and valuation of the financial instruments: the Group has not
availed of the faculty to defer the transition date of IAS 32 and 39 to January 1,
2005, taking into account the related effects in the preparation of the opening
balance sheet as of January 1, 2004;
- designation of the financial instruments at fair value via the income statement or
as available for sale: the Group has chosen to make this designation as of the
transition date (January 1, 2004) rather than as of the date of initial registration
as anticipated by IAS 39.
12
IAS/IFRS Consolidated Balance Sheet as of January 1, 2004 and December 31, 2004 IAS/IFRS Consolidated Income Statement for the accounting period ended as of December 31, 2004
The balance sheet as of January 1, 2004 and December 31, 2004 and the income
statement for the 2004 accounting period are illustrated below and indicate:
- the balances according to the Italian accounting principles reclassified according to
the IAS/IFRS formats;
- the adjustments for adaptation to the IAS/IFRS standards.
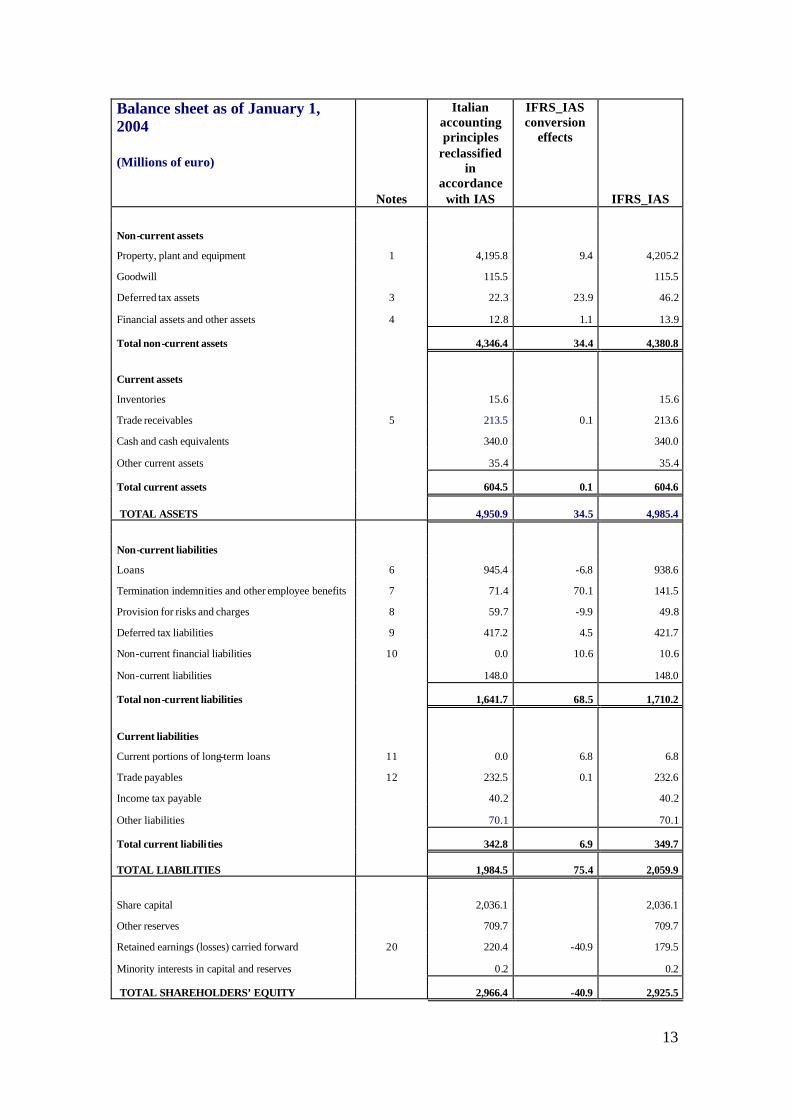
13
Balance sheet as of January 1, 2004 (Millions of euro)
Notes
Italian accounting principles
reclassified in
accordance with IAS
IFRS_IAS conversion
effects
IFRS_IAS
Non-current assets
Property, plant and equipment 1 4,195.8 9.4 4,205.2
Goodwill 115.5 115.5
Deferred tax assets 3 22.3 23.9 46.2
Financial assets and other assets 4 12.8 1.1 13.9
Total non-current assets 4,346.4 34.4 4,380.8
Current assets
Inventories 15.6 15.6
Trade receivables 5 213.5 0.1 213.6
Cash and cash equivalents 340.0 340.0
Other current assets 35.4 35.4
Total current assets 604.5 0.1 604.6
TOTAL ASSETS 4,950.9 34.5 4,985.4
Non-current liabilities
Loans 6 945.4 -6.8 938.6
Termination indemnities and other employee benefits 7 71.4 70.1 141.5
Provision for risks and charges 8 59.7 -9.9 49.8
Deferred tax liabilities 9 417.2 4.5 421.7
Non-current financial liabilities 10 0.0 10.6 10.6
Non-current liabilities 148.0 148.0
Total non-current liabilities 1,641.7 68.5 1,710.2
Current liabilities
Current portions of long-term loans 11 0.0 6.8 6.8
Trade payables 12 232.5 0.1 232.6
Income tax payable 40.2 40.2
Other liabilities 70.1 70.1
Total current liabilities 342.8 6.9 349.7
TOTAL LIABILITIES 1,984.5 75.4 2,059.9
Share capital 2,036.1 2,036.1
Other reserves 709.7 709.7
Retained earnings (losses) carried forward 20 220.4 -40.9 179.5
Minority interests in capital and reserves 0.2 0.2
TOTAL SHAREHOLDERS’ EQUITY
2,966.4 -40.9 2,925.5
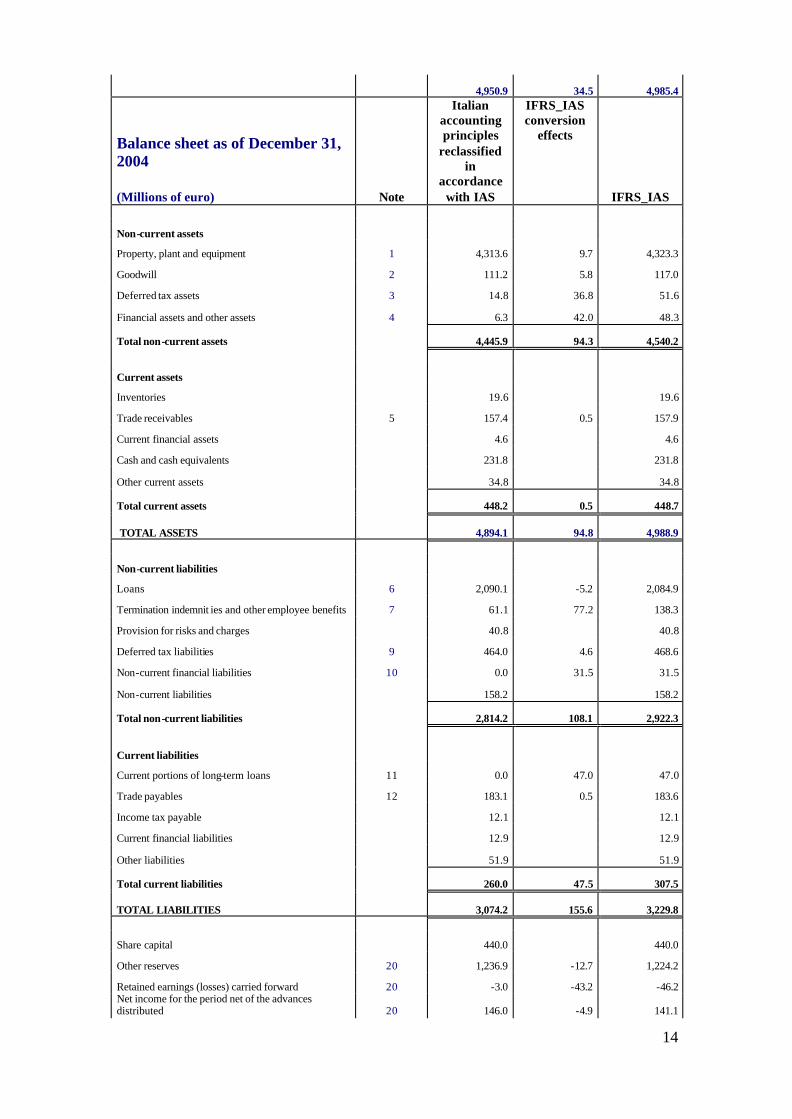
14
4,950.9 34.5 4,985.4
Balance sheet as of December 31, 2004 (Millions of euro) Note
Italian accounting principles
reclassified in
accordance with IAS
IFRS_IAS conversion
effects
IFRS_IAS
Non-current assets
Property, plant and equipment 1 4,313.6 9.7 4,323.3
Goodwill 2 111.2 5.8 117.0
Deferred tax assets 3 14.8 36.8 51.6
Financial assets and other assets 4 6.3 42.0 48.3
Total non-current assets 4,445.9 94.3 4,540.2
Current assets
Inventories 19.6 19.6
Trade receivables 5 157.4 0.5 157.9
Current financial assets 4.6 4.6
Cash and cash equivalents 231.8 231.8
Other current assets 34.8 34.8
Total current assets 448.2 0.5 448.7
TOTAL ASSETS 4,894.1 94.8 4,988.9
Non-current liabilities
Loans 6 2,090.1 -5.2 2,084.9
Termination indemnit ies and other employee benefits 7 61.1 77.2 138.3
Provision for risks and charges 40.8 40.8
Deferred tax liabilities 9 464.0 4.6 468.6
Non-current financial liabilities 10 0.0 31.5 31.5
Non-current liabilities 158.2 158.2
Total non-current liabilities 2,814.2 108.1 2,922.3
Current liabilities
Current portions of long-term loans 11 0.0 47.0 47.0
Trade payables 12 183.1 0.5 183.6
Income tax payable 12.1 12.1
Current financial liabilities 12.9 12.9
Other liabilities 51.9 51.9
Total current liabilities 260.0 47.5 307.5
TOTAL LIABILITIES 3,074.2 155.6 3,229.8
Share capital 440.0 440.0
Other reserves 20 1,236.9 -12.7 1,224.2
Retained earnings (losses) carried forward 20 -3.0 -43.2 -46.2 Net income for the period net of the advances distributed 20 146.0 -4.9 141.1
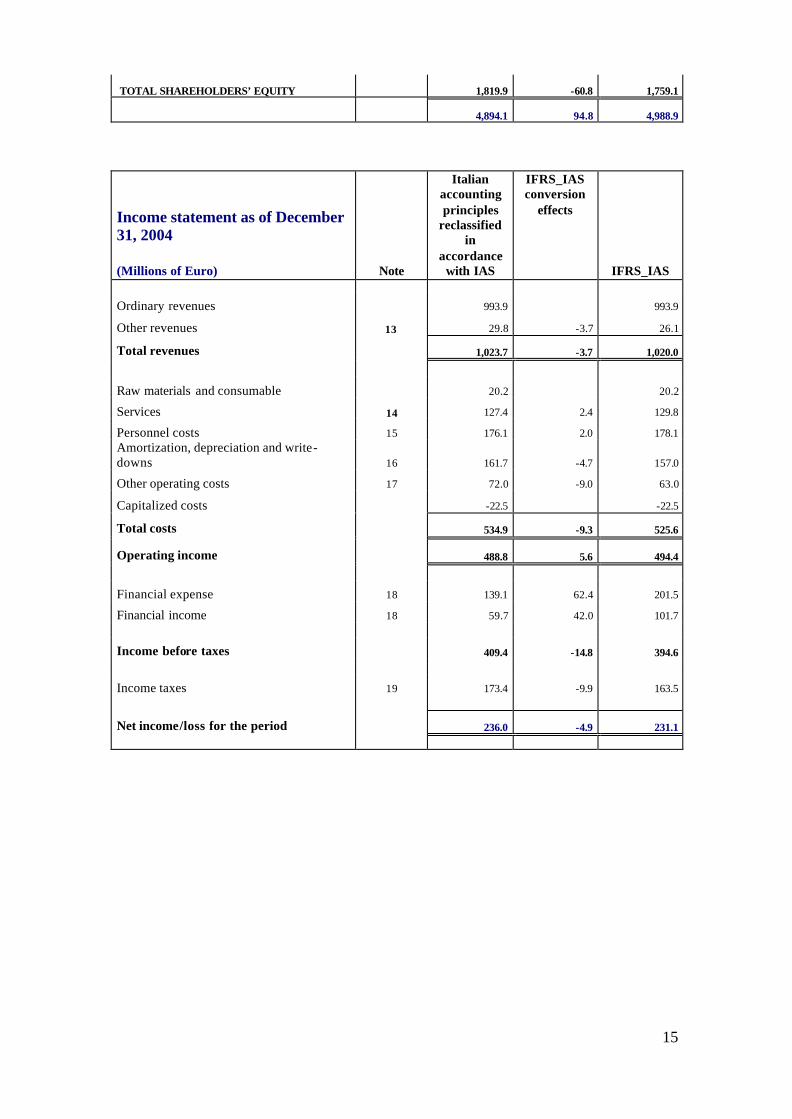
15
TOTAL SHAREHOLDERS’ EQUITY
1,819.9 -60.8 1,759.1
4,894.1 94.8 4,988.9
Income statement as of December 31, 2004 (Millions of Euro) Note
Italian accounting principles
reclassified in
accordance with IAS
IFRS_IAS conversion
effects
IFRS_IAS
Ordinary revenues 993.9 993.9
Other revenues 13 29.8 -3.7 26.1
Total revenues 1,023.7 -3.7 1,020.0
Raw materials and consumable 20.2 20.2
Services 14 127.4 2.4 129.8
Personnel costs 15 176.1 2.0 178.1 Amortization, depreciation and write-downs 16 161.7 -4.7 157.0
Other operating costs 17 72.0 -9.0 63.0
Capitalized costs -22.5 -22.5
Total costs 534.9 -9.3 525.6
Operating income 488.8 5.6 494.4
Financial expense 18 139.1 62.4 201.5
Financial income 18 59.7 42.0 101.7
Income before taxes 409.4 -14.8 394.6
Income taxes 19 173.4 -9.9 163.5
Net income/loss for the period 236.0 -4.9 231.1
16
Comments on the main IAS/IFRS adjustments made to the balance sheet items
as of January 1, 2004 and December 31, 2004.
Brief notes have been presented on the main adjustments made to the individual items
of the balance sheets at the beginning and end of 2004.
Balance sheet items - Assets
1) Property, plant and equipment.
(euro 9.4 million as of January 1, 2004 and euro 9.7 million as of December 31, 2004);
these adjustments refer to the reinstatement of the book value of land attached to
electricity stations at their historical cost by means of the reversal of the related
accumulated depreciation recorded in the financial statements. With regards to the
2004 accounting period, the adjustment is attributable to the reversal of the portion of
depreciation for the period on land.
This approach is based on the assumption that the land has an unlimited useful life
and, as a consequence, is not subject to depreciation.
2) Goodwill
(euro 0.0 million as of January 1, 2004 and euro 5.8 million as of December 31, 2004);
this balance reflects the combined effect of the reversal of the portions of depreciation
for the period on goodwill generated at the time of the consolidation of the foreign
equity investments (consolidation difference equating to euro 4.3 million), since, for
IFRS purposes, it is no longer subject to systematic amortization but rather periodic
valuation (impairment test) and the incremental change registered for the adjustment to
the exchange rate as of December 31, 2004 of the same for a total of euro 1.5 million.
3) Deferred tax assets.
(euro 23.9 million as of January 1, 2004 and euro 36.8 million as of December 31,
2004); these reflect the matching balance among balance sheet assets of the tax
effects on adjustments made, mainly referring to benefits paid to employees
subsequent to the employment relationship (euro 24.1 million as of January 1, 2004
and euro 26.5 million as of December 31, 2004) and to transactions on Cash Flow
Hedge financial derivative instruments (euro 3.5 million as of January 1, 2004 and euro
6.2 million as of December 31, 2004).
4) Financial assets and other assets
(euro 1.1 million as of January 1, 2004 and euro 42.0 million as of December 31,
2004); these refer to the recording in the balance sheet of the fair value of the financial
derivative instruments held in the portfolio as of January 1, 2004 (euro 1.1 million
17
Novatrans exchange fluctuation hedges) and as of December 31, 2004 (euro 42.0
million Fair Value Hedge hedges on Terna Public Offer).
5) Trade receivables
(euro 0.1 million as of January 1, 2004 and euro 0.5 million as of December 31, 2004);
this item represents the re-determination of the net amount receivable referring to work
in progress for third party contracts, relating to the periods in question, negotiated by
the Parent Company. These values are matched by balances among trade payables.
Balance sheet items - Liabilities
6) Loans
(euro –6.8 million as of January 1, 2004 and euro –5.2 million as of December 31,
2004); this adjustment represents the reclassification of the current portions of long-
term loans among current liabilities; as far as the change as of December 31, 2004 is
concerned, it also comprises the adjustment to fair value of the bond issues (relating to
the part hedged) negotiated by the Parent Company (euro 41.8 million adjustment for
Public Offer; euro –47.0 million current portions of loans reclassified among current
liabilities).
7) Termination indemnities and other employee benefits
(euro 70.1 million as of January 1, 2004 and euro 77.2 million as of December 31,
2004); these adjustments are summarized in the following table:
Millions of euro Jan. 1, 2004 Dec. 31, 2004 Employee termination indemnity -3.1 -2.9 “Energy discount” allowance 49.7 53.2 Other provisions 23.5 26.9 Total 70.1 77.2
These refer essentially to the application of the actuarial method to the Employee
termination indemnity and to the booking of the current financial-actuarial value of the
obligations relating to the benefits subsequent to the employment relationship for fixed-
benefit programmes.
18
8) Provision for risks and charges.
(euro –9.9 million as of January 1, 2004 and euro 0.0 million as of December 31,
2004); the adjustment is entirely attributable to the reversal of that part of the provision
for risks and charges which does not present the requisites for being recorded as
anticipated by the IAS/IFRS.
9) Deferred tax liabilities.
(euro 4.5 million as of January 1, 2004 and euro 4.6 million as of December 31, 2004);
these reflect the matching balance among the balance sheet liabilities of the tax effects
on the adjustments made, mainly referring to the Employee termination indemnity and
to the reversal of the accumulated depreciation on accessory land.
10) Non-current financial liabilities.
(euro 10.6 million as of January 1, 2004 and euro 31.5 million as of December 31,
2004); these refer to the recording in the balance sheet of the fair value derivative
financial instruments held in the portfolio as of January 1, 2004 (CFH interest rate
hedges for EIB loans) and as of December 31, 2004 (18.9 million CFH on EIB loans
and 12.6 million trading derivatives).
11) Current portions of long-term loans.
(euro 6.8 million as of January 1, 2004 and euro 47.0 million as of December 31,
2004); this represents the reclassification of the current portions of long-term loans.
12) Trade payables
(euro 0.1 million as of January 1, 2004 and euro 0.5 million as of December 31, 2004);
this represents the re-determination of the net liability referring to work in progress for
third party contracts. These values are matched by balances among trade receivables.
Adjustments to the 2004 consolidated income statement items
13) Other revenues (euro –3.7 million) derive from the reinstatement of provisions for
risks and charges no longer recordable on the basis of the IAS/IFRS standards and re-
allocated among accumulated gains and losses; the specific amount refers to the
reversal of the release to the income statement of the excess portion of the provision.
14) Services (euro 2.4 million); identical to previous point 13, it refers to the reversal of
the use of the provision for risks and charges made during 2004 and, as already
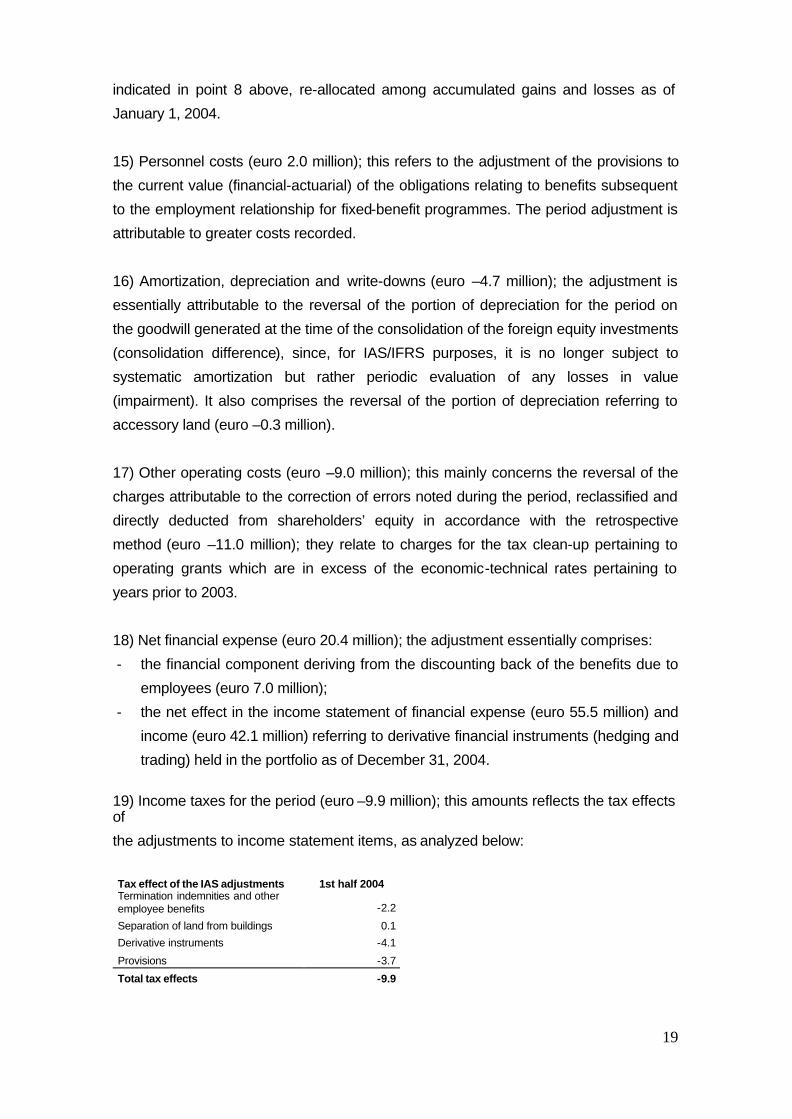
19
indicated in point 8 above, re-allocated among accumulated gains and losses as of
January 1, 2004.
15) Personnel costs (euro 2.0 million); this refers to the adjustment of the provisions to
the current value (financial-actuarial) of the obligations relating to benefits subsequent
to the employment relationship for fixed-benefit programmes. The period adjustment is
attributable to greater costs recorded.
16) Amortization, depreciation and write-downs (euro –4.7 million); the adjustment is
essentially attributable to the reversal of the portion of depreciation for the period on
the goodwill generated at the time of the consolidation of the foreign equity investments
(consolidation difference), since, for IAS/IFRS purposes, it is no longer subject to
systematic amortization but rather periodic evaluation of any losses in value
(impairment). It also comprises the reversal of the portion of depreciation referring to
accessory land (euro –0.3 million).
17) Other operating costs (euro –9.0 million); this mainly concerns the reversal of the
charges attributable to the correction of errors noted during the period, reclassified and
directly deducted from shareholders’ equity in accordance with the retrospective
method (euro –11.0 million); they relate to charges for the tax clean-up pertaining to
operating grants which are in excess of the economic-technical rates pertaining to
years prior to 2003.
18) Net financial expense (euro 20.4 million); the adjustment essentially comprises:
- the financial component deriving from the discounting back of the benefits due to
employees (euro 7.0 million);
- the net effect in the income statement of financial expense (euro 55.5 million) and
income (euro 42.1 million) referring to derivative financial instruments (hedging and
trading) held in the portfolio as of December 31, 2004.
19) Income taxes for the period (euro –9.9 million); this amounts reflects the tax effects of
the adjustments to income statement items, as analyzed below:
Tax effect of the IAS adjustments 1st half 2004 Termination indemnities and other employee benefits -2.2
Separation of land from buildings 0.1
Derivative instruments -4.1
Provisions -3.7
Total tax effects -9.9
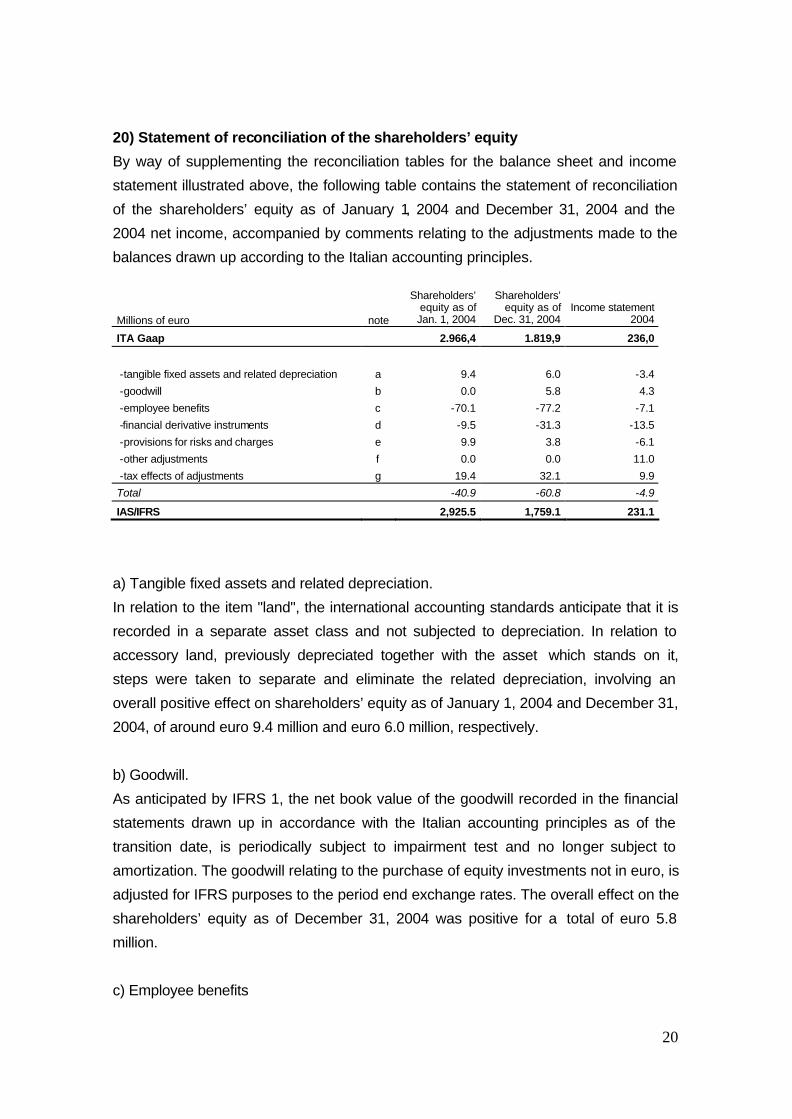
20
20) Statement of reconciliation of the shareholders’ equity
By way of supplementing the reconciliation tables for the balance sheet and income
statement illustrated above, the following table contains the statement of reconciliation
of the shareholders’ equity as of January 1, 2004 and December 31, 2004 and the
2004 net income, accompanied by comments relating to the adjustments made to the
balances drawn up according to the Italian accounting principles.
Millions of euro note
Shareholders’ equity as of Jan. 1, 2004
Shareholders’ equity as of
Dec. 31, 2004 Income statement
2004
ITA Gaap 2.966,4 1.819,9 236,0
-tangible fixed assets and related depreciation a 9.4 6.0 -3.4
-goodwill b 0.0 5.8 4.3
-employee benefits c -70.1 -77.2 -7.1
-financial derivative instruments d -9.5 -31.3 -13.5
-provisions for risks and charges e 9.9 3.8 -6.1
-other adjustments f 0.0 0.0 11.0
-tax effects of adjustments g 19.4 32.1 9.9
Total -40.9 -60.8 -4.9
IAS/IFRS 2,925.5 1,759.1 231.1
a) Tangible fixed assets and related depreciation.
In relation to the item "land", the international accounting standards anticipate that it is
recorded in a separate asset class and not subjected to depreciation. In relation to
accessory land, previously depreciated together with the asset which stands on it,
steps were taken to separate and eliminate the related depreciation, involving an
overall positive effect on shareholders’ equity as of January 1, 2004 and December 31,
2004, of around euro 9.4 million and euro 6.0 million, respectively.
b) Goodwill.
As anticipated by IFRS 1, the net book value of the goodwill recorded in the financial
statements drawn up in accordance with the Italian accounting principles as of the
transition date, is periodically subject to impairment test and no longer subject to
amortization. The goodwill relating to the purchase of equity investments not in euro, is
adjusted for IFRS purposes to the period end exchange rates. The overall effect on the
shareholders’ equity as of December 31, 2004 was positive for a total of euro 5.8
million.
c) Employee benefits
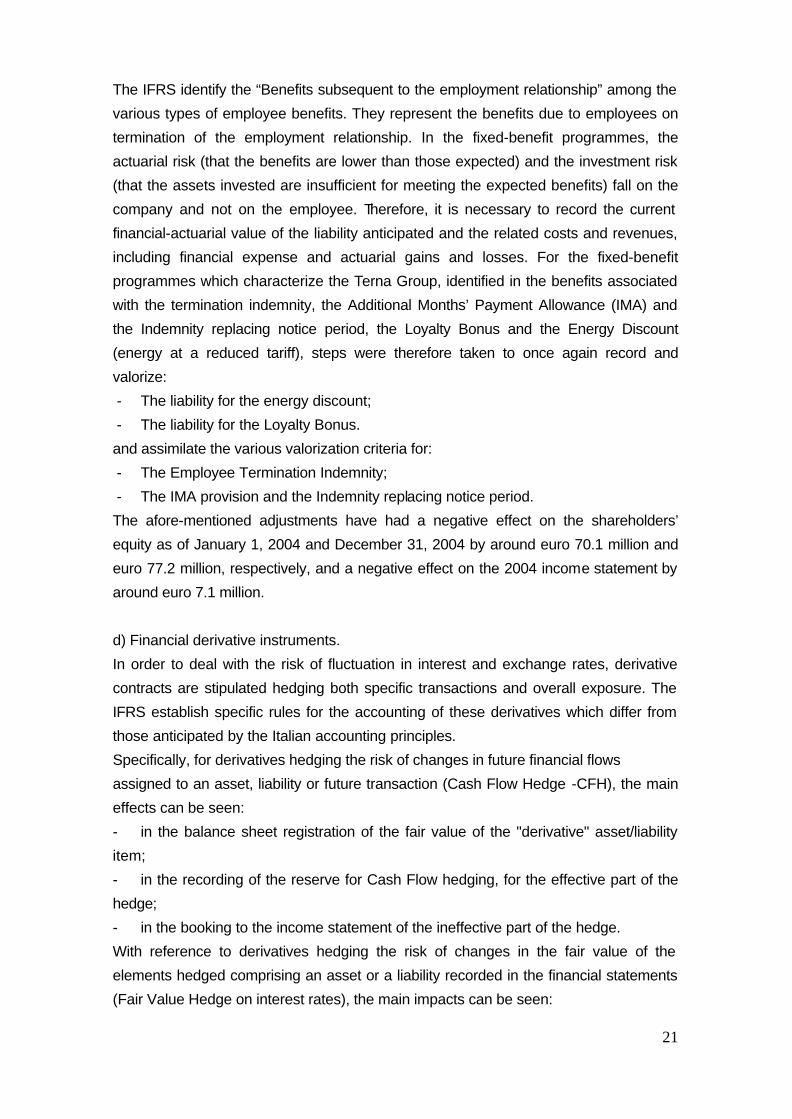
21
The IFRS identify the “Benefits subsequent to the employment relationship” among the
various types of employee benefits. They represent the benefits due to employees on
termination of the employment relationship. In the fixed-benefit programmes, the
actuarial risk (that the benefits are lower than those expected) and the investment risk
(that the assets invested are insufficient for meeting the expected benefits) fall on the
company and not on the employee. Therefore, it is necessary to record the current
financial-actuarial value of the liability anticipated and the related costs and revenues,
including financial expense and actuarial gains and losses. For the fixed-benefit
programmes which characterize the Terna Group, identified in the benefits associated
with the termination indemnity, the Additional Months’ Payment Allowance (IMA) and
the Indemnity replacing notice period, the Loyalty Bonus and the Energy Discount
(energy at a reduced tariff), steps were therefore taken to once again record and
valorize:
- The liability for the energy discount;
- The liability for the Loyalty Bonus.
and assimilate the various valorization criteria for:
- The Employee Termination Indemnity;
- The IMA provision and the Indemnity replacing notice period.
The afore-mentioned adjustments have had a negative effect on the shareholders’
equity as of January 1, 2004 and December 31, 2004 by around euro 70.1 million and
euro 77.2 million, respectively, and a negative effect on the 2004 income statement by
around euro 7.1 million.
d) Financial derivative instruments.
In order to deal with the risk of fluctuation in interest and exchange rates, derivative
contracts are stipulated hedging both specific transactions and overall exposure. The
IFRS establish specific rules for the accounting of these derivatives which differ from
those anticipated by the Italian accounting principles.
Specifically, for derivatives hedging the risk of changes in future financial flows
assigned to an asset, liability or future transaction (Cash Flow Hedge -CFH), the main
effects can be seen:
- in the balance sheet registration of the fair value of the "derivative" asset/liability
item;
- in the recording of the reserve for Cash Flow hedging, for the effective part of the
hedge;
- in the booking to the income statement of the ineffective part of the hedge.
With reference to derivatives hedging the risk of changes in the fair value of the
elements hedged comprising an asset or a liability recorded in the financial statements
(Fair Value Hedge on interest rates), the main impacts can be seen:
22
- in the balance sheet registration of the "derivative" asset/liability item at its fair
value;
- in the booking of the fair value delta attributable to the risk hedged adjusting the
item hedged.
In conclusion, as far as “non-IAS hedging” derivatives are concerned, they are valued
at fair value and the related effects are charged directly to the income statement.
This approach had a negative effect on the shareholders’ equity as of January 1, 2004
and December 31, 2004, amounting euro 9.5 million and euro 31.3 million,
respectively.
e) Provisions for risks and charges
The IFRS anticipate that the provisions for risks and charges must be stated only when
a past obligatory event exists and the company has no realistic alternative other than to
fulfil the obligation. The adjustment refers to the elimination of the provision for faults
and the plant demolition provision which do not possess said characteristics, for a total
of approximately euro 9.9 million on the shareholders’ equity as of January 1, 2004 and
around euro 3.8 million on the shareholders’ equity as of December 31, 2004.
f) Other adjustments.
This concerns the reversal of the charges attributable to corrections of errors noted
during 2004, reclassified by direct deduction from shareholders’ equity in accordance
with the retrospective method.
g) Tax effect of the adjustments.
This originates from the tax effects of the adjustments to the income statement and
balance sheet items generating a positive effect on shareholders’ equity as of January
1, 2004 and December 31, 2004, of euro 19.4 million and euro 32.1 million,
respectively.
Effects on the statement of cash flows as of December 31, 2004
The reconciliation of the statement of consolidated cash flows is not presented since
the effects deriving from the application of the IAS/IFRS accounting standards have not
had any significant impacts.
The following table illustrates the reconciliation of the net financial debt as of December
31, 2004, involving the balances determined previously in accordance with the Italian
accounting principles and those re-determined according to the IAS/IFRS.
Millions of Euro Dec. 31, 2004
Net financial debt ITA Gaap 1,865.3
23
- Application of amortized cost on Terna Bond issues -7.1
- Fair value delta calculated on the Bond issues hedged by fair value hedge transactions 41.8
Net financial debt IAS/IFRS 1,900.0
The net change reveals an increase in financial debt of euro 34.7 million, mainly
attributable to the bonds issued by the Parent Company; the application of the
amortized cost includes discounts and transaction costs directly attributable to the
afore-mentioned loans no longer stated separately in the items anticipated by the
Italian accounting principles.
Audit on the reconciliations required by IFRS 1
The reconciliation to the IFRS of the balance sheet balances as of January 1, 2004 and
December 31, 2004, as well as that of the income statement balances for the 2004
accounting period, accompanied by the related notes, are subject to accounting audit.
The independent auditing firm KPMG S.p.A. has completed its activities and the related
report has been published together with this document.

Terna Joint-stock Company Registered Offices in Via Arno 64, Rome


