23
Retention and Graduation Rates for U.S. Military Servicemembers A Multi-Institutional Cohort Trend Analysis CCME Symposium January 28, 2015 Anaheim, CA
| Date post: | 15-Dec-2015 |
| Category: |
Documents |
| Upload: | miya-fawcett |
| View: | 214 times |
| Download: | 0 times |
Retention and Graduation Rates for U.S. Military Servicemembers
A Multi-Institutional Cohort Trend Analysis
CCME SymposiumJanuary 28, 2015Anaheim, CA

PresentersSeth Marc Kamen, SOC Assistant Director for the Degree Network SystemServicemembers Opportunity Colleges (SOC)
Lesley McBainFormer SOC Consultant, UCLA Doctoral Candidate
Denise NadasenAssociate Vice Provost for Institutional ResearchUniversity of Maryland University College
Phil IceVice President, Research and DevelopmentAmerican Public University System, AMU
Goals of the Presentation• Share background history on the Educational Attainment White
Paper
• Review University of Maryland University College and APUS/American Military Universities’ findings using the cohort model
• Explore pros and cons of data collection
• Share stories from the audience
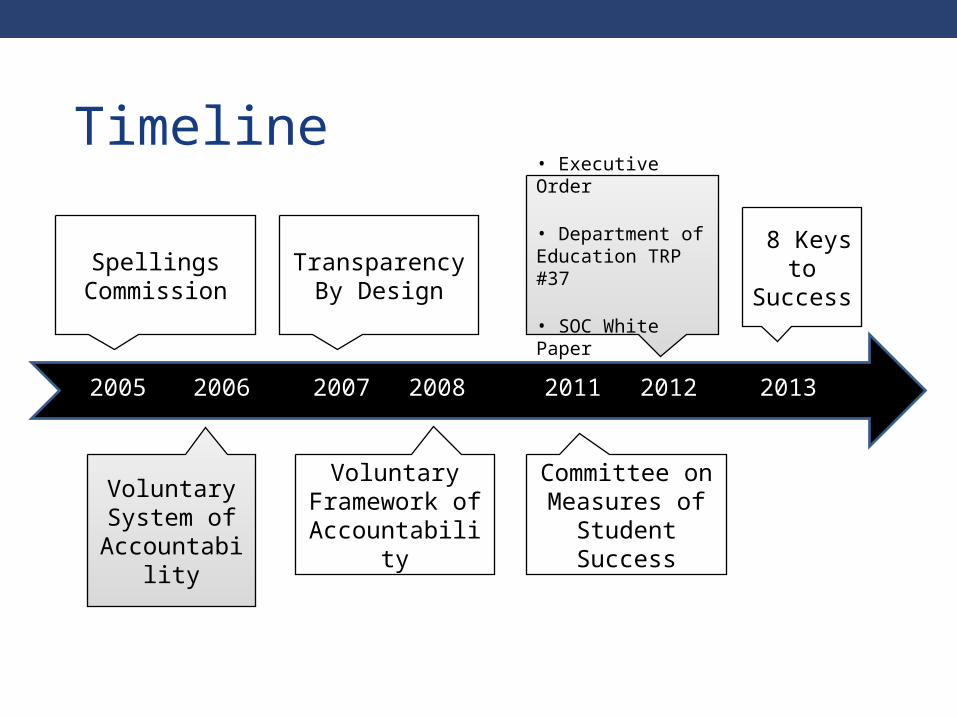
Timeline
Spellings Commission
Voluntary System of
Accountability
Voluntary Framework of Accountability
• Executive Order
• Department of Education TRP #37
• SOC White Paper
Transparency By Design
Committee on Measures of
Student Success
2005 2006 2007 2008 2011 2012 2013
8 Keys to Success
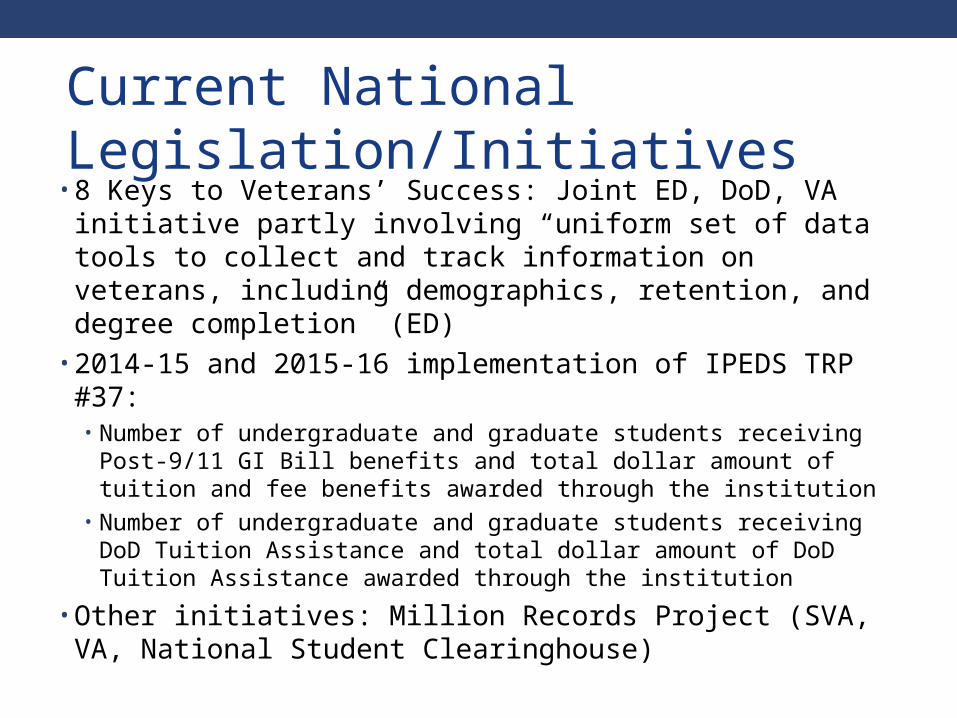
Current National Legislation/Initiatives • 8 Keys to Veterans’ Success: Joint ED, DoD, VA initiative
partly involving “uniform set of data tools to collect and track information on veterans, including demographics, retention, and degree completion” (ED)
• 2014-15 and 2015-16 implementation of IPEDS TRP #37:• Number of undergraduate and graduate students receiving Post-
9/11 GI Bill benefits and total dollar amount of tuition and fee benefits awarded through the institution
• Number of undergraduate and graduate students receiving DoD Tuition Assistance and total dollar amount of DoD Tuition Assistance awarded through the institution
• Other initiatives: Million Records Project (SVA, VA, National Student Clearinghouse)
Charge to the Group
• Improve the process by which military students are measured, including their success and nonsuccess (as defined both by the military and by institutions)
• Define what is a military student for data collection purposes
• Determine metrics for evaluation
Framing the Discussion• Military enrollment is different at every institution,
and therefore one model will not work for all
• Military training is accepted as (transfer) college credits, thus obscuring any definition based on first-time status
• The increased use of military portals encourages servicemembers to choose among institutions to take the courses they need/want to take at any given time
Framing the Discussion• Many military students enroll in a course offered through
distance institutions "to try out" online education, only to find out that they prefer to take their early courses face to face at a nearby institution
• Military deployments throughout the nation and the world expose servicemembers to many military-serving institutions, increasing the likelihood of their attending multiple institutions en route to graduation
• The regulations governing and the amount of money available for tuition assistance are constantly changing
Highlights of the White Paper
• Definition of military and veteran student
• Military and Veteran cohort models
• Inclusion and reporting requirements
• Variables for tracking
• Recommendations for next steps
Recommendations• The working group supports the "concept" of a comprehensive strategy on
outcomes measures as reflected in the April 27, 2012 Presidential Executive Order (Section 3.c).
• The working group recommends that the Departments of Defense, Veterans Affairs, and Education, along with the Consumer Financial Protection Bureau (CFPB), should collaborate with Servicemembers Opportunity Colleges (SOC) and other higher education stakeholders as much as possible in developing future outcomes measures and institutional reporting requirements. Where possible, community consensus should be achieved on data collection, analysis, and usage.
• The working group suggests that the Departments of Defense, Veterans Affairs, and Education should – in collaboration with other stakeholders whose expertise and interests overlap with DoD and ED – continue to examine the current availability of data on military and veteran students at the federal level.
Recommendations
• Consistent with this paper, the working group offers its recommendation for the future construction of a common, measurable persistence rate (from year one to year two) and graduation rate for both the military student and veteran cohorts.
• For these metrics, the working group also offers the variables and definitions proposed in this paper to be used or adapted for national metrics for servicemembers and veterans.
• The working group recognizes the recommendations from the Department of Education’s Technical Review Panel 37, Selected Outcomes of the Advisory Committee on Student Success, as an important step toward recognizing the changing character of the nation’s college-going population.
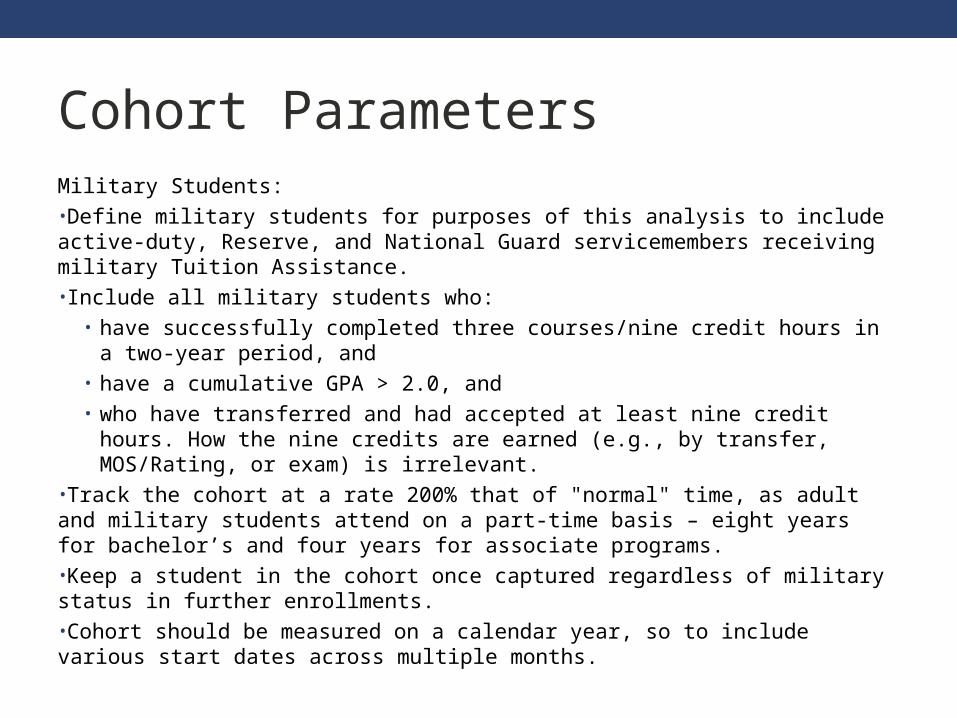
Cohort ParametersMilitary Students:•Define military students for purposes of this analysis to include active-duty, Reserve, and National Guard servicemembers receiving military Tuition Assistance. •Include all military students who:
• have successfully completed three courses/nine credit hours in a two-year period, and
• have a cumulative GPA > 2.0, and• who have transferred and had accepted at least nine credit hours. How
the nine credits are earned (e.g., by transfer, MOS/Rating, or exam) is irrelevant.
•Track the cohort at a rate 200% that of "normal" time, as adult and military students attend on a part-time basis – eight years for bachelor’s and four years for associate programs.•Keep a student in the cohort once captured regardless of military status in further enrollments.•Cohort should be measured on a calendar year, so to include various start dates across multiple months.
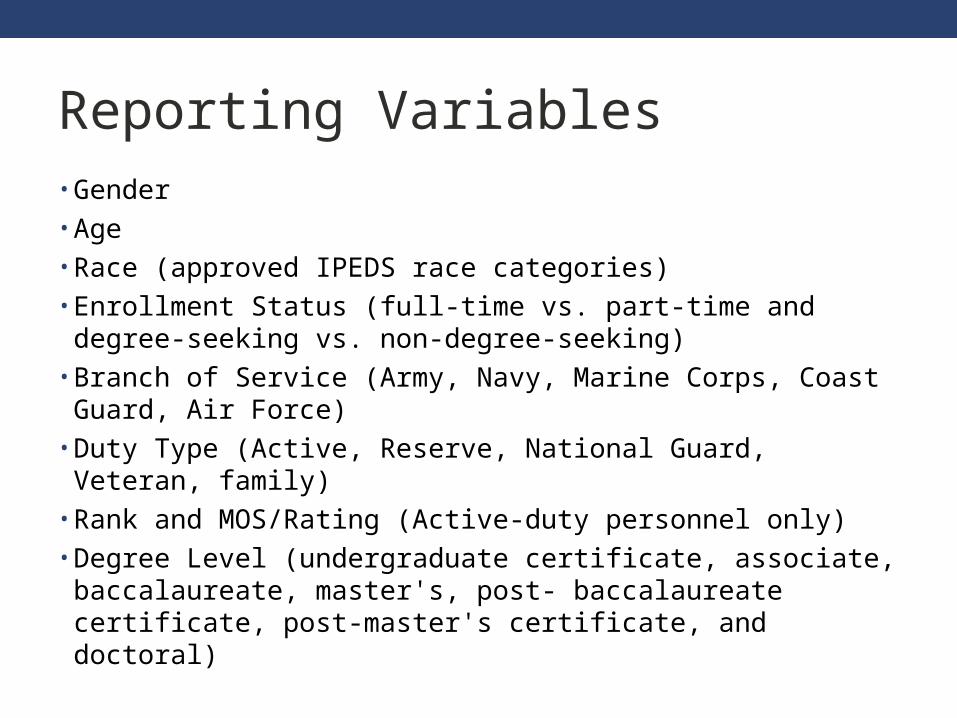
Reporting Variables• Gender• Age• Race (approved IPEDS race categories)• Enrollment Status (full-time vs. part-time and degree-seeking vs. non-degree-seeking)
• Branch of Service (Army, Navy, Marine Corps, Coast Guard, Air Force)
• Duty Type (Active, Reserve, National Guard, Veteran, family)
• Rank and MOS/Rating (Active-duty personnel only)• Degree Level (undergraduate certificate, associate, baccalaureate, master's, post- baccalaureate certificate, post-master's certificate, and doctoral)
15
UMUC
Retention and Graduation Rates
FY 2006 SOC Cohort
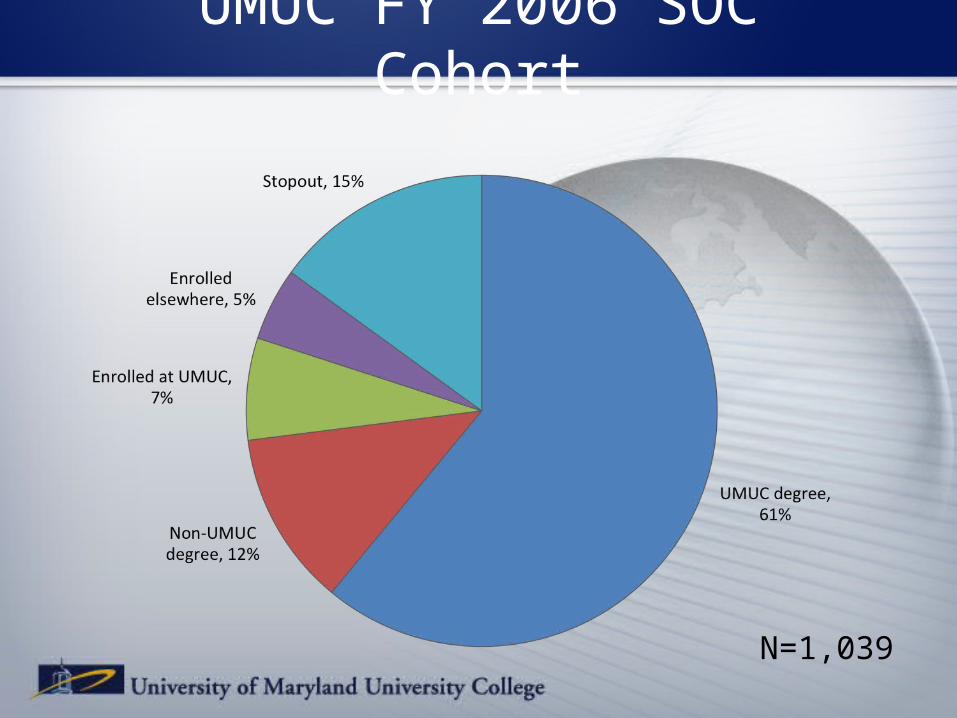
UMUC FY 2006 SOC Cohort
N=1,039
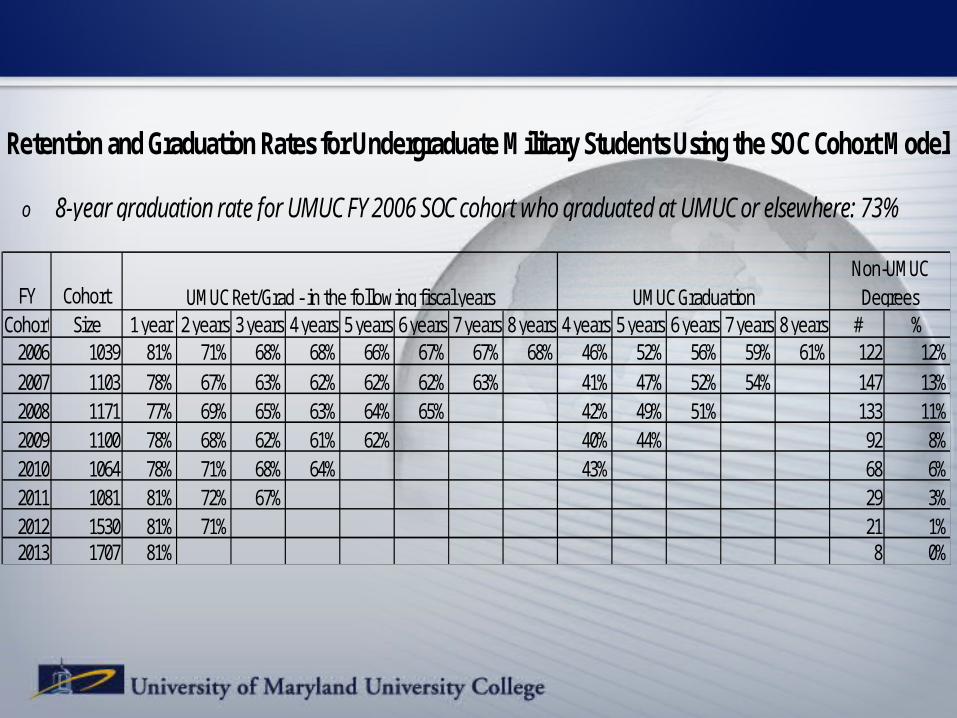
Retention and Graduation Rates for Undergraduate Military Students Using the SOC Cohort Model
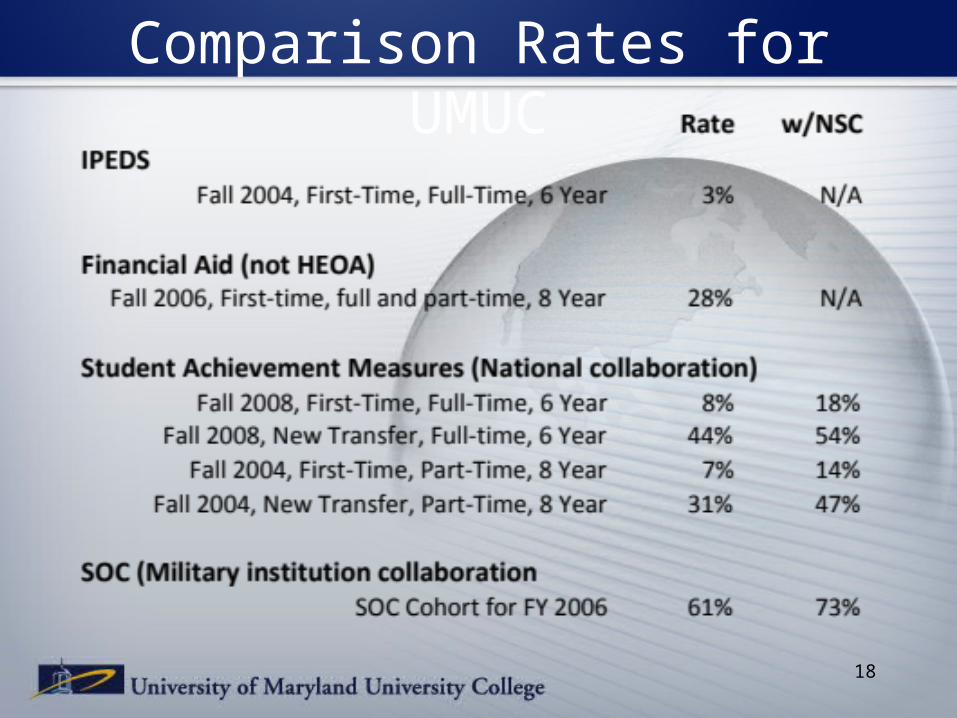
o 8-year graduation rate for UMUC FY 2006 SOC cohort who graduated at UMUC or elsewhere: 73%
FY CohortCohort Size 1 year 2 years 3 years 4 years 5 years 6 years 7 years 8 years 4 years 5 years 6 years 7 years 8 years # %
2006 1039 81% 71% 68% 68% 66% 67% 67% 68% 46% 52% 56% 59% 61% 122 12%2007 1103 78% 67% 63% 62% 62% 62% 63% 41% 47% 52% 54% 147 13%2008 1171 77% 69% 65% 63% 64% 65% 42% 49% 51% 133 11%2009 1100 78% 68% 62% 61% 62% 40% 44% 92 8%2010 1064 78% 71% 68% 64% 43% 68 6%2011 1081 81% 72% 67% 29 3%2012 1530 81% 71% 21 1%2013 1707 81% 8 0%
Non-UMUC DegreesUMUC Ret/Grad - in the following fiscal years UMUC Graduation
18
Comparison Rates for UMUC
19
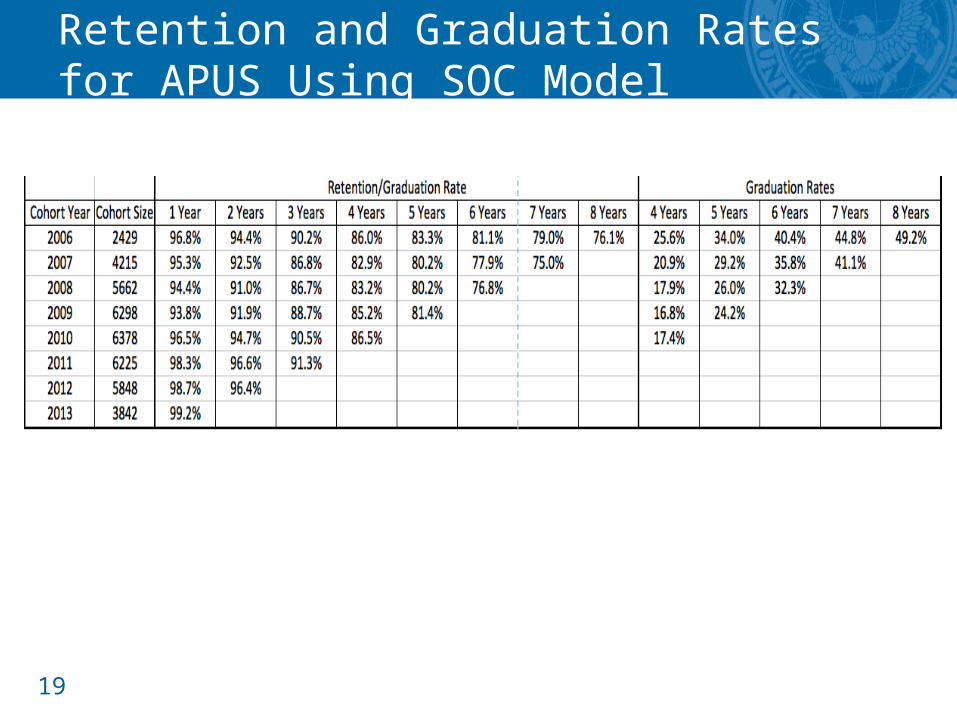
Retention and Graduation Rates for APUS Using SOC Model
20
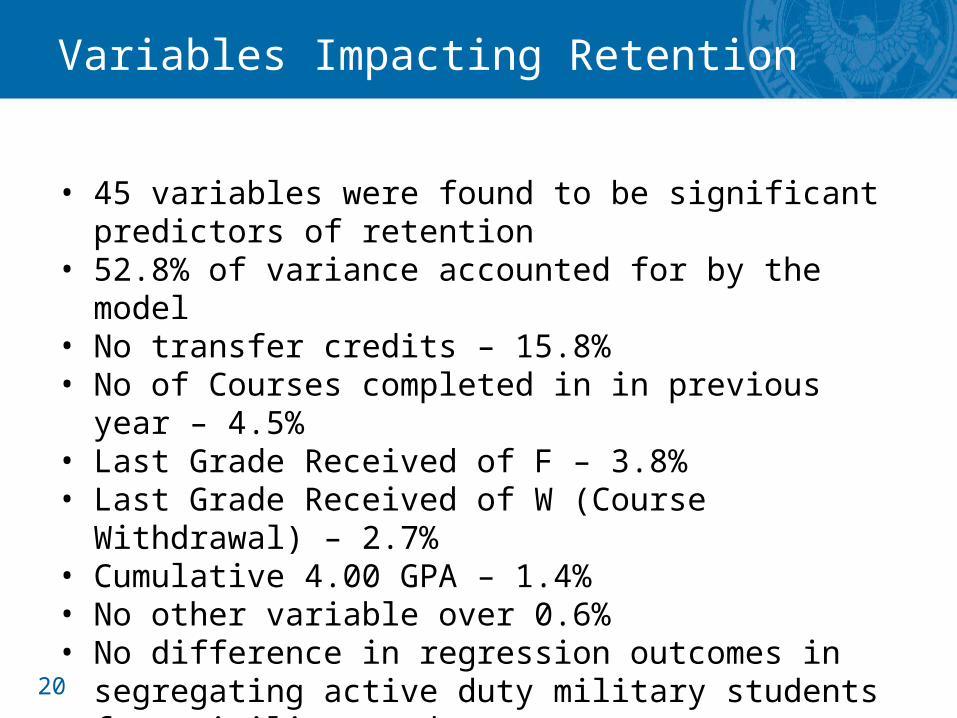
Variables Impacting Retention
• 45 variables were found to be significant predictors of retention
• 52.8% of variance accounted for by the model• No transfer credits – 15.8%• No of Courses completed in in previous year –
4.5%• Last Grade Received of F – 3.8%• Last Grade Received of W (Course Withdrawal) –
2.7%• Cumulative 4.00 GPA – 1.4%• No other variable over 0.6%• No difference in regression outcomes in
segregating active duty military students from civilian students.
• Race and gender were insignificant variables in this analysis.
21
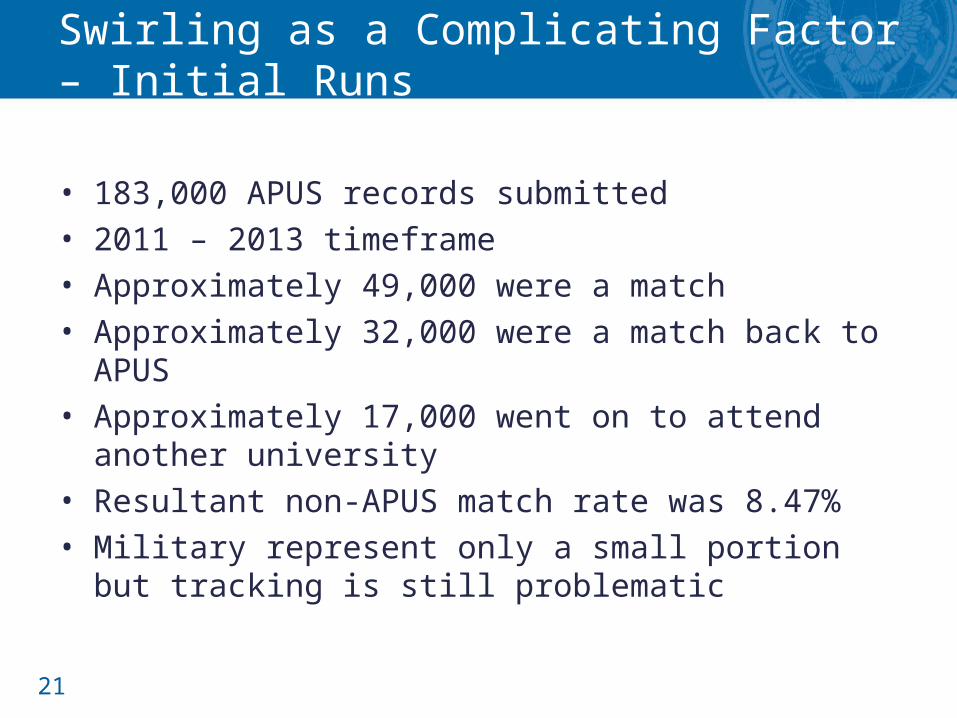
Swirling as a Complicating Factor – Initial Runs
• 183,000 APUS records submitted• 2011 – 2013 timeframe• Approximately 49,000 were a match• Approximately 32,000 were a match back to APUS• Approximately 17,000 went on to attend another
university• Resultant non-APUS match rate was 8.47%• Military represent only a small portion but
tracking is still problematic

Questions from the Audience
Thank you.
Additional copies of the paper can be downloaded
from the SOC website at www.soc.aascu.org/


