30
State of Rhode Island Presented by: David Iden Larry Brown Retirement Plan Review 1st Quarter 2016

State of Rhode Island
Presented by: David Iden
Larry Brown
Retirement Plan Review 1st Quarter 2016

Contents
2
David Iden
Relationship Manager, Institutional Relationships
Larry Brown
Director, Investment Product & Strategy
I. Plan Data Summary
• All Plans Page 3
• 401(a) Defined Contribution Plan Page 5
• FICA Alternative Retirement Income Security Program Page 14
II. Investment Performance Summary Page 18

Plan Data Summary - All Plans
3

Summary of All Plans
4
Roughly 91% of assets are in Vanguard Lifecycle Trusts
Data as of 3/31/2016
Contributions - By Category Class
Total Contributions: $114,140,153
(rolling 12 months)
Plan Assets - By Category Class
Total Plan Assets: $478,296,084
Forfeiture plan assets of $68,455.09 are included in the total above.

Plan Data Summary – 401(a) Defined Contribution Plan

Summary of Defined Contribution Plan
6
Roughly 91% of assets are in Vanguard Lifecycle Trusts
Data as of 3/31/2016
Plan Assets - By Category Class
Total Plan Assets: $476,508,641
Forfeiture plan assets of $68,455.09 are included in the total above.
Contributions - By Category Class
Total Contributions: $113,725,044
(rolling 12 months)
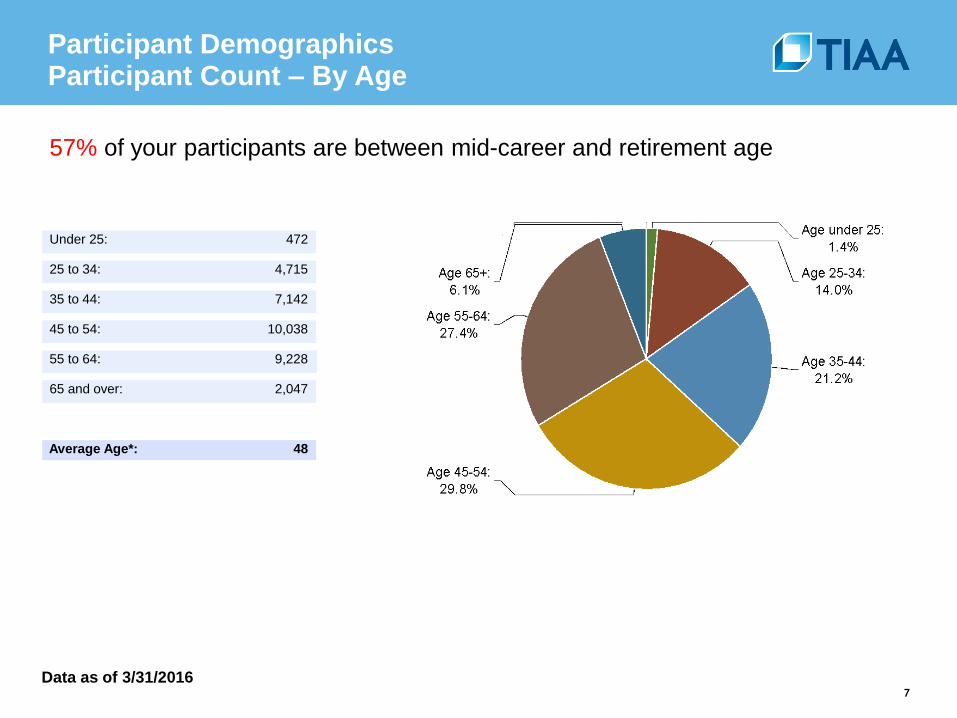
Participant Demographics Participant Count – By Age
7
57% of your participants are between mid-career and retirement age
Data as of 3/31/2016
25 to 34: 4,715
Average Age*: 48
Under 25: 472
35 to 44: 7,142
45 to 54: 10,038
55 to 64: 9,228
65 and over: 2,047
Not Supplied: 1

Plan Assets By Category Class
8
Data as of 3/31/2016
Total Plan Assets: $476,508,641
Default Fund: VANGUARD TGT RET 2010 TRUST II
Average Account Balance: $14,162
Forfeiture plan assets of $68,455.09 are included in the total above.
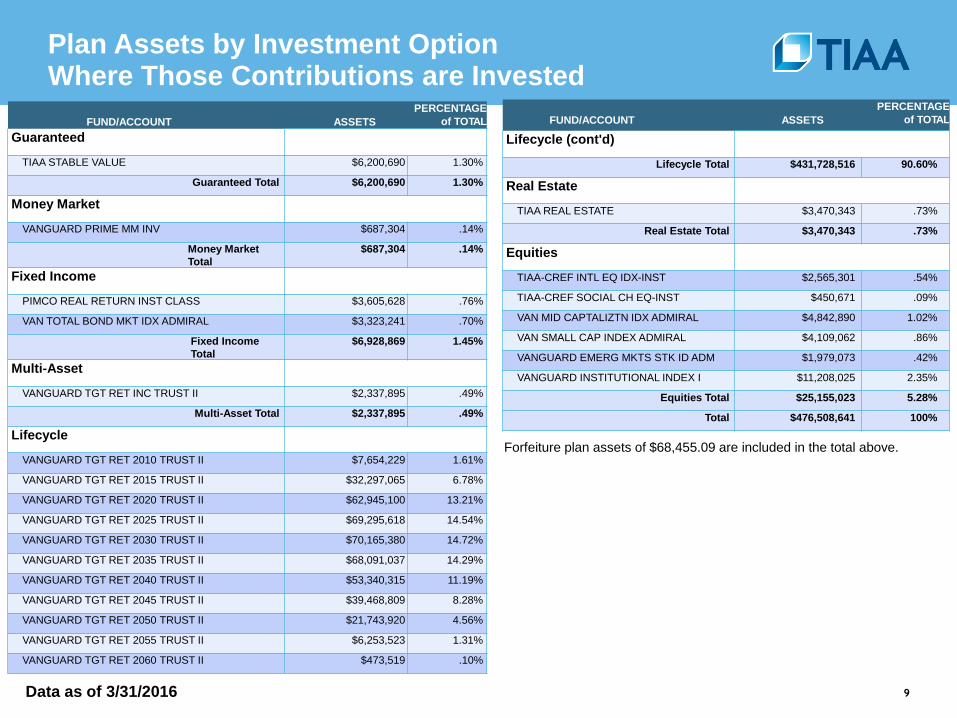
Plan Assets by Investment Option Where Those Contributions are Invested
9 Data as of 3/31/2016
PERCENTAGE
FUND/ACCOUNT ASSETS of TOTAL
Guaranteed
TIAA STABLE VALUE $6,200,690 1.30%
Guaranteed Total $6,200,690 1.30%
Money Market
VANGUARD PRIME MM INV $687,304 .14%
Money Market
Total
$687,304 .14%
Fixed Income
PIMCO REAL RETURN INST CLASS $3,605,628 .76%
VAN TOTAL BOND MKT IDX ADMIRAL $3,323,241 .70%
Fixed Income
Total
$6,928,869 1.45%
Multi-Asset
VANGUARD TGT RET INC TRUST II $2,337,895 .49%
Multi-Asset Total $2,337,895 .49%
Lifecycle
VANGUARD TGT RET 2010 TRUST II $7,654,229 1.61%
VANGUARD TGT RET 2015 TRUST II $32,297,065 6.78%
VANGUARD TGT RET 2020 TRUST II $62,945,100 13.21%
VANGUARD TGT RET 2025 TRUST II $69,295,618 14.54%
VANGUARD TGT RET 2030 TRUST II $70,165,380 14.72%
VANGUARD TGT RET 2035 TRUST II $68,091,037 14.29%
VANGUARD TGT RET 2040 TRUST II $53,340,315 11.19%
VANGUARD TGT RET 2045 TRUST II $39,468,809 8.28%
VANGUARD TGT RET 2050 TRUST II $21,743,920 4.56%
VANGUARD TGT RET 2055 TRUST II $6,253,523 1.31%
VANGUARD TGT RET 2060 TRUST II $473,519 .10%
PERCENTAGE
FUND/ACCOUNT ASSETS of TOTAL
Lifecycle (cont'd)
Lifecycle Total $431,728,516 90.60%
Real Estate
TIAA REAL ESTATE $3,470,343 .73%
Real Estate Total $3,470,343 .73%
Equities
TIAA-CREF INTL EQ IDX-INST $2,565,301 .54%
TIAA-CREF SOCIAL CH EQ-INST $450,671 .09%
VAN MID CAPTALIZTN IDX ADMIRAL $4,842,890 1.02%
VAN SMALL CAP INDEX ADMIRAL $4,109,062 .86%
VANGUARD EMERG MKTS STK ID ADM $1,979,073 .42%
VANGUARD INSTITUTIONAL INDEX I $11,208,025 2.35%
Equities Total $25,155,023 5.28%
Total $476,508,641 100%
Forfeiture plan assets of $68,455.09 are included in the total above.

Participant Demographics Average Asset Balance by Age Group
10
Data as of 3/31/2016
Average Account Balance: $14,162

Communication & Education Highlights: 2016
A Look Back
TIAA-CREF Financial Essentials Seminars
TIAA-CREF’s comprehensive, financial education program is designed to help every employee address their financial needs.
Focus on education for individuals – financial well-being is defined by them
Offer material relevant to where they are in life/career
Give them the confidence to help take control of their
financial future
Benefits Fairs, Seminars and Workshops
Other Resources
• Retirement Readiness Center
• Annuities 101
Additional Communications & Resources
PlanFocus® Matters Quarterly e-newsletter
Top Picks: Monthly Administrator Bulletin
Monthly Webinar invitation
Highlights from the TIAA-CREF Institute
Research
Employee engagement checklist
Q1 2016 Benefits Fairs, Seminars and Workshops Attendees
ERSRI Meeting held at Ferri Middle School 62
ERSRI Meeting held at the Department of Health 100
ERSRI Meeting; RI Laborers’ District Council 20
ERSRI Meeting held for RIDOT 35
Rhode Leagues of Cities and Towns EXPO 300
ERSRI Meeting held at the Mt. Hope High School for the
Bristol/Warren Teachers 65
ERSRI Meeting at West Warwick High School 50
Dept. of Health Retirement Planning /R2R plan Presentation 15
RI Military Staff/Emergency Mgmt Agency Group Presentation 8
Webinars
Interactive webinars keep you up-to-date on topics to help you fulfill fiduciary responsibilities,
enhance plan administration and engage your employees.
For the most current list go to
https://www.tiaa-cref.org/public/plansponsors/news/webinars/index.html
Year Attendees
2013 1785
2014 402
2015 718
Q1 2016 655

12
Employee Engagement In-person Interactions with Plan Participants as of 3/31/16
2 Employees who had multiple sessions are only counted once. 3 Reflects employee’s total TIAA-CREF balance.
Gender Count2 Average Age Average Balance3
Female 49 51.8 $35,767
Male 26 55.1 $38,058
Unknown 0 0.0 $0
Overall 75 52.9 $36,561
Topic Summary - Individual Sessions 2016 YTD
13%
Individual Session Breakdown
Employees Participating in Sessions 2016
Results YTD through December 31, 2015*
97% AGREED
Objectivity & Integrity Employees responding to surveys agreed/strongly agreed that the
Consultant put their interests first.
93% AGREED
Overall Client Experience Composite score, based on employees’ responses to 5 attribute
questions. Respondents strongly agreed/agreed that the consultant:
1. Put their interests first
2. Provided quality advice
3. Understood their needs and goals
4. Exhibited financial expertise
5. Anticipated additional financial issues and brought them to attention
*Source: Customer Insights Corporate Scorecard
23%
6%
43%
18%
9% Advice/GuidanceDelivered
Enrollment Meeting
Investment Education
Retirement Consult(Delivered)
Service Meeting
Individual Sessions1 (Field Consulting Group)
190
680
392
210
77
0
200
400
600
800
2012 2013 2014 2015 2016 (as of3/31)
1 Numbers show total sessions held and may include employees
who had multiple sessions.
These statistics are meant to reflect customer satisfaction with services provided through TIAA-CREF Financial Consultants. Results experienced may not be typical of all
participants, and are not indicative of future performance or success. Individual results will vary

Employee Engagement Individual Advisory Services as of 3/31/16
13
2 Employees who had multiple meetings are only counted once. 3 Reflects employee’s total TIAA-CREF balance.
Gender Count2 Average Age Average Balance3
Female 7 60.2 $175,674
Male 4 60.7 $300,498
Overall 11 60.4 $221,064 9
38 40
49
14
0
10
20
30
40
50
60
2012 2013 2014 2015 2016 (as of3/31)
95% AGREED
Considers Employee’s Interests First Agreed/strong agreed that advisor considers employee’s interests first.
Individual Advisory Services Group Activity 2016 YTD
Financial Planning Session Breakdown
Meetings1 Held (Individual Advisory Services) Employees Participating in Meetings in 2016
Executive Financial Planning Service Offerings
TIAA-CREF and its employees do not offer tax or legal advice, or create and prepare legal documents associated with estate plans
Results YTD through December 31, 2015*
*Customer Insights Corporate Scorecard
43%
36%
21%
Discovery Meetings
Annual Review
Investment Review
1 Numbers show total meetings held and may include employees
who had multiple meetings.
Investment Management &
Planning
Estate and Gift Planning
Charitable Planning
Education Planning
Cash Flow Analysis
Stock Options Review
Asset Protection Planning
Investment Review
Executive Compensation &
Benefits Analysis
Life Insurance Analysis
Career Transition Financial
Planning
Mobile capabilities providing direct
linkage to advisors

Plan Data Summary – FICA Alternative Retirement Income Security Program

Plan Assets By Category Class
15 Data as of 3/31/2016
Total Plan Assets: $1,787,443
Default Fund: VANGUARD TGT RET 2010 TRUST II
Average Account Balance: $1,496

Plan Assets by Investment Option Where Those Contributions are Invested
16
Data as of 3/31/2016
PERCENTAGE
FUND/ACCOUNT ASSETS of TOTAL
Guaranteed
TIAA STABLE VALUE $767 .04%
Guaranteed Total $767 .04%
Multi-Asset
VANGUARD TGT RET INC TRUST II $2,683 .15%
Multi-Asset Total $2,683 .15%
Lifecycle
VANGUARD TGT RET 2010 TRUST II $6,928 .39%
VANGUARD TGT RET 2015 TRUST II $8,850 .50%
VANGUARD TGT RET 2020 TRUST II $1,135,510 63.53%
VANGUARD TGT RET 2025 TRUST II $55,589 3.11%
VANGUARD TGT RET 2030 TRUST II $71,272 3.99%
VANGUARD TGT RET 2035 TRUST II $43,733 2.45%
VANGUARD TGT RET 2040 TRUST II $26,612 1.49%
VANGUARD TGT RET 2045 TRUST II $38,125 2.13%
VANGUARD TGT RET 2050 TRUST II $50,784 2.84%
VANGUARD TGT RET 2055 TRUST II $129,618 7.25%
VANGUARD TGT RET 2060 TRUST II $216,972 12.14%
Lifecycle Total $1,783,994 99.81%
Total $1,787,443 100%

Participant Demographics Participant Count – By Age
17
Data as of 03/31/2016
25 to 34: 197
Average Age: 28
Under 25: 767
35 to 44: 58
45 to 54: 98
55 to 64: 56
65 and over: 19

Participant Demographics Average Asset Balance by Age Group
18
Data as of 3/31/2016
Average Account Balance: $1,496

Investment performance

2016 YTD Performance Summary
20
(A) (B) (C) (D) (E) (F) (G) (H) (I) (J) (K) (L) (M) (N) (O) (P) (Q) (R) (S) (T) (U) (V) (W) (X) (Y)
TIAA-CREF Manager AUM Gross Net Net Rev Annualized Total Returns as of 3/31/2016 Since Incep. Sharpe Ratio Std. Deviation
Tracking
Error
As of 3/31/16 Ticker Tenure $ Millions ER ER %-ile Share 1 Month YTD 1 Year %-ile 3 Year %-ile 5 Year %-ile 10 Year %-ile Incep. Date 3 Year %-ile 3 Year %-ile 3 Year
Stable Value/Guaranteed & Money Market
Stable Value/Guaranteed
TIAA Stable Value**** Current crediting rate = 1.80 0.47 0.47 1.85 1.86 1.87 03/31/12
Money Market
Vanguard Prime Money Market Inv VMMXX 12.75 139,004.32 0.16 0.16 0.00 0.03 0.09 0.14 0.06 0.05 1.24 5.21 06/04/75 (0.81) 0.03 0.02
Current 7-day Yield: 0.01
Citi 3-Month Treasury Bill - 0.07 0.12 0.07 0.07 1.07
FIXED INCOME
Intermediate-Term Bond
Vanguard Total Bond Market Index Adm VBTLX 3.17 157,966.22 0.07 0.07 1 0.00 0.95 3.09 1.82 13 2.38 24 3.71 41 4.86 39 4.50 11/12/01 0.75 27 3.11 52 0.27
Barclays U.S. Aggregate Float Adjusted Index 0.98 3.03 1.96 2.50 3.78 4.90 0.82 3.00
Intermediate-Term Bond Median 0.86 0.76 1.25 2.61 0.90 1.98 3.63 4.71 0.63 3.10 0.95
Intermediate-Term Bond Number of Funds 1,117 1,117 1085 1043 994 867 1044 1044
Inflation-Linked Bond
PIMCO Real Return Instl PRRIX 8.33 10,944.88 0.50 0.45 20 0.00 2.61 4.12 (0.30) 68 (1.65) 57 2.65 11 4.76 2 01/29/97 (0.25) 42 6.24 95 1.50
Barclays US Treasury US TIPS TR USD 1.80 4.46 1.51 (0.71) 3.02 4.62 (0.12) 5.31
Inflation-Protected Bond Median 0.86 0.75 1.78 3.82 0.40 (1.44) 2.06 3.92 (0.27) 5.16 0.91
Inflation-Protected Bond Number of Funds 256 256 249 237 195 146 237 237
Recent Returns

2016 YTD Performance Summary
21
(A) (B) (C) (D) (E) (F) (G) (H) (I) (J) (K) (L) (M) (N) (O) (P) (Q) (R) (S) (T) (U) (V) (W) (X) (Y)
TIAA-CREF Manager AUM Gross Net Net Rev Annualized Total Returns as of 3/31/2016 Since Incep. Sharpe Ratio Std. Deviation
Tracking
Error
As of 3/31/16 Ticker Tenure $ Millions ER ER %-ile Share 1 Month YTD 1 Year %-ile 3 Year %-ile 5 Year %-ile 10 Year %-ile Incep. Date 3 Year %-ile 3 Year %-ile 3 Year
Equity
Large Cap Blend
Vanguard Institutional Index I VINIX 15.33 199,079.28 0.04 0.04 1 0.00 6.78 1.34 1.77 13 11.79 10 11.55 9 7.01 16 9.37 07/31/90 1.04 8 11.35 31 0.01
S&P 500 TR USD 6.78 1.35 1.78 11.82 11.58 7.01 1.04 11.36
TIAA-CREF Social Choice Eq Instl TISCX 10.33 2,644.79 0.18 0.18 4 0.00 7.27 1.68 (1.52) 49 9.44 62 10.05 49 6.50 34 07/01/99 0.83 58 11.61 53 0.99
Russell 3000 TR USD 7.04 0.97 (0.34) 11.15 11.01 6.90 0.97 11.56
Large Blend Median 1.13 1.02 6.59 0.41 (1.59) 10.12 10.01 6.14 0.88 11.56 2.37
Large Blend Number of Funds 1,681 1,681 1,626 1,517 1,403 1,225 1,523 1,523
Mid Cap Blend
Vanguard Mid Cap Index Adm VIMAX 17.92 67,296.86 0.09 0.09 3 0.00 7.97 1.17 (4.29) 38 10.78 8 10.03 12 7.24 26 9.49 11/12/01 0.90 10 12.07 30 0.03
Spliced Mid Cap Index * 7.98 1.16 (4.27) 10.84 10.08 7.28
CRSP US Mid Cap TR USD 7.98 1.16 (4.27) 10.84 10.37 7.35 0.91 12.08
Mid-Cap Blend Median 1.26 1.17 7.70 1.81 (5.33) 8.46 8.28 6.33 0.70 12.53 3.56
Mid-Cap Blend Number of Funds 470 470 439 414 373 305 415 415
Small Cap Blend
Vanguard Small Cap Index Adm VSMAX 24.33 55,192.14 0.09 0.09 1 0.00 8.37 1.00 (7.14) 42 8.51 25 8.80 21 6.81 13 8.34 11/13/00 0.66 17 13.76 23 0.04
Spliced Small Cap Index ** 8.39 1.01 (7.16) 8.51 8.77 6.75
CRSP US Small Cap TR USD 8.39 1.01 (7.16) 8.51 9.03 7.33 0.66 13.76
Small Blend Median 1.36 1.24 7.80 0.30 (8.02) 7.05 7.26 5.11 0.54 14.49 3.65
Small Blend Number of Funds 854 854 804 725 671 563 726 726
Foreign Large Blend
TIAA-CREF International Eq Idx Instl TCIEX 10.67 6,612.55 0.06 0.06 - 0.00 6.64 (2.73) (8.21) 47 2.24 40 2.44 30 1.91 35 10/01/02 0.23 41 13.35 74 1.96
MSCI EAFE NR USD 6.51 (3.01) (8.27) 2.23 2.29 1.80 0.22 13.61
Foreign Large Blend Median 1.33 1.16 6.83 (2.30) (8.35) 1.89 1.73 1.44 0.20 12.93 3.39
Foreign Large Blend Number of Funds 916 916 820 783 720 532 783 783
Recent Returns
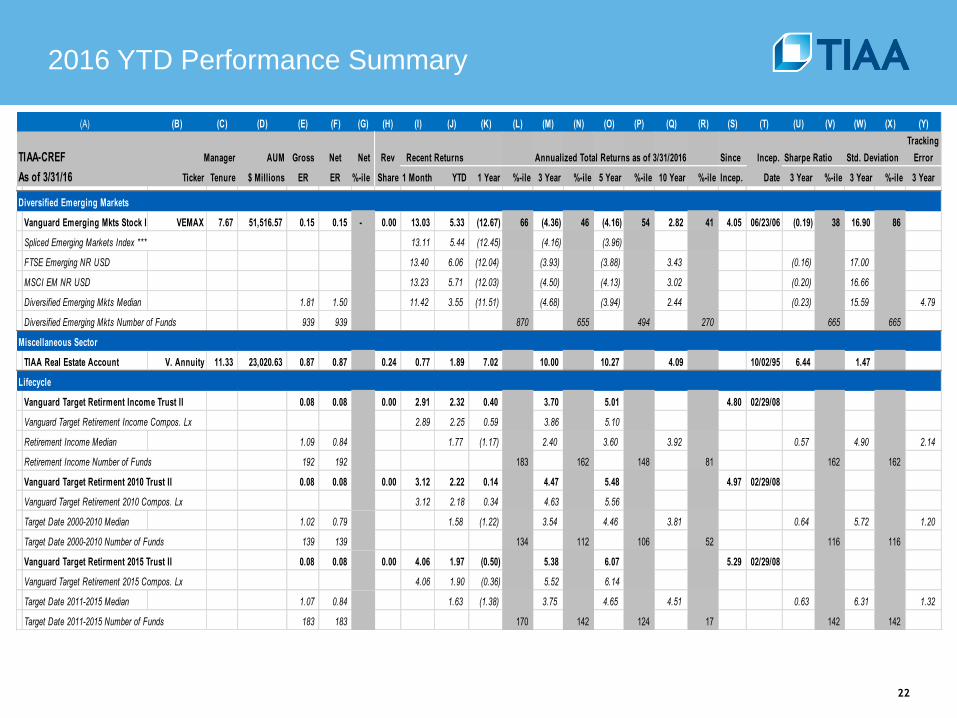
2016 YTD Performance Summary
22
(A) (B) (C) (D) (E) (F) (G) (H) (I) (J) (K) (L) (M) (N) (O) (P) (Q) (R) (S) (T) (U) (V) (W) (X) (Y)
TIAA-CREF Manager AUM Gross Net Net Rev Annualized Total Returns as of 3/31/2016 Since Incep. Sharpe Ratio Std. Deviation
Tracking
Error
As of 3/31/16 Ticker Tenure $ Millions ER ER %-ile Share 1 Month YTD 1 Year %-ile 3 Year %-ile 5 Year %-ile 10 Year %-ile Incep. Date 3 Year %-ile 3 Year %-ile 3 Year
Diversified Emerging Markets
Vanguard Emerging Mkts Stock Idx Adm VEMAX 7.67 51,516.57 0.15 0.15 - 0.00 13.03 5.33 (12.67) 66 (4.36) 46 (4.16) 54 2.82 41 4.05 06/23/06 (0.19) 38 16.90 86
Spliced Emerging Markets Index *** 13.11 5.44 (12.45) (4.16) (3.96)
FTSE Emerging NR USD 13.40 6.06 (12.04) (3.93) (3.88) 3.43 (0.16) 17.00
MSCI EM NR USD 13.23 5.71 (12.03) (4.50) (4.13) 3.02 (0.20) 16.66
Diversified Emerging Mkts Median 1.81 1.50 11.42 3.55 (11.51) (4.68) (3.94) 2.44 (0.23) 15.59 4.79
Diversified Emerging Mkts Number of Funds 939 939 870 655 494 270 665 665
Miscellaneous Sector
TIAA Real Estate Account V. Annuity 11.33 23,020.63 0.87 0.87 0.24 0.77 1.89 7.02 10.00 10.27 4.09 10/02/95 6.44 1.47
Lifecycle
Vanguard Target Retirment Income Trust II 0.08 0.08 0.00 2.91 2.32 0.40 3.70 5.01 4.80 02/29/08
Vanguard Target Retirement Income Compos. Lx 2.89 2.25 0.59 3.86 5.10
Retirement Income Median 1.09 0.84 1.77 (1.17) 2.40 3.60 3.92 0.57 4.90 2.14
Retirement Income Number of Funds 192 192 183 162 148 81 162 162
Vanguard Target Retirment 2010 Trust II 0.08 0.08 0.00 3.12 2.22 0.14 4.47 5.48 4.97 02/29/08
Vanguard Target Retirement 2010 Compos. Lx 3.12 2.18 0.34 4.63 5.56
Target Date 2000-2010 Median 1.02 0.79 1.58 (1.22) 3.54 4.46 3.81 0.64 5.72 1.20
Target Date 2000-2010 Number of Funds 139 139 134 112 106 52 116 116
Vanguard Target Retirment 2015 Trust II 0.08 0.08 0.00 4.06 1.97 (0.50) 5.38 6.07 5.29 02/29/08
Vanguard Target Retirement 2015 Compos. Lx 4.06 1.90 (0.36) 5.52 6.14
Target Date 2011-2015 Median 1.07 0.84 1.63 (1.38) 3.75 4.65 4.51 0.63 6.31 1.32
Target Date 2011-2015 Number of Funds 183 183 170 142 124 17 142 142
Recent Returns
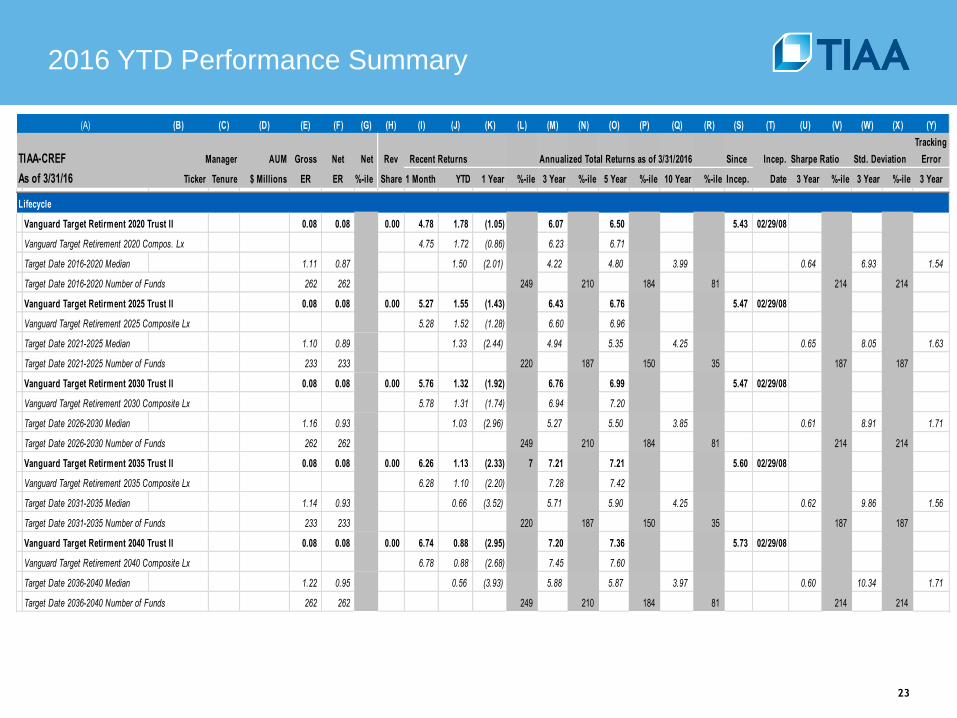
2016 YTD Performance Summary
23
(A) (B) (C) (D) (E) (F) (G) (H) (I) (J) (K) (L) (M) (N) (O) (P) (Q) (R) (S) (T) (U) (V) (W) (X) (Y)
TIAA-CREF Manager AUM Gross Net Net Rev Annualized Total Returns as of 3/31/2016 Since Incep. Sharpe Ratio Std. Deviation
Tracking
Error
As of 3/31/16 Ticker Tenure $ Millions ER ER %-ile Share 1 Month YTD 1 Year %-ile 3 Year %-ile 5 Year %-ile 10 Year %-ile Incep. Date 3 Year %-ile 3 Year %-ile 3 Year
Lifecycle
Vanguard Target Retirment 2020 Trust II 0.08 0.08 0.00 4.78 1.78 (1.05) 6.07 6.50 5.43 02/29/08
Vanguard Target Retirement 2020 Compos. Lx 4.75 1.72 (0.86) 6.23 6.71
Target Date 2016-2020 Median 1.11 0.87 1.50 (2.01) 4.22 4.80 3.99 0.64 6.93 1.54
Target Date 2016-2020 Number of Funds 262 262 249 210 184 81 214 214
Vanguard Target Retirment 2025 Trust II 0.08 0.08 0.00 5.27 1.55 (1.43) 6.43 6.76 5.47 02/29/08
Vanguard Target Retirement 2025 Composite Lx 5.28 1.52 (1.28) 6.60 6.96
Target Date 2021-2025 Median 1.10 0.89 1.33 (2.44) 4.94 5.35 4.25 0.65 8.05 1.63
Target Date 2021-2025 Number of Funds 233 233 220 187 150 35 187 187
Vanguard Target Retirment 2030 Trust II 0.08 0.08 0.00 5.76 1.32 (1.92) 6.76 6.99 5.47 02/29/08
Vanguard Target Retirement 2030 Composite Lx 5.78 1.31 (1.74) 6.94 7.20
Target Date 2026-2030 Median 1.16 0.93 1.03 (2.96) 5.27 5.50 3.85 0.61 8.91 1.71
Target Date 2026-2030 Number of Funds 262 262 249 210 184 81 214 214
Vanguard Target Retirment 2035 Trust II 0.08 0.08 0.00 6.26 1.13 (2.33) 7 7.21 7.21 5.60 02/29/08
Vanguard Target Retirement 2035 Composite Lx 6.28 1.10 (2.20) 7.28 7.42
Target Date 2031-2035 Median 1.14 0.93 0.66 (3.52) 5.71 5.90 4.25 0.62 9.86 1.56
Target Date 2031-2035 Number of Funds 233 233 220 187 150 35 187 187
Vanguard Target Retirment 2040 Trust II 0.08 0.08 0.00 6.74 0.88 (2.95) 7.20 7.36 5.73 02/29/08
Vanguard Target Retirement 2040 Composite Lx 6.78 0.88 (2.68) 7.45 7.60
Target Date 2036-2040 Median 1.22 0.95 0.56 (3.93) 5.88 5.87 3.97 0.60 10.34 1.71
Target Date 2036-2040 Number of Funds 262 262 249 210 184 81 214 214
Recent Returns

2016 YTD Performance Summary
24
(A) (B) (C) (D) (E) (F) (G) (H) (I) (J) (K) (L) (M) (N) (O) (P) (Q) (R) (S) (T) (U) (V) (W) (X) (Y)
TIAA-CREF Manager AUM Gross Net Net Rev Annualized Total Returns as of 3/31/2016 Since Incep. Sharpe Ratio Std. Deviation
Tracking
Error
As of 3/31/16 Ticker Tenure $ Millions ER ER %-ile Share 1 Month YTD 1 Year %-ile 3 Year %-ile 5 Year %-ile 10 Year %-ile Incep. Date 3 Year %-ile 3 Year %-ile 3 Year
Lifecycle
Vanguard Target Retirment 2045 Trust II 0.08 0.08 0.00 6.83 0.84 (2.99) 7.19 7.36 5.70 02/29/08
Vanguard Target Retirement 2045 Composite Lx 6.86 0.84 (2.71) 7.43 7.59
Target Date 2041-2045 Median 1.22 0.94 0.43 (3.92) 6.11 6.18 4.36 0.61 10.61 1.58
Target Date 2041-2045 Number of Funds 233 233 220 187 149 22 187 187
Vanguard Target Retirment 2050 Trust II 0.08 0.08 0.00 6.85 0.84 (3.05) 7.16 7.32 5.71 02/29/08
Vanguard Target Retirement 2050 Composite Lx 6.86 0.84 (2.71) 7.43 7.59
Target Date 2046-2050 Median 1.35 0.96 0.41 (4.10) 6.08 6.13 4.25 0.60 10.69 1.54
Target Date 2046-2050 Number of Funds 251 251 238 199 155 16 203 203
Vanguard Target Retirment 2055 Trust II 0.08 0.08 0.00 6.84 0.86 (3.13) 7.11 10.87 08/31/10
Vanguard Target Retirement 2055 Composite Lx 6.86 0.84 (2.71) 7.43
Vanguard Target Retirment 2060 Trust II 0.08 0.08 0.00 6.83 0.83 (3.13) 7.15 8.44 03/01/12
Vanguard Target Retirement 2060 Composite Lx 6.86 0.84 (2.71) 7.43
Target Date 2051+ Median 1.60 0.93 0.31 (3.89) 6.32 6.42 0.62 10.71 1.48
Target Date 2051+ Number of Funds 378 378 279 152 76 0 152 152
Recent Returns
-Tracking error calculated using "Morningstar Analyst Assigned Benchmark" Since Incep. = Since Inception Date Incep. Date = Inception Date
Source: Morningstar & TIAA-CREF
2016 YTD Performance Summary
25
Vanguard Index Information from available at http://www.vanguard.com
* = S&P MidCap 400 Index through May 16, 2003; the MSCI US Mid Cap 450 Index through January 30, 2013; and the CRSP US Mid Cap
Index thereafter
** = Russell 2000 Index through May 16, 2003; the MSCI US Small Cap 1750 Index through January 30, 2013; and the CRSP US Small Cap Index
thereafter
*** = Spliced Emerging Markets Index reflects performance of the Select Emerging Markets Index through August 23, 2006; the MSCI Emerging Markets Index through January 9, 2013; FTSE Emerging
Transition Index through June 27, 2013; FTSE Emerging Index; As of November 2, 2105 FTSE Emerging Markets ALL Cap China A Transition Index thereafter.
**** = The TIAA Stable Value Inception Date represents the date that the plan's TIAA Stable Value record was initiated on TIAA-CREF's recordkeeping system which may be earlier than
the date of first deposit to the contract.
"Since Inception" performance is calculated from this date.
***** = For definitions please visit www.tiaa-cref.org/public/assetmanagement
Note: Rankings shown for returns are calculated by Morningstar. Rankings for expense ratio, Sharpe ratio and standard deviation are
calculated by TIAA-CREF and may differ based on calculation methods
Fee Disclosures: 1 The net expense ratio reflects total annual fund operating expenses excluding interest expense. If
interest expense was included, returns would have been lower.
2 Accumulations in mutual funds not managed by TIAA-CREF may be subject to administrative charges. These charges are subject to change. Please review
current documents related to your plan.
Disclosures
26
%-ile --> Percentile Ranking in Morningstar Category.
The performance data quoted represents past performance and is no guarantee of future results. Your returns and the principal
value of your investments will fluctuate so that your shares or accumulation units, when redeemed, may be worth more or less
than their original cost. Current performance may be lower or higher than the performance quoted below. For performance
current to the most recent month‐end, visit the TIAA‐ CREF Website at www.tiaa‐cref.org, or call 877 518‐9161.
Annuity account options are available through annuity contracts issued by TIAA or CREF. These contracts are designed for retirement or
other long‐ term goals, and offer a variety of income options, including lifetime income. Payments from the variable annuity accounts are not
guaranteed and will rise or fall based on investment performance.
For the variable annuity accounts, we estimate expenses for the plan year based on projected expense and asset levels. Differences
between estimated and actual expenses are adjusted quarterly and reflected in current investment results. Historically, the adjusting
payments have resulted in both upward and downward adjustments.
Investing in non‐investment grade securities presents special risks, including significantly higher interest‐rate and credit risk.
Small‐cap and mid‐cap stocks may have limited marketability and may be subject to more abrupt or erratic market movements than
large‐cap stocks.
The risks associated with foreign investments are often magnified in emerging markets where there is greater potential for political,
currency, and economic volatility.
Funds that invest in fixed‐income securities are not guaranteed and are subject to interest‐rate, inflation and credit risks.

Disclosures
27
Funds that invest in foreign securities are subject to special risks, including currency fluctuation and political and economic instability.
Real estate securities are subject to various risks, including fluctuations in property values, higher expenses or lower income than
expected, and potential environmental problems and liability.
Any guarantees under annuities issued by TIAA are subject to TIAA's claims-paying ability. TIAA Stable Value is guaranteed insurance
contract and not an investment for Federal Securities Law purposes.
Target Date Funds share the risks associated with the types of securities held by each of the underlying funds in which they invest. In
addition to the fees and expenses associated with the Target Date Funds, there is exposure to the fees and expenses associated with the
underlying mutual funds as well.
TIAA-CREF Individual & Institutional Services, LLC, Teachers Personal Investors Services, Inc., and Nuveen Securities, LLC, Members
FINRA and SIPC, distribute securities products. Annuity contracts and certificates are issued by Teachers Insurance and Annuity
Association of America (TIAA) and College Retirement Equities Fund (CREF), New York, NY. Each is solely responsible for its own
financial condition and contractual obligations.
Investment, insurance and annuity products are not FDIC insured, are not bank guaranteed, are not deposits, are not
insured by any federal government agency, are not a condition to any banking service or activity, and may lose value.
You should consider the investment objectives, risks, charges and expenses carefully before investing. Please call 877 518-
9161 or log on to tiaacref.org for product and fund prospectuses that contains this and other information. Please read the
prospectuses carefully before investing.
Disclosures
28
Morningstar is an independent service that rates mutual funds and variable annuities, based on risk‐adjusted returns. Although
Morningstar data is gathered from reliable sources, neither Morningstar nor TIAA‐CREF can guarantee its completeness and accuracy.
Morningstar does not rate money market accounts, and the other TIAA‐CREF mutual fund accounts are too new to be rated. Past
performance does not guarantee future results.
Accumulation net asset values and returns will vary.
For each fund/account with at least a three‐year history, Morningstar calculates a Morningstar Rating™ based on a Morningstar
Risk‐Adjusted Return measure that accounts for variation in a fund's/account's monthly performance (including the effects of sales charges,
loads, and redemption fees), placing more emphasis on downward variations and rewarding consistent performance. Where applicable,
Morningstar's performance rankings are based on linked performance that considers the differences in expense ratios, while actual
performance data shown does not reflect such differences. The top 10 percent of funds/accounts in a category receive five stars, the next
22.5 percent receive four stars, and the next 35 percent receive three stars, the next 22.5 percent receive two stars and the bottom 10
percent receive one star. (Each share class is counted as a fraction of one fund/account within this scale and rated separately, which may
cause slight variations in the distribution percentages.) Morningstar proprietary ratings on U.S.‐domiciled funds/accounts reflect historical
risk‐adjusted performance, are subject to change every month. They are derived from a weighted average of the performance figures
associated with its three‐, five‐ and ten‐year (if applicable) Morningstar Rating metrics. Please note, Morningstar now rates group variable
annuities within the open‐end mutual fund universe.
Disclosures
29
Prospectus Gross Expense Ratio
The percentage of fund assets used to pay for operating expenses and management fees, including 12b‐1 fees, administrative
fees, and all other asset‐based costs incurred by the fund, except brokerage costs. Fund expenses are reflected in the fund's NAV. Sales
charges are not included in the expense ratio.
‐‐The expense ratio for fund of funds is the aggregate expense ratio as defined as the sum of the wrap or sponsor fees plus the
estimated weighted average of the underlying fund fees.
‐‐Often referred to as the Annual Operating Expense, the Prospectus Gross Expense Ratio is collected annually from a fund's prospectus.
Prospectus Net Expense Ratio
The percentage of fund assets, net of reimbursements, used to pay for operating expenses and management fees, including 12b‐1 fees,
administrative fees, and all other asset‐based costs incurred by the fund, except brokerage costs. Fund expenses are reflected in the fund's
NAV. Sales charges are not included in the expense ratio.
‐‐The expense ratio for fund of funds is the aggregate expense ratio as defined as the sum of the wrap or sponsor fees plus the
estimated weighted average of the underlying fund fees.
‐‐Net reimbursements, the Prospectus Net Expense Ratio is collected annually from a fund's prospectus.
‐‐TIAA‐CREF, unless noted, does not charge additional fees for record keeping a fund. 12b‐1, revenue share and admin fees are all
included in the Prospectus fees.
‐‐ Prospectus Net Expense Ratio % ‐ ile rank is the percentile rank for the fund. The better the expense ratio (lower) the lower the ranking
out of 100.
Sharpe Ratio (Source: Morningstar Direct)
A risk‐adjusted measure developed by Nobel Laureate William Sharpe. It is calculated by using standard deviation and excess return to
determine reward per unit of risk. The higher the Sharpe Ratio, the better the portfolio’s historical risk‐adjusted performance. The Sharpe
Ratio can be used to compare two portfolios directly with regard to how much excess return each portfolio achieved for a certain level of risk.
Morningstar first calculates a monthly Sharpe Ratio and then annualizes it to put the number in a more useful one‐year context.

Disclosures
30
Standard Deviation (Source: Morningstar Direct) The statistical measurement of dispersion about an average, which depicts how widely a
stock or portfolio's returns varied over a certain period of time. Investors use the standard deviation of historical performance to try to predict
the range of returns that is most likely for a given investment. When a stock or portfolio has a high standard deviation, the predicted range of
performance is wide, implying greater volatility.
Information Ratio (Source: Morningstar Direct) Benchmark Specific
Information ratio is a risk‐adjusted performance measure. The information ratio is a special version of the Sharpe Ratio in that the
benchmark doesn't have to be the risk‐free rate.
Tracking Error (Source: Morningstar Direct) Benchmark Specific
Tracking error is a measure of the volatility of excess returns relative to a benchmark.
You cannot invest directly in index.
TIAA‐CREF reported performance may differ from Morningstar source returns for the
same option over the same time period. We would expect an occasional one to two basis point difference. Morningstar Direct calculates
returns by one share owned by a hypothetical investor over the requested time period. So the return for one year is calculated using the
same formula as one month. TIAA‐CREF calculates returns by $1,000 owned by hypothetical investor for one month then links returns for
requested time period. Both set of returns include dividends and capital gains.
C27570


