i RETSCREEN DECISION SUPPORT SYSTEM FOR PREFEASIBILITY ANALYSIS OF SMALL HYDROPOWER PROJECTS A THESIS SUBMITTED TO THE GRADUATE SCHOOL OF NATURAL AND APPLIED SCIENCES OF MIDDLE EAST TECHNICAL UNIVERSITY BY MEHMET KÜÇÜKBEYCAN IN PARTIAL FULFILLMENT OF THE REQUIREMENTS FOR THE DEGREE OF MASTER OF SCIENCE IN CIVIL ENGINEERING FEBRUARY 2008
Transcript
i
RETSCREEN DECISION SUPPORT SYSTEM FOR PREFEASIBILITY
ANALYSIS OF SMALL HYDROPOWER PROJECTS
A THESIS SUBMITTED TO
THE GRADUATE SCHOOL OF NATURAL AND APPLIED SCIENCES
OF
MIDDLE EAST TECHNICAL UNIVERSITY
BY
MEHMET KÜÇÜKBEYCAN
IN PARTIAL FULFILLMENT OF THE REQUIREMENTS
FOR
THE DEGREE OF MASTER OF SCIENCE
IN
CIVIL ENGINEERING
FEBRUARY 2008
i
Approval of the thesis:
“RETSCREEN DECISION SUPPORT SYSTEM FOR PREFEASIBILITY ANALYSIS OF SMALL HYDROPOWER PROJECTS”
submitted by MEHMET KÜÇÜKBEYCAN in partial fulfillment of the requirements for the degree of Masters of Science in Civil Engineering Department, Middle East Technical University by, Prof Dr. Canan ÖZGEN _________________ Dean, Graduate School of Natural and Applied Sciences Prof Dr. Güney Özcebe _________________ Head of Department, Civil Engineering Prof. Dr. H. Doğan Altınbilek _________________ Supervisor, Civil Engineering Dept., METU Assist. Prof. Dr. Şahnaz Tiğrek _________________ Co-supervisor, Civil Engineering Dept., METU Examining Committee Prof. Dr. Melih Yanmaz _________________ Civil Engineering Dept., METU Prof. Dr. H. Doğan Altınbilek _________________ Civil Engineering Dept., METU Assist. Prof. Dr. Şahnaz Tiğrek _________________ Civil Engineering Dept., METU Assoc. Prof. Dr. Nuri Merzi _________________ Civil Engineering Dept., METU Dr. Hande Akçakoca _________________ GAP Administration
Date: 05.02.2008
iii
PLAGIARISM
I hereby declare that all information in this document has been obtained and presented in accordance with academic rules and ethical conduct. I also declare that, as required by these rules and conduct, I have fully cited and referenced all material and results that are not original to this work. Name, Last name : Mehmet Küçükbeycan
Signature :
iv
ABSTRACT
A RETSCREEN DECISION SUPPORT SYSTEM FOR PREFEASIBILITY ANALYSIS OF SMALL HYDROPOWER PROJECTS
Küçükbeycan, Mehmet MS., Department of Civil Engineering
Supervisor : Prof. Dr. H. Doğan Altınbilek Co-supervisor : Assist. Prof. Dr. Şahnaz Tiğrek
February 2008, 123 pages
Renewable energy sources are getting much more important to reduce the
increasing threat coming from greenhouse gases. Hydropower is the most
important source of renewable energy. However, development of a
hydropower project is a challenging engineering process. Several
computer programs have been developed to make initial estimations on
hydropower schemes. A computer program named RETScreen Small
Hydro Project Model has been developed with the objective to make
complete pre-feasibility studies including costing and financial analysis.
Two case studies, which have been under construction in Turkey, will be
used to check the accuracy of software in Turkish practice. Then in light of
the results, RETScreen software will be used to make a pre-feasibility
report on an existing multipurpose dam in Turkey. Electricity can be
generated at existing dams which requires minor civil works. Porsuk Dam
which is a 36 year old dam used for domestic, industrial and irrigation
water supply will be evaluated for energy generation by constructing a
penstock, powerhouse and installing electromechanical equipment.
Keywords: Small Hydropower, Feasibility, RETScreen, Multipurpose Dams
v
ÖZ
KÜÇÜK HİDROELEKTRİK PROJELERİN ÖN YAPILABİLİRLİK ANALİZİ İÇİN RETSCREEN KARAR DESTEK SİSTEMİ
Küçükbeycan, Mehmet Yüksek Lisans, İnşaat Mühendisliği Bölümü Tez Yöneticisi : Prof. Dr. H. Doğan Altınbilek
Ortak Tez Yöneticisi: Yard. Doç. Dr. Şahnaz Tiğrek
Şubat 2008, 123 sayfa
Sera gazlarının artan tehditlerini azaltmak için yenilenebilir enerji
kaynakları daha önemli hale gelmektedir. Hidroelektrik enerji yenilebilir
enerji kaynaklarının en önemlisidir. Lakin hidroelektrik projelerinin
geliştirilmesi zorlayıcı bir mühendislik sürecidir. Hidroelektrik projelerinin ilk
hesaplarının yapılması için çeşitli bilgisayar programları geliştirilmiştir.
RETScreen Small Hydro Project Model adındaki bir bilgisayar programı
maliyet ve finansal analizini de içeren ön yapılabilirlik raporu hazırlamak
amacıyla geliştirilmiştir. Türkiye’de inşaatı devam etmekte olan iki vaka
çalışması yazılımın Türk uygulamalarındaki hassasiyetini ölçmekte
kullanılacaktır. Daha sonra sonuçlar ışığında, RETScreen yazılımı
Türkiye’de mevcut çok amaçlı bir barajın ön yapılabilirlik raporunun
hazırlanmasında kullanılacaktır. Mevcut barajlarda, daha küçük inşaat işleri
gerektirerek, elektrik üretilebilir. Porsuk Barajı – 36 yaşında evsel,
endüstriyel ve sulama suyu sağlamakta kullanılan bir baraj – bir cebri boru,
santral binası inşa edilerek ve elektromekanik ekipmanlar monte edilerek
elektrik üretimi için değerlendirilecektir.
Anahtar Kelimeler: Küçük Hidroelektrik Enerji, Fizibilite, RETScreen, Çok Amaçlı Barajlar
vi
DEDICATION
To My Parents
vii
ACKNOWLEDGMENTS
The author wishes to express his deepest gratitude to his supervisor Prof.
Dr. Doğan Altınbilek for his guidance, advice and criticism throughout the
study.
The author wishes to express his sincere gratefulness to his co-supervisor
Assist. Prof. Dr. Şahnaz Tiğrek for her encouragements, guidance and
comments during this study.
The author wishes to express his special gratitude to Mr. Doğan
Pekçağlıyan for opening Hydropower Engineering course and instructing
him about hydropower development process.
Special thanks go to my colleagues at the office for their guidance and help
during this study.
Special thanks also go to Research Assistant Sevi İnce for her
encouragement, patience and sincerity during this study.
Finally, the author wishes to express his special thanks to his parents for
their endless love and care all through his life.
viiiviii
TABLE OF CONTENTS
ABSTRACT ............................................................................................... iv
ÖZ .............................................................................................................. v
DEDICATION ............................................................................................ vi
ACKNOWLEDGMENTS........................................................................... vii
TABLE OF CONTENTS ...........................................................................viii
LIST OF TABLES..................................................................................... xii
LIST OF FIGURES.................................................................................. xiv
LIST OF ABBREVIATIONS.....................................................................xvii
A. RESULTS OF RETSCREEN SOFTWARE FOR PROJECT 1 ..........92
B. RESULTS OF RETSCREEN SOFTWARE FOR PROJECT 2 ..........98
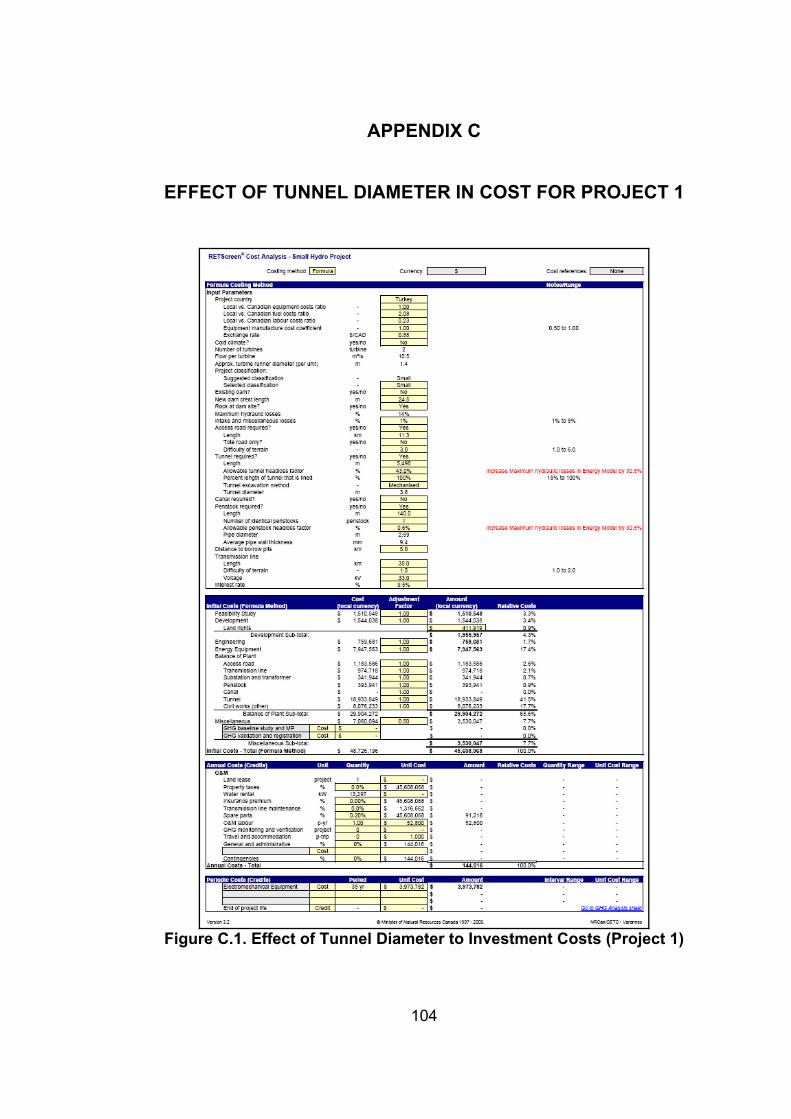
C. EFFECT OF TUNNEL DIAMETER IN COST FOR PROJECT 1.....104
D. EFFECT OF TUNNEL DIAMETER IN COST FOR PROJECT 2.....105
E. RESULTS OF RETSCREEN SOFTWARE FOR PORSUK DAM (Qd = Q20)...................................................................................................106
F. RESULTS OF RETSCREEN SOFTWARE FOR PORSUK DAM (Qd = Q25)...................................................................................................112
G. RESULTS OF RETSCREEN SOFTWARE FOR PORSUK DAM (Qd = Q30)...................................................................................................118
xii
LIST OF TABLES
TABLES
Table 2.1. Upper Limit of Installed Capacity for Small Hydro ......................8
Table 2.2. Classification of Small Hydro According to Head .......................9
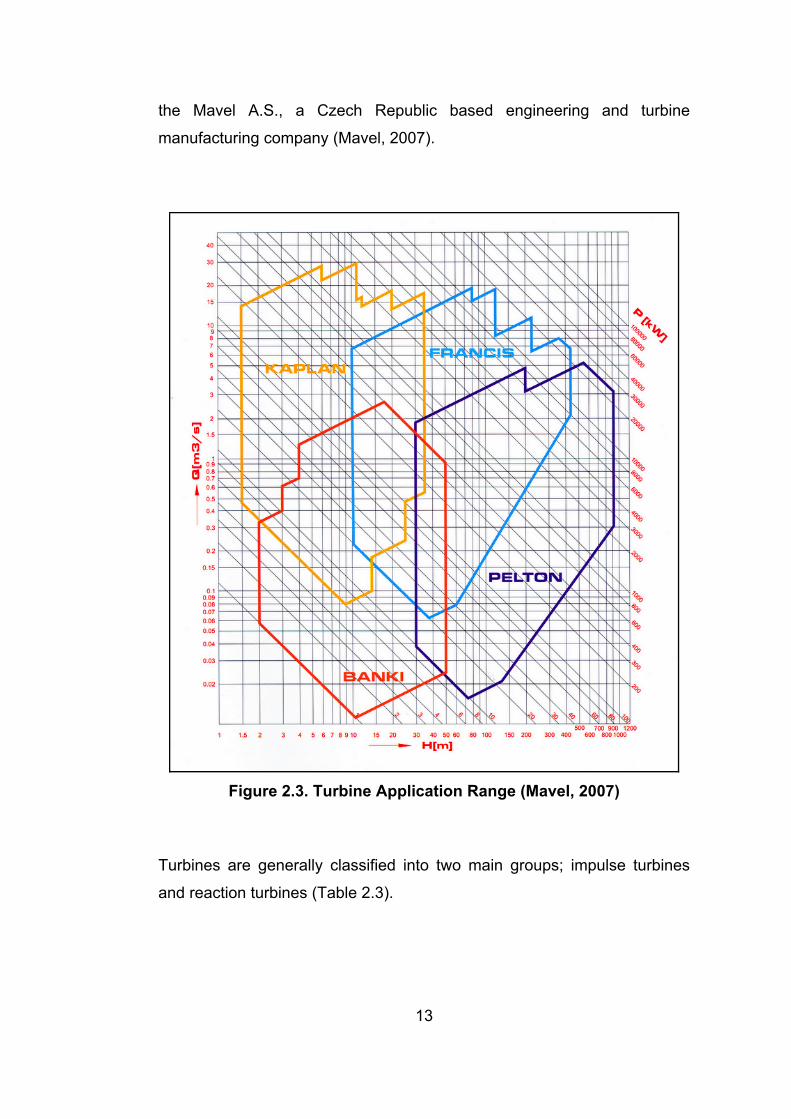
Table 2.3. Impulse and Reaction Turbines according to Head..................14
Table 2.4. Attachment-3A (Headlines in the Feasibility Report requested for DSİ/EİE Projects) ......................................................................................18
Table 2.5. Hydropower Potential of Some of the Selected Basins in Turkey ..................................................................................................................26
Table 3.1. Installed Energy Capacity and Annual Electric Generation of Turkey .......................................................................................................29
Table 3.2. Yearly Electric Energy Gross Production – Import – Export – Gross Consumption of Turkey...................................................................31
Table 3.3. Increase in the Demand for Electric Energy up to Year 2030...32
Table 3.4. Privatization of Electricity Market in Turkey – Acts and Regulations ...............................................................................................35
Table 3.5. Hydropower Schemes at the Planning Stage ...........................38
Table 4.1. Evaluation of Assessment methodologies and Software.........42
Table 5.1. Main Characteristics of Project 1..............................................47
Table 5.2. Ratios between Turkish and Canadian Costs...........................50
Table 5.3. Data Required by RETScreen Software (Project 1) .................53
Table 5.4. Main Characteristics of Project 2..............................................57
Table 5.5. Data Required by RETScreen Software (Project 2) .................59
Table 5.6. Comparison of Costs for Project 1............................................63
Table 5.7. Comparison of Results for Project 2.........................................64
xiii
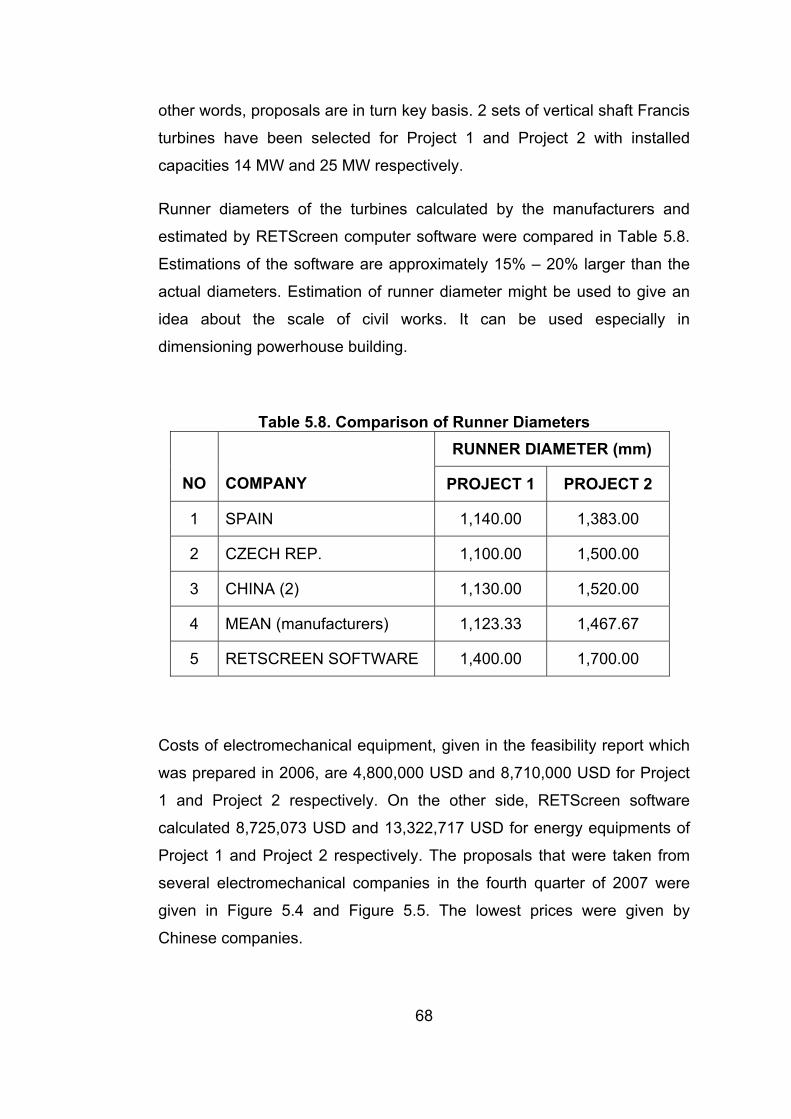
Table 5.8. Comparison of Runner Diameters ............................................68
Table 6.1. Annual Flow (m3/s) Released From Porsuk Dam Between 1972 and 2003 ...................................................................................................73
Table 6.2. Head loss (m) in Penstock for Different Diameters and Flows .75
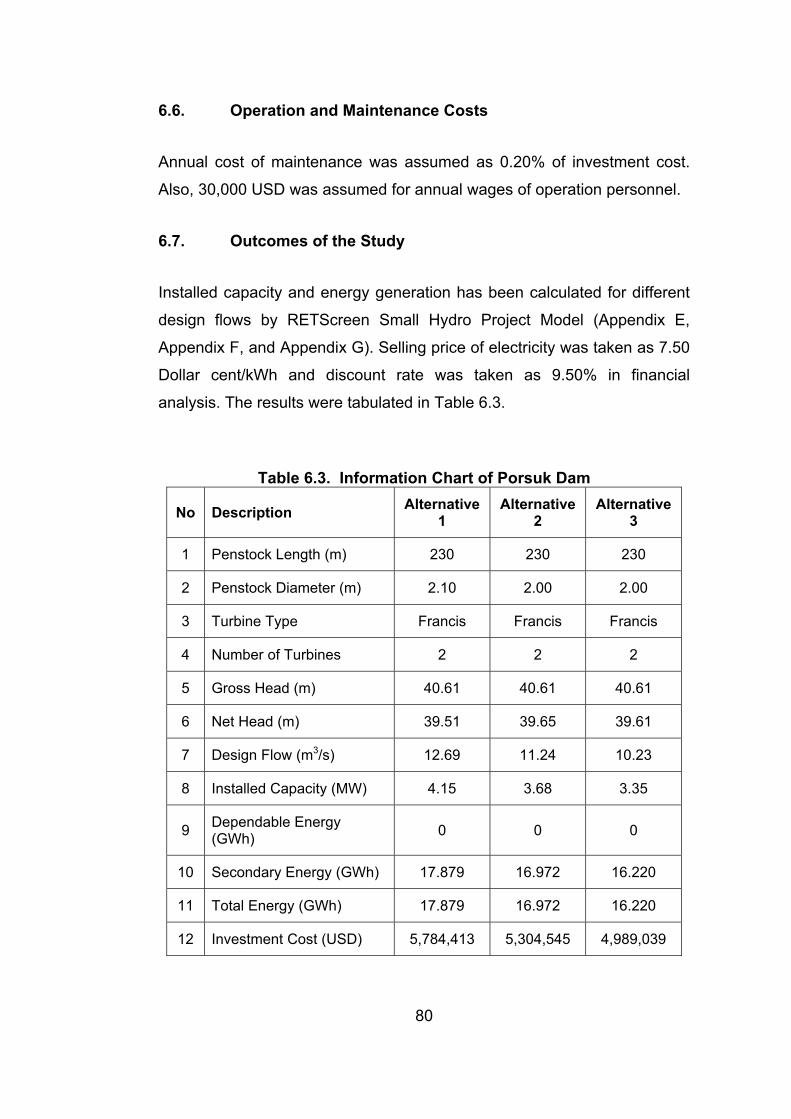
Table 6.3. Information Chart of Porsuk Dam ............................................80
Table 6.4. Annual Benefits of Porsuk Dam According to DSİ Criteria .......82
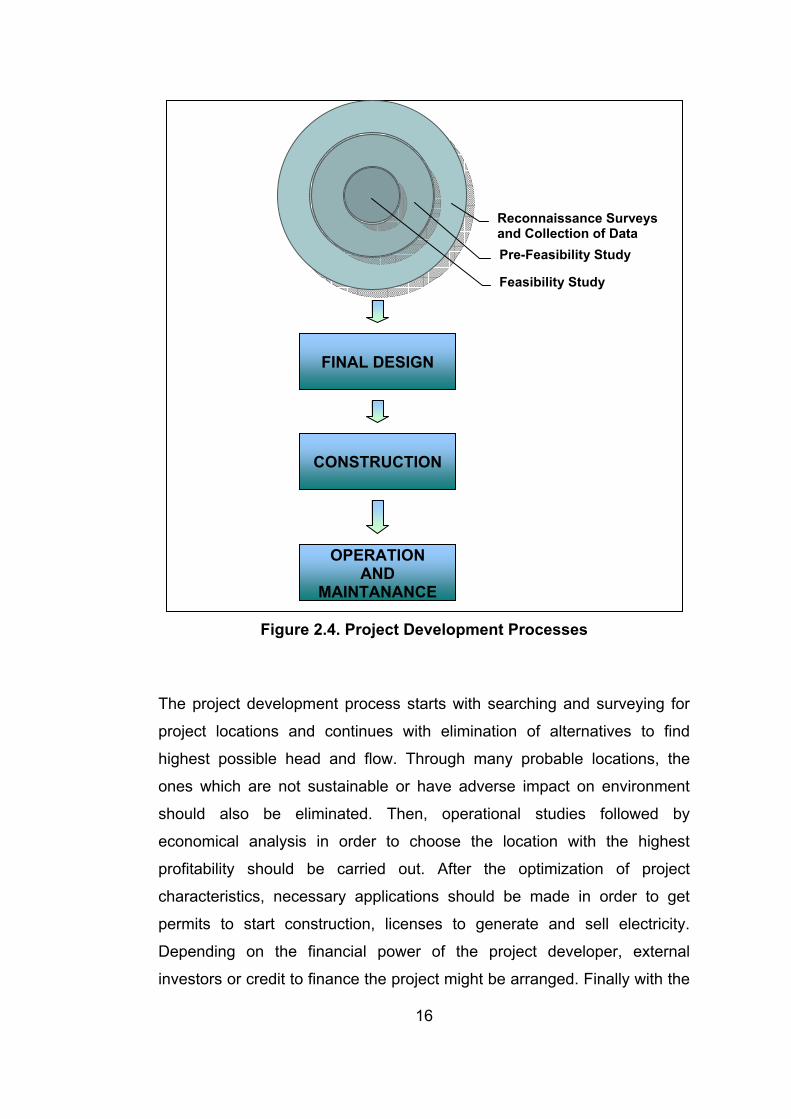
Figure 2.4. Project Development Processes .............................................16
Figure 2.5. Hydropower Potential in the World..........................................24
Figure 2.6. Hydroelectric Potential of Turkey ............................................27
Figure 2.7. Remaining Small Hydropower Potential in Turkey and EU Countries (2004) .......................................................................................28
Figure 3.1. Imports and Exports of Electricity in European Countries in 2005 ..........................................................................................................31
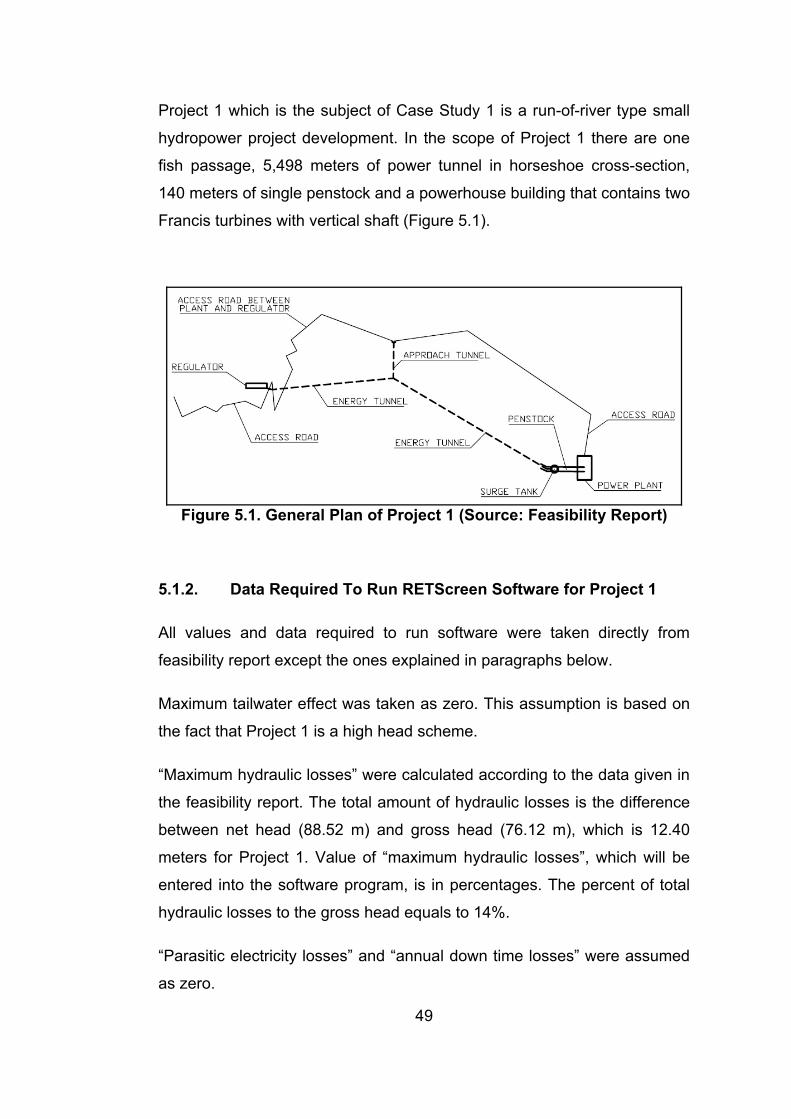
Figure 5.1. General Plan of Project 1 ........................................................69
Figure 5.2. General Plan of Project 2 ........................................................58
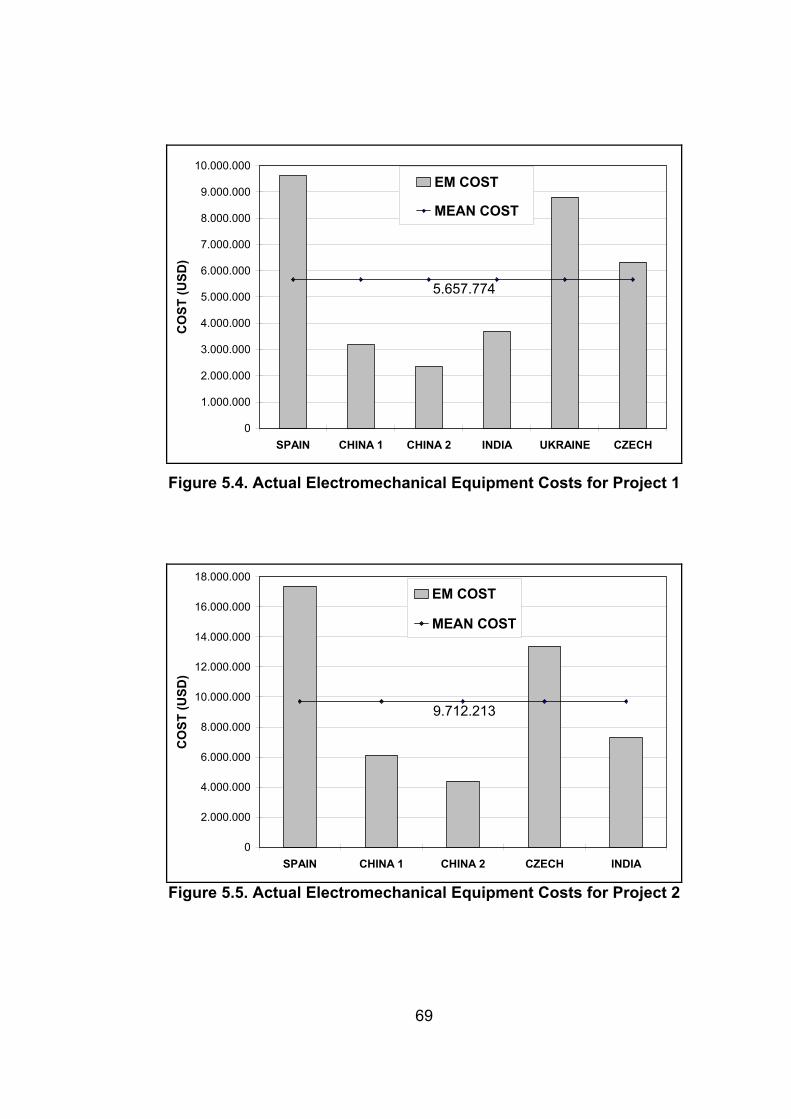
Figure 5.4. Actual Electromechanical Equipment Costs for Project 1 .......69
Figure 5.5. Actual Electromechanical Equipment Costs for Project 2 .......69
Figure 6.1. View from Porsuk Dam ...........................................................72
Figure 6.2. Flow Duration Curve of Porsuk Dam.......................................74
Figure 6.3. Optimization of Penstock Diameters .......................................76
Figure 6.4. Alternative with 3 Francis Turbines..........................................78
Figure 6.5. Alternative with 2 Francis Turbines..........................................79
Figure A.1. “Energy Model” Worksheet of Project 1 ..................................92
xv
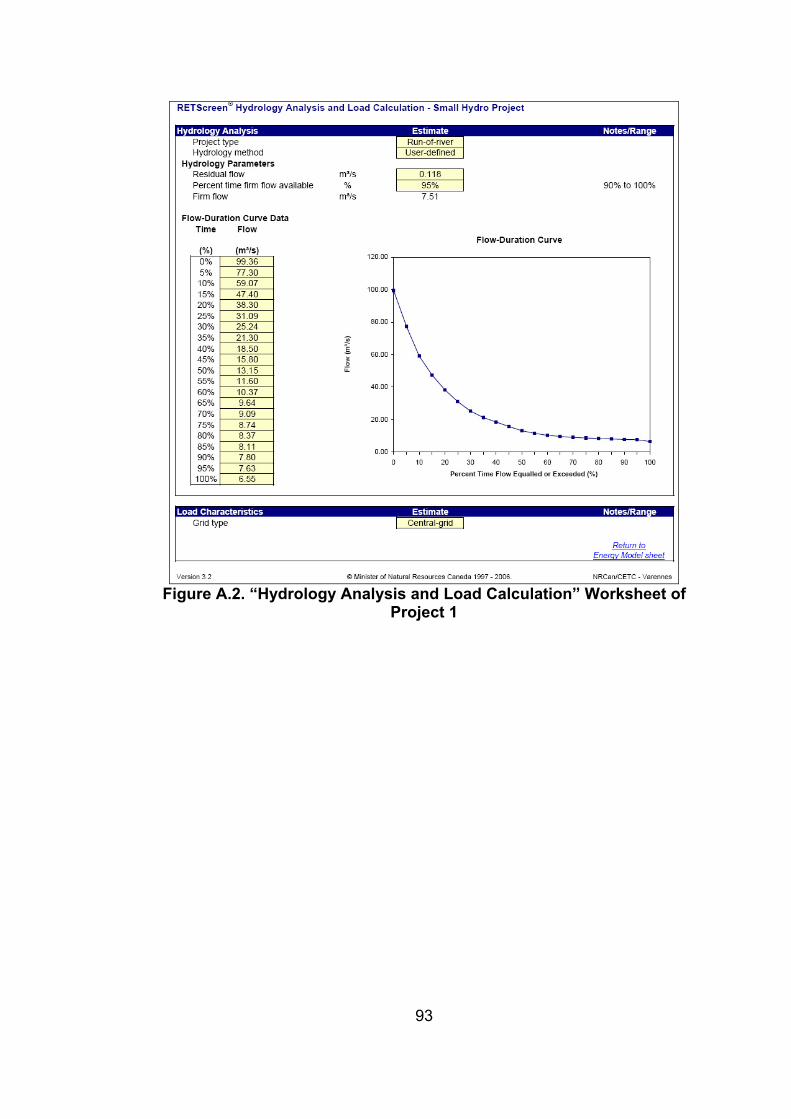
Figure A.2. “Hydrology Analysis and Load Calculation” Worksheet of Project 1 ....................................................................................................93
Figure A.3. “Equipment Data” Worksheet of Project 1...............................94
Figure A.4. “Cost Analysis” Worksheet of Project 1...................................95
Figure A.5. Data Sheet of “Financial Summary” (Project 1) .....................96
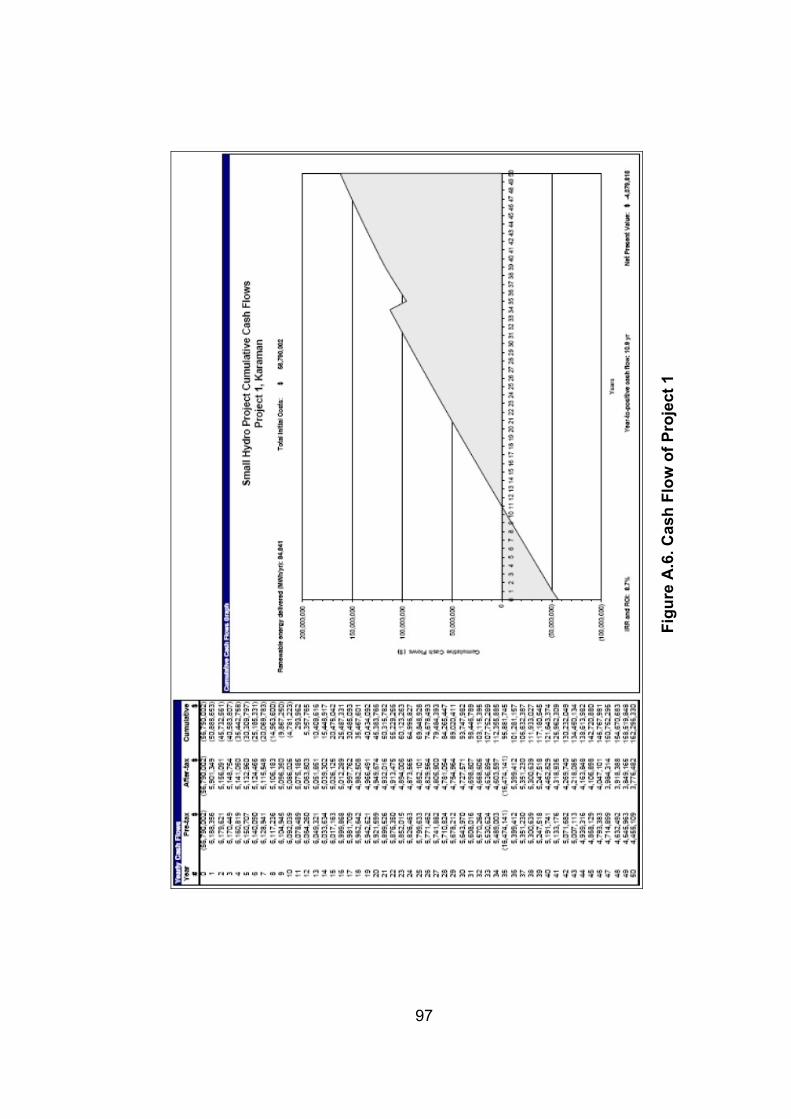
Figure A.6. Cash Flow of Project 1............................................................97
Figure B.1. “Energy Model” Worksheet of Project 2 ..................................98
Figure B.2. “Hydrology Analysis and Load Calculation” Worksheet of Project 2 ....................................................................................................99
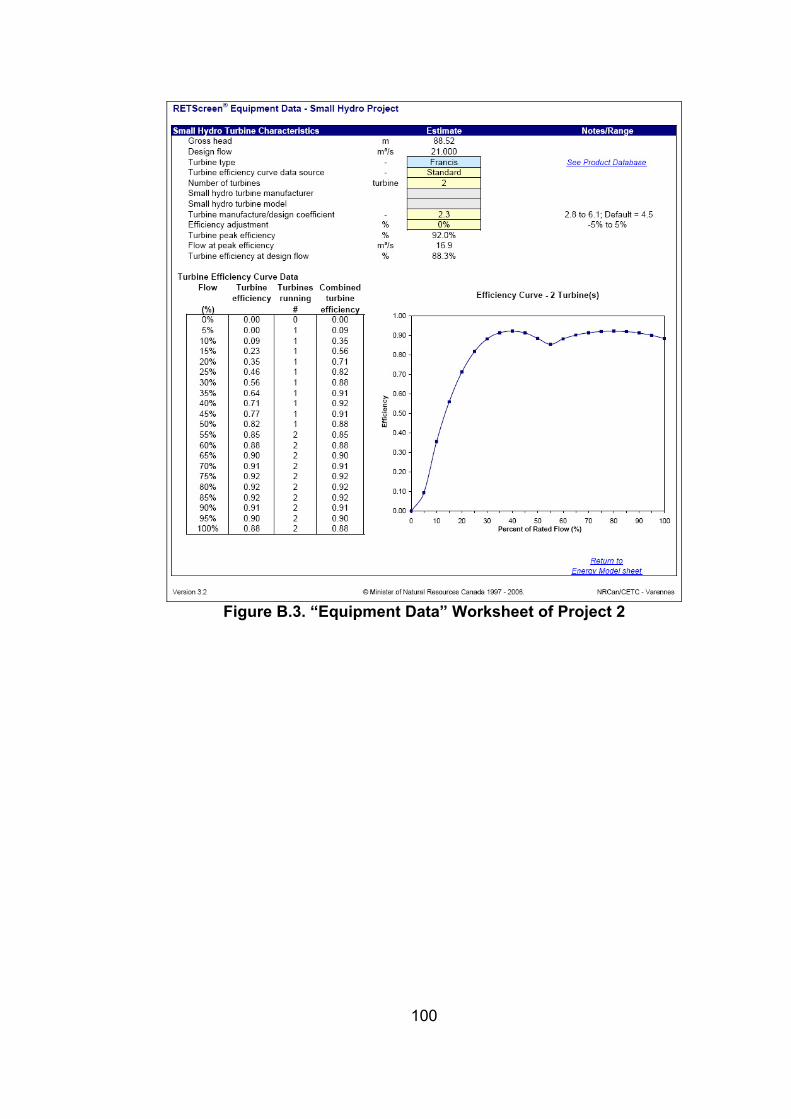
Figure B.3. “Equipment Data” Worksheet of Project 2.............................100
Figure B.4. “Cost Analysis” Worksheet of Project 2................................101
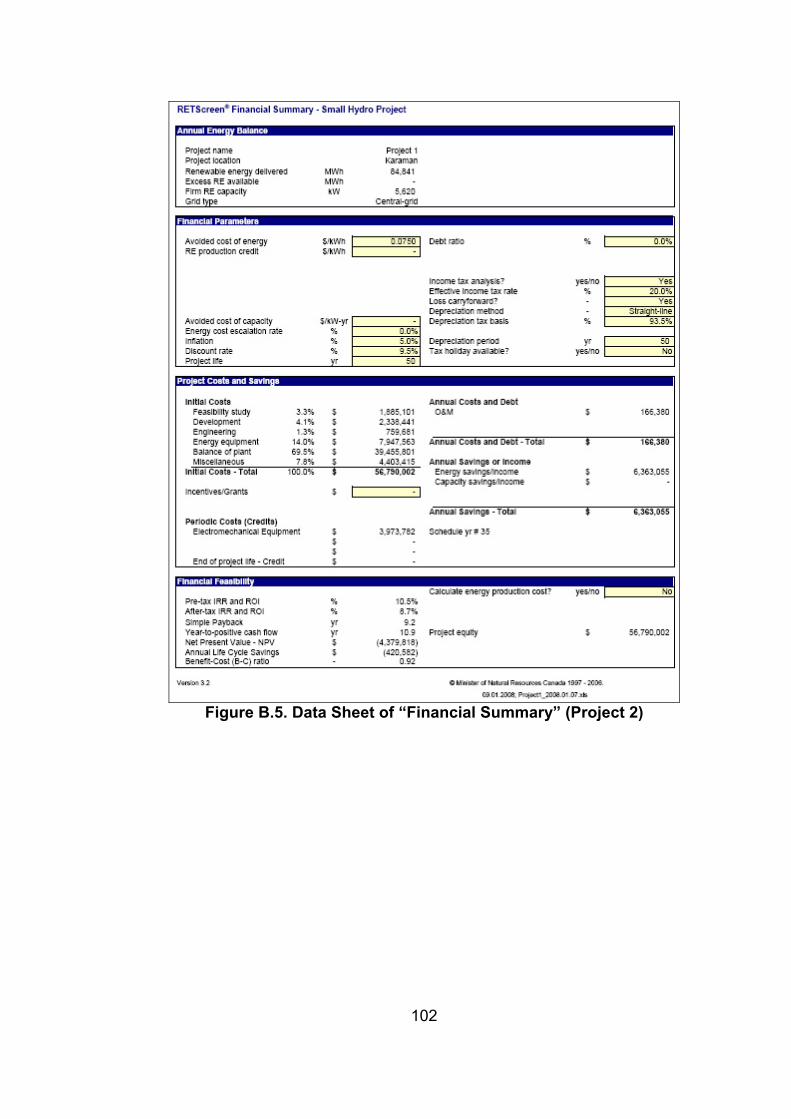
Figure B.5. Data Sheet of “Financial Summary” (Project 2) ....................102
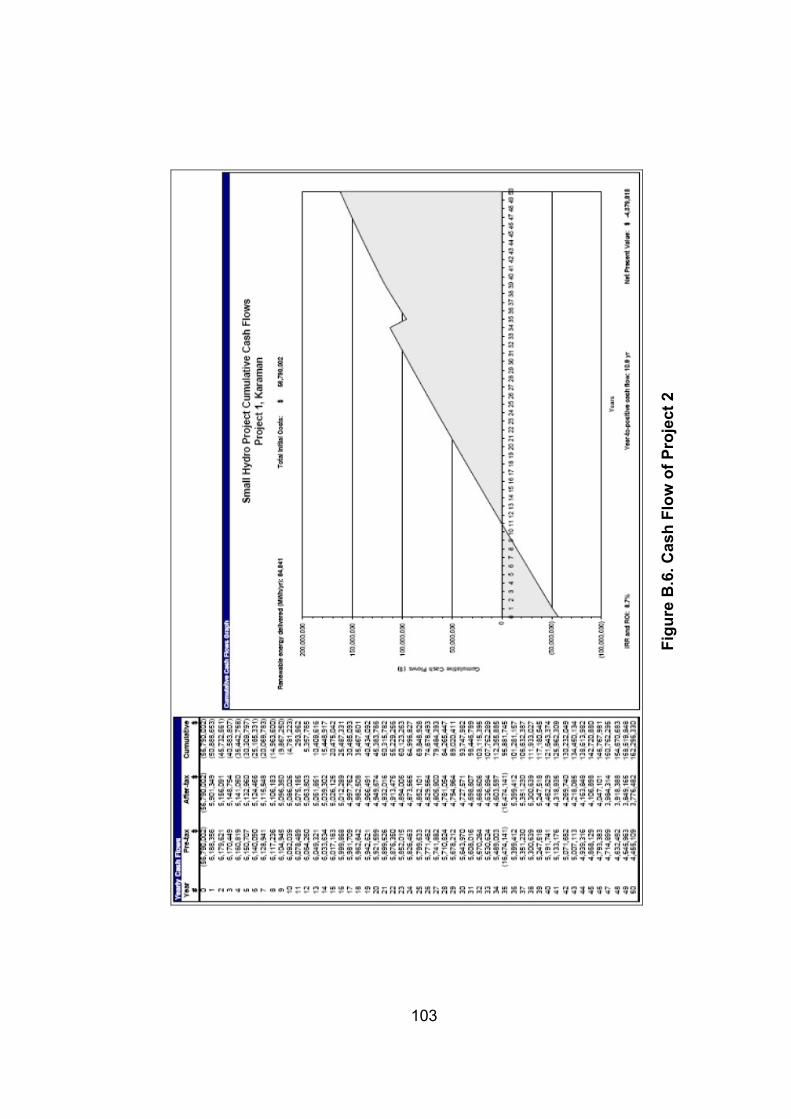
Figure B.6. Cash Flow of Project 2...........................................................103
Figure C.1. Effect of Tunnel Diameter to Investment Costs (Project 1) ...104
Figure D.1. Effect of Tunnel Diameter to Investment Costs (Project 2) ..105
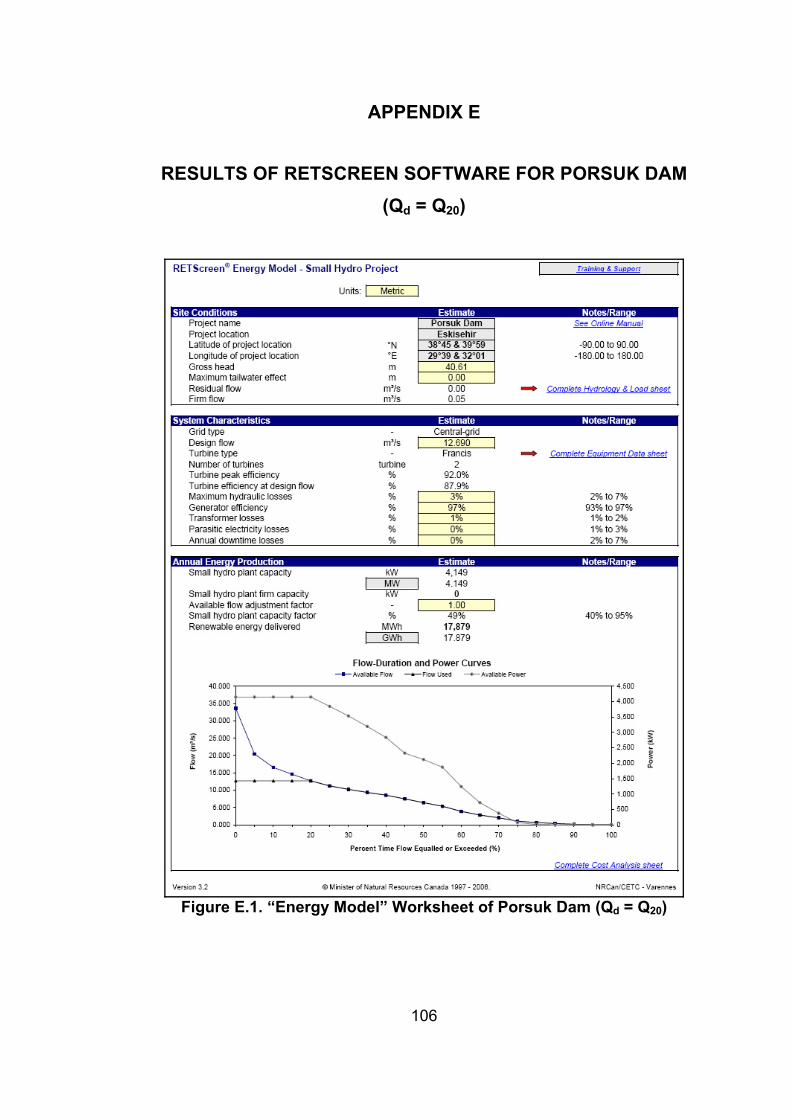
Figure E.1. “Energy Model” Worksheet of Porsuk Dam (Qd = Q20)..........106
Figure E.2. “Hydrology Analysis and Load Calculation” Worksheet of Porsuk Dam (Qd = Q20) ...........................................................................107
Figure E.3. “Equipment Data” Worksheet of Porsuk Dam (Qd = Q20) ......108
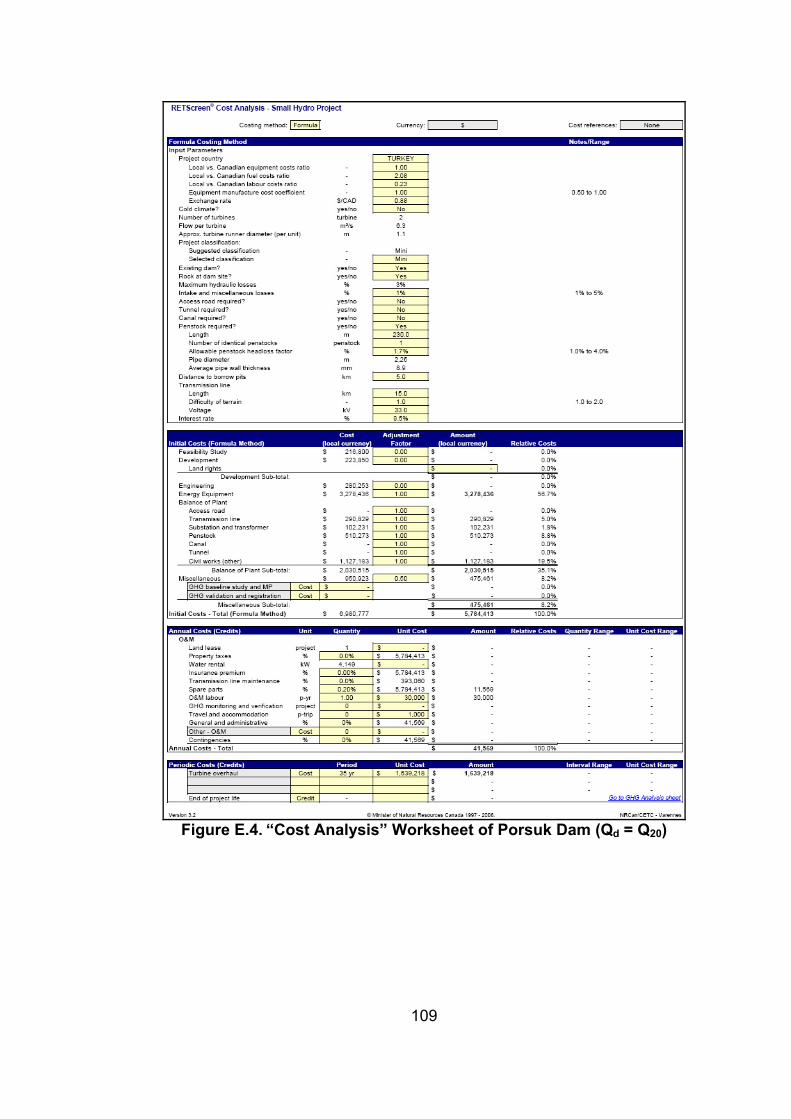
Figure E.4. “Cost Analysis” Worksheet of Porsuk Dam (Qd = Q20) ..........109
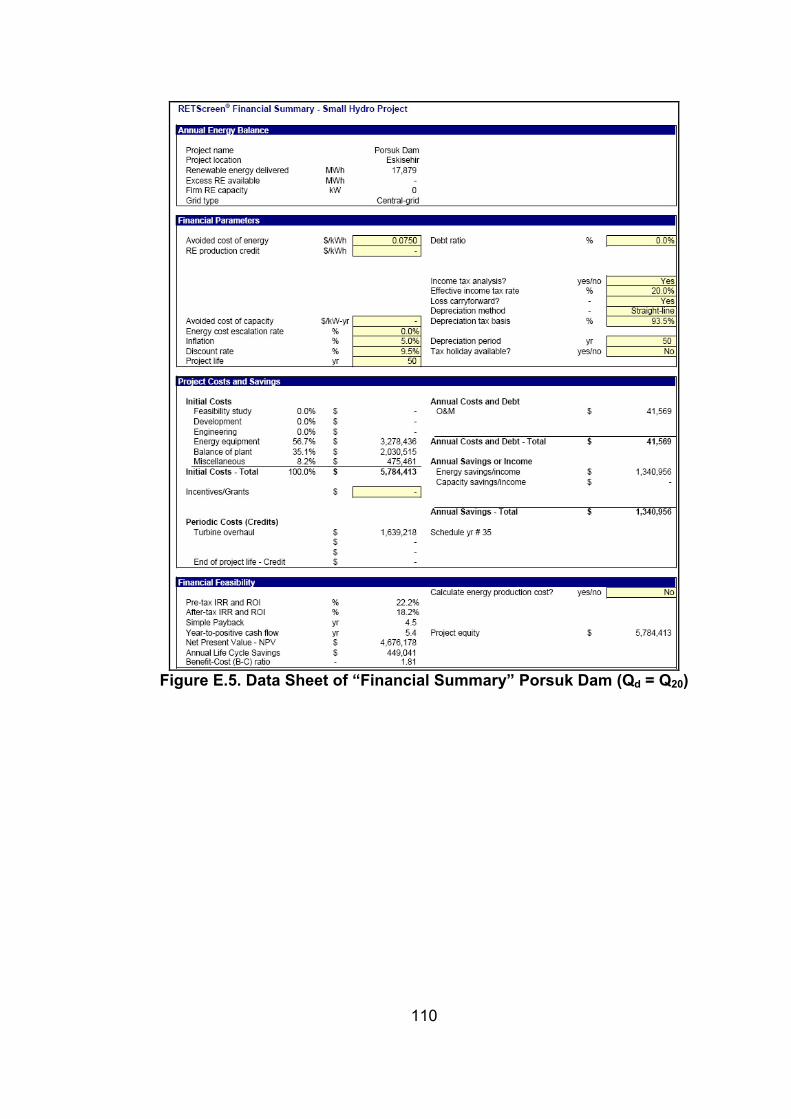
Figure E.5. Data Sheet of “Financial Summary” Porsuk Dam (Qd = Q20) 110
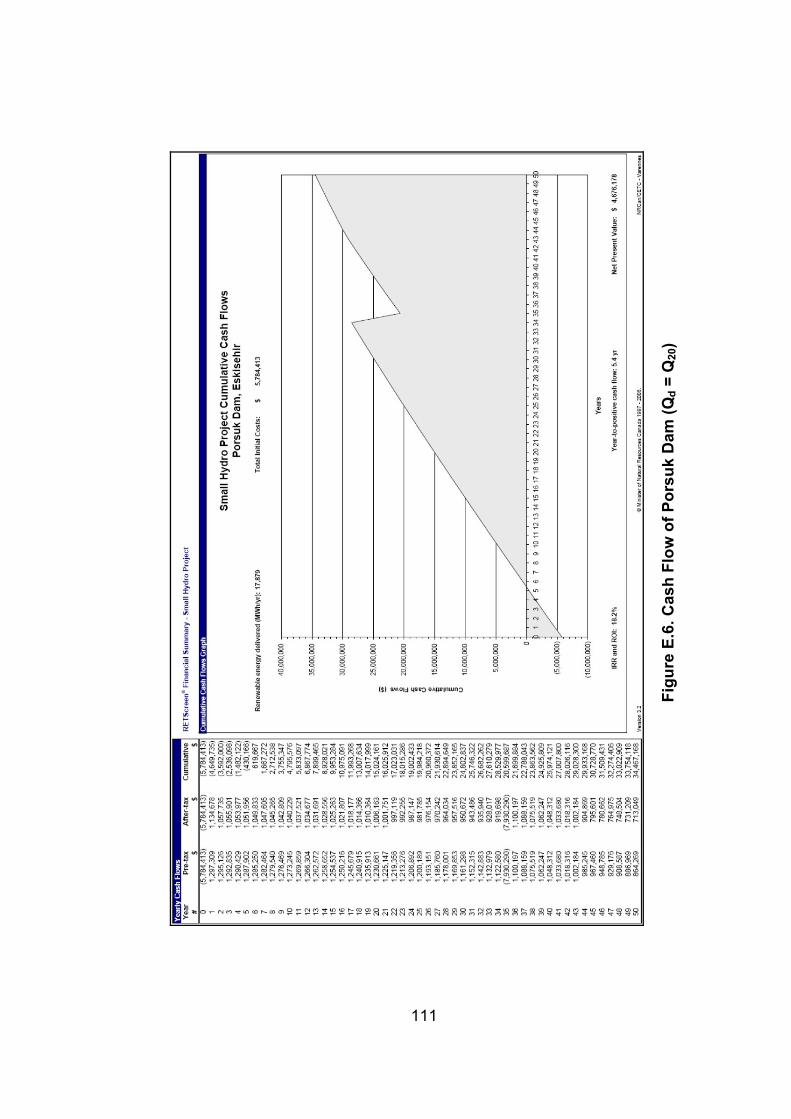
Figure E.6. Cash Flow of Porsuk Dam (Qd = Q20) ...................................111
Figure F.1. “Energy Model” Worksheet of Porsuk Dam (Qd = Q25)..........112
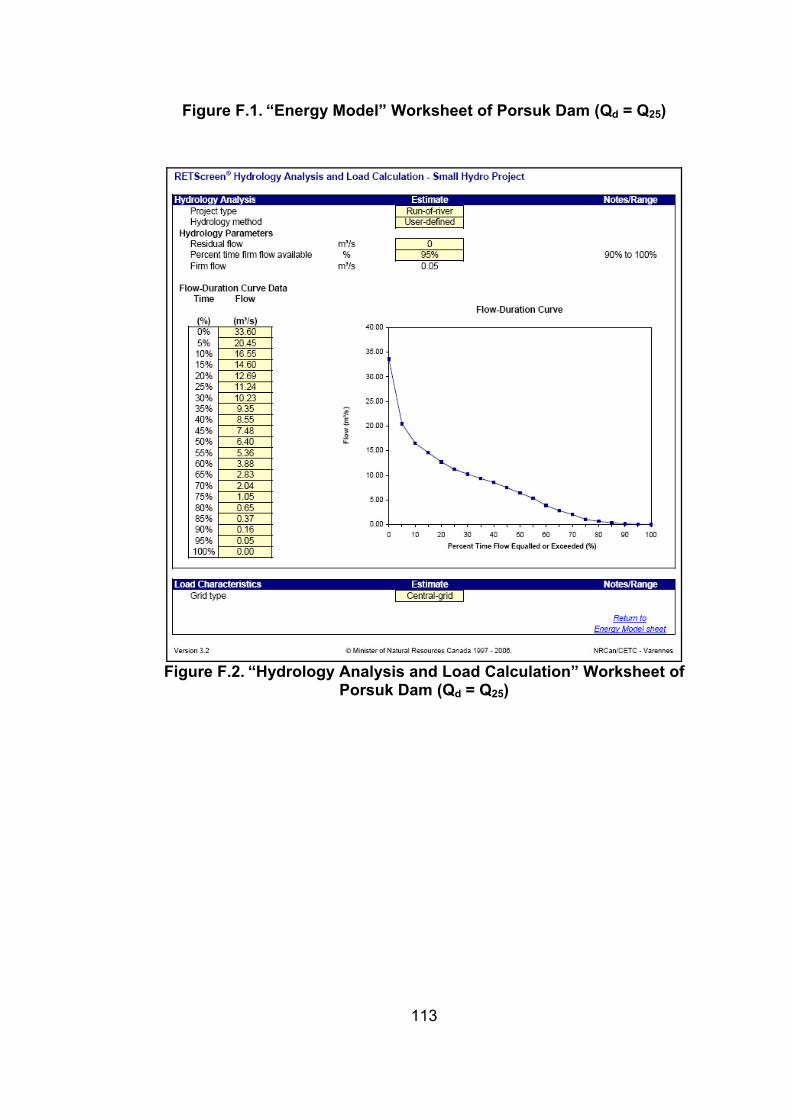
Figure F.2. “Hydrology Analysis and Load Calculation” Worksheet of Porsuk Dam (Qd = Q25) ...........................................................................113
Figure F.3. “Equipment Data” Worksheet of Porsuk Dam (Qd = Q25) ......114
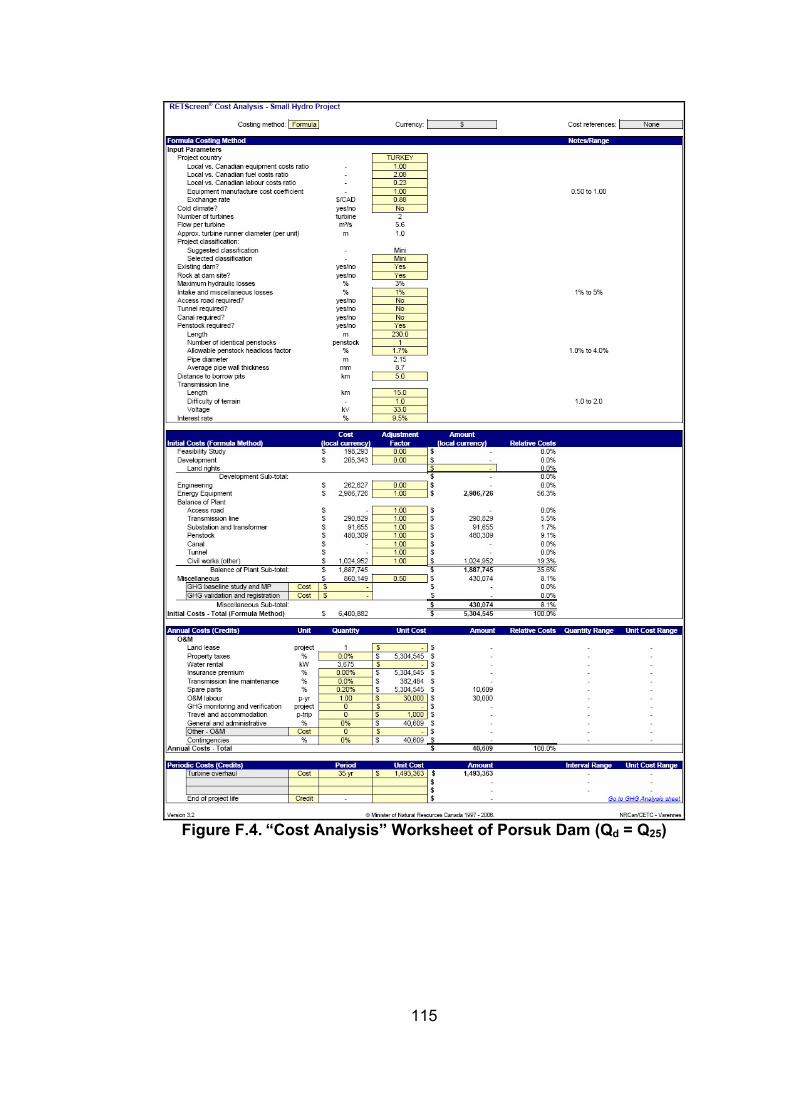
Figure F.4. “Cost Analysis” Worksheet of Porsuk Dam (Qd = Q25) ..........115
Figure F.5. Data Sheet of “Financial Summary” Porsuk Dam (Qd = Q25) 116
xvi
Figure F.6. Cash Flow of Porsuk Dam (Qd = Q25) ...................................117
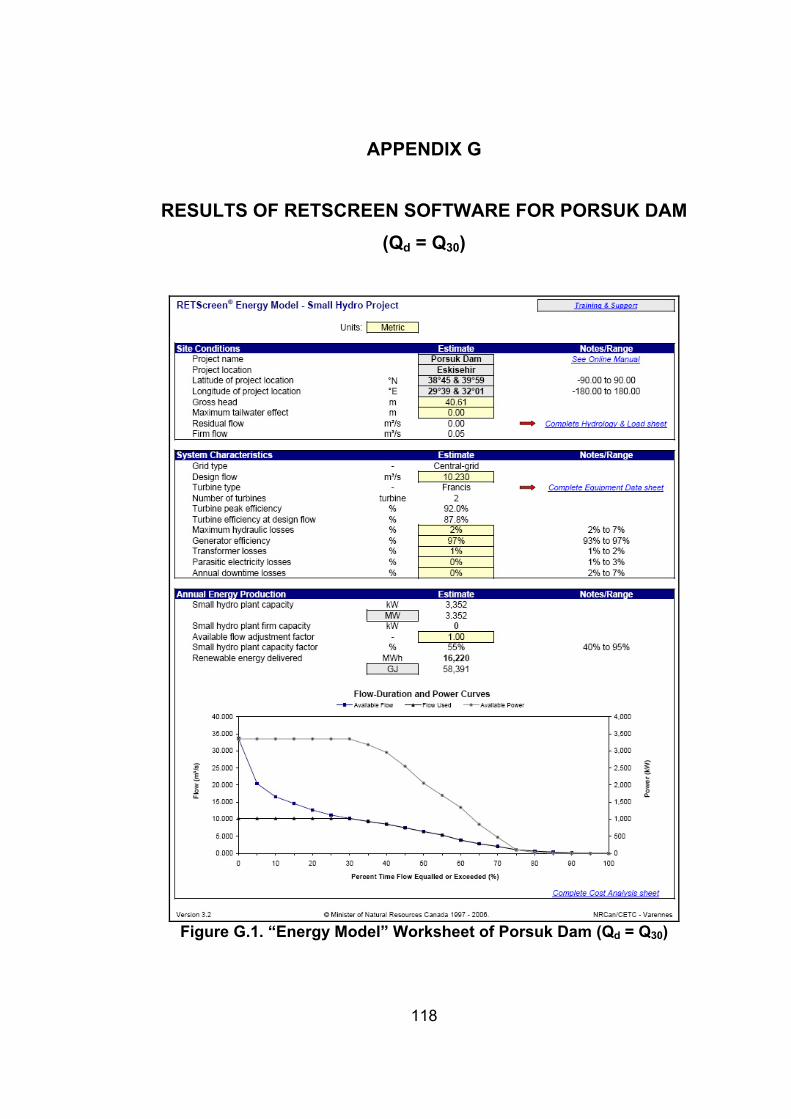
Figure G.1. “Energy Model” Worksheet of Porsuk Dam (Qd = Q30) .........118
Figure G.2. “Hydrology Analysis and Load Calculation” Worksheet of Porsuk Dam (Qd = Q30) ...........................................................................119
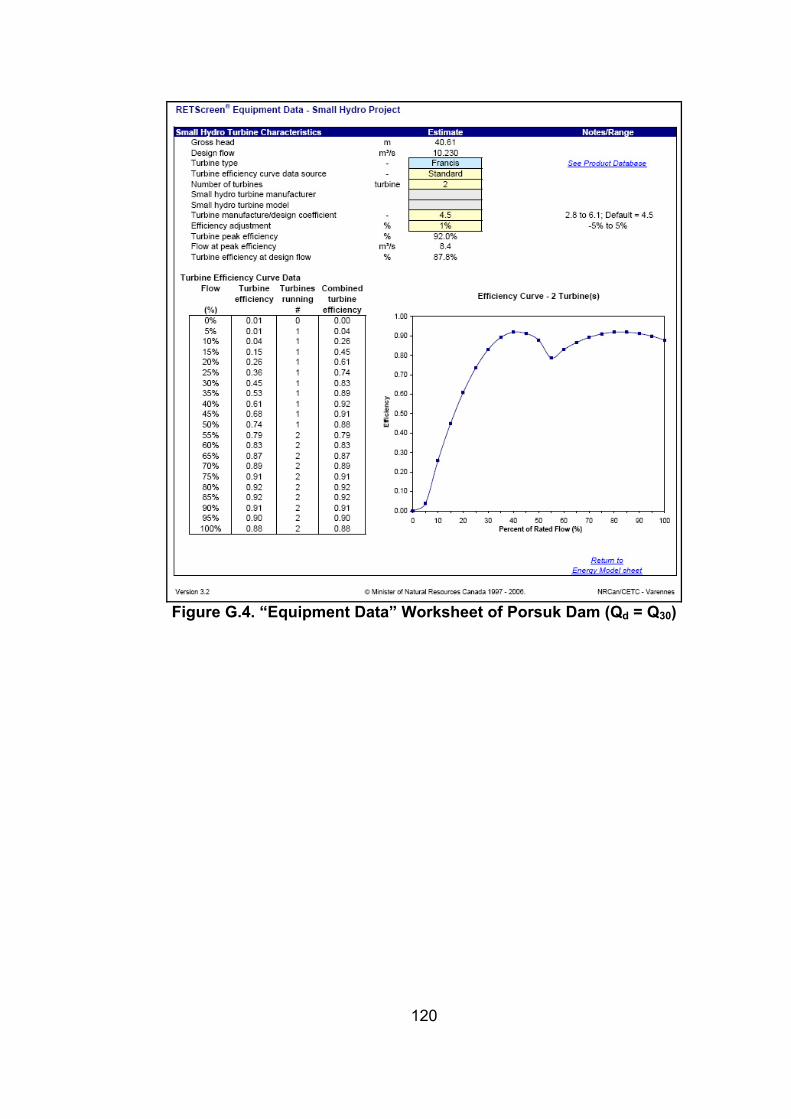
Figure G.3. “Equipment Data” Worksheet of Porsuk Dam (Qd = Q30)......120
Figure G.4. “Cost Analysis” Worksheet of Porsuk Dam (Qd = Q30)..........121
Figure G.5. Data Sheet of “Financial Summary” Porsuk Dam (Qd = Q30) 122
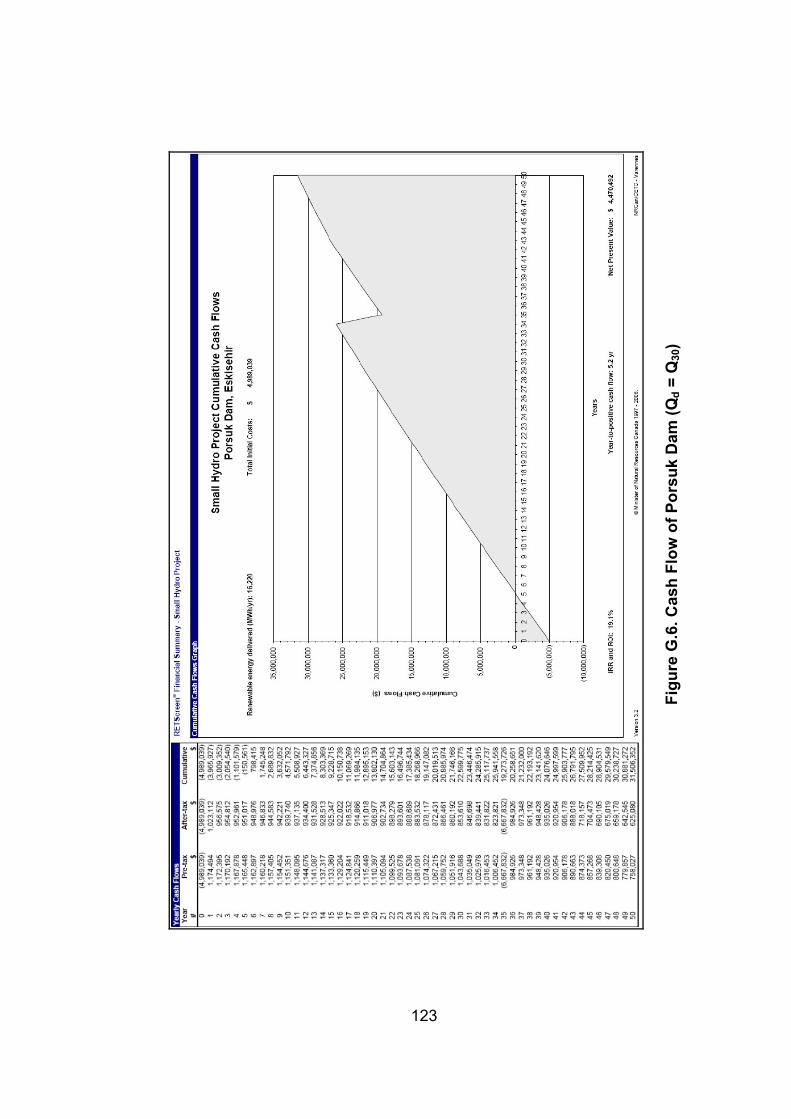
Figure G.6. Cash Flow of Porsuk Dam (Qd = Q30)...................................123
xvii
LIST OF ABBREVIATIONS
CAD Canada Dollar
DSİ State Hydraulic Works
EIE General Directorate of Electrical Power Resources Survey
and Development Administration
EMRA Energy Market Regulatory Authority
ESHA European Small Hydropower Association
EU European Union
IASH International Association for Small Hydro
IEA International Energy Agency
INL Idaho National Laboratory
MENR Ministry of Energy and Natural Resources of Turkey
OECD Organisation for Economic Co-operation and Development
TBMM Grand National Assembly of Turkey
TEİAŞ Turkish Electricity Transmission Company
TNSHP Thematic Network on Small Hydropower
USD United States Dollar
YTL New Turkish Lira
1
CHAPTER 1
1. INTRODUCTION
1.1. Introductory Remarks and Literature Survey
Hydropower plants, especially small scale hydropower plants, are getting
more important in renewable energy technologies (Dragu et al., 2001).
Hydropower provides majority of power generation in 55 countries and
contributes 20 percent of the world’s power generation (Altınbilek, 2005
and Dragu et al., 2001). Although large hydropower schemes are
technically mature and well exploited, small hydropower has a huge
untapped potential (Lins et al., 2004). Turkey has been generating
electricity from small hydropower plants since 1902 (Balat, 2007).
There are several measures taken in the world especially in Europe to
promote energy generation from renewable sources. Importance of the
sustainable management of natural resources, including water, has been
emphasized by world leaders from Stockholm in 1972 to Johannesburg in
2002 (Altınbilek, 2005). The first objective of White Paper for year 2003,
which had not been achieved, is to reach total installed capacity of 12,500
MW from renewable sources at 15 member countries of European Union
(Laguna et al., 2005). Turkey has a huge hydroelectric potential.
Unexploited small hydropower potential of Turkey is equal to approximately
70% of unexploited potential of all European Union countries.
As of June 2006, there are 25 countries, including Turkey, in Morgen
Stanley’s Emerging Market Index (Morgan Stanley Capital International,
2008). Increasing industrialization and development of Turkey increases
the demand for electricity rapidly. Annual increase in electricity demand of
2
Turkey has been expected as 7-8% by the Ministry of Energy and Natural
Resources of Turkey (MENR, 2007b).
Directive 2003/54/EC concerns common rules for the liberalization of
electricity market in European Union (European Parliament, 2003).
According to the Directive, the deadline for the complete opening of
electricity market to all customers is July 1, 2007 (Goerten et al., 2007).
Similarly, Turkish energy market has been going through a privatization
process. Opening of Turkish energy market to private investors has been
initiated in 1984. After the foundation of the Energy Market Regulatory
Authority in 2001, energy market in Turkey has been restructuring
significantly (Balat, 2007). Consequently, Turkish and foreign private
companies have involved in energy market by gathering licenses from
Energy Market Regulatory Authority.
1.2. The Scope of the Study
Development of a hydropower project is a challenging engineering
process. The main problem in designing small hydropower plants is
defining the optimum parameters to maximize the economics benefits.
Several computer programs have been developed to make initial
estimations on hydropower schemes.
Small Hydro Project Model software has been developed by RETScreen
International under the management of Canada Natural Resources with the
contribution of several governmental and non-governmental organizations
and academia. One of the objectives of RETScreen software is to reduce
the cost of pre-feasibility studies (RETScreen, 2007).
General idea about the feasibility assessment of small hydropower projects
in Turkey by using RETScreen software was studied by Korkmaz (2007).
The adequacy of RETScreen software to Turkish practice will be evaluated
by performing two case studies by RETScreen software. Results of
software will be compared with data given in feasibility reports. Both
3
projects subject to this study are under construction by a private Turkish
company. Actual data supplied from electromechanical equipment
manufacturers around the world will be used in the evaluation.
Consequently, inaccuracies and salutary properties of the software in
Turkey’s conditions will be pointed out.
Small hydropower schemes can also be developed by refurbishing and
renovating existing dams (Natural Resources Canada, 2008). Dams which
have been constructed only for irrigation and water supply purposes can be
updated for electricity generation. Using existing structures reduces the
cost of civil works; consequently the cost of small hydropower development
projects (Natural Resources Canada, 2008).
There are several multi-purpose dams in Turkey like Porsuk Dam in
Eskişehir. Potential of Porsuk Dam will be reevaluated for electricity
generation in this study. In literature similar studies had been carried out
for Porsuk Dam by Bakış et al., 2005.
In Chapter 1, literature survey and objective of the study are given briefly.
In Chapter 2, basic definitions related to small hydropower schemes are
explained. Then in Chapter 3, increasing electricity demand and
consequently the measures to supply the increasing demand are reviewed.
In Chapter 4, RETScreen International Small Hydro Project Model is briefly
introduced. Then, flow duration curve method which is the working principle
of RETScreen software for calculating energy potential is introduced. In
Chapter 5, data from feasibility studies in Turkey are used to check
accuracy of the RETScreen software in Turkish practice. In Chapter 6,
hydropower potential of Porsuk Dam, which is a 36 years old multipurpose
dam used only for irrigation, flood control and domestic water supply
purposes, is re-evaluated.
4
CHAPTER 2
2. SMALL HYDROPOWER ENERGY
2.1. Definition of Hydropower Energy
Richard Feynman, a celebrated physics teacher and Nobel Laureate, said
about the concept of energy in 1961 during a lecture at the California
Institute of Technology:
“There is a fact, or if you wish, a law, governing natural phenomena that
are known to date. There is no known exception to this law — it is exact so
far we know. The law is called conservation of energy; it states that there is
a certain quantity, which we call energy that does not change in manifold
changes which nature undergoes. That is a most abstract idea, because it
is a mathematical principle; it says that there is a numerical quantity, which
does not change when something happens. It is not a description of a
mechanism, or anything concrete; it is just a strange fact that we can
calculate some number, and when we finish watching nature go through
her tricks and calculate the number again, it is the same” (Feynman, 1964).
The generation of electricity from hydropower could be explained with the
same simple fact of nature, conservation of energy. Potential energy of
water, gained by hydrologic cycle, turns into mechanical energy by turbines
then into electrical energy by generators of hydropower plants.
“Water constantly moves through a vast global cycle, in which it evaporates
from lakes and oceans, forms clouds, precipitates as rain or snow, then
flows back to the ocean known as hydrologic cycle (Figure 2.1). The
energy of this water cycle that is driven by the sun can be evaluated most
efficiently with hydropower” (INL, 2007).
5
Figure 2.1. Hydrologic Cycle (Source: INL, 2007)
The potential energy of water turning into power by means of turbine is
given by the following formula:
P = η. ρ.g.Q.H (2.1)
where;
P is the power in Watts
η is the multiplication of the turbine, generator and transformer efficiencies
ρ is the density of water in kg/m3
g is the gravitational acceleration in m/s2
Q is the flow passing through the turbine in m3/s
H is pressure head of water in meters
6
Hydropower potential of a basin is defined in three important terms that are
gross theoretical potential, technically available potential and economic
potential.
Gross theoretical hydropower potential of a basin is calculated by taking all
natural flows in that basin from the beginning to the sea level to generate
electricity with 100% efficiency (η = 1).
Technically available potential is the applicable amount of gross theoretical
potential that is limited by the current technology (in which losses due to
friction, turbine and generator efficiencies (η) are taken into consideration).
Economic hydropower potential of the Republic of Turkey has been
calculated by State Hydraulic Works (DSI) and General Directorate of
Electrical Power Resources Survey and Development Administration (EIE)
from the master plan studies of basins. In these studies, benefits of
hydropower developments are compared with other possible alternative
sources of electricity generation. The reason for this comparison is to find
the cheapest solution to supply a specific amount of energy at a given time
(Goldsmith, 1993).
Firm energy is defined as the power available during a certain period of
the day with no risk. Firm flow which is used to calculate firm energy is
based on the data on flow duration curve. Generally it is taken as the flow
available at least 95% of the time. Therefore, a run-of-river scheme has a
low firm energy capacity. A hydropower plant with storage does, however,
have considerable capacity for firm energy. If a small hydro scheme has
been developed as the single supply to an isolated area, the firm energy is
extremely important. As failure to meet demand, could result in power
shortages and blackouts (TNSHP, 2004).
Secondary Energy is the amount of energy generated in excess of firm
energy. The price of secondary energy is lower than the price of firm
energy since its generation is not guaranteed all the time.
7
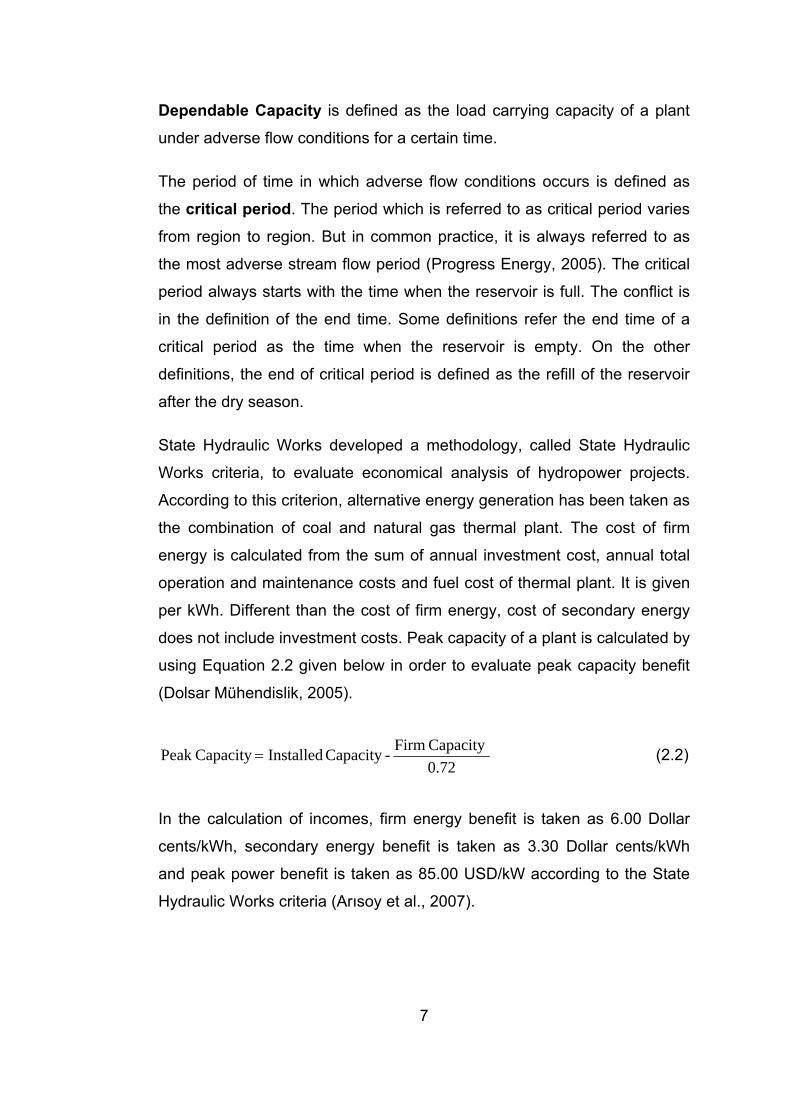
Dependable Capacity is defined as the load carrying capacity of a plant
under adverse flow conditions for a certain time.
The period of time in which adverse flow conditions occurs is defined as
the critical period. The period which is referred to as critical period varies
from region to region. But in common practice, it is always referred to as
the most adverse stream flow period (Progress Energy, 2005). The critical
period always starts with the time when the reservoir is full. The conflict is
in the definition of the end time. Some definitions refer the end time of a
critical period as the time when the reservoir is empty. On the other
definitions, the end of critical period is defined as the refill of the reservoir
after the dry season.
State Hydraulic Works developed a methodology, called State Hydraulic
Works criteria, to evaluate economical analysis of hydropower projects.
According to this criterion, alternative energy generation has been taken as
the combination of coal and natural gas thermal plant. The cost of firm
energy is calculated from the sum of annual investment cost, annual total
operation and maintenance costs and fuel cost of thermal plant. It is given
per kWh. Different than the cost of firm energy, cost of secondary energy
does not include investment costs. Peak capacity of a plant is calculated by
using Equation 2.2 given below in order to evaluate peak capacity benefit
PART 10 COST DISTRIBUTION FOR MULTIPURPOSE PROJECTS
20
Table 2.4. Continued
PART 11 ALTERNATIVES
11.1. Alternatives of Reservoir
11.2. Alternatives of Energy Facilities
2.5.4. Final Design
Final design process starts with the review of the alternatives given in
feasibility report. After spending considerable amount of effort and study,
detailed calculations and relevant drawings of the best alternative are
prepared.
At the end of the final design process, final design drawings and related
technical specifications are prepared in order to construct the hydropower
project.
2.5.5. Construction Period
Construction period of hydropower projects varies from one year to six or
seven years. This period is directly proportional to the size of the project,
experience of contractors and also the financial power of the investors.
During the construction period, some drawings might be changed. These
drawings, called shop drawings, should be prepared by contractors or
suppliers. Shop drawings are more detailed than final design drawings and
they are produced according to the actual conditions at the site.
As-built drawings are prepared at the end of the construction period with
enclosing and implementing shop drawings into design drawings. Also
detailed operation and maintenance manuals should be prepared by
contractors, suppliers and manufacturers for the ownership and
maintenance period.
21
2.5.6. Operating Period and Maintenance
Operation of hydropower plants could be differently organized depending
on the place, available resources and local infrastructure (Ravn, 1992).
Operation period requires good management skills and active maintenance
plan to minimize expense and downtime.
Modern hydropower schemes are usually automated in operation. Ordinary
maintenance of them includes simple tasks like clearing of trash-racks.
However, major maintenance works should be carefully planned according
to the flow regime since generating equipment would be shut down while
their maintenance works are carried out (Ravn, 1992).
2.6. Strengths and Weaknesses of Small Hydropower Energy
There are three main types of power plants which are thermal power
plants, nuclear power plants and renewable energy plants. Hydropower
energy is the most widely used source of renewable energy. Wind energy,
solar energy, biomass energy and geothermal power plants are the other
types of renewable energy sources.
Thermal power plants are generating power by burning fossil fuels. Most
common used fuel types in Turkey are coal, fuel oil and natural gas.
Nuclear power plants generate electricity from the nuclear fission of
radioactive elements. Small hydropower schemes use hydrological cycle
as a renewable source to generate electric energy. In other words, they do
not consume any natural sources like fuel, coal or gas.
As a sustainable resource, small hydropower meets the needs of the
present without compromising the ability of future generations to meet their
own needs (Lins et al., 2004). Altınbilek emphasizes role of hydropower in
sustainability by stating that “Hydropower has a huge potential to improve
economic viability, to preserve ecosystems and to enhance social justice”
(Altınbilek, 2005).
22
Condensation type thermal and nuclear power plants have long start-up
and shutdown times up to several hours. In other words, they are not
flexible in operation. Even for a gas turbine thermal power plant, it takes at
least 15 minutes to start up. Small hydropower technology allows fast start-
up, only 1 or 2 minutes, and shutdown in accordance with the changes in
demand (Dragu et al., 2001). Therefore another advantage of small
hydropower plants is the reliability and flexibility of operation.
Hydropower is a “secure” source of energy generation. Small hydropower,
except the ones constructed at cross boundary rivers, is available within
the borders of one country. Therefore, it is not subject to disruption by
international political events. This guarantees its security of supply (Lins et
al., 2004). In addition they are not dependent on price and availability of
fossil fuels since they are not using them.
Hydropower facilities have long life and related to this they have long
operation period with little maintenance.
Small hydropower plants have almost no environmental impact (Paish,
2002). They do not release heat or pollute environment. Moreover, green
house gas emissions are abated by using hydropower plants instead of
thermal plants.
One of the most important disadvantages of small hydropower is that they
have adverse effects on fish life. Firstly dams block fish species to move
freely. Fish ladders are built to overcome this obstacle. Second adverse
effect on fish life is the mortalities due to turbine blades. Less fish mortality
is aimed with the improving turbine technology. Thirdly; while water passes
through spillways, it gets saturated with gases in the air. Fish tissue,
surrounded with bubbles, absorbs the gas and this leads to huge damages
in fish and even their death. Lastly; because of the reservoirs, warm water
may be collected at the surface and cold water may be collected at the
bottom. Many fish species cannot survive in such environment (Dragu et
al., 2001).
23
Another drawback of run-of-river type small hydropower plants is the
variability of energy generation with the seasons. Rate of firm energy is
generally very low considered to possible peak energy (Paish, 2002).
Hydro schemes with reservoir overcome this problem by storing water for
dry seasons. Nonetheless, larger hydropower developments with reservoir
have other adverse effects. The places that will remain under water must
be purchased or expropriated. Most of the time, local people show
resistance because they have to resettle their houses, farms or lands.
Involuntary resettlement involves people of all ages and genders and
eviction of people spotlights a number of problems. Therefore efficient
resettlement planning should be carried out which makes resettling people
real beneficiaries of the project (Yen, 2003 and Tortajada, 2001). Since
reservoirs of small hydropower projects are not as large, they do not
require expropriation of very large land. So considering the oppositions of
local people and environmental organizations, small hydropower is
favorable.
2.7. Small Hydropower in the World
There is an increasing trend in the world to generate energy from
renewable energy sources which are clean and sustainable. Hydropower is
one of the oldest ways of electricity generation and its technology has been
developed over many years. All of the energy generation from hydropower
was from small hydropower schemes until the beginning of the 20th
century. In the 20th century, construction of larger dams and energy
generation from cheap petroleum products were resulted in a severe
abandonment of small hydropower plants (Adıgüzel et al., 2002). Since
developed countries have been almost completely using their economical
capacities in large scale hydropower energy, other renewable sources –
especially small hydropower – is getting more important. In contrast to this
situation, according to the White Paper, only about 20% of the economic
potential for small hydro power plants has been so far exploited in
European countries (European Commission, 1997). Also small
24
hydropower is getting more attention from the investors around the world
due to relatively less investment costs than large ones.
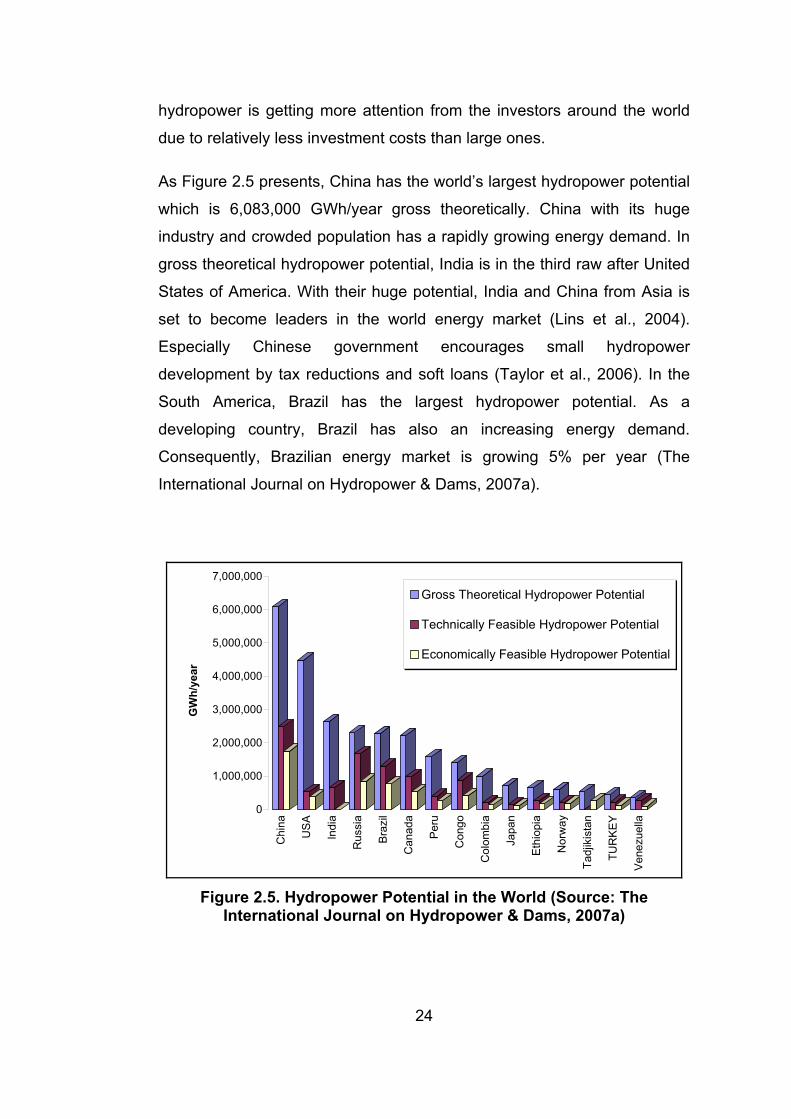
As Figure 2.5 presents, China has the world’s largest hydropower potential
which is 6,083,000 GWh/year gross theoretically. China with its huge
industry and crowded population has a rapidly growing energy demand. In
gross theoretical hydropower potential, India is in the third raw after United
States of America. With their huge potential, India and China from Asia is
set to become leaders in the world energy market (Lins et al., 2004).
Especially Chinese government encourages small hydropower
development by tax reductions and soft loans (Taylor et al., 2006). In the
South America, Brazil has the largest hydropower potential. As a
developing country, Brazil has also an increasing energy demand.
Consequently, Brazilian energy market is growing 5% per year (The
International Journal on Hydropower & Dams, 2007a).
0
1,000,000
2,000,000
3,000,000
4,000,000
5,000,000
6,000,000
7,000,000
GW
h/ye
ar
Chi
na
US
A
Indi
a
Rus
sia
Bra
zil
Can
ada
Per
u
Con
go
Col
ombi
a
Japa
n
Eth
iopi
a
Nor
way
Tadj
ikis
tan
TUR
KE
Y
Ven
ezue
lla
Gross Theoretical Hydropower Potential
Technically Feasible Hydropower Potential
Economically Feasible Hydropower Potential
Figure 2.5. Hydropower Potential in the World (Source: The
International Journal on Hydropower & Dams, 2007a)
25
According to the report prepared by Thematic Network on Small
Hydropower, there are 16,770 small hydro plants operating with an
average size of 0.63 MW at 25 European Union countries in 2004. The
number of small hydro plants increased to 17,090 with average capacity of
0.65 MW after the participation of Bulgaria and Romania to European
Union in 2007. The average contribution of small hydropower plants to total
hydropower production is more than 10% in European Union countries
(Marketing Working Group of the TNSHP, 2004).
According to Eurostat figures for 2002, Italy accounted for about 21% of
the total small hydropower capacity installed in the European Union,
followed by France (17%) and Spain (16%). From the new member
countries Romania and from the candidate countries Turkey represent
about 25% and 15%, respectively, of the total small hydropower installed
capacity in 2002 (Lins et al., 2005).
According to Lins et al., 2005, “more than 82% of all economically feasible
potential has already been exploited in the former 15 member countries of
European Union with the remaining 18% amounting to some 20 TWh/year.
In the new Member States and the candidate countries, this figure is
around 26 TWh/year. The majority of this potential is located in Turkey.
Poland and Romania rank second, having indicated potential 6–10 times
lower than that of Turkey. The third group is composed by the Czech
Republic, Slovenia, Bulgaria and Slovakia” (Lins et al., 2005).
2.8. Hydropower in Turkey
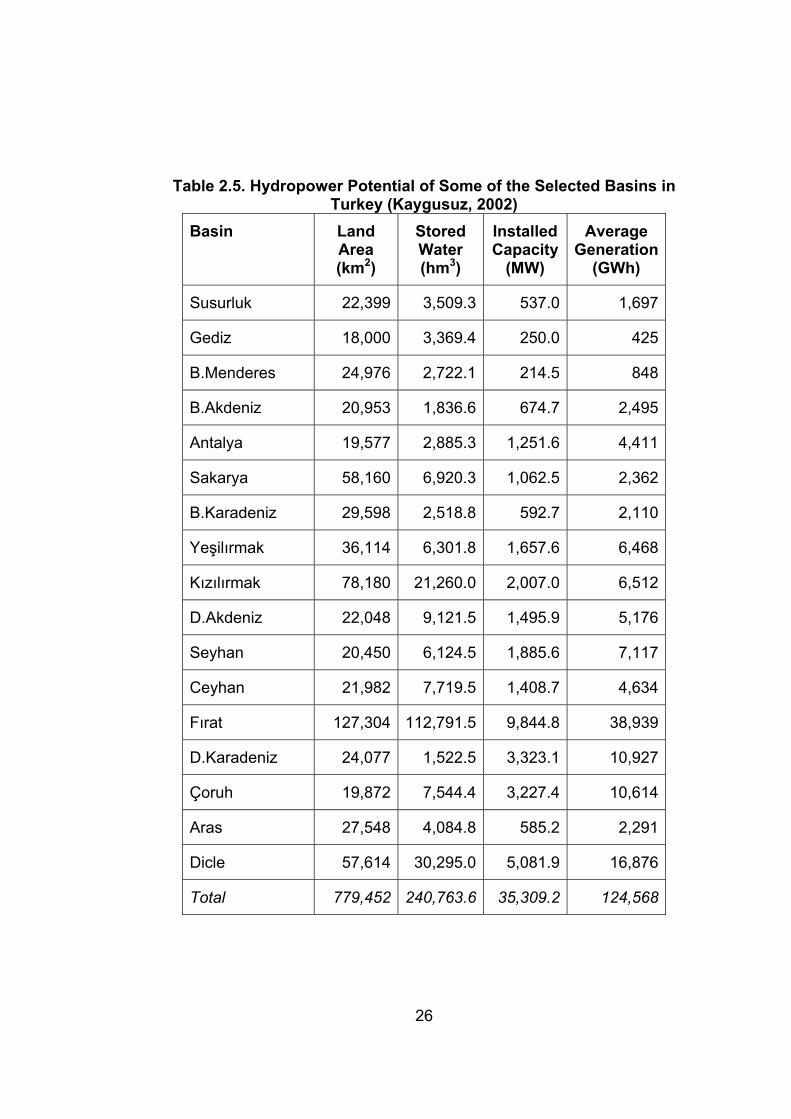
Turkey is divided into 26 hydrological basins with a total surface area of
779,452 km2. Hydropower potentials of 17 basins out of the total 26 basins
are given in Table 2.5. Two main branches of Shatt-al-Arab basin, which
are the Euphrates (Fırat) and the Tigris (Dicle) rivers, are running through
the Southeastern Turkey (Altınbilek, 1997). Especially the Euphrates basin,
consisting 16.3% of the total surface area, has 31.3% of the total energy
generation potential of Turkey.
26
Table 2.5. Hydropower Potential of Some of the Selected Basins in Turkey (Kaygusuz, 2002)
Basin Land Area (km2)
Stored Water (hm3)
Installed Capacity
(MW)
Average Generation
(GWh)
Susurluk 22,399 3,509.3 537.0 1,697
Gediz 18,000 3,369.4 250.0 425
B.Menderes 24,976 2,722.1 214.5 848
B.Akdeniz 20,953 1,836.6 674.7 2,495
Antalya 19,577 2,885.3 1,251.6 4,411
Sakarya 58,160 6,920.3 1,062.5 2,362
B.Karadeniz 29,598 2,518.8 592.7 2,110
Yeşilırmak 36,114 6,301.8 1,657.6 6,468
Kızılırmak 78,180 21,260.0 2,007.0 6,512
D.Akdeniz 22,048 9,121.5 1,495.9 5,176
Seyhan 20,450 6,124.5 1,885.6 7,117
Ceyhan 21,982 7,719.5 1,408.7 4,634
Fırat 127,304 112,791.5 9,844.8 38,939
D.Karadeniz 24,077 1,522.5 3,323.1 10,927
Çoruh 19,872 7,544.4 3,227.4 10,614
Aras 27,548 4,084.8 585.2 2,291
Dicle 57,614 30,295.0 5,081.9 16,876
Total 779,452 240,763.6 35,309.2 124,568
27
Economical and technical potential of Turkey was calculated as 124,568
GWh in 2002 by Kaygusuz given in Table 2.5 (Eroğlu, 2007). Economical
and technical potential had been increased to 130 GWh in 2006 according
to State Hydraulic Works (Figure 2.6). Uneconomical but technical
hydropower potential of Turkey, which is 86 Billion kWh, could be
evaluated by means of incentive measures taken by governments.
Guaranteed price for electricity generated from hydropower is a good
example of such a support mechanism. Green house tax is another
incentive measure applied in European countries to encourage and support
renewable energy. According to a study carried out, technically available
and economical potential of Turkey is calculated as 188,169 GWh by re-
evaluating some benefits of hydropower energy (Yüksel et al., 2005).
Technically Available but
Un-economical21%
Technically Unavailable
50%
Technically Available and Economical
29%
Technically Unavailable - 216 Billion kWhTechnically Available and Economical - 130 Billion kWhTechnically Available but Un-economical - 86 Billion kWh
(Gross Theoretical Potential - 433 Billion kWh)
Figure 2.6. Hydroelectric Potential of Turkey (Eroğlu, 2007)
According to Adıgüzel et al. (2002), 40% of the total water is non-usable for
energy generation since they are fully developed for different sectors like
irrigation, water supply and flood control. As a result, technically available
hydroelectric potential should be decreased to 183 billion kWh. The
difference between economically feasible and technically available is
28
57 billion kWh. A report submitted by State Hydraulic Works states that 57
billion kWh is technically utilizable and two third of the technically
exploitable energy should be considerable as economical. Half of this
estimation is taken for small hydropower potential. In the light of the very
rough calculations given in the study, Turkey’s small hydropower potential
is estimated to be approximately 19,000 GWh (Özgöbek, 2001).
Figure 2.7 presents the unexploited small hydropower potentials (< 10
MW) of European Union countries and Turkey. Remaining small
hydropower potential of European Union countries is 27,150 GWh/year
(Marketing Working Group of the TNSHP, 2004). Turkey, alone, has
unexploited small hydropower potential which is equal to approximately
70% of the total number in 27 member countries of European Union.
0
5,000
10,000
15,000
20,000
25,000
30,000
Rem
aini
ng S
mal
l Hyd
ropo
wer
Pot
entia
l (G
Wh/
year
)
Turkey EU
Figure 2.7. Remaining Small Hydropower Potential in Turkey and EU
Countries (2004) (Resource: Marketing Working Group of the TNSHP, 2004)
29
CHAPTER 3
3. ELECTRICITY DEMAND
Modern life is getting more and more dependant on electricity. Increase in
the demand for electricity is directly proportional to the increase in
industrialization and urbanization. Also mankind’s desire for prosperity
makes them dependent to technology and electric energy. Development of
countries could be compared by using different measures. Energy
consumption is one of the economic indicators of development (Wikipedia,
2008a). Lowest energy consumption takes place in the least developed
countries, on the other side developed countries like Canada has the
highest energy consumption per person (Wikipedia, 2008b).
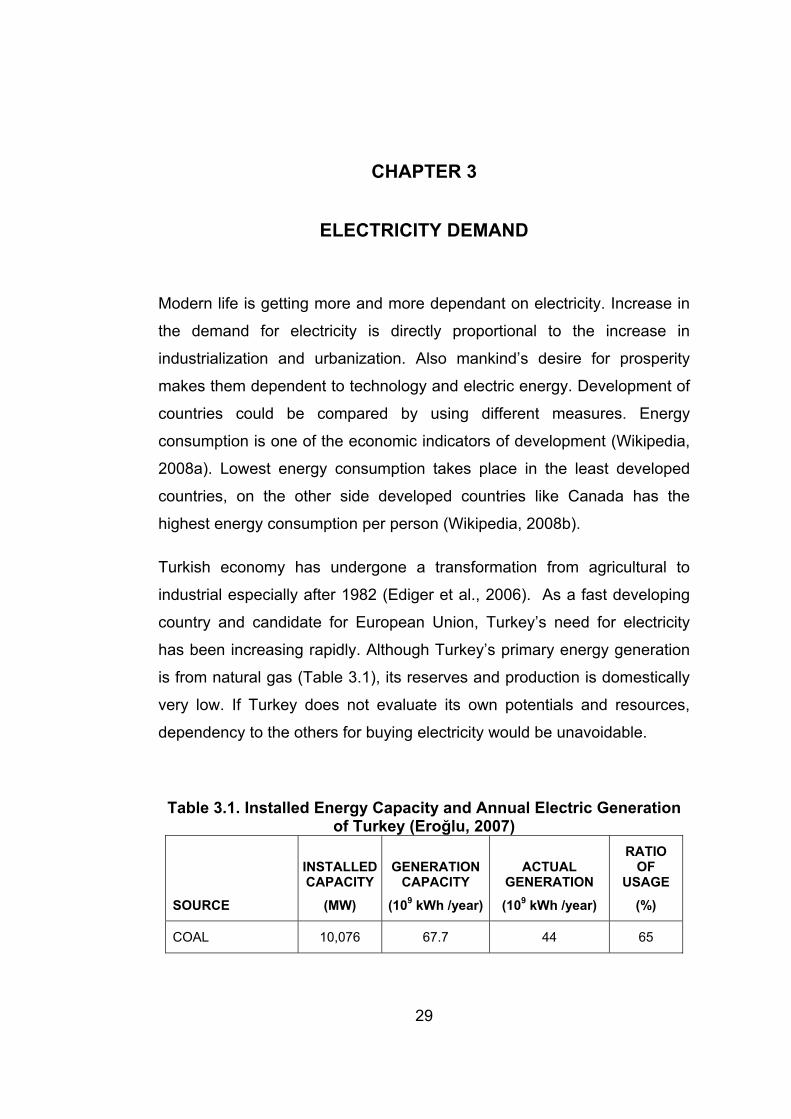
Turkish economy has undergone a transformation from agricultural to
industrial especially after 1982 (Ediger et al., 2006). As a fast developing
country and candidate for European Union, Turkey’s need for electricity
has been increasing rapidly. Although Turkey’s primary energy generation
is from natural gas (Table 3.1), its reserves and production is domestically
very low. If Turkey does not evaluate its own potentials and resources,
dependency to the others for buying electricity would be unavoidable.
Table 3.1. Installed Energy Capacity and Annual Electric Generation of Turkey (Eroğlu, 2007)
SOURCE
INSTALLED CAPACITY
(MW)
GENERATION CAPACITY
(109 kWh /year)
ACTUAL GENERATION
(109 kWh /year)
RATIO OF
USAGE
(%)
COAL 10,076 67.7 44 65
30
Table 3.1. Continued
FUELOIL 3,110 20.5 8.5 41
NATURAL GAS 13,484 102.3 66.5 65
HYDROELECTRIC 12,941 46.5 42 90
TOTAL (*) 39,611 237 161 68
* Geothermal Energy and Wind Energy is included in total values.
According to the Activity Report for year 2006 of Ministry of Energy and
Natural Resources of Turkey, long term electricity generation planning
studies, in order to meet the future electricity demands with a proper
arrangement and suitable to Turkey’s energy policies, shows that in high
demand scenario 56,500 MW and in low demand scenario 40,500 MW of
new investment is needed by 2020 other than the energy development
projects have already been developed and have been under construction.
As of today Turkey’s installed capacity is about 39,500 MW. In the planning
stage, complete usage of Turkey’s own resources is the primary objective.
Also nuclear power plant with installed capacity of 5,000 MW is envisaged
to operate starting from 2012 (MENR, 2007b).
The electricity network is interconnected in Europe. Import and export of
electricity is usually an economic choice but not due to shortages. Figure
3.1, which was prepared according to Eurostat 2005 values, shows that
France is the most important electricity exporting country in Europe with
52,300 GWh (Goerten et al., 2007). The highest import values are given for
Italy with 49,200 GWh. Turkey has transformed into an energy exporting
country since 2003 (Table 3.2).
31
0
10,000
20,000
30,000
40,000
50,000
60,000
70,000
Elec
tric
ity (G
Wh)
Luxe
mbo
urg
Latv
ia
Hun
gary
Den
mar
k
Aus
tria
Net
herla
nds
Finl
and
Portu
gal
Bel
gium Ita
ly
Gre
ece
Irela
nd
Uni
ted
Kin
gdom
Lith
uani
a
Slo
veni
a
Slo
vaki
a
Cze
ch R
ep.
Esto
nia
Bul
garia
Sw
eden
Pol
and
Fran
ce
Ger
man
y
Rom
ania
Spa
in
Turk
ey
Import (GWh)
Export (GWh)
Figure 3.1. Imports and Exports of Electricity in European Countries
in 2005 (Source: Goerten et al., 2007)
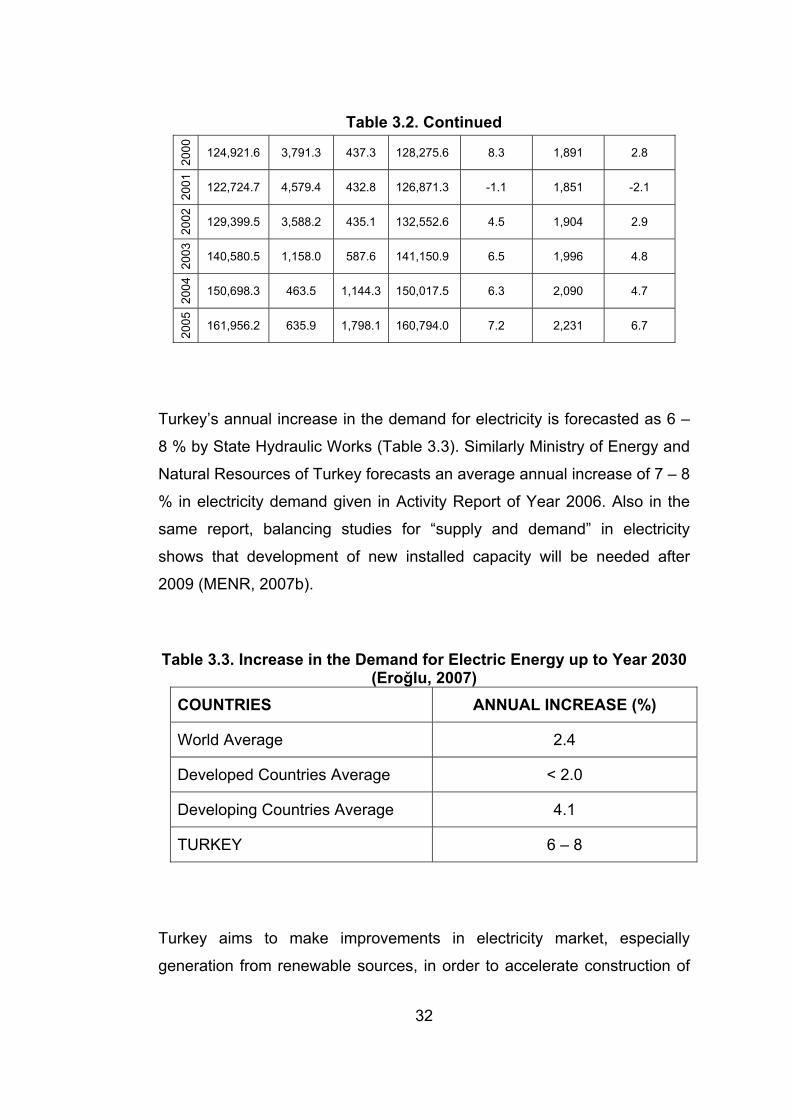
As given in Table 3.2, there is a rapid increase in consumption per capita.
According to OECD, Turkey is one of the countries with the largest
increase in energy demand (Ereke, 2007).
Table 3.2. Yearly Electric Energy Gross Production – Import – Export – Gross Consumption of Turkey (TEİAŞ, 2007)
YEA
R
GR
OSS
PR
OD
UC
TIO
N
(GW
h)
IMPO
RT
(GW
h)
EXPO
RT
(GW
h)
GR
OSS
C
ON
SUM
PTIO
N
(GW
h)
AN
NU
AL
AVA
RA
GE
INC
REA
SE
(%)
GR
OSS
C
ON
SUM
PTIO
N
PER
CA
PITA
(k
Wh/
capi
ta)
AN
NU
AL
AVA
RA
GE
INC
REA
SE
(%)
1995
86,247.4 0 695.9 85,551.5 - 1,411
1996
94,861.7 270.1 343.1 94,788.7 10.8 1,540 9.1
1997
103,295.8 2,492.3 271 105,517.1 11.3 1,678 9.0
1998
111,022.4 3,298.5 298.2 114,022.7 8.1 1,797 7.1
1999
116,439.9 2,330.3 285.3 118,484.9 3.9 1,840 2.4
32
Table 3.2. Continued
2000
124,921.6 3,791.3 437.3 128,275.6 8.3 1,891 2.8
2001
122,724.7 4,579.4 432.8 126,871.3 -1.1 1,851 -2.1
2002
129,399.5 3,588.2 435.1 132,552.6 4.5 1,904 2.9
2003
140,580.5 1,158.0 587.6 141,150.9 6.5 1,996 4.8
2004
150,698.3 463.5 1,144.3 150,017.5 6.3 2,090 4.7
2005
161,956.2 635.9 1,798.1 160,794.0 7.2 2,231 6.7
Turkey’s annual increase in the demand for electricity is forecasted as 6 –
8 % by State Hydraulic Works (Table 3.3). Similarly Ministry of Energy and
Natural Resources of Turkey forecasts an average annual increase of 7 – 8
% in electricity demand given in Activity Report of Year 2006. Also in the
same report, balancing studies for “supply and demand” in electricity
shows that development of new installed capacity will be needed after
2009 (MENR, 2007b).
Table 3.3. Increase in the Demand for Electric Energy up to Year 2030 (Eroğlu, 2007)
COUNTRIES ANNUAL INCREASE (%)
World Average 2.4
Developed Countries Average < 2.0
Developing Countries Average 4.1
TURKEY 6 – 8
Turkey aims to make improvements in electricity market, especially
generation from renewable sources, in order to accelerate construction of
33
on-going projects and extract new investments to local energy sector.
However, policies in infrastructure projects like water and energy have
some complexities (Altınbilek, 2005). Therefore, policy makers in Turkey
should follow a certain policy in energy sector to increase common welfare
of Turkish nation. Realization of the value of Turkey’s own resources and
potential should be the main objective while constituting energy policies.
3.1. Political Aspects of Small Hydropower in the World
Representatives from allover the world emphasize the importance of
hydropower, as a sustainable source of energy, in human life in Stockholm
in 1972, in Rio de Janeiro in 1992 and in Johannesburg in 2002 (Altınbilek,
2008). Important milestone in the promotion of renewable sources of
energy is the Kyoto Protocol in 1997. The importance of energy generation
from renewable sources of energy has also been enhanced by the
European Union. This importance has been emphasized by issuing of the
White Paper: “Energy for the Future: Renewable Sources of Energy” in
1997, and the Directive 2001/77/EC, “Promotion of Electricity Produced
from Renewable Energy Sources” in 2001.
Objective of the White Paper is to attain minimum 12% energy penetration
from renewable energy sources in the European Union by 2010. An
additional installed capacity of 4,500 MW of small hydro plants by 2010 is a
realistic contribution which could be achieved given a more favorable
regulatory environment, since these small projects, if correctly planned,
can have much lower environmental impact (European Commission,
1997). The goal of achieving more electricity from renewable sources
would create a more sustainable energy system and reduce CO2 levels.
Progress of each branch of renewable energy sources are quoted in the
White Paper, where large hydropower schemes are considered as
competitive and do not need any further assistance. However, small
hydropower development should be further increased according to the
paper (European Commission, 1997).
34
The specific goal of the Directive 2001/77/EC is to reach 12% use of
electricity from renewable in the European Union by the year 2010. The
directive gives member states a reason to be interested in small
hydropower since it is the best proven renewable-energy technology. The
directive proposes some measures to encourage renewable sources. First,
it sets national targets for consumption of electricity from renewable
sources of energy. Second, national support schemes and, if necessary, a
harmonized support system should be made. Third, administrative
procedures for authorization and to get licenses should be simplified.
Fourth one is the guaranteed access to transmission and distribution of
electricity from renewable energy sources (European Parliament, 2001).
The Directive gives a reason to consider small hydropower potential in
European countries. “Of special interest for Europe, from both the
economic and environmental points of view, is exploiting the high potential
for upgrading and refurbishing existing plants” (Lins et al., 2004).
Representatives of governments, representatives of private sector, United
Nations agencies, international organizations and academia have met at
the United Nations Symposium on Hydropower and Sustainable
Development in Beijing China on October 27 – 29, 2004. Beijing
Declaration on Hydropower and Sustainable Development, adopted at the
end of symposium, states strategic importance of hydropower for
sustainable development by promoting environmentally friendly, socially
responsible and economically viable hydropower development. Beijing
Declaration recalls Johannesburg Plan of Implementation in 2001 which
calls significant increase in the global share of energy from renewable
energy sources including hydropower. Beijing Declaration also recalls
Political Declaration adopted at the Bonn International Conference for
Renewable Energies in June 2004 which states renewable energies,
including hydropower, can contribute to sustainable development by
decreasing greenhouse gas emissions (United Nations Division for
Sustainable Development, 2007).
35
3.2. Political Aspects to Small Hydropower in Turkey
Possible energy shortages in near future and dependency to generation of
electricity from imported goods like fossil fuels might be minimized by the
participation of private sector. Unlike the slow moving wheels and long
bureaucracy of governmental organizations, private companies are aiming
to complete energy projects as soon as possible to minimize turn back time
of investments. Table 3.4 summarizes the historical overview of the
privatization of energy market in Turkey.
Table 3.4. Privatization of Electricity Market in Turkey – Acts and Regulations
NO YEAR PUBLICATION DESCRIPTION
1 1984 ACT NO: 3096 Forms a Built-Operate-Transfer (BOT) model for local and foreign private companies to generate, transmit, distribute and trade electricity (TBMM, 1984).
2 1999 ACT NO: 4446 Defines legal foundation of “Privatization” in the Constitution (TBMM, 1999).
3 2001 ACT NO: 4628 Aims to form a stable, transparent and competitive electricity market to generate sufficient, sustainable and cheaper electricity (TBMM, 2001)
4 2003 REGULATION Aims to increase involvement of private sector in the electricity market. (MENR, 2003)
5 2004 REGULATION Transfers six on-going HPP developments to private sector (MENR, 2004)
6 2005 ACT NO: 5346 Aims to increase electricity generation from renewable sources (TBMM, 2005)
36
Opening of Turkish energy market to private investors has been initiated
with the Act No 3096. It was prepared and published in the Official
Newspaper number 18610 on December 19th, 1984. Local and foreign
private enterprises, other than Turkish Electricity Administration, had given
the opportunity to generate, transmit, distribute and trade electricity
(TBMM, 1984).
Different applications of privatization have been carried out in the Republic
of Turkey since 1984. However, there had been no articles in the
Constitution that specifically regulates “privatization”. In the practical
application, international arbitration as the place of dispute resolution had
been denied by State Council until 1999. Decision of State Council had an
adverse effect in Built – Operate – Transfer (BOT) type projects for foreign
investors to enter Turkish market (TBMM, 2008). To put an end to these
difficulties and complications in the execution, “privatization” has been
defined under the Article 47 of the Constitution by the publication of Act No
4446 in Official Newspaper number 23786 on August 14th, 1999 (TBMM,
1999). Also international arbitration opportunity has been given to foreign
investors with the same act. According to Kılıç et al. (2007), amendments
like Act No 4446 are planned to accelerate infrastructure projects, like
power plants, by procuring easier financing and consent.
Regulating and organizing energy market with a politically independent
agency is a common practice in many countries. Moreover, such agency is
requested by European Union in the participation process of Turkey.
Consequently, Energy Market Regulatory Authority (EMRA) has been
established with the publication of Act No 4628 in Official Newspaper
number 24335 on March 3rd, 2001. Restructuring of energy market in
Turkey has started with the foundation of the Energy Market Regulatory
Authority (Balat, 2007). The EMRA published Energy Market Licensing
Regulation and the Electricity Market Tariffs Regulation in August 2002
(Kılıç et al., 2007).
37
After 2003, Ministry of Energy and Natural Resources of Turkey and
authorities of energy in the Republic of Turkey have been paying more
attention to the energy market by implementing new laws and regulations
in order to avoid energy shortages.
“Regulation about Procedures and Principles for Contract Agreements in
Water Usage Rights for Production in Electricity Market” was published on
Official Newspaper number 25150 on June 26th, 2003 (MENR, 2003). This
regulation is one of the most important milestones for generation and
distribution of electricity in Turkey. Contractual matter of water usage rights
have been edited with the publication on June 2003. Aim of this regulation
should be summarized as to meet growing demand of electricity in Turkey
by the role of private sector which is more competitive and faster than
governmental organizations.
A change has been made in the Contract Agreements in Water Usage
Rights Regulation on May 25th, 2004. With this change, 6 on-going Hydro
Electric Power Plant construction projects were transferred to private
sector (Eroğlu, 2007).
“Act about Usage of Renewable Energy Sources for Electric Energy
Production Purposes” was published on Official Newspaper number 25819
on May 18th, 2005. As stated in the Clause 1 of the Act (TBMM, 2005); aim
of this act is to generalize the use of renewable energy sources for
electricity generation, to bring in these sources dependably, economically
and with high quality to economy, to increase variety of sources, to
decrease greenhouse gas emissions, to evaluate wastes, to protect
environment and to develop the production sector needed to implement
these aims.
According to the Activity Report for year 2006 of the Ministry of Energy and
Natural Resources of Turkey (MENR, 2007b), “Act about Renewable
Energy Sources for Electric Energy Production Purposes” gives private
sector opportunity to generate electricity from renewable sources. It also
38
gives investors feasibility opportunities in wind power, run-off river
hydropower, and small-scale reservoir hydropower projects. Also with the
change in the act, more attractive investment privileges have been aimed
for the private sector. In this context, purchase guarantee of energy
generated from renewable energy sources is extended. Guaranteed
purchase period is increased from 7 years to 10 years. Also the
guaranteed buy-back rate is increased to 5 – 5.5 Euro cent/kWh (MENR,
2007b).
New acts and regulations in Turkey’s energy sector also provide private
companies the opportunity to develop their own energy projects.
Companies are encouraged to investigate and make studies on different
locations, on different drainage basins, and on different branches of rivers
to develop potential energy generation projects. The process of initial
investigations is followed by the preliminary feasibility study. According to
the results of pre-feasibility studies, economically feasible and profitable
projects are selected. Further studies would continue to develop feasibility
of an energy project and to submit it to authorities for approval.
According to the numbers given by General Directorate of Electrical Power
Resources Survey and Development Administration (EIE, 2007), there are
142 operating and 41 on – going hydropower plants in Turkey with total
installed capacities 12,788 MW and 4,397 MW, respectively. Also there are
589 hydropower schemes that are planned to be constructed (Table 3.5).
Table 3.5. Hydropower Schemes at the Planning Stage (EIE, 2007) Classification Number
of PlantsTotal
Installed Capacity
(MW)
Total Dependable
Energy (GWh/year)
Annual Mean
Energy (GWh/year)
Small Hydro (< 50MW) 492 5,701 10,379 23,464
39
Table 3.5. Continued Large Hydro (> 50MW) 97 13,658 26,956 45,709
TOTAL 589 19,359 37,335 69,173
According to the report published in World Atlas and Industry Guide 2007,
there are 76 small scale hydro plants operating in Turkey. However, under
the new energy market regulations, the private sector applied for 694 small
hydropower projects (The International Journal on Hydropower & Dams,
2007b). These projects are exploited by private sector in addition to the schemes exploited by EIE that are given in Table 3.5. 589 projects are at
planning stage by EIE as of February 2007 (EIE, 2007). Excluding the
competition between Turkish companies to gather licenses from EMRA,
foreign investors are highly interested in Turkish energy market. According
to Ereke (2007), foreign energy companies from Italy, China, United States
of America, Germany, Austria, United Arab Emirates and Azerbaijan had
entered to Turkish market by establishing partnerships with Turkish
companies. The result of these studies justifies that MENR’s initial
objective in Turkish energy sector had been achieved. Completion of
constructions and operating these plants is the next step for a promising
future.
According to Altınbilek (2007), annual performance of State Hydraulic
Works (DSİ) in the last 50 years is approximately 280 MW. Considering the
completion times, expectation from the private sector is 4 – 5 times larger
than DSİ per year. Altınbilek listed some of the problems that might arise
due to increased demand in the market. The first problem is the financing
power of private sector to complete hydropower developments. It is
impossible for private sector to put all investment money from its own
resources; therefore, private sector should raise adequate credits. The
second problem stated by Altınbilek (2007), is the background of
40
companies which applied for licenses from Electricity Market Regulatory
Authority. Some companies acting in different industries applied for
licenses in order to enter into the electricity market. Their capacity and
know-how in hydropower projects is a big question mark. The third problem
stated by Altınbilek (2007) is to find enough number of engineering,
consultancy, and project development firms and subcontractors that have
satisfactory know-how in hydropower projects. Number of design offices
that can develop hydropower projects is not sufficient to meet current
demand. Small hydropower schemes involve building of energy tunnels.
Similar to the problem in the number of design offices, number of
subcontracting companies which have expertise in tunnel works is another
problem. The last problem is the long delivery times of electromechanical
equipment manufacturers. Similarly, delivery times of machinery and
equipment that are used in tunnel works are very long. According to the
common practice in Turkey, diameters of tunnels in small hydropower
schemes are between 3.0 and 4.0 meters which require smaller (mining)
type of machinery (drilling rigs, underground loaders, dumper trucks,
concrete mixer trucks, etc.). Availability of machinery especially for small
diameter energy tunnels is another difficulty in addition to the shortage of
subcontractors in tunnel works.
41
CHAPTER 4
4. RETSCREEN CLEAN ENERGY PROJECT ANALYSIS
SOFTWARE – SMALL HYDRO PROJECT MODEL
4.1. Computer Software Programs in Small Hydropower
Development of a small hydropower project is not a quite simple task, as
previously described in Chapter 2. It requires some expertise in
engineering. Some computer software programs have been developed to
overcome this problem. Mainly, these programs are used simply for initial
estimations of energy output of a hydropower scheme. They should give an
idea about the economy of a small hydropower development without
spending relatively much time and money.
Software programs use two main approaches to estimate energy output
that are the flow duration curve method and simulated stream flow method.
No clear advantage has been generally apparent for either method
(TNSHP, 2004).
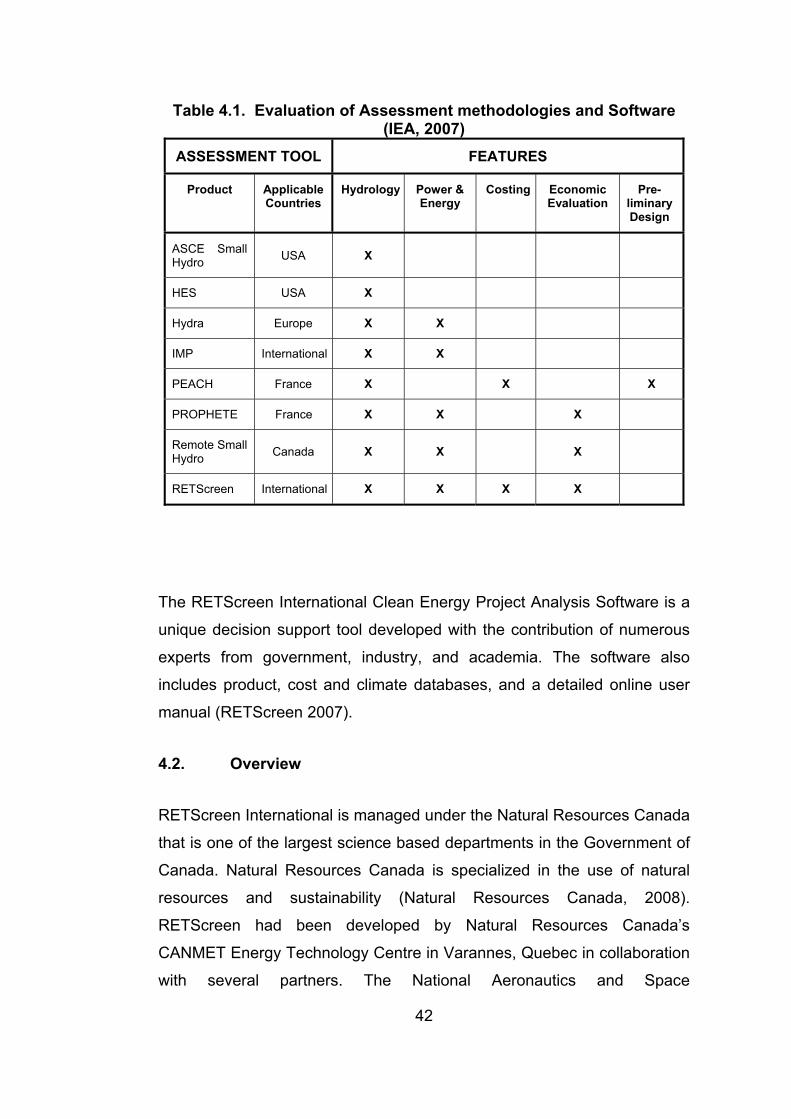
Some of the computer based software programs and their main features
are listed Table 4.1. From the software programs listed below, only IMP
and RETScreen Software can be applied internationally. Both IMP and
RETScreen can be used to evaluate energy production. However,
RETScreen has costing, risk, emission reductions and economical
evaluation features more than IMP. Also RETScreen software is available
free of charge for download at RETScreen International web site.
42
Table 4.1. Evaluation of Assessment methodologies and Software (IEA, 2007)
ASSESSMENT TOOL FEATURES
Product Applicable Countries
Hydrology Power & Energy
Costing Economic Evaluation
Pre-liminary Design
ASCE Small Hydro USA X
HES USA X
Hydra Europe X X
IMP International X X
PEACH France X X X
PROPHETE France X X X
Remote Small Hydro Canada X X X
RETScreen International X X X X
The RETScreen International Clean Energy Project Analysis Software is a
unique decision support tool developed with the contribution of numerous
experts from government, industry, and academia. The software also
includes product, cost and climate databases, and a detailed online user
manual (RETScreen 2007).
4.2. Overview
RETScreen International is managed under the Natural Resources Canada
that is one of the largest science based departments in the Government of
Canada. Natural Resources Canada is specialized in the use of natural
resources and sustainability (Natural Resources Canada, 2008).
RETScreen had been developed by Natural Resources Canada’s
CANMET Energy Technology Centre in Varannes, Quebec in collaboration
with several partners. The National Aeronautics and Space
43
Administration’s Langley Research Center and the Renewable Energy and
Energy Efficiency Partnership are two main partners (Natural Resources
Canada, 2008).
The aim of RETScreen International Clean Energy Decision Support
Centre is to build the capacity of planners, decision – makers and industry
to implement renewable energy and energy efficiency projects. This
objective was achieved by developing decision making tools (e.g.
RETScreen Software). RETScreen Software has been developed with the
objective to reduce the cost of pre-feasibility studies; to help people make
better decisions; and to analyze the technical and financial viability of
possible projects (RETScreen, 2007).
The online manual of Small Hydro Project Model covers all information
required to run the model. It comes with the software and both can be
downloaded free from RETScreen International’s internet homepage
(www.RETScreen.net). Therefore it would not be included in this study.
Instead, working methodology of the software will be introduced.
4.3. Flow Duration Curve Method for Power Potential Calculation
Two different methods; flow duration curve method and sequential
streamflow routing method, can be used for computing power output of
hydropower projects. Flow duration method gives better results for run-of-
river projects. However, sequential streamflow routing method was
developed primarily for storage projects (Yanmaz, 2006).
RETScreen Software has been developed based on the flow duration
curve method. Procedure of flow duration curve method given by Yanmaz
(2006) to determine energy is as follows:
1. Firstly, flow duration curve is developed.
2. Variations of tailwater elevation with discharge are reflected by
developing a head versus discharge curve.
44
3. Plant size is selected by considering maximum and minimum head
and minimum single unit discharge. Therefore, maximum discharge that
can pass through turbine is determined.
4. Flow duration curve should be modified to include only the usable
flow which is limited by the selected turbine.
5. Power duration curve is developed by using the modified flow
duration curve and power equation.
6. The average annual energy can be calculated by computing the
area under the power duration curve and multiplying by number of
16 Net Present Value (USD) 4,676,178 4,609,684 4,470,492
Investment cost increases from alternative 1 to alternative 3, in Porsuk
case which is directly proportional to installed capacity. Nonetheless,
alternative 1 would generate more annual electricity than other two
alternatives. The benefit – cost ratio of all three alternatives, given in Table
6.3., are larger than 1 therefore all of them are economically feasible.
Alternative 3, which was designed according to the flow available at 20% of
time, is less risky than alternative 1. In other words, sensitivity of alternative
3 to the operational studies at the dam and to the availability of water is
relatively smaller. However, the best alternative should be decided after
economical analysis and should be selected as alternative 1 by comparing
their net present values.
6.8. Discussion of Results
Refurbishment of Porsuk Dam for energy generation is an economically
acceptable investment. Alternative 1 will reach to positive cash flow in less
than 6 years. Guaranteed purchase time of energy from renewable sources
is 10 years in Turkey. As an advantage, year to positive cash-flow less
than 10 years decreases the economical risk of alternative 1.
On the other side, energy generation from Porsuk Dam has an important
disadvantage. Since firm flow is almost equal to zero, firm capacity and
firm benefit of the plant is zero (Table 6.4). Therefore, proposed plant
would only generate secondary energy. In Turkey, this could be a common
disadvantage when refurbishing multipurpose dams. Moreover, some of
82
them may only generate electricity during spring months when excessive
water comes from the melting of snow.
Table 6.4. Annual Benefits of Porsuk Dam According to DSİ Criteria
ITEM QUANTITY UNIT
BENEFIT TOTAL
BENEFIT
Firm Energy 0 0.060 $/kWh 0
Secondary Energy 17,879,000kWh 0.033 $/kWh 590,007 USD
Peak Power (DSİ Criteria) 4,150 kW 85.00 $/kW 352,750 USD
TOTAL BENEFIT 942,757 USD
Electricity generation from a multipurpose dam serving only for irrigation
and/or domestic water supply has another important disadvantage in
economical evaluation which is the money paid to the State Hydraulic
Works for the energy contribution credit. If a dam has not been built, there
would not be any water stored in the reservoir to gain head. Therefore, a
payment is collected by State Hydraulic Works.
In spite of some disadvantages, refurbishment of existing dams should be
on the agenda while making long term plans of Turkey. Also adaptation of
incentive measures like eliminating energy contribution credit should turn a
threat into an opportunity for energy generation projects from multipurpose
dams.
83
CHAPTER 7
7. CONCLUSIONS
Increasing threat of climate change made countries search every means to
reduce greenhouse gas emissions. As a result, promotion of clean energy
technologies has increased over the past decades. Hydropower energy as
a sustainable development is the most important type of renewable energy.
RETScreen Small Hydro Project Model is a decision-making tool which
could be applied internationally. Software program follows the flow duration
curve method to calculate power generation from hydropower projects.
Hence RETScreen software gives more accurate results for small
hydropower projects especially run-of-river type.
Two case studies from Turkey were selected to test the accuracy of
RETScreen software in Turkish practice. The data given in feasibility
reports were entered into RETScreen software. Costs given by the
software were compared with the costs given in feasibility report. The
following conclusion can be written as a result of case studies.
Firstly, cost of tunnel works in feasibility reports are less than the costs
calculated by the software. Such difference is due to the inequality of the
given and calculated diameter of tunnels. Tunnel diameter calculated by
the software was decreased artificially to the value in feasibility report by
increasing the tunnel headloss factor in the software. Consequently,
decrease in tunnel diameter results decrease in tunnel costs. An
adjustment factor for tunnel diameter should be implemented into the
software program.
84
Secondly, RETScreen software calculates the cost of 154 kV transmission
line higher than the feasibility report in case study 2. Estimated unit costs
supplied by TEİAŞ for 2006 were used to determine which calculation is
more reliable. Consequently, result of RETScreen software is found to be
more accurate.
Thirdly, another huge difference comes from the cost of energy equipment.
Actual situation of electromechanical equipment market in the last quarter
of 2007 was used in the comparison. European market prices are 2 – 3
times higher than Chinese market prices. RETScreen software better
reflects the market situation of Europe. On the other side, China has the
fastest developing industry and a long term past experience in small hydro
power. By using adjustment factor for energy equipments Chinese effect
may be implicated into costs. Less investment costs yields to more
economical results.
Further the RETScreen software can be used to examine upgrading of
existing dams. Most of the hydropower potential has been already
exploited in the developed countries. Therefore, renovation and
refurbishment of existing dams is getting more important. Especially
possibility of generating electricity from irrigation and water supply dams
has been investigated widely in Europe and Canada. Similarly, economical
small hydropower potential of Turkey can be re-evaluated by upgrading
existing dams. For example, Porsuk Dam can generate 17.879 GWh of
electricity by making an investment of 5.78 million USD. The project pays
off initial investment in 5.4 years. Example of Porsuk dam given in the
study justifies the opportunity of electricity generation by making small
investment.
85
REFERENCES
Adıgüzel, Fatma and Tutuş, Ayla, “Small hydroelectric power plants in Turkey”, Proceedings of the Conference – Hydro 2002, Kiris, Turkey, 283-293, November 4-7, 2002
Altınbilek, Doğan; “Water and Land Resources Development in Southeastern Turkey”; Water Resources Development; Vol. 13; No 3; 311 – 332; 1997
Altınbilek, Doğan; “Water and Hydropower for Sustainable Development”; International Symposium: Water for Development Worldwide; İstanbul – Turkey; 104 – 114; September 7 – 11; 2005
Altınbilek, Doğan; “Hidroelektrik Gücün Geliştirilmesinde Çeşitli Darboğazlar Var”; EkoEnerji; No 5; 71 – 79; May 2007
Altınbilek, Doğan; “Sürdürülebilir Kalkınma için Su ve Su Enerjisi”; www.turseb.org/sse.doc; 2008
Arısoy, A. et al.; “Türkiye’de Enerji ve Geleceği İTÜ Görüşü”; Istanbul Technical University; April, 2007
Aydın, İ. et al.; “CE 372 Hydromechanics Lecture Notes”; Civil Engineering Department; Middle East Technical University; 2001
Bakış, Recep and Bilgin, Mehmet; “Electricity Generation with Small Hydropower Plants from Multipurpose Dams and The Example of Porsuk Dam”; International Symposium: Water for Development Worldwide; İstanbul – Turkey; 158 – 169; September 7 – 11; 2005
Bakış, Recep; “Electricity Production Opportunities from Multipurpose Dams (Case Study)”; Renewable Energy; 32; 1723 – 1738; 2007
86
Balat, H.; “A Renewable Perspective for Sustainable Energy Development in Turkey: The Case of Small Hydropower Plants”; Renewable and Sustainable Energy Reviews; 11; 2152–2165; 2007
Balat, M., “Energy consumption and economic growth in Turkey during the past two decades”; Energy Policy; 2007
Başeşme, Hidayet; “Hidroelektrik Santrallar ve Hidroelektrik Santral Tesisleri”; Volume 2; Ankara; EÜAŞ General Directorate; 2003
Bergström, David and Malmros, Christoffer; “Finding Potential Sites for Small-Scale Hydro Power in Uganda: a Step to Assist the Rural Electrification by the Use of GIS“; Lund University; Sweden; 2005
Dolsar Mühendislik; “Ayvalı Barajı ve HES Projesi”; Ankara, 2005
Dragu, C., Sels T. and Belmans R., “Small Hydro Power – State of the Art and Applications”, International conference Power Generation and Sustainable Development (AIM), Liège, Belgium, 265-270, October 8-9, 2001
Ediger, V.Ş., Huvaz, O., “Examining the sectoral energy use in Turkish economy (1980–2000) with the help of decomposition analysis”, Energy Conversion and Management, 47, 732–745, 2006
Ereke, Ünsal; “Enerjide Yabancı Akını”; Milliyet Newspaper; http://www.milliyet.com.tr; August 11, 2007
Eroğlu, Veysel, “Hidroelektrik Enerji Talebi ve Çözümleri”, General Directorate of State Hydraulic Works, http://www.dsi.gov.tr.enerji_2006.pdf, December 2007
European Commission, “Energy for the Future: Renewable Sources of Energy”, White Paper for a Community Strategy and Action Plan, ec.europa.eu/energy/library/599fi_en.pdf, November 26, 1997
European Parliament and Council, “Directive 2001/77/EC of the European Parliament and of the Council - Promotion of Electricity Produced from Renewable Energy Sources in the Internal Electricity Market”, Official Journal of the European Communities, 283, 33-40, September 27, 2001
87
European Parliament and Council; “Directive 2003/54/EC of the European Parliament and of the Council – Concerning Common Rules for the Internal Market in Electricity and Repealing Directive 96/92/EC”, Official Journal of the European Union; 176; 37-55; 2003
Feynman, Richard; “The Feynman Lectures on Physics”; Volume 1. U.S.A: Addison Wesley; 1964
General Directorate of Electrical Power Resources Survey and Development Administration (EIE);”EİE Tarafından Mühendislik Hizmetleri Yürütülen Hidroelektrik Santral Projeleri”; http://www.eie.gov.tr/turkce/HESproje/EIE_HES_PROJE_LISTESI_2007.pdf; February 2007
Goerten, John and Clement, Emmanuel; “European Electricity Market Indicators of the Liberalization Process 2005 – 2006”; Environment and Energy; 88; 2007
Goldsmith, Kurt; “Economical and Financial Analysis of Hydropower Projects”; Hydropower Development Volume 6; Norwegian Institute of Technology; 1993
Grand National Assembly of Turkey; Act No 3096; Official Newspaper; 18610, December 19, 1984
Grand National Assembly of Turkey; Act No 4446; Official Newspaper; 23786; August 14, 1999
Grand National Assembly of Turkey; Act No 4628; Official Newspaper; 24335; March 3, 2001
Grand National Assembly of Turkey; “Dönem: 21”; http://www.tbmm.gov.tr/sirasayi/donem21/yil01/ss109m.htm; 2008
Grand National Assembly of Turkey; Act No 5346; Official Newspaper; 25819 May 18, 2005
Idaho National Laboratory, “Idaho National Laboratory - Hydropower Program: Hydrofacts”, http://hydropower.inel.gov/hydrofacts/ how_hydro_works.shtml, October 25, 2007
88
International Association for Small Hydro; “International Association for Small Hydro”; http://www.iash.info; 2008
International Energy Agency (IEA) Small Hydro Power, “Small-hydro Atlas”, http://www.small-hydro.com, September 12, 2007
Jiandong, Tong and Naibo, Zheng and Xianhuan, Wang and Jing, Hai and Huishen, Ding; “Mini Hydropower”; John Wiley & Sons, 1997
Jiandong, Tong and Hicks, Charlotte, “Small Hydropower in China”, Refocus, 36-40, November – December 2004
Kaygusuz, K., “Sustainable development of hydropower and biomass energy in Turkey”, Energy Conversion and Management, 43, 1099-1120, 2002
Kılıç, Fatma and Kılıç, Durmuş; “Energy production, consumption, policies, and recent developments in Turkey”; Renewable and Sustainable Energy Reviews; 11; 1312–1320; 2007
Korkmaz, Ozan; ”A Case Study on Feasibility Assessment of Small Hydropower Scheme”; Master of Science Thesis; Middle East Technical University; Ankara; 2007
Laguna, M. Houard, E. and Cahn, M.; “European Cooperation on a New Planning Approach for Small Hydro”; Hydropower and Dams; 5, 110 – 114; 2005
Lins, Christine and Maria Laguna, “Development of Small Hydropower”, UNESCO Renewable Energy Magazine, 46-49, December 2004
Lins, Christine and Maria Laguna, “Runaway Potential: Small Hydro in Europe and Beyond”, Renewable Energy World, 248-253, July-August 2005
Marketing Working Group of the Thematic Network on Small Hydropower, “Small Hydropower Situation in the New EU Member States and Candidate Countries”, European Small Hydropower Association, September 2004
89
Mavel A.S.; “Turbine Application Range”; Green Power From Water Mavel Hydro Turbines Brochure; Czech Republic; 2007
Ministry of Energy and Natural Resources of Turkey; ”Elektrik Piyasasında Üretim Faaliyetinde Bulunmak Üzere Su Kullanım Hakkı Anlaşması İmzalanmasına İlişkin Usul ve Esaslar Hakkında Yönetmelik”; Official Newspaper; 25150; June 26, 2003
Ministry of Energy and Natural Resources of Turkey; ” Elektrik Piyasasında Üretim Faaliyetinde Bulunmak Üzere Su Kullanım Hakkı Anlaşması İmzalanmasına İlişkin Usul ve Esaslar Hakkında Yönetmelikte Değişiklik Yapılmasına Dair Yönetmelik”; Official Newspaper; 25472; May 25, 2004
Ministry of Energy and Natural Resources of Turkey; ” Enerji Piyasasında Üretim Faaliyetinde Bulunmak Üzere Su Kullanım Hakkı Anlaşması İmzalanmasına İlişkin Usul ve Esaslar Hakkında Yönetmelikte Değişiklik Yapılmasına Dair Yönetmelik”; Official Newspaper; 26428; February 8, 2007a
Ministry of Energy and Natural Resources of Turkey, “Activity Report for year 2006”, http://www.enerji.gov.tr/belge/2006%20YILI.doc, December 2007b
Morgen Stanley Capital International, “MSCI Barra: MSCI Licensed Indices”; http://www.mscibarra.com/products/indices/licd/em.html; 2008
Mott, Robert L.; “Applied Fluid Mechanics”; Pearson International Edition; Sixth Edition; 243 – 246; 2006
Özgöbek, H.; State Hydraulic Works; “Turkey”; Water for Energy: Country Reports; 125-135; 2001
Paish, Oliver, “Small hydro power: technology and current status”, Renewable and Sustainable Energy Reviews, 6, 537-556, 2002
Progress Energy; “Draft Application for License”; Yadkin-Pee Dee River Hydroelectric Project FERC No 2206; Raleigh; North Carolina; 2005
90
Ravn, Jarle; “Planning and Implementation of Hydropower Projects”; Hydropower Development Volume 5; Norwegian Institute of Technology; 1992
Retscreen International; “Retscreen Software Online User Manual”; Small Hydro Project Model; http://www.retscreen.net; 2004
Retscreen International; “Retscreen International Overview”; http://www.retscreen.net /ang/centre.php; October 30, 2007
Searcy, James K.; “Flow-Duration Curves”; Manual of Hydrology: Part 2, Low-Flow Techniques; United States Government Printing Office; 1963
State Hydraulic Works; “General Directorate of State Hydraulic Works”; http://www.dsi.gov.tr; January 8, 2008
Taylor, Simon and Upadhyay, Drona and Laguna, Maria; “Flowing to the East – Small Hydro in Developing Countries”; Renewable Energy World; 126 – 131; January – February 2006
Thematic Network on Small Hydropower; “Guide On How To Develop A Small Hydropower Plant”; European Small Hydropower Association; 2004
The International Journal on Hydropower & Dams; “World Hydro Potential and Development”; World Atlas and Industry Guide; 15-17; 2007
The International Journal on Hydropower & Dams; “Turkey”; World Atlas and Industry Guide; 156-157; 2007
Tortajada, Cecilia; “Environmental Sustainability of Water Projects”; Doctoral Thesis; Royal Institute of Technology; Stockholm; 2001
Turkish Electricity Transmission Company; “2006 Yılı Yüksek Gerilim – Çok Yüksek Gerilim Enerji Tesisleri Tahmini Birim Fiyatları”; TEİAŞ ; 2006
Turkish Electricity Transmission Company, “Activity Report 2005”, http://www.teias.gov.tr/faaliyetrap2005/istatistik/index.htm, December 2007
91
United Nations Division for Sustainable Development; “Beijing Declaration on Hydropower and Sustainable Development”; http://www.un.org/esa/sustdev/; December; 2007
Wikipedia; “Development Geography”; http://en.wikipedia.org/wiki/ Development_geography; January 8, 2008a
Wikipedia; “World Energy Resources and Consumption”; http://en.wikipedia.org/wiki/Energy_consumption#By_country; January 17, 2008b
Yanmaz, Melih A.; “Applied Water Resources Engineering”; Metu Press Publishing Company; Third Edition; 2006
Yen, Cha Thi Thu; “Towards Sustainability of Vietnam’s Large Dams Resettlement in Hydropower Projects”; Master of Science Thesis; Royal Institute of Technology; Stockholm; 2003
Yüksel, İbrahim and Yüksek, Ö. and Önsoy, H.; “An Analysis of Production Hydroelectric Energy in the Eastern Black Sea Region’s Streams”; International Symposium: Water for Development Worldwide; İstanbul – Turkey; 104 – 114; September 7 – 11; 2005
92
APPENDIX A
RESULTS OF RETSCREEN SOFTWARE FOR PROJECT 1
Figure A.1. “Energy Model” Worksheet of Project 1
93
Figure A.2. “Hydrology Analysis and Load Calculation” Worksheet of
Project 1
94
Figure A.3. “Equipment Data” Worksheet of Project 1
95
Figure A.4. “Cost Analysis” Worksheet of Project 1
96
Figure A.5. Data Sheet of “Financial Summary” (Project 1)
97
Figu
re A
.6. C
ash
Flow
of P
roje
ct 1
98
APPENDIX B
RESULTS OF RETSCREEN SOFTWARE FOR PROJECT 2
Figure B.1. “Energy Model” Worksheet of Project 2
99
Figure B.2. “Hydrology Analysis and Load Calculation” Worksheet of
Project 2
100
Figure B.3. “Equipment Data” Worksheet of Project 2
101
Figure B.4. “Cost Analysis” Worksheet of Project 2
102
Figure B.5. Data Sheet of “Financial Summary” (Project 2)
103
Figu
re B
.6. C
ash
Flow
of P
roje
ct 2
104
APPENDIX C
EFFECT OF TUNNEL DIAMETER IN COST FOR PROJECT 1
Figure C.1. Effect of Tunnel Diameter to Investment Costs (Project 1)
105
APPENDIX D
EFFECT OF TUNNEL DIAMETER IN COST FOR PROJECT 2
Figure D.1. Effect of Tunnel Diameter to Investment Costs (Project 2)
106
APPENDIX E
RESULTS OF RETSCREEN SOFTWARE FOR PORSUK DAM (Qd = Q20)
Figure E.1. “Energy Model” Worksheet of Porsuk Dam (Qd = Q20)
107
Figure E.2. “Hydrology Analysis and Load Calculation” Worksheet of
Porsuk Dam (Qd = Q20)
108
Figure E.3. “Equipment Data” Worksheet of Porsuk Dam (Qd = Q20)
109
Figure E.4. “Cost Analysis” Worksheet of Porsuk Dam (Qd = Q20)
110
Figure E.5. Data Sheet of “Financial Summary” Porsuk Dam (Qd = Q20)
111
Figu
re E
.6. C
ash
Flow
of P
orsu
k D
am (Q
d = Q
20)
112
APPENDIX F
RESULTS OF RETSCREEN SOFTWARE FOR PORSUK DAM (Qd = Q25)
113
Figure F.1. “Energy Model” Worksheet of Porsuk Dam (Qd = Q25)
Figure F.2. “Hydrology Analysis and Load Calculation” Worksheet of
Porsuk Dam (Qd = Q25)
114
Figure F.3. “Equipment Data” Worksheet of Porsuk Dam (Qd = Q25)
115
Figure F.4. “Cost Analysis” Worksheet of Porsuk Dam (Qd = Q25)
116
Figure F.5. Data Sheet of “Financial Summary” Porsuk Dam (Qd = Q25)
117
Figu
re F
.6. C
ash
Flow
of P
orsu
k D
am (Q
d = Q
25)
118
APPENDIX G
RESULTS OF RETSCREEN SOFTWARE FOR PORSUK DAM (Qd = Q30)
Figure G.1. “Energy Model” Worksheet of Porsuk Dam (Qd = Q30)
119
Figure G.2. “Hydrology Analysis and Load Calculation” Worksheet of
Porsuk Dam (Qd = Q30)
120
Figure G.4. “Equipment Data” Worksheet of Porsuk Dam (Qd = Q30)
121
Figure G.4. “Cost Analysis” Worksheet of Porsuk Dam (Qd = Q30)
122
Figure G.5. Data Sheet of “Financial Summary” Porsuk Dam (Qd = Q30)