The invention of spotting oligonucleotide probes at a high density to glass or nylon arrays1 almost two decades ago not only transformed the study of gene expression but also accelerated the advent of bioinformatics as a mainstream component of biology. The immobilization of probes from a reference genome rather than from the tested sample, as in northern blotting, and the miniaturi-zation of this procedure allowed for the pre-fabrication of arrays that could be distributed and used for RNA assays on almost any sample anywhere. Many labora-tories got their own instruments, and with the cost of commercial chips decreasing and protocols stabilizing, a new generation of laboratory technicians oversaw an explosion of its use.
Because the analysis of microarray data required more computational resources and expertise than low-throughput technologies, data analysis and bioinformat-ics became an integral part of every microarray-based study. Community efforts such as the formation of the Microarray Gene Expression Data (MGED) Society in 1999 (REF. 2) and the development of standardized vocabularies such as Gene Ontology (GO)3 set the stage for large-scale gene expression data sharing and use in research beyond the original experiment. Development of data analysis methods and environments such as Bioconductor4 benefited from the emergence of a com-munity in which the early adopters of the experimental technique were also actively involved in bioinformatics. The adoption of the reporting requirement guidelines such as Minimum Information About a Microarray Experiment
(MIAME)2 and the establishment of public reposito-ries for microarray data — Gene Expression Omnibus (GEO) at the US National Center for Biotechnology Information (NCBI)5 and ArrayExpress at the European Bioinformatics Institute (EBI)6 — set the stage for gene expression data sharing and reuse. As of 2012, GEO and ArrayExpress contain data from more than 30,000 studies with more than a million assays.
In recent years, high-throughput-sequencing-based gene expression assays (namely, RNA sequencing (RNA-seq))7 have gradually been taking ground from the gene expression microarrays, although currently microarrays are still the main contributors of gene expression data to the public repositories.
In this Review, we discuss the range of gene expres-sion databases and the various ways in which publicly archived gene expression data are being used in support of new studies, in combination with other data, in large meta-analyses or for refinement and processing to create added-value biology data resources. We highlight approaches that can be used and areas in which future developments would be useful.
Databases of gene expression dataGenome-wide gene expression data are now served through a large variety of resources, including primary archives, added-value databases and databases with a specific topical interest (for example, a disease, species or tissue). A selection of resources is provided below and summarized in TABLE 1.
EMBL–EBI, Wellcome Trust Genome Campus, Hinxton, Cambridge CB10 1SD, UK.Correspondence to A.B.e-mail: [email protected]:10.1038/nrg3394Published online 27 December 2012
MicroarrayA solid surface slide on which a collection of microscopic DNA spots representing specific DNA sequences of genomic regions are attached and to which sample DNA fragments can hybridize. Microarrays are used to measure the expression levels of large numbers of genes simultaneously, to genotype multiple regions of a genome or for other high-throughput assays.
Reuse of public genome-wide gene expression dataJohan Rung and Alvis Brazma
Abstract | Our understanding of gene expression has changed dramatically over the past decade, largely catalysed by technological developments. High-throughput experiments — microarrays and next-generation sequencing — have generated large amounts of genome-wide gene expression data that are collected in public archives. Added-value databases process, analyse and annotate these data further to make them accessible to every biologist. In this Review, we discuss the utility of the gene expression data that are in the public domain and how researchers are making use of these data. Reuse of public data can be very powerful, but there are many obstacles in data preparation and analysis and in the interpretation of the results. We will discuss these challenges and provide recommendations that we believe can improve the utility of such data.
Nature Reviews Genetics | AOP, published online 27 December 2012; doi:10.1038/nrg3394 R E V I E W S
ArrayExpress (from EBI) Any functional genomic data http://www.ebi.ac.uk/arrayexpress 8
Gene Expression Omnibus (GEO; from NCBI)
Any functional genomic data http://www.ncbi.nlm.nih.gov/geo 9
DDBJ Omics Archive Any functional genomic data http://trace.ddbj.nig.ac.jp/dor 10
Stanford Microarray Database
Any functional genomic data http://smd.stanford.edu 104
Added-value databases
Gene Expression Atlas Gene expression in different cell types, organism parts, developmental stages, disease states, sample treatments and other biological or experimental conditions
Minimum Information About a Microarray Experiment(MIAME). A guideline for information that is necessary for the unambiguous interpretation of the results of the experiment, potentially allowing the reproduction of the experiment. MIAME postulates that raw and processed data, sample annotation, array feature annotation, relationship between the samples used in the experiment, arrays and data files, the overall description of the experiment and experimental variables must be given in a usable format to make the results of a microarray experiment interpretable.
Gene Expression Omnibus(GEO). A public functional genomics data repository supporting MIAME-compliant data submissions at the US National Center for Biotechnology Information accepting array- and sequence-based data.
ArrayExpressA MIAME-compliant archive of functional genomics data at the European Bioinformatics Institute. It is one of the international public data archives recommended by scientific journals for depositions of microarray or high-throughput sequencing data related to publications.
High-throughput sequencingDNA sequencing technologies that parallelize the sequencing operations, thus achieving several magnitudes higher throughput than the traditional sequencing methods based on processes invented by Fred Sanger.
RNA sequencing(RNA-seq). The use of high-throughput sequencing technologies applied to cDNA molecules obtained by reverse transcription from RNA, or sequencing RNA directly, in order to get information about the RNA content of a sample.
Meta-analysisRefers to methods focused on contrasting and combining results from different studies to identify common patterns and improving the signal in data by combining multiple studies.
Primary archives. Primary archives serve as repositories for most types of gene expression and other functional genomic data that typically relate to publications in peer-reviewed journals. Many major journals, includ-ing Science and Nature Publishing Group journals, now require MIAME-compliant data submissions to one of the international data archives — ArrayExpress at EBI8, GEO at NCBI9 and DNA Data Bank of Japan (DDBJ) Omics Archive10 — before the final acceptance of the manuscript (even though MIAME compliance is not rigorously enforced). A recent study estimated that 25% of all published microarray studies deposited their data in a public archive and that the trend was increasing so that for recent studies, the corresponding number is approximately 45%11. Although most of the content in the archives is made up from microarray data, next-generation sequencing experiments, such as RNA-seq, are rapidly gaining in prominence, constituting 15% of new experiments (that is, studies) submitted in 2012, as compared to 8.0% in 2011 and 3.4% in 2009.
ArrayExpress data reveal that one-third of gene expression experiments that are currently available in public archives are human studies and approximately one-quarter of the data are from mice. The contribu-tion from plant studies is less than 20%, most of which are from Arabidopsis thaliana. The average size of a microarray experiment is just below 30 assays (that is, arrays) per published study, and this has not sub-stantially increased over the past 5 years. The size of individual experiments vary widely: the number of studies containing more than 1,000 assays has increased considerably over the past few years, and this number includes large-scale experiments in which gene expres-sion and genotyping array studies are combined. The size of a typical RNA-seq experiment is still consider-ably smaller, just over ten assays per experiment, most likely owing to the higher cost. Currently, researchers seem to be choosing RNA-seq technology mainly to study questions such as new transcript discovery, gene structure or allele-specific expression, whereas micro-arrays are still the tool of choice in experiments that require larger number of samples. In this Review, we mainly focus on ArrayExpress data, but given that the ArrayExpress database imports most of the data that are in GEO12, we believe these numbers are representa-tive of the general trends. For comparisons, we refer to the citations listing, in which GEO tracks citations from depositions and third-party data usage.
Gene expression data are most useful in the context of other molecular data, such as genotype data, DNA methylation data and protein expression data. Such so-called multi-omics experiments, in which the same sample is studied by several methods, are becoming increasingly popular. In the primary archives, there are efforts to link multi-omics data from the same sample in different repositories through centralized BioSample databases at NCBI13 and EBI14 so that a user can easily get access to all of the related data sets.
In 2011, data from approximately 800 new experi-ments were directly submitted to ArrayExpress, com-prising more than 20,000 assays and 200 GB of data.
During the same period, 50 GB of data were down-loaded from ArrayExpress daily, and the database was accessed from more than 30,000 unique Internet proto-col (IP) addresses every month. The database is there-fore accessed by approximately 1,000 different users daily, each of whom download 50 MB of data, which is roughly one-quarter of an experiment. To use data from primary archives, a certain expertise in bioinformatics is needed — raw or processed data must be down-loaded, and various data analysis environments, such as Bioconductor, must be used to analyse these data either independently or in combination with their own data. Added-value databases make the biological content of the expression data more accessible to non- bioinformaticians and are among the most important consumers of primary data archives.
Added-value databases. Added-value databases extract information from primary data to answer questions such as ‘in which samples is a particular gene expressed?’ or ‘which genes are differentially expressed between the normal state and a particular disease state?’ and make the answers available through user interfaces that are tailor-made for genes, diseases or other direct biologi-cal or biomedical questions (TABLE 1). The added value comes from data processing, additional annotation, mapping to standardized vocabularies or ontologies (such as the Experimental Factor Ontology15) and analy-sis to extract gene expression profiles and other results from primary data. The quality of the analysis and the power to combine many samples depends on the degree, quality and standardization and harmonization of sam-ple and experiment information provided by the original submitters and added by curators. The more effort that is put into data mining and annotation, the more potential the database has to contain useful information.
At the EBI, the Gene Expression Atlas is one of the largest added-value gene expression databases, currently containing data from more than 3,000 studies from the ArrayExpress archive16. These studies cover nearly 100,000 assays that are mostly microarray-based but that also include data from more than 50 different RNA-seq-based studies. The Gene Expression Atlas allows the user to make queries such as ‘in which conditions is gene X significantly differentially expressed?’, ‘which genes are overexpressed in lung cancer?’ or a combina-tion of such questions. A similar approach is taken in GeneChaser17, in which the user can retrieve, for a given gene, a ranked list of differential expression comparisons between experimental conditions from a large number of public experiments. Absolute expression is addressed by the Gene Expression Barcode algorithm18,19, which uses large sets of experiments from public archives to estimate gene-specific background distributions for three commonly used array types and to call genes as expressed or not expressed in different cell types or in uploaded data files.
A different set of added-value databases focuses on serving information about gene expression regulation, either derived by inferring networks from gene expres-sion data or by focusing on experiments that directly
NormalizationIn relation to microarray and other high-throughput data, normalization usually refers to data transformations that remove systematic noise and that make data combined from several assays mutually comparable.
measure interactions or regulatory features. For example, co-expression network databases are available for bar-ley20, rice (OryzaExpress)21, A. thaliana22,23,24 and other species (COXPRESDB)25. ProfileChaser26 allows query-ing to find whole data sets with differential expression patterns that are similar to the patterns in an experiment of interest. Databases that specifically query experi-ments that provide interaction information include Cistrome, which is based on chromatin immunopre-cipitation followed by microarray (ChIP–chip) data and ChIP followed by high-throughput sequencing (ChIP–seq) data27 and miRGator for microRNA expression and its regulation of mRNA28. Another different type of added value to public data is provided by M2DB29, which allows the user to query sample groups and conditions across a large set of public experiments and prepares the data for meta-analysis, including normalization, filtering out low-quality arrays, providing statistics for meta-analysis and combining arrays to a single large data matrix.
Topical databases. A different class of databases extracts and analyses expression data only for a certain sample domain, such as the Pancreatic Expression Database30,31, the Parkinson’s disease gene expression database (ParkDB)32, the Glaucoma Discovery Platform33, Oncomine34 and GCOD35 for cancer data sets and GUDMAP for the genitourinary system36. Sometimes, these topical databases also take their own submissions, directly importing studies from contributing research teams. In particular, topical databases for specific species are important and benefit from curators who have highly specialized expertise in the domain of the database. For example, functional genomics in plants is served by several databases, such as PLEXdb for various plant species37 or TFGD specifically for tomato data38. A well-known topical database is the Symatlas from the Genomics Institute of the Novartis Research Foundation, which is entirely based on two microarray-based studies of gene expression across 79 human and 61 mouse tissues39 that have now become a resource provided through the BioGPS portal40.
A particular type of topical database focuses on anatomical mapping of gene expression or expression data from in situ experiments, including images from tissue stainings. The mouse community is served by the Mouse Genome Informatics group at The Jackson Laboratory, which maintains a database of in situ data for gene expression during mouse development called GXD41. It is linked to EMAGE, the Edinburgh Mouse Atlas42, which stores imaging data for develop-mental stages in mice. Data for zebrafish, Drosophila melanogaster, medaka and mice are stored in 4DXpress43, which allows searches for genes, developmental stage and anatomical structure that are specific for these species. aGEM44 integrates data from several such sources for mice and humans.
Integrated resources. Many databases add value by inte-grating public expression data with other data types, such as genetic or functional annotation, pathways and networks, phenotypes, genome annotation, drug
interactions, anatomical information and literature-based text mining. For example, IntOGen combines expression data and genomic alteration data for can-cer45. The Connectivity Map46 uses microarray data to integrate drug response and disease, whereas can-SAR47 integrates data from sources as wide as gene expression, drug response, protein interactions and protein three-dimensional structure. Large collections of public data have also been used to build a framework for diagnosing disease on the basis of a gene expression profile from a patient48. Other databases function as portals for many types of data for a specific domain or species, including WormBase49 and the Mouse Genome Informatics (MGI) resources at The Jackson Laboratory; these link external data sources or retrieve the data directly.
Annotation, standards and access controlIn 2009, Ioannides and colleagues50 attempted to rep-licate the finding of 18 microarray-based studies published in Nature Genetics during 2005–2006. The authors replicated two studies ‘in principle’ and six ‘partially’, whereas ten were not reproduced, despite the fact that all were submitted and retrieved from GEO or ArrayExpress. The main reason for the lack of reproduc-ibility was the unavailability of all relevant data or meta-data: that is, a lack of MIAME compliance. The authors concluded that the repeatability of published microar-ray studies is apparently limited and recommended that more strict publication rules enforcing public data avail-ability and explicit description of data processing and analysis should be considered.
The Ioannides50 study brought deserved attention to the importance of metadata. To analyse a data set and to draw any conclusions from the results, we need to know what the samples were, how they were prepared and how the experiment was designed and carried out. Today, some of the issues identified in this study have been addressed. For instance, we now see almost 100% of new experiment submissions to ArrayExpress pro-viding raw data and improved completeness in provid-ing protocols. Nevertheless, annotation of samples and experimental conditions are often still minimal.
The ability to test the reproducibility of large-scale studies is particularly important if such data are to be used in clinical practice or trials. An extreme case of failure is a recent clinical trial that was initiated on the basis of microarray studies of gene expression in cancer cell lines; the trial was stopped51 only after independent researchers failed to reproduce the findings of the origi-nal studies52 and found serious errors in the analysis. This case exemplifies the importance of public archives as vehicles to facilitate reproducible research and empha-sizes the need for MIAME compliance and, in particular, sufficient annotation of experimental and computational methods. Recently, there have been calls to submit for scrutiny not only the raw data but also the code used in the analysis53.
Ensuring that sufficient metadata are provided to make gene expression data reusable and results repro-ducible is a hard problem to deal with: more stringent
Minimum Information about a Sequencing Experiment(MINSEQE). A formulation of the information that is necessary to interpret the results of a sequencing experiment unambiguously and potentially to reproduce the experiment. MINSEQE is an adoption of Minimum Information About a Microarray Experiment guidelines to functional genomics experiments based on RNA sequencing and other high-throughput-sequencing-based functional genomics experiments.
requirements for detail in submissions often result in fewer experiments being submitted. Often, the per-son submitting a data set is different from the person designing and carrying out an experiment; for example, the person submitting the data may be the group bio-informatician who does not necessarily have full knowl-edge of all the experiment details. Required fields will be filled in, but this also increases the risk of errors in annotation, and these are harder to spot and more dif-ficult to address than absence of annotation and blank fields. We believe that the best way to improve this is by providing tools that help researchers to annotate their experiments easily. Thus, annotation and data management tools such as Annotare54, ISA-creator55 and others56 are likely to have a positive impact on data reusability and reproducibility of results.
For microarray data, the MIAME standards are well-established, even though they are not rigorously enforced, but the reporting standards for sequencing-based gene expression data (obtained by RNA-seq) are almost non-existent. Guidelines for RNA-seq data submissions — called Minimum Information about Sequencing Experiments (MINSEQE; BOX 1) — that are similar to the MIAME standard have been pro-posed by the Functional Genomics Data Society, but we are not aware of any journal that has formally adopted them. There may be several reasons for this: first, high-throughput sequencing is used in so many different ways that it is not always obvious whether MINSEQE guidelines are applicable to the particular study (by contrast, in the early days of microrrays, the applications almost exclusively concerned differential gene expression); second, as raw RNA-seq data may identify the individuals, for human data, legal restric-tions may apply, and unfortunately these are some-times used as an excuse not to provide data. However, these problems are not insurmountable, and the jour-nals should be encouraged to adopt MINSEQE and other relevant guidelines to prevent valuable data from being lost.
Using third-party gene expression dataThere are three main types of use for public gene expres-sion data in research: to study a biological question; to develop and evaluate a new method; and to integrate, annotate and analyse primary data in order to build a new (added-value) data resource. Arguably, the develop-ment of new methods and the building of added-value resources have the most value if they help in the study of biological questions. It is a difficult problem to esti-mate third-party usage of public data and its impact on new research. One study estimated that every ten data sets submitted to GEO contribute to four new papers in the 3 years following deposition57. To assess how archived gene expression data have recently been used, we analysed publications from 2011 that either tagged ‘ArrayExpress’ or cited any of the five ArrayExpress publications in the Nucleic Acid Research journal database issues6,58,59,60,8. This approach was chosen to find a large enough number of studies using pub-lic archive data that we could easily trace. We filtered to exclude papers that did not directly use data, and this yielded 90 studies that we categorized by how they used the data (listed in Supplementary information S1 (table)). A summary of the results of this analysis is presented in BOX 2. Although we selected papers that used ArrayExpress data, we expect that similar results would be found from similar analyses for GEO, because of the large degree of overlap and data sharing between the resources or other large public gene expression databases.
When data are reused, the original study that has generated the data appears to be almost always credited in some way, but there are no easy ways to assess the accumulated reuse of data by third-party added-value databases. We also note that fairly few studies using archived data cite the primary archive itself. Therefore, as indicated by the download statistics mentioned above and by anecdotal evidence from publications reusing expression data (BOX 2), the total number of studies in 2011 that reused even just ArrayExpress
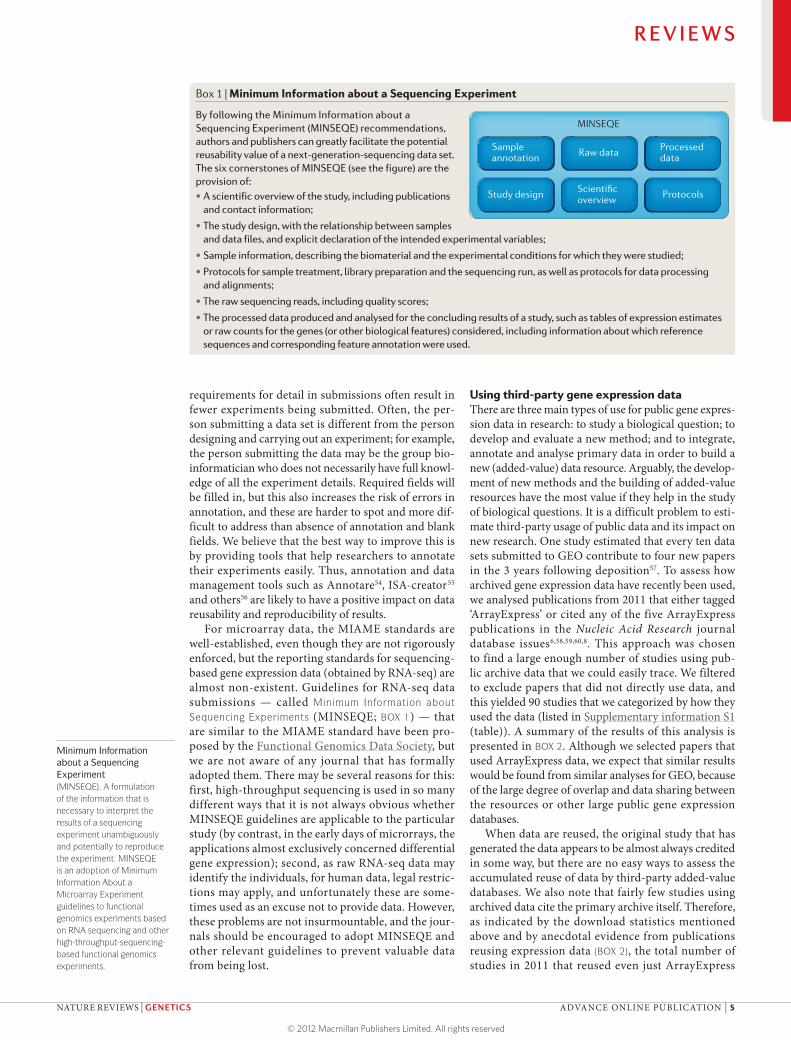
Box 1 | Minimum Information about a Sequencing Experiment
By following the Minimum Information about a Sequencing Experiment (MINSEQE) recommendations, authors and publishers can greatly facilitate the potential reusability value of a next-generation-sequencing data set. The six cornerstones of MINSEQE (see the figure) are the provision of:•A scientific overview of the study, including publications
and contact information;
•The study design, with the relationship between samples and data files, and explicit declaration of the intended experimental variables;
•Sample information, describing the biomaterial and the experimental conditions for which they were studied;
•Protocols for sample treatment, library preparation and the sequencing run, as well as protocols for data processing and alignments;
•The raw sequencing reads, including quality scores;
•The processed data produced and analysed for the concluding results of a study, such as tables of expression estimates or raw counts for the genes (or other biological features) considered, including information about which reference sequences and corresponding feature annotation were used.
data is likely to be much larger than the 90 papers that we considered. We believe that this is because the large archives have become ubiquitous for finding public data, and they are not referenced themselves even when considerable parts of a study or resource are based on data obtained from them. As long as the data them-selves are traceable by accession number for the sake of reproducibility and credit to the original submit-ters, we do not see this as a problem. It has been sug-gested that using digital object identifiers (DOIs) may help to improve tracking the use of primary data and acknowledging their authors.
Reusing public data as a basis for new biological studies: raw data. In our survey, nearly one in four studies used public data to address a biological problem without generating new data from samples. Such studies draw on the power in numbers: by combining many data
sets, the power to detect weak signals is improved, and the large quantity of samples already assayed in condi-tions that are relevant to the biological question would often be costly and time consuming to obtain in a single laboratory. Data can be combined at the quantitative raw data level or by a meta-analysis that combines, for all participating studies, effect sizes or statistical sig-nificance levels between sample groups or simply the resulting gene lists.
Combining data from different studies at the raw data level is not straightforward, as biases — for exam-ple, from probe sequence, array platform and labora-tory effects — can have a strong impact on the data. Therefore, combining and normalizing raw probe level data across array platforms can be done only if such biases are accounted for61. Combining raw data from the same platform is more straightforward. A pipeline for combining raw data is described in BOX 3.
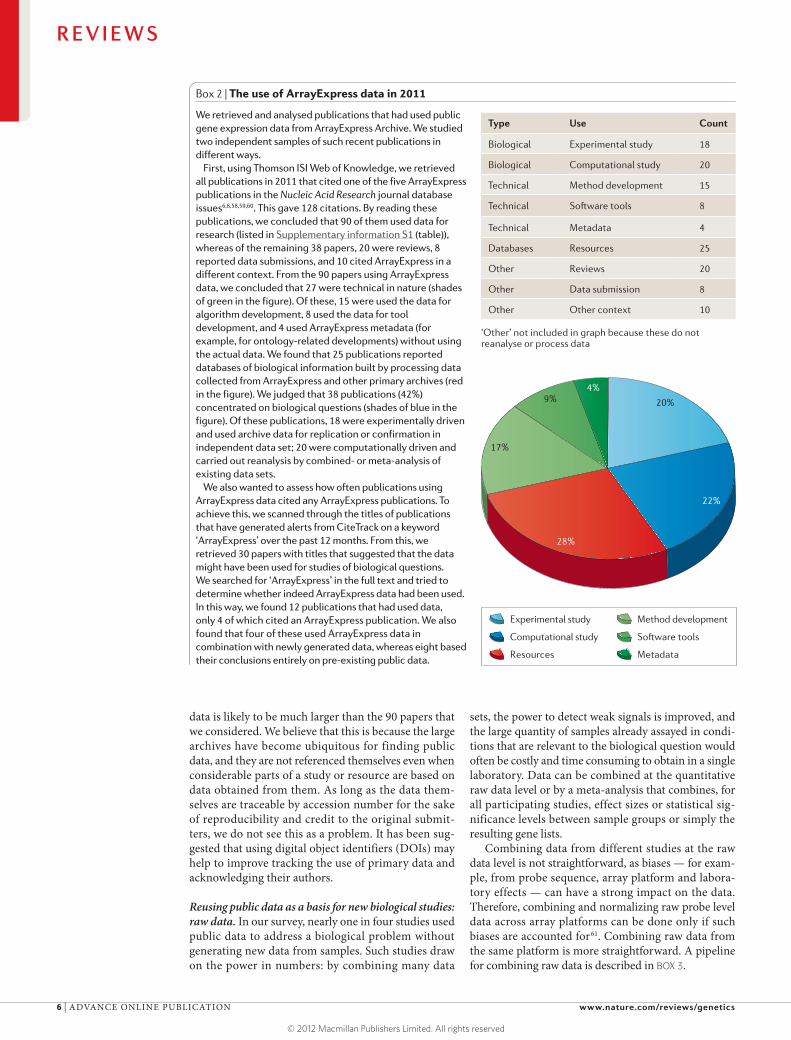
Box 2 | The use of ArrayExpress data in 2011
We retrieved and analysed publications that had used public gene expression data from ArrayExpress Archive. We studied two independent samples of such recent publications in different ways.
First, using Thomson ISI Web of Knowledge, we retrieved all publications in 2011 that cited one of the five ArrayExpress publications in the Nucleic Acid Research journal database issues6,8,58,59,60. This gave 128 citations. By reading these publications, we concluded that 90 of them used data for research (listed in Supplementary information S1 (table)), whereas of the remaining 38 papers, 20 were reviews, 8 reported data submissions, and 10 cited ArrayExpress in a different context. From the 90 papers using ArrayExpress data, we concluded that 27 were technical in nature (shades of green in the figure). Of these, 15 were used the data for algorithm development, 8 used the data for tool development, and 4 used ArrayExpress metadata (for example, for ontology-related developments) without using the actual data. We found that 25 publications reported databases of biological information built by processing data collected from ArrayExpress and other primary archives (red in the figure). We judged that 38 publications (42%) concentrated on biological questions (shades of blue in the figure). Of these publications, 18 were experimentally driven and used archive data for replication or confirmation in independent data set; 20 were computationally driven and carried out reanalysis by combined- or meta-analysis of existing data sets.
We also wanted to assess how often publications using ArrayExpress data cited any ArrayExpress publications. To achieve this, we scanned through the titles of publications that have generated alerts from CiteTrack on a keyword ‘ArrayExpress’overthepast12 months.Fromthis,weretrieved 30 papers with titles that suggested that the data might have been used for studies of biological questions. We searched for ‘ArrayExpress’ in the full text and tried to determine whether indeed ArrayExpress data had been used. In this way, we found 12 publications that had used data, only 4 of which cited an ArrayExpress publication. We also found that four of these used ArrayExpress data in combination with newly generated data, whereas eight based their conclusions entirely on pre-existing public data.
Nature Reviews | Genetics
20%
22%
28%
17%
9%4%
Computational study
Experimental study
Resources
Software tools
Method development
Metadata
Type Use Count
Biological Experimental study 18
Biological Computational study 20
Technical Method development 15
Technical Software tools 8
Technical Metadata 4
Databases Resources 25
Other Reviews 20
Other Data submission 8
Other Other context 10
‘Other’ not included in graph because these do not reanalyse or process data
Global analyses of combined sets of raw data can be used to draw conclusions about the general properties of expression in large sample groups, such as broad tran-scriptional patterns. For example, one study combined 5,372 arrays from 369 different sample type categories and used principal component analysis (PCA) and clus-ter analysis to find global transcriptome patterns62. This showed blood cells and solid tissue as the main axis of segregation, with normal or neoplastic sample charac-teristics on the second principal axis. It also revealed that most cell line transcriptomes are broadly similar to each other and different from the respective primary tissues. A study of 3,030 samples from the Affymetrix HG-U133+2 platform similarly showed segregation between blood-derived cells and solid tissue, alongside the brain as a third group63.
A data set of 81 samples from white blood cells and 1,463 samples from other organs measured on the
Affymetrix HG-U133A platform was used to study correspondence in expression between the two tissue groups64. It showed that large portions of the transcrip-tome of white blood cells resemble those of other organs, which is consistent with observations that most genes are expressed in most tissues and that only a small fraction of the genes significantly change their expression level62. A similar study used expression data to estimate the tis-sue of origin for metastatic tumours with unknown pri-mary site, using classifiers trained from 5,577 samples from 56 cancer types and 1,667 normal samples from 44 tissues65. Studies such as these show that large data sets covering a diverse set of sample types and experimen-tal conditions can be extremely powerful in addressing questions for which the global transcriptomic profile is a relevant measurement for comparing cellular states. The larger the data set and the more diverse the conditions, the more ‘state space’ of expression is sampled. Similar analyses have been used to compare global gene expres-sion patterns in different species. For example, a study with cross-experiment normalized data both for mice and for humans showed that orthologous genes in mice and humans show similar patterns of tissue specificity for global gene expression66.
Reusing public data as a basis for new biological studies: meta-analysis of summary data. Summary-level data, such as P values or effect sizes from compared condi-tions, can be combined in meta-analyses. Such analysis is the most popular way of using third-party data because of the flexibility to include data from many different array platforms. Meta-analysis of gene expression has been applied to a wide range of biological questions using the combined power of thousands of samples. An increasing number of new studies rely on meta-analysis of public data sets for the detection of signals that could not be found in any of the individual data sets. Such meta-analysis studies and their methods have been com-prehensively reviewed elsewhere67,68,69, and a summary of the steps for such analysis is presented in BOX 4.
For example, a study on Down’s syndrome com-bined case–control data from 45 experiments to determine a set of 324 differentially expressed genes, of which 79 had potential neurocognitive effects70. In the context of cancer, a study combined 28 microar-ray data sets from prostate, bladder and renal cancers (from ArrayExpress, GEO and Oncomine) to detect urinary biomarkers specific for prostate cancer71. Other examples include a study of 892 breast cancer samples from ten data sets with poor or good prognosis that demonstrated the importance of tumour subtyping for prognosis72, identification of genes involved in metas-tasis and hypoxia73 and identification of enzyme gene regulatory interactions74. Such studies demonstrate the power in using public data for the discovery of sig-nals that are too weak to be detected in a single new experiment.
Both meta-analysis of summary results and merging of raw data to construct large combined data sets are used for the detection of weak signals. Which of the two approaches is used largely depends on the experiments
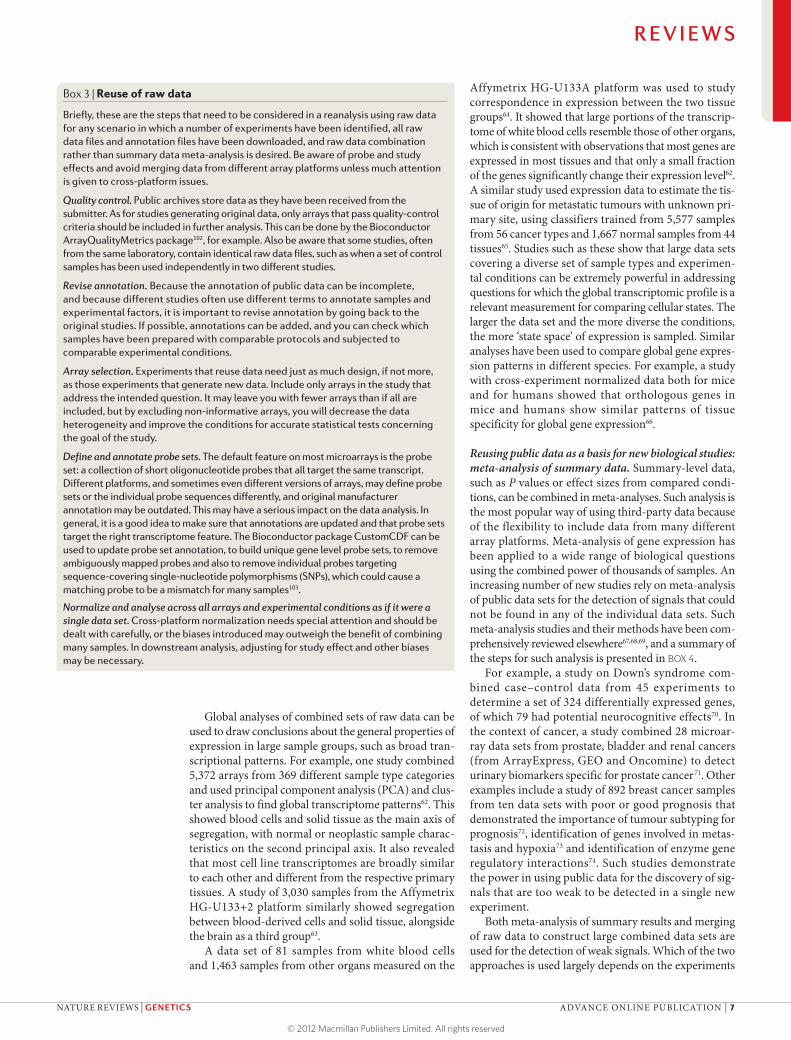
Box 3 | Reuse of raw data
Briefly, these are the steps that need to be considered in a reanalysis using raw data for any scenario in which a number of experiments have been identified, all raw data files and annotation files have been downloaded, and raw data combination rather than summary data meta-analysis is desired. Be aware of probe and study effects and avoid merging data from different array platforms unless much attention is given to cross-platform issues.
Quality control. Public archives store data as they have been received from the submitter. As for studies generating original data, only arrays that pass quality-control criteria should be included in further analysis. This can be done by the Bioconductor ArrayQualityMetrics package102, for example. Also be aware that some studies, often from the same laboratory, contain identical raw data files, such as when a set of control samples has been used independently in two different studies.
Revise annotation. Because the annotation of public data can be incomplete, and because different studies often use different terms to annotate samples and experimental factors, it is important to revise annotation by going back to the original studies. If possible, annotations can be added, and you can check which samples have been prepared with comparable protocols and subjected to comparable experimental conditions.
Array selection. Experiments that reuse data need just as much design, if not more, as those experiments that generate new data. Include only arrays in the study that address the intended question. It may leave you with fewer arrays than if all are included, but by excluding non-informative arrays, you will decrease the data heterogeneity and improve the conditions for accurate statistical tests concerning the goal of the study.
Define and annotate probe sets. The default feature on most microarrays is the probe set: a collection of short oligonucleotide probes that all target the same transcript. Different platforms, and sometimes even different versions of arrays, may define probe sets or the individual probe sequences differently, and original manufacturer annotation may be outdated. This may have a serious impact on the data analysis. In general, it is a good idea to make sure that annotations are updated and that probe sets target the right transcriptome feature. The Bioconductor package CustomCDF can be used to update probe set annotation, to build unique gene level probe sets, to remove ambiguously mapped probes and also to remove individual probes targeting sequence-covering single-nucleotide polymorphisms (SNPs), which could cause a matching probe to be a mismatch for many samples103.
Normalize and analyse across all arrays and experimental conditions as if it were a single data set. Cross-platform normalization needs special attention and should be dealt with carefully, or the biases introduced may outweigh the benefit of combining many samples. In downstream analysis, adjusting for study effect and other biases may be necessary.
that the researcher has identified to be informative. In particular, meta-analysis is powerful when the question can be addressed by statistical tests on comparable con-ditions in each of the data sets. For example, two stud-ies that include liver samples from healthy individuals and those with a specific disease could be well-suited for a meta-analysis considering differential expression in healthy versus disease states. However, if the individuals with disease were on medication in the first experiment but not in the second, the two groups of samples with disease would not be completely comparable because of the confounding effect of the drug. Such differences between sample treatments in different experiments are almost unavoidable or may not be strongly biasing for the intended question. The degree of heterogeneity can be estimated by using, for example, Cochran’s Q statis-tic75, and the analysis can be adjusted accordingly. There are a number of R or Bioconductor packages for meta-analysis: for example, the MetaOmics suite76, metaMA77, GeneMeta78 and MetaArray79.
Supporting data for new experimental studies. In approximately 25% of the studies that we reviewed, the data from public resources were used in combination with new data, typically to provide a replication set from an independent source. In such an approach, a single data set or a meta-analysis of a group of data sets can be used. Examples of the studies include investigation of gene and protein interaction networks80,81,82, regulatory mechanisms in cancer83,84,85, co-expression and tran-scription regulation in plants86,87 and gene evolution in A. thaliana88. The analysis methods are often straight-forward and comparable to those that were applied when the data were analysed in the original studies.
Sometimes public data are combined with newly gen-erated data to increase the number of samples covered. For example, a study addressing differences between colon and rectum tumours combined data from a newly generated set of expression data from 284 samples with two public data sets covering 276 samples, to demon-strate small but consistent differences in gene expression profile between the two sites89.
Merging raw data and normalizing across many data sets on the same platform can, as we have shown, result in studies addressing gene expression at the sample level for a large number of samples and conditions. But it is important to bear in mind that normalization across raw data from many experiments does not guarantee that batch or laboratory effects across different studies are eliminated, and for better control of between-laboratory heterogeneity, summary-level meta-analysis is often a better option.
Evaluating analysis methods. When assessing the per-formance of a newly developed software tool or statis-tical method, public data archives can provide ample material for testing. Algorithms that use archived data for performance evaluation address, for example, funda-mental methods of array data processing and transcript quantification61, regulatory mechanisms90,91,92, gene func-tion93, RNA interference effects94, cancer prognosis95, gene ranking96 or differential expression97. However, it is not always easy to assess the value of a new method in terms of providing biological insights. For instance, new methods that simply work faster may become valuable at some later time when the amount of data to be analysed has substantially increased. Therefore, it would be unfair to question the value of a new method just because it has not immediately provided a new biological result.
It should also be pointed out that a rich source of experiments to use for method evaluation is not all that is needed. Often, it is not straightforward to determine standards with which methods can be compared, and although a method may be deemed to be superior over others using some criteria for a given data set, a change of test set could lead to different conclusions. In particu-lar, this is the case for small sample test sets98 and may be addressed by using a large number of test data sets and a diverse array of experimental parameters.
Reuse of RNA-sequencing dataMaximizing reuse of sequencing-based gene expres-sion data can have an even greater impact than reus-ing microarray data. The probe effect in microarrays
Box 4 | Meta-analysis of summary-level data
Meta-analysis of summary-level data, such as P value, effect size or gene rank, is well-suited for the analysis of data from experiments that address the same specific test scenario (such as genes that are differentially expressed between sample states A and B). It is also recommended when the included studies are done on different array platforms. For a more detailed discussion of meta-analysis and of software packages implementing the analysis, we refer to the studies cited in the main text. The main steps in meta-analysis of summary-level data are schematically as follows.
Quality control, annotation revision, array selection and probe set definition and annotation. These steps are carried out in the same manner as when raw data are combined (BOX 3).
Normalization. Each data set is individually normalized.
Summary statistics. For each experiment, calculate summary-level statistics for each gene, including a measure of effect size (such as fold change) and significance (P value).
Estimate heterogeneity and combine summary-level data. Typically, P values are log-transformed, summed and weighted by the number of samples in the contributing experiment and its fraction of the entire combination. Effect size combinations either assume a fixed-effects model, in which there is a true effect size constant across experiments, with added measurement noise, or a random effects model, which treats the effect size as a random variable with heterogeneity between experiments.
ELIXIRA life sciences infrastructure project that unites Europe’s leading life sciences organizations in managing and safeguarding the massive amounts of data being generated every day by publicly funded research.
(described above) makes comparison of expression levels of different genes in the same sample difficult, if not impossible. Therefore, microarray experiments are primarily used only to compare the expression of the same gene across different samples. This makes the pos-sibilities for integration of microarray data sets rather limited, even when these data are generated on the same microarray platform. In sequencing-based technologies, the probe effects are avoided, so it is possible to some degree to assess and to compare the absolute expression levels of different genes in the same sample. Moreover, after a simple normalization, such as ‘reads per kilobase per megabase of reads’ (RPKM or FPKM for pair-end RNA-seq), these data are to some degree comparable quantitatively across different studies. However, this is not universally accepted, as high-throughput sequenc-ing suffers from other well-documented biases, such as nucleotide sequence bias, owing to the priming method, variation in PCR amplification depending on GC con-tent and transcript length bias99. It is also not clear how RPKM values from experiments with different sequenc-ing depth can be combined. Nevertheless, an optimistic view on RNA-seq technology is that as it develops, abso-lute measurements of gene expression levels will become possible. If so, the reusability and cross-study integration of such gene expression will be fairly straightforward if sufficient metadata are available. An illustrative exam-ple of a study that reused RNA-seq data is one in which gene expression in human populations was analysed to estimate alternative splicing variability and compare that to gene expression variability in the same populations100.
However, protocols and methods for RNA-seq data generation and analysis are still rapidly developing and changing, making the reuse or combination of sequenc-ing data sets non-trivial. The many parameters in the protocols for library preparation and sequencing, such as the methods for priming, fragmentation or amplifica-tion, have strong effects, and experiments that use dif-ferent protocols should be carefully controlled for the effects of such differences if combined. Until RNA-seq data generation and analysis protocols become reli-able and are standardized, it is necessary to archive raw data. The required storage capacity, and the associated cost, is magnitudes larger than for raw microarray data. However, we also note that the raw data volumes gen-erated by RNA-seq are much smaller than the volumes of data generated from whole-genome sequencing, and thus on the overall scale of sequence data archiving, RNA-seq storage constitutes a fairly small problem.
As raw RNA-seq data can identify the donor, human sequence-based gene expression data sets are usu-ally available under controlled access through dbGAP at NCBI101 and at the European Genome–Phenome Archive (EGA) at EBI. Cases in which a broad con-sent has been given by the subject, such as in the 1000 Genomes Project, are exceptions. This should not pre-vent journals from requiring that additionally processed, de-identified data (for example, gene or transcript expression levels) are deposited at GEO or ArrayExpress together with essential sample annotation that cannot identify the individuals.
ConclusionsGene expression data from public archives are now widely used in research. Use of raw expression data is not straightforward, and therefore secondary added-value databases are making these data accessible to the wider life sciences community. The reproducibility of high-throughput gene expression studies from data deposited in the archives is still limited, largely owing to the lack of sufficient annotation. The public data are often used in combination with new data generated by researchers but are also analysed on their own often to address questions different from those posed in the original studies. Large-scale analysis of combined data sets has provided new biological insights, which could not be obtained from the individual studies. The full extent of use of public expression data is difficult to assess, as it is often used through queries to added-value databases and without citing the database.
Currently, the field of gene expression studies is undergoing a major change by switching from micro-arrays to high-throughput-sequencing-based gene expression assays. Although microarrays are still the main contributor to public gene expression data, the contribution of RNA-seq to the public data is growing rapidly. Will the promises of RNA-seq to provide more quantitative absolute gene expression measurements materialize, and will this further increase the reusability of data? We think that this will require not only technol-ogy advances towards higher reproducibility but also a cultural change. Currently, it seems to be a pattern that every major publication about sequencing-based gene expression comes with a new data set, even if it addresses a question that is similar to the one for which an existing data set has been already generated. This may partly be a consequence of a rapidly developing technology; an unstated goal of the publication might be the technology development and testing rather than the biological result. However, this may partly be a tra-dition in biology as an experimental science; reanalysis of an existing data set is still a fairly new phenomenon in biology, and it is possible that many reviewers or journal editors simply cannot believe that there may be important new discoveries based on data already pub-lished. Clearly, specific biological questions require the analysis of data sets from particular study designs and experimental set-ups, but we believe that there is much to gain from both a scientific and a cost perspective by maximizing the use of existing data and the reus-ability of newly generated data. The adoption of data-sharing standards, such as MINSEQE, by the scientific community and the journals is therefore essential.
Integrating different data types can generate valu-able resources in which these data and processed results can easily be browsed and searched in an inte-grated way. However, maintaining and keeping such databases up-to-date requires substantial resources. It is a general problem in bioinformatics that resources are developed owing to large efforts from dedicated individuals or for specific grants, but as careers and interests progress and grants end, these resources are left out-of-date but with people still using the data.
The more complex the resource is, the harder it is to maintain it without established long-term funding or organization. Efforts for long-term funding of infra-structure in bioinformatics, such as the ELIXIR project
in Europe (see website), can be one way forward to ensure that resources developed by individual groups get support so that they are not to be lost from the community.
1. Schena, M., Shalon, D., Davis, R. W. & Brown, P. O. Quantitative monitoring of gene expression patterns with a complementary DNA microarray. Science 270, 467–470 (1995).
2. Brazma, A. et al. Minimum information about a microarray experiment (MIAME)—toward standards for microarray data. Nature Genet. 29, 365–371 (2001).MIAME was the first initiative to set standards for high-throughput data reporting sharing.
3. The Gene Ontology Consortium. Gene Ontology: tool for the unification of biology. Nature Genet. 25, 25–29 (2000).
4. Gentleman, R. C. et al. Bioconductor: open software development for computational biology and bioinformatics. Genome Biol. 5, R80 (2004).Bioconductor is arguably the most commonly used framework for bioinformatics analysis tools and supports a vast array of open source analysis packages.
5. Edgar, R., Domrachev, M. & Lash, A. E. Gene Expression Omnibus: NCBI gene expression and hybridization array data repository. Nucleic Acids Res. 30, 207–210 (2002).
6. Brazma, A. et al. ArrayExpress—a public repository for microarray gene expression data at the EBI. Nucleic Acids Res. 31, 68–71 (2003).References 5 and 6 describe the primary archives at NCBI and EBI, which provide public availability of data from approximately one million microarrays.
7. Wang, Z., Gerstein, M. & Snyder, M. RNA-seq: a revolutionary tool for transcriptomics. Nature Rev. Genet. 10, 57–63 (2009).
8. Parkinson, H. et al. ArrayExpress update — an archive of microarray and high-throughput sequencing-based functional genomics experiments. Nucleic Acids Res. 39, D1002–D1004 (2011).
9. Barrett, T. et al. NCBI GEO: archive for functional genomics data sets—10 years on. Nucleic Acids Res. 39, D1005–D1010 (2011).
10. Kodama, Y. et al. The DNA Data Bank of Japan launches a new resource, the DDBJ Omics Archive of functional genomics experiments. Nucleic Acids Res. 40, D38–D42 (2012).
11. Piwowar, H. A. Who shares? Who doesn’t? Factors associated with openly archiving raw research data. PLoS ONE 6, e18657 (2011).
12. Rustici, G. et al. ArrayExpress update — trends in database growth and links to popular analysis tools. Nucleic Acids Res. 27 Nov 2012 (doi:10.1093/nar/gks1174).
13. Barrett, T. et al. BioProject and BioSample databases at NCBI: facilitating capture and organization of metadata. Nucleic Acids Res. 40, D57–D63 (2012).
14. Gostev, M. et al. The BioSample Database (BioSD) at the European Bioinformatics Institute. Nucleic Acids Res. 40, D64–D70 (2012).
15. Malone, J. et al. Modeling sample variables with an Experimental Factor Ontology. Bioinformatics 26, 1112–1118 (2010).
16. Kapushesky, M. et al. Gene Expression Atlas update — a value-added database of microarray and sequencing-based functional genomics experiments. Nucleic Acids Res. 40, D1060–D1066 (2012).
17. Chen, R., Mallelwar, R., Thosar, A., Venkatasubrahmanyam, S. & Butte, A. J. GeneChaser: identifying all biological and clinical conditions in which genes of interest are differentially expressed. BMC Bioinformatics 9, 548 (2008).
18. Zilliox, M. J. & Irizarry, R. A. A gene expression bar code for microarray data. Nature Methods 4, 911–913 (2007).
19. McCall, M. N., Uppal, K., Jaffee, H. A., Zilliox, M. J. & Irizarry, R. A. The Gene Expression Barcode: leveraging public data repositories to begin cataloging the human and murine transcriptomes. Nucleic Acids Res. 39, D1011–D1015 (2011).The Gene Expression Barcode is probably the most successful attempt at answering the fundamental question of what is expressed and what is not expressed in a given sample.
20. Mochida, K., Uehara-Yamaguchi, Y., Yoshida, T., Sakurai, T. & Shinozaki, K. Global landscape of a co-expressed gene network in barley and its application to gene discovery in Triticeae crops. Plant Cell Physiol. 52, 785–803 (2011).
21. Hamada, K. et al. OryzaExpress: an integrated database of gene expression networks and omics annotations in rice. Plant Cell Physiol. 52, 220–229 (2011).
22. Obayashi, T., Nishida, K., Kasahara, K. & Kinoshita, K. ATTED-II updates: condition-specific gene coexpression to extend coexpression analyses and applications to a broad range of flowering plants. Plant Cell Physiol. 52, 213–219 (2011).
23. van Verk, M. C., Bol, J. F. & Linthorst, H. J. Prospecting for genes involved in transcriptional regulation of plant defenses, a bioinformatics approach. BMC Plant Biol. 11, 88 (2011).
24. Wilson, T. J. & Ge, S. X. ArraySearch: a web-based genomic search engine. Comp. Funct. Genom. 2012, 650842 (2012).
25. Obayashi, T. & Kinoshita, K. COXPRESdb: a database to compare gene coexpression in seven model animals. Nucleic Acids Res. 39, D1016–D1022 (2011).
26. Engreitz, J. M. et al. ProfileChaser: searching microarray repositories based on genome-wide patterns of differential expression. Bioinformatics 27, 3317–3318 (2011).
27. Liu, T. et al. Cistrome: an integrative platform for transcriptional regulation studies. Genome Biol. 12, R83 (2011).
28. Cho, S. et al. miRGator v2.0: an integrated system for functional investigation of microRNAs. Nucleic Acids Res. 39, D158–D162 (2011).
29. Cheng, W. C. et al. Microarray meta-analysis database (M(2)DB): a uniformly pre-processed, quality controlled, and manually curated human clinical microarray database. BMC Bioinformatics 11, 421 (2010).
30. Gadaleta, E. et al. A global insight into a cancer transcriptional space using pancreatic data: importance, findings and flaws. Nucleic Acids Res. 39, 7900–7907 (2011).
31. Cutts, R. J. et al. The Pancreatic Expression database: 2011 update. Nucleic Acids Res. 39, D1023–D1028 (2011).
32. Taccioli, C. et al. ParkDB: a Parkinson’s disease gene expression database. Database 18, bar007 (2011).
33. Howell, G. R., Walton, D. O., King, B. L., Libby, R. T. & John, S. W. Datgan, a reusable software system for facile interrogation and visualization of complex transcription profiling data. BMC Genomics 12, 429 (2011).
34. Rhodes, D. R. et al. ONCOMINE: a cancer microarray database and integrated data-mining platform. Neoplasia 6, 1–6 (2004).
35. Liu, F., White, J. A., Antonescu, C., Gusenleitner, D. & Quackenbush, J. GCOD — GeneChip Oncology Database. BMC Bioinformatics 12, 46 (2011).
36. Harding, S. D. et al. The GUDMAP database—an online resource for genitourinary research. Development 138, 2845–2853 (2011).
37. Dash, S., Van Hemert, J., Hong, L., Wise, R. P. & Dickerson, J. A. PLEXdb: gene expression resources for plants and plant pathogens. Nucleic Acids Res. 40, D1194–D1201 (2012).
38. Fei, Z. et al. Tomato Functional Genomics Database: a comprehensive resource and analysis package for tomato functional genomics. Nucleic Acids Res. 39, D1156–D1163 (2011).
39. Su, A. I. et al. A gene atlas of the mouse and human protein-encoding transcriptomes. Proc. Natl Acad. Sci. 101, 6062–6067 (2004).
40. Wu, C. et al. BioGPS: an extensible and customizable portal for querying and organizing gene annotation resources. Genome Biol. 10, R130 (2009).
41. Finger, J. H. et al. The mouse Gene Expression Database (GXD): 2011 update. Nucleic Acids Res. 39, D835–D841 (2011).
42. Richardson, L. et al. EMAGE mouse embryo spatial gene expression database: 2010 update. Nucleic Acids Res. 38, D703–D709 (2010).
43. Haudry, Y. et al. 4DXpress: a database for cross-species expression pattern comparisons. Nucleic Acids Res. 36, D847–D853 (2008).
44. Jiménez-Lozano, N., Segura, J., Macías, J. R., Vega, J. & Carazo, J. M. Integrating human and murine anatomical gene expression data for improved comparisons. Bioinformatics 28, 397–402 (2012).
45. Gundem, G. et al. IntOGen: integration and data mining of multidimensional oncogenomic data. Nature Methods 7, 92–93 (2010).
46. Lamb, J. et al. The Connectivity Map: using gene-expression signatures to connect small molecules, genes, and disease. Science 313, 1929–1935 (2006).This much-used resource links gene signatures derived from disease data and drug treatments.
47. Halling-Brown, M. D., Bulusu, K. C., Patel, M. & Tym, J. E. & Al-Lazikani, B. canSAR: an integrated cancer public translational research and drug discovery resource. Nucleic Acids Res. 40, D947–D956 (2012).
48. Huang, H., Liu, C.-C. & Zhou, X. J. Bayesian approach to transforming public gene expression repositories into disease diagnosis databases. Proc. Natl Acad. Sci. USA 107, 6823–6828 (2010) (2010).
49. Yook, K. et al. WormBase 2012: more genomes, more data, new website. Nucleic Acids Res. 40, D735–D741 (2012).
50. Ioannides, J. P. A. et al. Repeatability of public microarray gene analyses. Nature Genet. 41, 149–155 (2009).This study clearly demonstrates the irreproducibility that follows a lack of annotation or insufficient data or code sharing.
51. Couzin-Frankel, J. As questions grow, Duke halts trials, launches investigation. Science 329, 614–615.
52. Baggerly, K. A. & Coombes, K. R. Deriving chemosensitivity from cell lines: forensic bioinformatics and reproducible research in high-throughput biology. Ann. Appl. Stat. 3, 1309–1344 (2009).
53. Baggerly K. A. & Coombes, K. R. What information should be required to support clinical “omics” publications? Clin. Chem. 57, 688–690 (2011).
54. Shankar, R. et al. Annotare — a tool for annotating high-throughput biomedical investigations and resulting data. Bioinformatics 26, 2470–2471 (2010).
56. Krestyaninova, M. et al. A System for Information Management in BioMedical Studies—SIMBioMS. Bioinformatics 25, 2768–2769 (2009).
57. Piwowar, H. A., Vision, T. J. & Whitlock, M. C. Data archiving is a good investment. Nature 473, 285–285 (2011).
58. Parkinson, H. et al. ArrayExpress—a public repository for microarray gene expression data at the EBI. Nucleic Acids Res. 33, D553–D555 (2005).
59. Parkinson, H. et al. ArrayExpress—a public database of microarray experiments and gene expression profiles. Nucleic Acids Res. 35, D747–D750 (2007).
60. Parkinson, H. et al. ArrayExpress update—from an archive of functional genomics experiments to the atlas of gene expression. Nucleic Acids Res. 37, D868–D872 (2009).
61. Rudy, J. & Valafar, F. Empirical comparison of cross-platform normalization methods for gene expression data. BMC Bioinformatics 12, 467 (2011).
62. Lukk, M. et al. A global map of human gene expression. Nature Biotech. 28, 322–324 (2010).This analysis of a large compilation of public data shows the large-scale structure of gene expression space in a large variety of human samples, which could not be derived from any contributing studies individually.
63. Schmid, P. R., Palmer, N. P., Kohane, I. S. & Berger, B. Making sense out of massive data by going beyond differential expression. Proc. Natl Acad. Sci. 109, 5594–5599 (2012).
64. Kohane, I. S. & Valtchinov, V. I. Quantifying the white blood cell transcriptome as an accessible window to the multiorgan transcriptome. Bioinformatics 28, 538–545 (2012).
65. Ojala, K. A., Kilpinen, S. K. & Kallioniemi, O. P. Classification of unknown primary tumors with a data-driven method based on a large microarray reference database. Genome Med. 3, 63 (2011).
66. Zheng-Bradley, X., Rung, J., Parkinson, H. & Brazma, A. Large scale comparison of global gene expression patterns in human and mouse. Genome Biol. 11, R124 (2010).
67. Tseng, G. C., Ghosh, D. & Feingold, E. Comprehensive literature review and statistical considerations for microarray meta-analysis. Nucleic Acids Res. 40, 3785–3799 (2012).
68. Kang, D. D., Sibille, E., Kaminski, N. & Tseng, G. C. MetaQC: objective quality control and inclusion/exclusion criteria for genomic meta-analysis. Nucleic Acids Res. 40, e15 (2012).
69. Ramasamy, A., Mondry, A., Holmes, C. C. & Altman, D. G. Key issues in conducting a meta-analysis of gene expression microarray datasets. PLoS Med. 5, e184 (2008).
70. Vilardell, M. et al. Meta-analysis of heterogeneous Down syndrome data reveals consistent genome-wide dosage effects related to neurological processes. BMC Genomics 12, 229 (2011).
71. Chen, M., Wang, K., Zhang, L., Li, C. & Yang, Y. The discovery of putative urine markers for the specific detection of prostate tumor by integrative mining of public genomic profiles. PLoS ONE 6, e28552 (2011).
72. Sontrop, H. M., Verhaegh, W. F., Reinders, M. J. & Moerland, P. D. An evaluation protocol for subtype-specific breast cancer event prediction. PLoS ONE 6, e21681 (2011).
73. Pierre, M. et al. Meta-analysis of archived DNA microarrays identifies genes regulated by hypoxia and involved in a metastatic phenotype in cancer cells. BMC Cancer 10, 176 (2010).
74. Kim, S., You, S. & Hwang, D. Aminoacyl-tRNA synthetases and tumorigenesis: more than housekeeping. Nature Rev. Cancer. 11, 708–718 (2011).
75. Cochran, B. G. The combination of estimates from different experiments. Biometrics 10, 101–129 (1954).
76. Wang, X. et al. An R package suite for microarray meta-analysis in quality control, differentially expressed gene analysis and pathway enrichment detection. Bioinformatics 28, 2534–2536 (2012).
77. Marot, G., Foulley, J.-L., Mayer, C.-D. & Jaffrézic, F. Moderated effect size and p-value combinations for microarray meta-analyses. Bioinformatics 25, 2692–2699 (2009).
78. Gentleman, R., Ruschhaupt, M., Huber, W. & Lusa, L. Meta-analysis for microarray experiments. bioconductor.org [online], http://www.bioconductor.org/packages/release/bioc/vignettes/GeneMeta/inst/doc/GeneMeta.pdf (2012).
79. Ghosh, D. & Choi, H. Package ‘metaArray’. bioconductor.org [online], http://www.bioconductor.org/packages/2.10/bioc/manuals/metaArray/man/metaArray.pdf (2012).
80. Seo, Y. S. et al. Towards establishment of a rice stress response interactome. PLoS Genet. 7, e1002020 (2011).
81. Soreq, L., Ben-Shaul, Y., Israel, Z., Bergman, H. & Soreq, H. Meta-analysis of genetic and environmental Parkinson’s disease models reveals a common role of mitochondrial protection pathways. Neurobiol. Dis. 45, 1018–1030 (2012).
82. Cacciottolo, M. et al. Reverse engineering gene network identifies new dysferlin-interacting proteins. J. Biol. Chem. 286, 5404–5413 (2011).
83. Tram, E. et al. Identification of germline alterations of the mad homology 2 domain of SMAD3 and SMAD4 from the Ontario site of the breast cancer family registry (CFR). Breast Cancer Res. 13, R77 (2011).
84. Xu, Y. et al. Unique DNA methylome profiles in CpG island methylator phenotype colon cancers. Genome Res. 22, 283–291 (2012).
85. Witkiewicz, A. K. et al. Molecular profiling of a lethal tumor microenvironment, as defined by stromal caveolin-1 status in breast cancers. Cell Cycle. 10, 1794–1809 (2011).
86. Oshino, T. et al. Auxin depletion in barley plants under high-temperature conditions represses DNA proliferation in organelles and nuclei via transcriptional alterations. Plant Cell Environ. 34, 284–290 (2011).
87. Alboresi, A. et al. Reactive oxygen species and transcript analysis upon excess light treatment in wild-type Arabidopsis thaliana versus a photosensitive mutant lacking zeaxanthin and lutein. BMC Plant Biol. 11, 62 (2011).
88. Donoghue, M. T., Keshavaiah, C., Swamidatta, S. H. & Spillane, C. Evolutionary origins of Brassicaceae specific genes in Arabidopsis thaliana. BMC Evol. Biol. 11, 47 (2011).
89. Sanz-Pamplona, R. et al. Gene expression differences between colon and rectum tumors. Clin. Cancer Res. 17, 7303–7312 (2011).
90. Momin, A. A. et al. A method for visualization of “omic” datasets for sphingolipid metabolism to predict potentially interesting differences. J. Lipid Res. 52, 1073–1083 (2011).
91. Yeung, K. Y. et al. Construction of regulatory networks using expression time-series data of a genotyped population. Proc. Natl Acad. Sci. 108, 19436–19441 (2011).
92. Kacmarczyk, T., Waltman, P., Bate, A., Eichenberger, P. & Bonneau, R. Comparative microbial modules resource: generation and visualization of multi-species biclusters. PLoS Comput. Biol. 7, e1002228 (2011).
93. Deng, J. et al. Investigating the predictability of essential genes across distantly related organisms using an integrative approach. Nucleic Acids Res. 39, 795–807 (2011).
94. Wilson, P. A. & Plucinski, M. A simple Bayesian estimate of direct RNAi gene regulation events from differential gene expression profiles. BMC Genomics 12, 250 (2011).
95. Jézéquel, P. et al. bc-GenExMiner: an easy-to-use online platform for gene prognostic analyses in breast cancer. Breast Cancer Res. Treat. 131, 765–775 (2012).
96. Kolde, R., Laur, S., Adler, P. & Vilo, J. Robust rank aggregation for gene list integration and meta-analysis. Bioinformatics 28, 573–580 (2012).
97. Tsoi, L. C., Qin, T., Slate, E. H. & Zheng, W. J. Consistent Differential Expression Pattern (CDEP) on microarray to identify genes related to metastatic behavior. BMC Bioinformatics 12, 438 (2011).
98. Berrar, D., Bradbury, I. & Dubitzky, W. Avoiding model selection bias in small-sample genomic datasets. Bioinformatics 22, 1245–1250 (2006).
99. Zheng, W., Chung, L. M. & Zhao, H. Bias detection and correction in RNA-sequencing data. BMC Bioinformatics 12, 290 (2011).
100. Gonzàlez-Porta, M., Calvo, M., Sammeth, M. & Guigó, R. Estimation of alternative splicing variability in human populations. Genome Res. 22, 528–538 (2012).
101. Mailman, M. D. et al. The NCBI dbGaP Database of Genotypes and Phenotypes. Nature Genet. 39, 1181–1186 (2007).
102. Kauffmann, A. Gentleman, R. & Huber, W. arrayQualityMetrics—a bioconductor package for quality assessment of microarray data. Bioinformatics 25, 415–416 (2009).
103. Dai, M. et al. Evolving gene/transcript definitions significantly alter the interpretation of GeneChip data. Nucleic Acids Res. 33, e175 (2005).
104. Sherlock, G. et al. The Stanford Microarray Database. Nucleic Acids Res. 29, 152–155 (2001).
105. Hruz, T. et al. Genevestigator v3: a reference expression database for the meta-analysis of transcriptomes. Adv. Bioinformat. 2008, 420747 (2008).
AcknowledgementsWe would like to thank H. Parkinson and U. Sarkans for useful comments and help in analysing ArrayExpress statistics. The work was partly funded by the European Community’s FP7 HEALTH grants ENGAGE (grant agreement 201413), SYBARIS (grant agreement 242220) and EurocanPlatform (grant agreement 260791).
Competing interests statementThe authors declare no competing financial interests.