60
Review 2012 | Protection & Indemnity Marine Insight Aon Risk Solutions
Review 2012 | Protection & Indemnity
Marine Insight Aon Risk Solutions

Contents.
Introduction 1
Mutual Clubs 7
P&I Comparative Data 35
P&I Club Market Reference 41
Specialist Markets 49
A o n M a r i n e I n s u r a n c e R e v i e w 2 0 1 2
Overall, the marine insurance market is basically flat, according to data from the Aon Global Risk Insight Platform (GRIP®), which provides fact-based insights into over USD80 billion of global flow. The position for the marine mutual protection and indemnity market is more complicated as a result of restrictions on competition under the International Group agreement.
Aon’s 2011 Review assessed the P&I market as being ‘increasingly cautious’ following a downturn in the clubs’ investments in the second half of the year due to a faltering in international markets. Nevertheless, the thirteen P&I clubs that make up the International Group all posted overall surpluses for the 2010/2011 year, aided by what were, in the end, reasonable investment returns with many of the clubs achieving record levels of free reserves.
Introduction.
1
A o n M a r i n e I n s u r a n c e R e v i e w 2 0 1 2
One year laterTwelve months on, the lack of any meaningful
recovery in the global economy in particular in Europe
and North America has meant that international
investment markets remain volatile. As a result the
investment return generated across the board by the
13 International Group clubs for the 2011/12 year has
been rather modest, typically ranging between the
3% to 4% mark. The clubs’ expectation for the 2013
policy year is that it will produce a similar level of
investment income.
It is true that over recent years we have seen clubs
accumulate record levels of free reserves. In the past
this may have provided an opportunity for them to
ride out adverse policy years, the imminent advent of
Solvency II makes this a less viable option. Solvency
II’s stringent capital requirements will make it very
difficult for them to use their reserves to offset or
subsidise any unprofitable technical underwriting
results. Therefore, the anticipated continued lack of
any meaningful investment income means the clubs
will have to focus ever more on their technical
underwriting results to ensure they maintain
satisfactory levels of free reserves.
The 2012 P&I renewal saw a relatively consistent
approach on General Increases across all 13
International Group clubs, with the vast majority
opting for 5%. However, as our analysis in this
review highlights, the 2011/12 year has produced
a greater divergence in the overall financial results
of the various clubs when compared to those of
the last couple of years. As a result, at the 2013 P&I
renewal we may well also see greater divergence
across the International Group when it comes 2013
General Increases. The combination of an anticipated
continued lack of meaningful investment return for
the 2012/13 year and ever increasing regulatory
pressure not to erode levels of free reserves, means
there is a very real possibility that those clubs that
produced a negative technical underwriting result in
2011/12 will come under pressure to post General
Increases at the higher end of the scale. We would
not be surprised to see the range of General
Increases posted for the 2013 P&I renewal
ranging from 5% to 12.5%.
Intr
oduc
tion

2
A o n M a r i n e I n s u r a n c e R e v i e w 2 0 1 2
3
A o n M a r i n e I n s u r a n c e R e v i e w 2 0 1 2
Intr
oduc
tion
Are we seeing the early signs of the ‘churn effect’?Much has been made over the years about the
potential impact the ‘churn effect’ may be having on
the P&I market.
Many of the International Group clubs have
experienced considerable growth in their entered
tonnage over the last 10 years following the explosion
in world tonnage during shipping’s boom years.
Where of course the rules under International Group
Agreement restrict competition between P&I clubs,
it is also known that on the few occasions where
‘genuine’ competition is allowed to operate within the
system it can be, and usually is, fierce.
As a result the delta between the premiums of those
vessels that have gone through several renewals
and ‘cycles’ of General Increases and newbuildings
that more recently have entered the P&I system has
steadily increased. However, with the shipping market
continuing to be gripped by the longest downturn
in recent memory, owners are scrapping older, less
effcient and higher premium tonnage.
And while of course it would be too simplistic
to explain any particular club’s recent technical
underwriting and overall financial result purely by
means of the ‘churn effect’, we believe it is important
to continue to keep a close eye on the relationship
between a club’s rate of growth and its technical
underwriting result. A combination of the ‘churn
effect’, lack of investments and technical
underwriting losses has the potential to
prolong and exacerbate any divergence in the
level General Increases beyond the 2013 P&I
renewals.
The challenge of the 2013 Group Reinsurance renewalAt the time of writing, it is a little too early to give
any accurate guidance on what the exact impact the
renewal of the International Group Excess of Loss
reinsurance contract will have on the individual vessel
rating categories. However, following the loss of the
Costa Concordia and significant deterioration in the
estimate of the RENA claim in the final weeks of the
2011/12 year, it is likely the reinsurance markets will
be looking for a sizable rise from the International
Group at renewal.
There may be a desire to pass on a
considerable share of any increase to the
passenger sector, however we believe that
when it comes to allocating any increase in
reinsurance costs to the individual vessel
categories, this should be done in an equitable
manner. One must not forget that twice in the
last 10 years the International Group has applied
significant increases to the reinsurance rates of

4
A o n M a r i n e I n s u r a n c e R e v i e w 2 0 1 2
passenger vessels. Furthermore, up to January 2012,
the passenger sector had also performed extremely
well in terms of claims over the same 10 year period,
effectively maintaining a clean record in relation to
the International Group Excess of Loss reinsurance
programme. As a result, over the period passenger
vessels have made a very significant positive
contribution to the overall cost of the International
Group Reinsurance programme and there is merit
in the argument that an incident such as the
Costa Concordia had already been priced into the
reinsurance rates for passenger vessels.
Add to this the fact that the vast majority of the
Concordia’s total claim amount relates to the cost of
the removal of her wreck with other types of vessel
having also produced significant claims in relation to
this risk in recent years, an overly punitive increase in
reinsurance rates for the passenger sector would be
difficult to justify.
Primary war P&I liabilities – A challenge for the passenger shipping industryAt Aon the approaching implementation of the
EU Passenger Liability Regulation (PLR, being the
precursor to the 2002 Protocol to the Athens
Convention, which is not expected to be in force until
at least 2013) due to enter into force on 31 December
2012 is very much at the forefront of our minds.
The certification of terrorism liabilities is a necessary
requirement under the PLR and currently falls outside
of the primary P&I cover granted by the clubs. This
means that a ‘Blue Card’ type certificate will need to
be issued by insurers covering ground up war and
terrorism liabilities.
Aon would have hoped that the solution to
this certification requirement would be for the
International Group P&I clubs to write ground up war
and terrorism liabilities and therefore issue a single
‘Blue Card’ covering both standard P&I and war
P&I liabilities. Through the International Group, the
boards of all P&I clubs were asked to consider this
issue and while a number of clubs agreed with this
proposal, the required 75% majority of clubs under
the International Group Agreement has not been
achieved.
This had left passenger ship operators with a
challenge that the P&I insurance community is now
actively working to solve. At the time of writing there
are a couple of potential solutions being considered:
• Gard already has a vehicle by the name of Safeguard
in place which they utilise for issuing Bunker Blue
Cards for their fixed premium P&I clients. It is now
being investigated if this infrastructure can also be
adapted to also issue the necessary primary P&I war
risks certification as required under the PLR
5
A o n M a r i n e I n s u r a n c e R e v i e w 2 0 1 2
Intr
oduc
tion
• The UK War Club has confirmed that they will be
certifying passenger vessel members for primary war
P&I liabilities, in line with PLR requirements
• A panel of brokers, including Aon, have been invited
by the International Group to present a commercial
insurance or reinsurance solution. At the time of
writing, these proposals were in the process of being
analysed by the International Group with a further
update expected after the summer
• Those P&I clubs most affected by the PLR may
look at establishing a ‘mini pool’ arrangement for
primary war P&I liabilities allowing them to issue
the necessary certification to satisfy the relevant
authorities
European Commission investigation of The International Group is closed At the time of writing of our 2012 review the
European Commission announced that it would be
closing its review of the International Group which
began in 2010. The International Group states that:
‘Even though the European Commission has decided
to close its investigation, the International Group
plans to make some amendments to the IGA. The
International Group is finalising these and details will
be published in due course.‘
Aon will provide a further update and commentary on
the matter once details are released by means of one
of our regular marine publications.
VigilanceAon’s overall message leading up to the 2013 P&I
renewal and beyond to all parties concerned is one of
vigilance.
Individual clubs need to ensure they maintain a sound
financial position and collectively the International
Group clubs need to secure their position from a
reinsurance point of view.
Owners and operators need to make sure that they
partner with clubs that remain on a sound financial
footing while at the same time being in a position
to offer appropriate solutions to any new risks and
challenges that develop.
The challenge for the P&I community on the
whole leading up to the 2013 renewal is, for
there to continue to be in place a system
that covers all types of owners and operators
for their respective exposures effectively,
efficiently and economically.
Mutual Clubs.

7
A o n M a r i n e I n s u r a n c e R e v i e w 2 0 1 2
American Club 8
Britannia 10
Gard 12
Japan Club 14
London Club 16
North of England 18
Shipowners Club 20
Skuld 22
Standard Club 24
Steamship Mutual 26
Swedish Club 28
UK P&I Club 30
West of England 32
Mut
ual C
lubs
Commentary on individual clubs has been supplied by the clubs themselves.
Balance sheet data includes combined P&I and FD&D figures if applicable
8
A o n M a r i n e I n s u r a n c e R e v i e w 2 0 1 2
American Club
Manager’s commentDuring 2011 the sale of older and larger ships and
their replacement by newer tonnage created a “see-
saw” effect. As a result, entered tonnage at the start
and end of the year were around the same level. The
number of ships entered by Asian owners grew and
now constitutes 40% of the entered tonnage.
Against a backdrop of challenging freight and financial
markets, the Association’s free reserves increased to
approximately USD66 million at March 31, 2012,
10% higher than at the end of the club’s financial
year, December 31, 2011. Claims paid during 2011
rose, although reported claims declined. The level
of claims on the International Group’s Pool for 2011
remains a cause for concern.
During 2011, the American Club began its
participation in the Eagle Ocean Marine facility, a
fixed premium product for smaller ships in local
and regional trade, supported by a quota share
re-insurance programme at Lloyd’s and elsewhere. Its
positive first year results augur well for the future.
Entered GT by vessel type
Other3%
Passenger/RoRo10%
Bulker/General Cargo61%
Tanker25%
Entered GT by region
Other3%
Asia Pacific40%
Europe46%
North America
11%
American Steamship Owners Mutual Protection and Indemnity Association, Inc.
Shipowners Claims Bureau, Inc., 1 Battery Park Plaza, 31st Floor, New York, NY 10004, USA
american-club.com
t: +1.212.847.4500
Ships and GT
Noumber of ships
2012: 1,319 2011: 1,280 2010: 1,217
Average GT
2012: 12,206 2011: 12,031 2010: 11,100
Owned GT
2012: 16,100,000 2011: 15,400,000 2010: 13,508,286
Fixed premium GT
2012: 1,000,000 2011: 1,000,000 2010: 1,200,000
9
A o n M a r i n e I n s u r a n c e R e v i e w 2 0 1 2
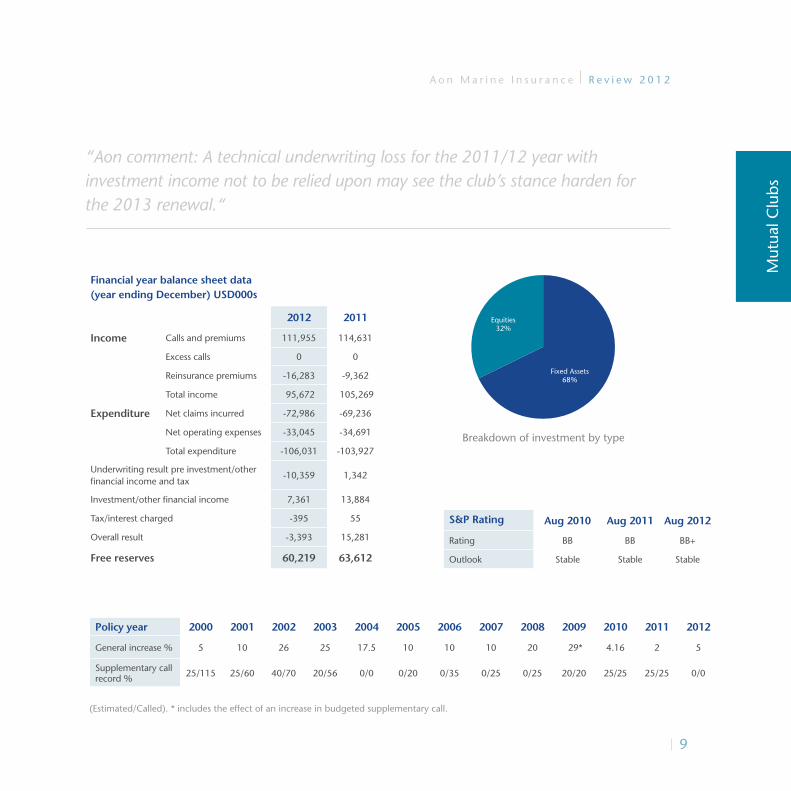
Policy year 2000 2001 2002 2003 2004 2005 2006 2007 2008 2009 2010 2011 2012
General increase % 5 10 26 25 17.5 10 10 10 20 29* 4.16 2 5
Supplementary call record % 25/115 25/60 40/70 20/56 0/0 0/20 0/35 0/25 0/25 20/20 25/25 25/25 0/0
(Estimated/Called). * includes the effect of an increase in budgeted supplementary call.
S&P Rating Aug 2010 Aug 2011 Aug 2012
Rating BB BB BB+
Outlook Stable Stable Stable
Financial year balance sheet data (year ending December) USD000s
2012 2011
Income Calls and premiums 111,955 114,631
Excess calls 0 0
Reinsurance premiums -16,283 -9,362
Total income 95,672 105,269
Expenditure Net claims incurred -72,986 -69,236
Net operating expenses -33,045 -34,691
Total expenditure -106,031 -103,927
Underwriting result pre investment/other financial income and tax
-10,359 1,342
Investment/other financial income 7,361 13,884
Tax/interest charged -395 55
Overall result -3,393 15,281
Free reserves 60,219 63,612
“Aon comment: A technical underwriting loss for the 2011/12 year with investment income not to be relied upon may see the club’s stance harden for the 2013 renewal.“
Breakdown of investment by type
Equities32%
Fixed Assets68%
Mut
ual C
lubs

10
A o n M a r i n e I n s u r a n c e R e v i e w 2 0 1 2
Manager’s commentWe have had a positive underwriting result and an
investment return that was better than expected.
Despite strong growth in owned tonnage – there was
a net gain of 7.5 million GT during the year – calls
and premiums for the year were slightly lower than
2010/11. This reflected reduced chartered tonnage
and a decision to waive half of the outstanding
deferred call for the 2009/10 policy year, amounting
to some USD12.8 million. To achieve such a solid
financial result having waived part of the deferred
call is a real achievement and the result of the
Association’s sound financial strategy.
P&I Claims have continued the upward trend seen
over recent years, and although there have been none
from Britannia ships, the cost of the pool claims has
also been high with two large high profile casualties.
Nevertheless, favourable development of claims in
earlier policy years offset this adverse experience and
the overall cost of P&I claims for the year was only
USD14.2 million higher than last year.
Number of ships
2012: 2,951 2011: 2,820 2010: 2,879
Average GT
2012: 37,648 2011: 36,525 2010: 34,040
Owned GT
2012: 111,100,000 2011: 103,000,000 2010: 98,000,000
Fixed premium GT
2012: 28,900,000 2011: 36,000,000 2010: 40,000,000
Entered GT by vessel type
Other1%
Container25%
Bulker/General Cargo36%
Tanker38%
Entered GT by region
Other1%
Asia Pacific53%
Europe39%
Americas7%
BritanniaThe Britannia Steam Ship Insurance Association Limited
45 King William Street, London, EC4R 9AN, UK
britanniapandi.com
t +44 (0)20 7407 3588

11
A o n M a r i n e I n s u r a n c e R e v i e w 2 0 1 2
Breakdown of investment by type
Cash19%
Equities16%
Bonds65%
Breakdown of investment by type
Cash19%
Equities16%
Bonds65%
Policy year ‘00 ‘01 ‘02 ‘03 ‘04 ‘05 ‘06 ‘07 ‘08 ‘09 ‘10 ‘11 ‘12
General increase % 0 10 28.8* 15 8.5 7.5 2.5 5 23.8* 12.5 5 5 5
Supplementary call record % 25/25 25/25 40/40 40/40 40/30 40/30 30/30 30/30 40/40 40/32.5 40/40 40/40 40/40
(Estimated/Called). * includes the effect of an increase in budgeted supplementary call.
S&P Rating Aug 2010 Aug 2011 Aug 2012
Rating A A A
Outlook N/A N/A N/A
Type of rating Pi Pi Pi
Financial year balance sheet data (year ending February) USD000s
2012 2011
Income Calls and premiums 281,772 298,482
Excess calls 0 0
Reinsurance premiums -63,681 -74,468
Total income 218,091 224,014
Expenditure Net claims incurred -209,634 -201,818
Net operating expenses -29,389 -27,877
Total expenditure -239,023 -229,695
Underwriting result pre investment/other financial income and tax
-20,932 -5,681
Investment/other financial income 39,531 59,611
Tax/interest charged -2,830 -1,115
Overall result 15,769 52,815
Free reserves excluding Boudicca 290,677 274,908
Free reserves including Boudicca 460,977 454,108
Mut
ual C
lubs
“Aon comment: The club continues to justify its reputation as one of the most financial stable clubs in the International Group, underlining their confidence by returning half the deferred call for 2009/10“
12
A o n M a r i n e I n s u r a n c e R e v i e w 2 0 1 2
Gard
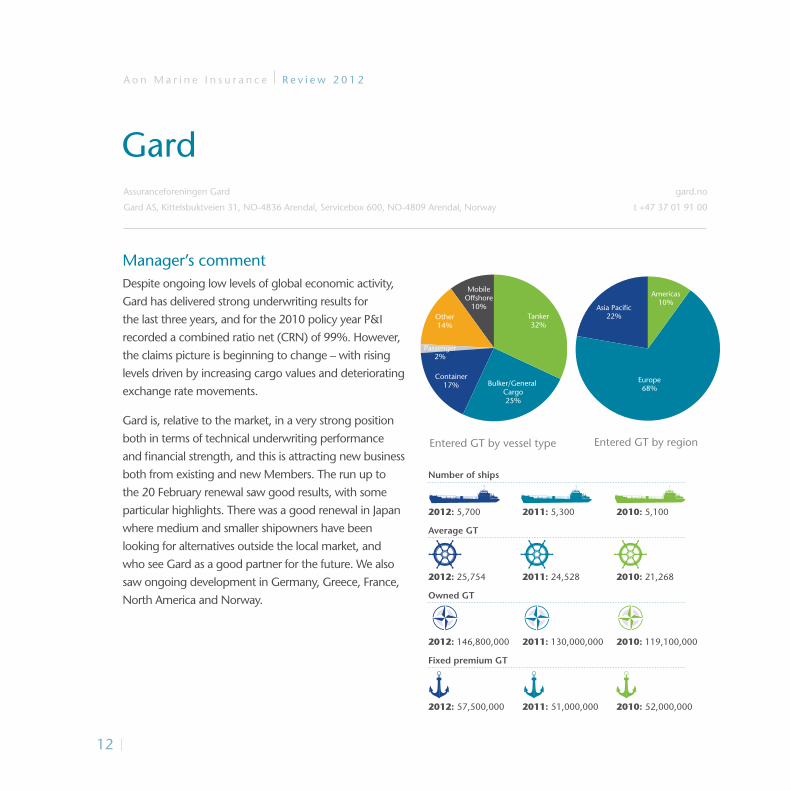
Manager’s commentDespite ongoing low levels of global economic activity,
Gard has delivered strong underwriting results for
the last three years, and for the 2010 policy year P&I
recorded a combined ratio net (CRN) of 99%. However,
the claims picture is beginning to change – with rising
levels driven by increasing cargo values and deteriorating
exchange rate movements.
Gard is, relative to the market, in a very strong position
both in terms of technical underwriting performance
and financial strength, and this is attracting new business
both from existing and new Members. The run up to
the 20 February renewal saw good results, with some
particular highlights. There was a good renewal in Japan
where medium and smaller shipowners have been
looking for alternatives outside the local market, and
who see Gard as a good partner for the future. We also
saw ongoing development in Germany, Greece, France,
North America and Norway.
Assuranceforeningen Gard
Gard AS, Kittelsbuktveien 31, NO-4836 Arendal, Servicebox 600, NO-4809 Arendal, Norway
gard.no
t +47 37 01 91 00
Ships and GT
Number of ships
2012: 5,700 2011: 5,300 2010: 5,100
Average GT
2012: 25,754 2011: 24,528 2010: 21,268
Owned GT
2012: 146,800,000 2011: 130,000,000 2010: 119,100,000
Fixed premium GT
2012: 57,500,000 2011: 51,000,000 2010: 52,000,000
Entered GT by vessel type
MobileOffshore
10%Other14%
Passenger2%
Container17% Bulker/General
Cargo25%
Tanker32%
Entered GT by region
Asia Pacific22%
Europe68%
Americas10%

13
A o n M a r i n e I n s u r a n c e R e v i e w 2 0 1 2
Mut
ual C
lubs
“Aon comment: An excellent overall result for the largest Club despite a small underwriting loss on the mutual P&I business. Another year where the Club can afford to return money to the membership.“
Breakdown of investment by type
Property4%
Equities15%
Bonds and Cash81%
Policy year ‘00 ‘01 ‘02 ‘03 ‘04 ‘05 ‘06 ‘07 ‘08 ‘09 ‘10 ‘11 ‘12
General increase % 5 10 25 15 7.5 5 7.5 5 10 15 0 0 5
Supplementary call record % 25/25 25/25 25/25 25/25 25/25 25/20 25/20 25/25 25/25 25/10 25/15 25/20 25/
* includes reserves available to non P&I business** no longer allocated across individual lines of business
S&P Rating Aug 2010 Aug 2011 Aug 2012
Rating A A A
Outlook Stable Positive Positive
Type of rating Interactive Interactive Interactive
Financial year balance sheet data (year ending February) USD000s
2012 2011
Income Calls and premiums 519,199 491,383
Excess calls -14,387 -28,285
Reinsurance premiums -90,641 -86,344
Total income 414,171 376,754
Expenditure Net claims incurred -402,132 -360,150
Net operating expenses -41,330 -43,030
Total expenditure -443,462 -403,180
Underwriting result pre investment/other financial income and tax
-29,291 -26,246
Investment/other financial income ** **
Tax/interest charged ** **
Overall result Not available
Not available
Free reserves 825,618* 789,695*
14
A o n M a r i n e I n s u r a n c e R e v i e w 2 0 1 2
Japan Club
Manager’s commentMost of our members experienced tight financial
conditions and plunged into the red due to soaring fuel
costs and value of the yen. In addition, the Great East
Japan Earthquake and floods in Thailand had no small
effect on the continuous poor economic performance
in Japan.
In the circumstance, there was a continuous increase
of newly built vessels entered with the Association.
However, there was a decrease in the number and
tonnage of vessels entered at renewal. The overall
tonnage entered with the Association decreased to 90.49
million gross tons, which represents a decrease of 2.25
million gross tons when compared to the last year.
While the increased tendency of claims has continued,
we have steadily improved our financial strength with
our reserves increasing by USD9 million to USD167
million. In addition, we have earned a BBB credit rating
with a stable outlook from Standard & Poor’s.
Japan Shipowners’ Mutual P&I Association
2-15-14 Nihonbashi-Ningyocho, Chuoh-ku, Tokyo 103-0013, Japan
piclub.or.jp
t +81 33 662 7401
Ships and GT
Number of ships
2012: 2,449 2011: 2,558 2010: 2,699
Average GT
2012: 35,627 2011: 34,805 2010: 32,697
Owned GT
2012: 87,250,000 2011: 89,030,000 2010: 88,250,000
Fixed premium GT
2012: 2,610,000 2011: 2,890,000 2010: 3,300,000
Entered GT by vessel type
Other18%
Container10%
Bulker/General Cargo58%
Tanker15%
Entered GT by region
Americas65%
Europe3%
Asia Pacific19%
Others13%

15
A o n M a r i n e I n s u r a n c e R e v i e w 2 0 1 2
Mut
ual C
lubs
“Aon comment: A difficult year saw the Japan Club ask members for a 10% unbudgeted Supplementary Call. The Club also announced plans for a UK Club style subordinated loan. “
Breakdown of investment by type
Fixed Income,44%
Bonds 32%
Cash24%
Policy year ‘00 ‘01 ‘02 ‘03 ‘04 ‘05 ‘06 ‘07 ‘08 ‘09 ‘10 ‘11 ‘12
General increase % 0 10 0 10 0 0 0 10 20 12.5 12.5 10 3
Supplementary call record % 20/20 20/10 20/20 30/10 30/30 30/30 30/60 30/30 30/30 40/40 40/50 40/40 40/40
S&P Rating Aug 2010 Aug 2011 Aug 2012
Rating BBB BBB BBB
Outlook n/a n/a Stable
Type of rating pi pi Interactive
Financial year balance sheet data (year ending February) USD000s
2012 2011
Income Calls and premiums 259,865 281,753
Excess calls 0 0
Reinsurance premiums -46,228 -49,652
Total income 213,637 232,101
Expenditure Net claims incurred -180,390 -183,179
Net operating expenses -27,505 -27,439
Total expenditure -207,895 -210,618
Underwriting result pre investment/other financial income and tax
5,742 21,483
Investment/other financial income -1,877 -13,375
Tax/interest charged -6,027 -638
Overall result 3,865 8,108
Free reserves 166,949 157,827
16
A o n M a r i n e I n s u r a n c e R e v i e w 2 0 1 2
London Club
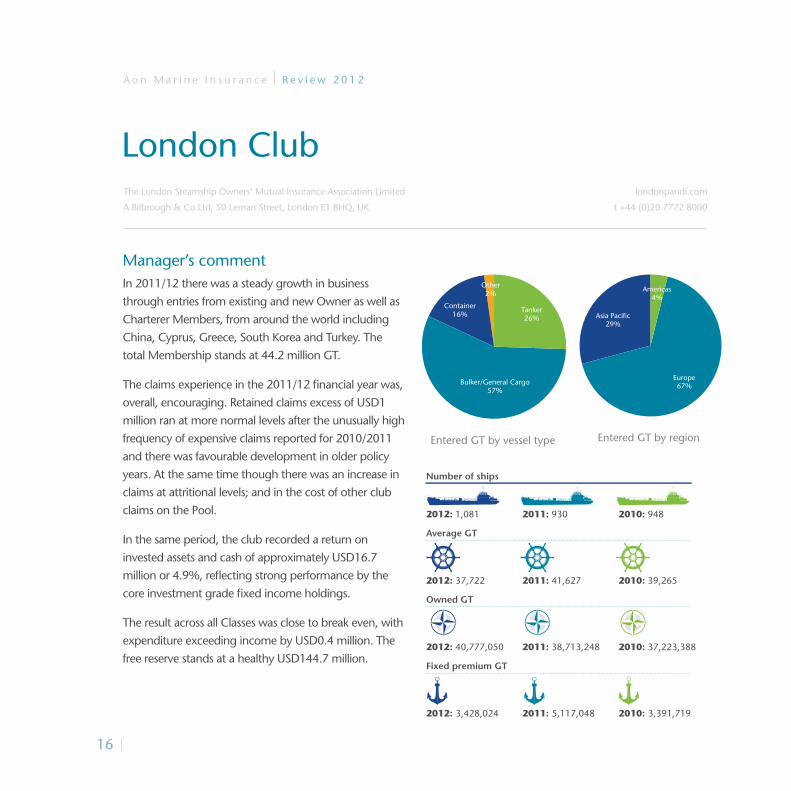
Manager’s commentIn 2011/12 there was a steady growth in business
through entries from existing and new Owner as well as
Charterer Members, from around the world including
China, Cyprus, Greece, South Korea and Turkey. The
total Membership stands at 44.2 million GT.
The claims experience in the 2011/12 financial year was,
overall, encouraging. Retained claims excess of USD1
million ran at more normal levels after the unusually high
frequency of expensive claims reported for 2010/2011
and there was favourable development in older policy
years. At the same time though there was an increase in
claims at attritional levels; and in the cost of other club
claims on the Pool.
In the same period, the club recorded a return on
invested assets and cash of approximately USD16.7
million or 4.9%, reflecting strong performance by the
core investment grade fixed income holdings.
The result across all Classes was close to break even, with
expenditure exceeding income by USD0.4 million. The
free reserve stands at a healthy USD144.7 million.
Number of ships
2012: 1,081 2011: 930 2010: 948
Average GT
2012: 37,722 2011: 41,627 2010: 39,265
Owned GT
2012: 40,777,050 2011: 38,713,248 2010: 37,223,388
Fixed premium GT
2012: 3,428,024 2011: 5,117,048 2010: 3,391,719
Entered GT by vessel type
Other2%
Container16%
Bulker/General Cargo57%
Tanker26%
The London Steamship Owners’ Mutual Insurance Association Limited
A Bilbrough & Co Ltd, 50 Leman Street, London E1 8HQ, UK
londonpandi.com
t +44 (0)20 7772 8000
Entered GT by region
Asia Pacific29%
Europe67%
Americas4%

17
A o n M a r i n e I n s u r a n c e R e v i e w 2 0 1 2
Breakdown of investment by type
Other2%
Equities9%
Cash21%
Fixed Income69%
Policy year ‘00 ‘01 ‘02 ‘03 ‘04 ‘05 ‘06 ‘07 ‘08 ‘09 ‘10 ‘11 ‘12
General increase % 5 10 27.5 25 15 12.5 12.5 7.5 17.5 15 5 5 5
Supplementary call record % 40/40 40/40 40/40 40/40 40/40 40/40 40/89 40/89 40/75 40/40 0/0 0/0 0/0
(Estimated/Called). * includes the effect of an increase in budgeted supplementary call.
S&P Rating Aug 2010 Aug 2011 Aug 2012
Rating BBB BBB BBB
Outlook Stable Stable Stable
Type of rating Pi Pi Pi
Financial year balance sheet data (year ending February) USD000s
2012 2011
Income Calls and premiums 109,190 113,224
Excess calls 0 0
Reinsurance premiums -21,216 -22,549
Total income 87,974 90,675
Expenditure Net claims incurred -93,338 -101,118
Net operating expenses -11,367 -11,021
Total expenditure -104,705 -112,139
Underwriting result pre investment/other financial income and tax
-16,731 -21,464
Investment/other financial income 16,484 25,199
Tax/interest charged -154 -91
Overall result -401 3,644
Free reserves 144,669 145,070
Mut
ual C
lubs
“Aon comment: An improved underwriting performance resulting primarily from a good claims year. Work still needs to be done to improve the technical underwriting result further.“

18
A o n M a r i n e I n s u r a n c e R e v i e w 2 0 1 2
North of England
Manager’s CommentNorth produced an overall surplus of USD1.6 million,
leading to a third consecutive annual increase in free
reserves to USD314.0 million. The combined ratio was
only slightly above breakeven at 101.8%, and the club
continues to reserve all claims at a very conservative 95%
confidence level.
The investment return for the year was 2.76% and
although satisfactory in view of the low risk nature of the
investment portfolio, this was still lower than originally
anticipated. In addition the club’s office headquarters in
Newcastle were subject to a building revaluation charge
of USD7.5 million, which reflects the current weak
commercial property market in the UK.
During the year to 20 February 2012 and subsequently,
the club’s membership has continued to grow steadily
and owned tonnage has now increased to 125 million
GT, and together with estimated chartered entries of 45
million GT, this takes the total entered tonnage in the
club to around 170 million GT.
North of England P&I Association Limited
The Quayside, Newcastle Upon Tyne, NE1 3DU, UK
nepia.com
t +44 (0)191 232 5221
Entered GT by vessel type
Other12%
Passenger1%
Container23%
Bulker/General Cargo34%
Tanker30%
Entered GT by region
Other12%
Asia Pacific26%
Europe49%
Americas13%
Number of ships
2012: 4,000 2011: 3,665 2010: 3,075
Average GT
2012: 30,750 2011: 28,377 2010: 26,992
Owned GT
2012: 123,000,000 2011: 104,000,000 2010: 83,000,000
Fixed premium GT
2012: 40,000,000 2011: 39,000,000 2010: 28,000,000
19
A o n M a r i n e I n s u r a n c e R e v i e w 2 0 1 2
Policy year ‘00 ‘01 ‘02 ‘03 ‘04 ‘05 ‘06 ‘07 ‘08 ‘09 ‘10 ‘11 ‘12
General increase % 5 10 25 25 17.5 12.5 7.5 7.5 17.5 17.5 5 3 5
Supplementary call record % 25/25 25/25 25/25 25/25 0/0 0/0 0/0 0/0 0/0 0/0 0/0 0/0 0/0
(Estimated/Called). * includes the effect of an increase in budgeted supplementary call.
S&P Rating Aug 2010 Aug 2011 Aug 2012
Rating A A A
Outlook Stable Stable Stable
Type of rating Interactive Interactive Interactive
Financial year balance sheet data (year ending February) USD000s
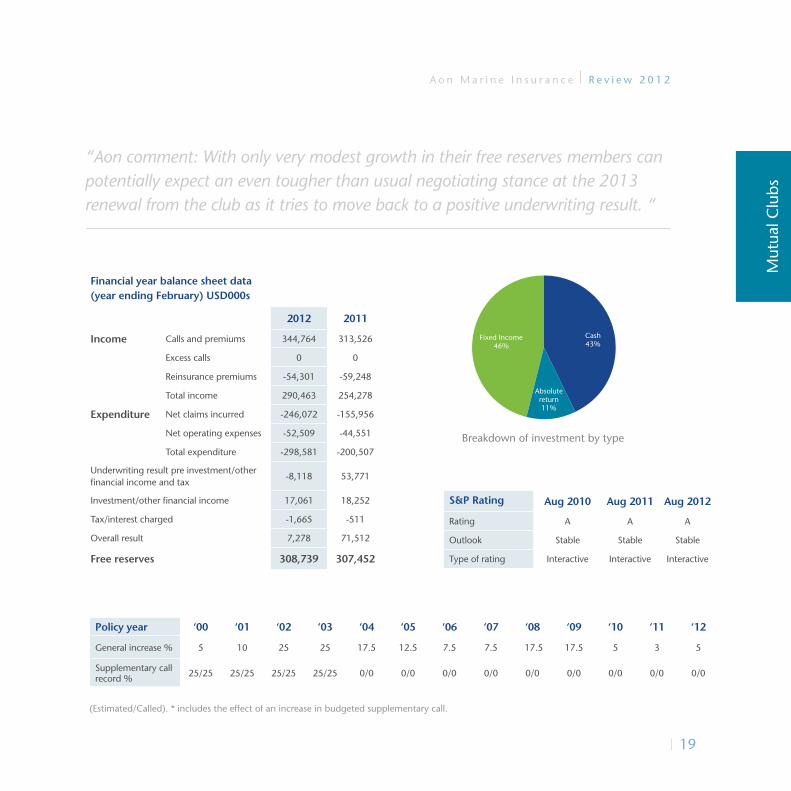
2012 2011
Income Calls and premiums 344,764 313,526
Excess calls 0 0
Reinsurance premiums -54,301 -59,248
Total income 290,463 254,278
Expenditure Net claims incurred -246,072 -155,956
Net operating expenses -52,509 -44,551
Total expenditure -298,581 -200,507
Underwriting result pre investment/other financial income and tax
-8,118 53,771
Investment/other financial income 17,061 18,252
Tax/interest charged -1,665 -511
Overall result 7,278 71,512
Free reserves 308,739 307,452
Mut
ual C
lubs
“Aon comment: With only very modest growth in their free reserves members can potentially expect an even tougher than usual negotiating stance at the 2013 renewal from the club as it tries to move back to a positive underwriting result. “
Breakdown of investment by type
Fixed Income46%
Absolutereturn11%
Cash43%

20
A o n M a r i n e I n s u r a n c e R e v i e w 2 0 1 2
Entered GT by region
Other18.33%
Asia Pacific50.78%
Europe18.81%
Americas12.07%
Shipowners Club
Manager’s CommentThe Shipowners’ Club produced a strong set of results
with increased gross written premium at USD209.7
million, up 6.5% on last year. Growth was the underlying
theme throughout, with the total number of Members
up by 5.3% to 5,922, entered vessels up 8.1% to
31,341, and gross tonnage rising 11.2% to 19.8 million.
Shipowners’ financial security was also reinforced by a
growth in free reserves to USD234.5 million, resulting in
total funds of USD502 million, up 16.5% on the previous
year.
Shipowners was also pleased with its strong technical
performance. The overall surplus of USD46.5 million
consisted of an underwriting surplus up 13% on the
preceding year, at USD28.6 million and an investment
return of USD18.9 million, before taxation. The
underwriting result represented a combined ratio of
84.9%, in line with the previous year, and the investment
result produced a 4.85% return on capital.
The Shipowners’ Mutual Protection and Indemnity Association
St Clare House, 30-33 Minories, London EC3N 1BP, UK
shipownersclub.com
t +44 (0)20 7488 0911
Entered GT by vessel type
Yachts3.5%
Offshore14.6%
Barges18.8%
Harbour30%
Fishing12.2%
Passenger11.8%
Bulker/General Cargo4.9%
Tanker4.2%
Ships and GT
Number of ships
2012: 31,341 2011: 30,602 2010: 28,227
Average GT
2012: 632 2011: 593 2010: 588
Owned GT
2012: 19,792,065 2011: 18,151,077 2010: 16,583,272
Fixed premium GT
2012: N/A 2011: N/A 2010: N/A

21
A o n M a r i n e I n s u r a n c e R e v i e w 2 0 1 2
Breakdown of investment by type
Fixed interest investments
75%
Equity investments
25%
Policy year ‘00 ‘01 ‘02 ‘03 ‘04 ‘05 ‘06 ‘07 ‘08 ‘09 ‘10 ‘11 ‘12
General increase % 0 0 20 15 0 0 0 5 15 10 5 0 0
Supplementary call record % 25/0 25/0 25/0 25/0 25/0 25/0 25/0 25/0 25/0 10/0 10/0 10/0 10/0
(Estimated/Called). * includes the effect of an increase in budgeted supplementary call.
S&P Rating Aug 2010 Aug 2011 Aug 2012
Rating BBB BBB BBB
Outlook N/A N/A N/A
Type of rating Pi Pi Pi
Financial year balance sheet data (year ending February) USD000s
2012 2011
Income Calls and premiums 209,689 196,815
Excess calls 0 0
Reinsurance premiums -19,927 -22,998
Total income 189,762 173,817
Expenditure Net claims incurred -118,172 -107,150
Net operating expenses -43,030 -40,510
Total expenditure -161,202 -147,660
Underwriting result pre investment/other financial income and tax
28,560 26,157
Investment/other financial income 18,903 27,648
Tax/interest charged -917 -931
Overall result 46,546 52,874
Free reserves 234,460 187,914
Mut
ual C
lubs“Aon comment: Another excellent result for the small ship specialists. Expect to see
the S&P ‘A’ rating return soon.“

22
A o n M a r i n e I n s u r a n c e R e v i e w 2 0 1 2
Skuld
Manager’s commentSkuld is a strong world leading marine insurance
provider with focus on innovation, financial strength
and talented staff. For 9 consecutive years, Skuld
is the only P&I Club with a positive underwriting
result – creating reliability and predictability for the
members and clients. No general increase and no
supplementary calls.
Through diversification Skuld is able to provide all
products in the marine insurance: Protection and
Indemnity for shipowners, liability covers for charterers,
defence insurance and a wide range of additional covers.
The specialized team in Skuld Offshore provides contract
reviews and bespoke covers for offshore liability. Skuld
1897, a syndicate at Lloyd’s, offers marine and energy
covers, as well as cargo and additional marine liabilities.
Worldwide offices cover virtually every time zone
and are manned by dedicated and professional staff
representing over 20 nationalities and thus many cultural
backgrounds as well as a wide variety of legal, nautical
and technical expertise.
Assuranceforeningen SKULD
(Gjensidig), Ruseløkkvn. 26, 0251 Oslo, Norway
skuld.com
t +47 22 00 22 00
Entered GT by vessel type
Other2%
Passenger2%
Container10%
Bulker/General Cargo40%
Tanker45%
Entered GT by vessel type
Other2%
Passenger2%
Container10%
Bulker/General Cargo40%
Tanker45%
Entered GT by region
Other2%
Asia Pacific20%
Europe68%
Americas11%
Number of ships
2012: 3,792 2011: 3,688 2010: 3,860
Average GT
2012: 18,434 2011: 17,226 2010: 14,264
Owned GT
2012: 69,900,000 2011: 63,530,385 2010: 55,060,102
Fixed premium GT
2012: N/A 2011: N/A 2010: 42,389,547

23
A o n M a r i n e I n s u r a n c e R e v i e w 2 0 1 2
Breakdown of investment by type
Alternative investments
3%
Commodities1%
Equities15%
Fixed income72%
Cash9%
Policy year ‘00 ‘01 ‘02 ‘03 ‘04 ‘05 ‘06 ‘07 ‘08 ‘09 ‘10 ‘11 ‘12
General increase % 0 10 30 25 15 7.5 5 2.5 7.5 15 5 N/A N/A
Supplementary call record % 20/65 20/20 0/0 0/0 0/0 0/0 0/0 0/0 0/0 0/0 0/0 0/0 0/0
(Estimated/Called). * includes the effect of an increase in budgeted supplementary call.
S&P Rating Aug 2010 Aug 2011 Aug 2012
Rating A- A- A
Outlook Stable Positive Stable
Type of rating Interactive Interactive Interactive
Financial year balance sheet data (year ending February) USD000s
2012 2011
Income Calls and premiums 299,971 272,429
Excess calls 0 0
Reinsurance premiums -38,482 -32,312
Total income 261,489 240,117
Expenditure Net claims incurred -193,722 -165,054
Net operating expenses -56,109 -44,455
Total expenditure -249,831 -209,509
Underwriting result pre investment/other financial income and tax
11,658 30,608
Investment/other financial income 14,802 37,043
Tax/interest charged -2,106 -3,029
Overall result 24,353 64,622
Free reserves 291,429 266,436
Mut
ual C
lubs“Aon comment: Another solid overall financial result for the club. Skuld’s ability to
consistently deliver positive technical underwriting surpluses is very noteworthy“

24
A o n M a r i n e I n s u r a n c e R e v i e w 2 0 1 2
Entered GT by region
Other10%
Asia Pacific22%
Europe52%
Americas16%
Standard Club
Manager’s commentThis has been both an eventful year and one of
consolidation. The Standard Club remains very well
placed to continue to provide members with the service
and security that they need.
Although the underwriting has been challenging, we are
reporting another overall surplus, so that the financial
security that the club provides to its members is stronger
than ever.
The year also saw an internal consolidation of the club
into fewer underwriting entities, a change that has
enabled more effective use of capital and reduced
compliance costs.
Number of ships
2012: 7,511 2011: 7,257 2010: 6,890
Average GT
2012: 17,080 2011: 16,537 2010: 15,084
Owned GT
2012: 96,000,000 2011: 86,000,000 2010: 76,000,000
Fixed premium GT
2012: 29,000,000 2011: 37,000,000 2010: 39,000,000
The Standard Steamship Owners’ P&I Association (Bermuda) Limited
12/13 Essex Street, London WC2R 3AA, UK
standard-club.com
t +44 (0)20 3320 8888
Entered GT by vessel type
Tanker28%
Passenger & Ferry
6%Other3%
Offshore13%
Dry Bulk24%
Container & General Cargo
27%
25
A o n M a r i n e I n s u r a n c e R e v i e w 2 0 1 2
Breakdown of investment by type
Cash14%
Gold1%
Alternativeassets3%
Equities17%
Bonds64%
Policy year ‘00 ‘01 ‘02 ‘03 ‘04 ‘05 ‘06 ‘07 ‘08 ‘09 ‘10 ‘11 ‘12
General increase % 0 7.5 2.5 25 20 12.5 5 5 15 15 3 3.5 5
Supplementary call record % 25/25 25/25 0/0 0/0 0/0 0/0 0/0 0/0 0/0 0/0 0/0 0/0 0/0
(Estimated/Called). * includes the effect of an increase in budgeted supplementary call.
S&P Rating Aug 2010 Aug 2011 Aug 2012
Rating A A A
Outlook Stable Stable Stable
Type of rating Interactive Interactive Interactive
Financial year balance sheet data (year ending February) USD000s
2012 2011
Income Calls and premiums 286,200 278,100
Excess calls 0 0
Reinsurance premiums -65,500 -68,200
Total income 220,700 209,900
Expenditure Net claims incurred -240,900 -170,800
Net operating expenses -23,900 -21,100
Total expenditure -264,800 -191,900
Underwriting result pre investment/other financial income and tax
-44,100 18,000
Investment/other financial income 49,600 59,600
Tax/interest charged -2,600 -700
Overall result 2,900 76,900
Free reserves 352,600 349,700
Mut
ual C
lubs
“Aon comment: A challenging year rescued by a fantastic investment performance. The Club will need to take measures to reduce the underwriting deficit.“
Please note that the data included for both the 2011 and 2012 policy years now includes the results of both the Standard London and Standard War Risks which it has not done in the past.

26
A o n M a r i n e I n s u r a n c e R e v i e w 2 0 1 2
Entered GT by region
Other7%
Asia Pacific38%
Europe31%
Americas24%
Steamship Mutual
Manager’s commentIn the difficult economic environment the financial
performance of the club over the past year has been
satisfactory. The capital position remains strong and
stable, albeit with a marginal reduction in free reserves,
some 2%, mainly due to a small deterioration in back
year estimates.
Tonnage increased to a total entered tonnage of 92
million. A very few fleets left or reduced their entry at
the renewal, mostly because agreement could not be
reached when the record suggested that an increase in
premium was necessary.
It is always unfortunate to see business leaving the
club but sound underwriting and equity between the
membership must have priority.
Number of ships
2012: 9,327 2011: 9,035 2010: 7,780
Average GT
2012: 6,712 2011: 6,397 2010: 6,787
Owned GT
2012: 62,600,000 2011: 57,800,000 2010: 52,800,000
Fixed premium GT
2012: 30,000,000 2011: 34,000,000 2010: 30,000,000
The Steamship Mutual Underwriting Association (Bermuda) Limited
Aquatical House, 39 Bell Lane, London E1 7LU, UK
simsl.com
t +44 (0)20 7247 5490
Entered GT by vessel type
Other4%
Passenger13%
Container17%
Bulker/General Cargo45%
Tanker22%
27
A o n M a r i n e I n s u r a n c e R e v i e w 2 0 1 2
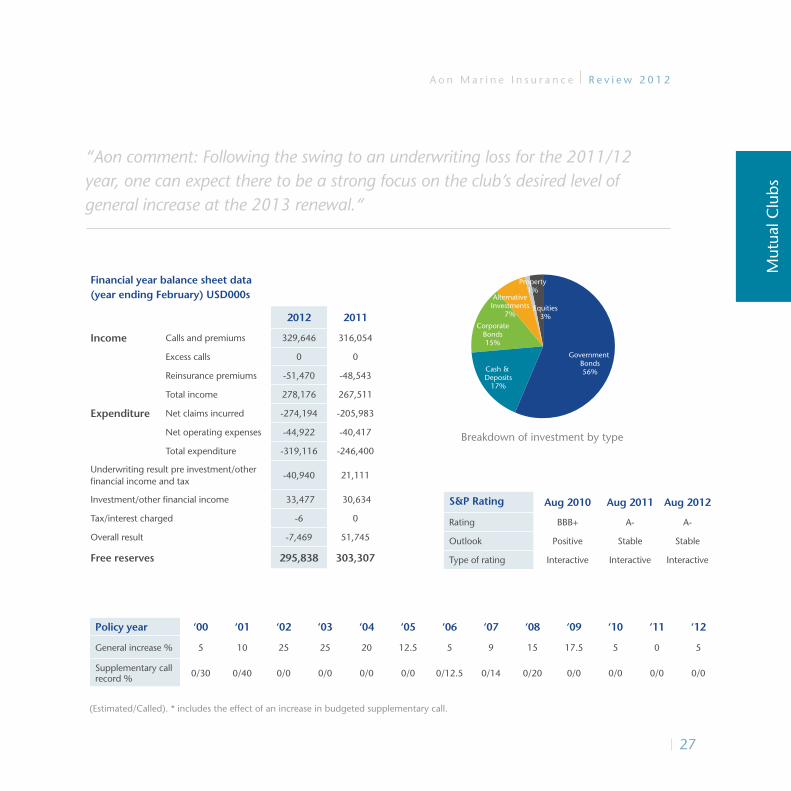
Breakdown of investment by type
Equities3%
Property1%
AlternativeInvestments
7%
CorporateBonds15%
Cash & Deposits
17%
Government Bonds56%
Policy year ‘00 ‘01 ‘02 ‘03 ‘04 ‘05 ‘06 ‘07 ‘08 ‘09 ‘10 ‘11 ‘12
General increase % 5 10 25 25 20 12.5 5 9 15 17.5 5 0 5
Supplementary call record % 0/30 0/40 0/0 0/0 0/0 0/0 0/12.5 0/14 0/20 0/0 0/0 0/0 0/0
(Estimated/Called). * includes the effect of an increase in budgeted supplementary call.
S&P Rating Aug 2010 Aug 2011 Aug 2012
Rating BBB+ A- A-
Outlook Positive Stable Stable
Type of rating Interactive Interactive Interactive
Financial year balance sheet data (year ending February) USD000s
2012 2011
Income Calls and premiums 329,646 316,054
Excess calls 0 0
Reinsurance premiums -51,470 -48,543
Total income 278,176 267,511
Expenditure Net claims incurred -274,194 -205,983
Net operating expenses -44,922 -40,417
Total expenditure -319,116 -246,400
Underwriting result pre investment/other financial income and tax
-40,940 21,111
Investment/other financial income 33,477 30,634
Tax/interest charged -6 0
Overall result -7,469 51,745
Free reserves 295,838 303,307
Mut
ual C
lubs
“Aon comment: Following the swing to an underwriting loss for the 2011/12 year, one can expect there to be a strong focus on the club’s desired level of general increase at the 2013 renewal.“
28
A o n M a r i n e I n s u r a n c e R e v i e w 2 0 1 2
Entered GT by region
Other2%
Asia Pacific34%
Europe64%
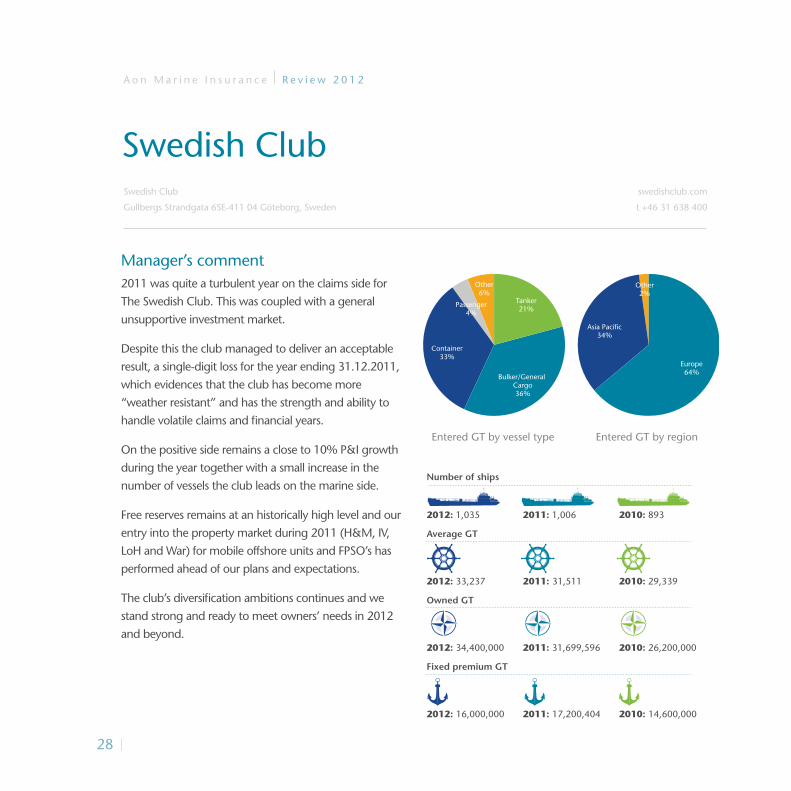
Manager’s comment2011 was quite a turbulent year on the claims side for
The Swedish Club. This was coupled with a general
unsupportive investment market.
Despite this the club managed to deliver an acceptable
result, a single-digit loss for the year ending 31.12.2011,
which evidences that the club has become more
“weather resistant” and has the strength and ability to
handle volatile claims and financial years.
On the positive side remains a close to 10% P&I growth
during the year together with a small increase in the
number of vessels the club leads on the marine side.
Free reserves remains at an historically high level and our
entry into the property market during 2011 (H&M, IV,
LoH and War) for mobile offshore units and FPSO’s has
performed ahead of our plans and expectations.
The club’s diversification ambitions continues and we
stand strong and ready to meet owners’ needs in 2012
and beyond.
Swedish Club
Number of ships
2012: 1,035 2011: 1,006 2010: 893
Average GT
2012: 33,237 2011: 31,511 2010: 29,339
Owned GT
2012: 34,400,000 2011: 31,699,596 2010: 26,200,000
Fixed premium GT
2012: 16,000,000 2011: 17,200,404 2010: 14,600,000
Swedish Club
Gullbergs Strandgata 6SE-411 04 Göteborg, Sweden
swedishclub.com
t +46 31 638 400
Entered GT by vessel type
Other6%
Passenger4%
Container33%
Bulker/General Cargo36%
Tanker21%

29
A o n M a r i n e I n s u r a n c e R e v i e w 2 0 1 2
Breakdown of investment by type
Equities20%
Bonds and Cash80%
Policy year ‘00 ‘01 ‘02 ‘03 ‘04 ‘05 ‘06 ‘07 ‘08 ‘09 ‘10 ‘11 ‘12
General increase % 0 7.5 25 25 15 10 10 7.5 15 15 2.5 2.5 5
Supplementary call record % 0/0 0/0 0/0 0/0 0/0 0/0 0/35 0/35 0/0 0/0 0/0 0/0 0/0
(Estimated/Called). * includes the effect of an increase in budgeted supplementary call.
S&P Rating Aug 2010 Aug 2011 Aug 2012
Rating BBB BBB BBB+
Outlook Stable Positive Positive
Type of rating Interactive Interactive Interactive
Financial year balance sheet data (year ending February) USD000s
2012 2011
Income Calls and premiums 91,356 85,280
Excess calls 0 0
Reinsurance premiums -19,038 -16,920
Total income 72,318 68,360
Expenditure Net claims incurred -71,014 -52,088
Net operating expenses -12,675 -11,644
Total expenditure -83,689 -63,732
Underwriting result pre investment/other financial income and tax
-11,371 4,628
Investment/other financial income 2,865 9,333
Tax/interest charged 0 0
Overall result -8,506 13,961
Free reserves (includes reserves available to non P&I business) 141,900* 151,200**
* for the year ending December 2011 ** for the year ending December 2010
Mut
ual C
lubs“Aon comment: A heavy claims year for a small Club with 3 large enough to be
poolable. A return to normality is needed in 2012/13.“

30
A o n M a r i n e I n s u r a n c e R e v i e w 2 0 1 2
Entered GT by region
Asia Pacific37%
Europe51%
Americas12%
UK P&I Club
Manager’s comment
Good result in difficult times
This year we report another operating surplus, USD11
million, further increasing the club’s free reserves and
capital to USD486 million. This level of capital puts our
club’s financial strength at the top level of its peer group
in the P&I sector.
Continuing improvement in the claims reserves on the
more recent policy years and early indications that 2011
will be a low claims year contrasts with results elsewhere
in the market adversely affected by an increase in claims
and volatile investment returns.
Our Board is determined that the UK Club should
be the leading shipowner controlled provider of P&I
insurance and other services. That commitment is the
guiding principle for everything we do. Whether it is the
competitive insurance and services we provide to our
members worldwide or the strengthening of the club’s
capital position which has become absolutely essential
for any insurance provider in the modern regulatory
environment.
The United Kingdom Mutual Ship Assurance Association (Bermuda) Limited
Thomas Miller P&I Ltd, 90 Fenchurch Street, London, EC3M 4ST, UK
ukpandi.com
t +44 (0)20 7283 4646
Entered GT by vessel type
Other18%
Passenger4%
Container14%
Bulker/General Cargo34%
Tanker30%
Number of ships
2012: 3,346 2011: 3,400 2010: 3,416
Average GT
2012: 33,473 2011: 30,882 2010: 31,177
Owned GT
2012: 112,000,000 2011: 105,000,000 2010: 106,500,000
Fixed premium GT
2012: 80,000,000 2011: 80,000,000 2010: 70,000,000

31
A o n M a r i n e I n s u r a n c e R e v i e w 2 0 1 2
Breakdown of investment by type
Absolute return funds
11.15%Equities10.31%
Cash11.15%
Fixed interest68.31%
Policy year ‘00 ‘01 ‘02 ‘03 ‘04 ‘05 ‘06 ‘07 ‘08 ‘09 ‘10 ‘11 ‘12
General increase % 0 7.5 20 25 17.5 12.5 12.5 7.5 17.5 12.5 5 5 3
Supplementary call record % 0/0 0/0 0/0 0/0 0/0 0/0 0/20 0/25 0/20 0/0 0/0 0/0 0/0
(Estimated/Called). * includes the effect of an increase in budgeted supplementary call.
S&P Rating Aug 2010 Aug 2011 Aug 2012
Rating A- A- A-
Outlook Stable Stable Stable
Type of rating Interactive Interactive Interactive
Financial year balance sheet data (year ending February) USD000s
2012 2011
Income Calls and premiums 360,540 364,651
Excess calls 0 140
Reinsurance premiums -70,685 -70,218
Total income 289,855 294,573
Expenditure Net claims incurred -237,754 -250,428
Net operating expenses -42,109 -40,621
Total expenditure -279,863 -291,049
Underwriting result pre investment/other financial income and tax
9,992 3,524
Investment/other financial income 10,214 69,509
Tax/interest charged -9,627 -10,416
Overall result 10,939 62,617
Free reserves including Hybrid capital 485,777 477,855
Free reserves excluding Hybrid capital 386,459 378,993
Mut
ual C
lubs“Aon comment: The growth in free reserves fuelled by a positive underwriting
result puts the club in a strong position for the 2013 renewal. “

32
A o n M a r i n e I n s u r a n c e R e v i e w 2 0 1 2
Entered GT by region
Other8%
Asia Pacific39%
Europe46%
Americas7%
West of England
Manager’s commentThe highlights of the club’s financial performance to
20 February 2012 are the lowest level of claims from
the club’s own members for many years, a free reserve
of USD179.3 million – broadly unchanged from that
of a year ago and a significantly lower combined ratio
of 108.7%. Together they represent a sound platform
for steady growth in the club’s capital position and
overall financial strength in the longer term.
Measures taken at the start of last year to reduce
the club’s exposure to members’ claims through
more selective underwriting and continuation of the
enhanced claims reserving processes established at
the end of 2009, are now feeding through into the
club’s overall financial performance.
External factors in the form of unusually large Pool
claims reported by other clubs for 2011 and volatile
financial markets resulting in a lower than usual
investment return prevented growth in the club’s
free reserve.
Number of ships
2012: 3,030 2011: 3,091 2010: 3,458
Average GT
2012: 16,799 2011: 15,852 2010: 15,124
Owned GT
2012: 50,900,000 2011: 49,000,000 2010: 52,300,000
Fixed premium GT
2012: 15,000,000 2011: 20,000,000 2010: 16,500,000
Number of ships
2012: 3,030 2011: 3,091 2010: 3,458
Average GT
2012: 16,799 2011: 15,852 2010: 15,124
Owned GT
2012: 50,900,000 2011: 49,000,000 2010: 52,300,000
Fixed premium GT
2012: 15,000,000 2011: 20,000,000 2010: 16,500,000
West of England Ship Owners Mutual Insurance Association (Luxembourg)
Tower Bridge Court, 226 Tower Bridge Road, London, SE1 2UP, UK
westpandi.com
t +44 (0)20 7716 6000
Entered GT by vessel type
Other2%
Passenger3%
Container17%
Bulker/General Cargo53%
Tanker25%

33
A o n M a r i n e I n s u r a n c e R e v i e w 2 0 1 2
Breakdown of investment by type
Equities15%
Absolute Return11%
Fixed income57%
Cash17%
Policy year ‘00 ‘01 ‘02 ‘03 ‘04 ‘05 ‘06 ‘07 ‘08 ‘09 ‘10 ‘11 ‘12
General increase % 5 5 10 25 15 12.5 12.5 5 15 19.2* 5 5 5
Supplementary call record % 50/50 20/20 20/20 20/20 20/35 20/35 20/55 20/55 20/65 30/30 30/30 30/30 30/30
(Estimated/Called). * includes the effect of an increase in budgeted supplementary call.
S&P Rating Aug 2010 Aug 2011 Aug 2012
Rating BBB BBB BB
Outlook N/A N/A N/A
Type of rating Pi Pi Pi
Financial year balance sheet data (year ending February) USD000s
2012 2011
Income Calls and premiums 211,551 243,167
Excess calls 0 0
Reinsurance premiums -33,008 -39,831
Total income 178,543 203,336
Expenditure Net claims incurred -157,595 -204,473
Net operating expenses -36,492 -35,532
Total expenditure -194,087 -240,005
Underwriting result pre investment/other financial income and tax
-15,544 -36,669
Investment/other financial income 11,250 54,307
Tax/interest charged 986 -4,083
Overall result -3,308 13,555
Free reserves 179,356 182,664
Mut
ual C
lubs
“Aon comment: The Club continues to improve the underwriting performance showing they are heading in the right direction. The improvements need to continue going forward.“

P&I Comparative Data.
35
A o n M a r i n e I n s u r a n c e R e v i e w 2 0 1 2
Free Reserves/Net Call Income 37
Net Claims/Net Call Income 37
Underwriting Result/Net Call Income 38
Overall Result/Net Call Income 38
Gross Call/GT 39
Net Claims/GT 39
P&I C
ompa
rativ
e D
ata

36
A o n M a r i n e I n s u r a n c e R e v i e w 2 0 1 2
Traditionally the popular method of comparing the
financial health of clubs has been to generate key
performance indicators around GT, call income, claims
and reserves. Although we have used GT as part of
our analysis, we do not consider it the most useful
constant.
A club with a high USD per GT ratio is not necessarily
an expensive or conservative club; one with a low
figure, likewise, is not necessarily competitive as GT
does not give any allowance for the type of vessels
within the club nor the individual retentions or loss
records they may carry. We have always said that
since premium is the underwriter’s assessment of risk
it is more valid to use annual call income to generate
comparative analytical data. Over the last few years
a number of clubs have made excess calls to cover a
shortfall in their finances and a couple of others have
called less than their originally estimated deferred calls.
Variations from the estimated total call tend to be rare
and give a distorted view of a club’s financial position.
We therefore do not include these adjustments in
analysis and use the original estimated total call for
comparisons. Conversely, free reserves will continue to
benefit year on year from the effects of an excess call,
and therefore have not been adjusted.
Our analysis is based on financial year dataFree Reserves/Net Call Income
Free reserves shown as a percentage of net annual
call income.
Net Claims/Net Call Income
Total incurred losses shown as a percentage of net
annual call income.
Underwriting Result/Net Call Income
Underwriting profit/loss calculated before investment
and other financial income has been taken into
account shown as a percentage of net call income.
Overall Result/Net Call Income
Underwriting profit/loss after investment and other
financial income has been taken into account shown
as a percentage of net call income.
Gross Call/GT
Total gross call income shown as USD per total GT
entered for owners’ risks.
Net Claims/GT
Total incurred losses shown as USD per total GT
entered for owners’ risks.
Notes1. Total incurred losses include paid and outstanding claims, provision
for incurred but not reported losses, net of reinsurance recoveries.2. Net annual call income excludes the cost of reinsurance and the
product of an excess call.3. UK Club free reserves include ‘Hybrid’ capital.4. The reduction in Gard’s 2010/11and 2011/12 deferred call has
been reinstated.
P&I Comparative Data
5. American Club’s ratios are in respect of the years 12 months at 1st December 2010 and 2011.

37
A o n M a r i n e I n s u r a n c e R e v i e w 2 0 1 2
P&I C
ompa
rativ
e D
ata
Free reserves/Net call income
Amer
ican
Brita
nnia
Gard
Japan
Lond
onNor
th
Shipo
wners
Skuld
Stan
dard
Stea
msh
ip
Swed
ish UKW
est
2012 2011
0
50
100
150
200
250
Amer
ican
Brita
nnia
Gard
Japan
Lond
onNor
th
Shipo
wners
Skuld
Stan
dard
Stea
msh
ip
Swed
ish UKW
est
2012 2011
0
50
100
150
200
250
Net claims/Net call income
Amer
ican
Brita
nnia
Gard
Japan
Lond
onNor
th
Shipo
wners
Skuld
Stan
dard
Stea
msh
ip
Swed
ish UKW
est
2012 2011
0
50
100
150
Net call income reflects the club’s assessment of current and future risk.
Free reserves are the club’s safety net if past and future liabilities exceed the club’s assessment.
The greater the ratio between free reserve and net call income the greater the club’s safety net. This ratio should be viewed in conjunction with chart ‘Underwriting result/net call income’ as the more positive the underwriting result the less critical the free reserve to net call ratio.
Net call income reflects the club’s assessment of current and future risk.
Net claims are the club’s actual current exposure (and a guide to future exposure).
The lower the ratio between net claims and net call income the more favourable the underlying underwriting position.

38
A o n M a r i n e I n s u r a n c e R e v i e w 2 0 1 2
Underwriting result/Net call income
Amer
ican
Brita
nnia
Gard
Japan
Lond
onNor
th
Shipo
wners
Skuld
Stan
dard
Stea
msh
ip
Swed
ish UKW
est
2012 2011
-25
-20
-15
-10
-5
0
5
10
15
20
25
Overall result/Net call income
Amer
ican
Brita
nnia
Gard
Japan
Lond
onNor
th
Shipo
wners
Skuld
Stan
dard
Stea
msh
ip
Swed
ish UKW
est
2012 2011
-15
-10
-5
0
5
10
15
20
25
30
35
40
Net call income reflects the club’s assessment of current and future risk.
Underwriting result is the actual product of the current net claims and operating costs to net call income.
The greater the ratio between underwriting result and net call income the greater the likelihood of a surplus.
Net call income reflects the club’s assessment of current and future risk.
Overall result is the actual product of the current net claims and operating costs to net call income, investment income and exchange loss/gains.
The greater the ratio between overall result and net call income the greater the likelihood of a surplus but this may also indicate a greater than average sensitivity to investment performance.

39
A o n M a r i n e I n s u r a n c e R e v i e w 2 0 1 2
P&I C
ompa
rativ
e D
ata
Gross call/GT
Amer
ican
Brita
nnia
Gard
Japan
Lond
onNor
th
Shipo
wners
Skuld
Stan
dard
Stea
msh
ip
Swed
ish UKW
est
2012 2011
0
2
4
6
8
10
12
Net claims/GT
Amer
ican
Brita
nnia
Gard
Japan
Lond
onNor
th
Shipo
wners
Skuld
Stan
dard
Stea
msh
ip
Swed
ish UKW
est
2012 2011
0
1
2
3
4
5
6
Gross call income reflects the club’s total income (inclusive of group reinsurance costs) as an assessment of current and future risk.
Total entered GT is a measure of the size of the club, but provides no indication of current or future risk.
The ratio can give some assessment of the club’s membership risk profile.
Net claims are the club’s actual current exposure (and a guide to future exposure).
Total entered GT is a measure of the size of the club, but provides no indication of current or future risk.
The ratio can give an assessment of the club’s current membership risk profile.
The greater the ratio between the indicators in the above two charts the greater the likelihood of a surplus.

P&I Club Market Reference.

41
A o n M a r i n e I n s u r a n c e R e v i e w 2 0 1 2
2012 Policy Year Mutual Reinsurance Structure 42
P&I Class Supplementary Call History 46
P&I Class General Increase History 47
P&I C
lub
Mar
ket
Refe
renc
e

42
A o n M a r i n e I n s u r a n c e R e v i e w 2 0 1 2
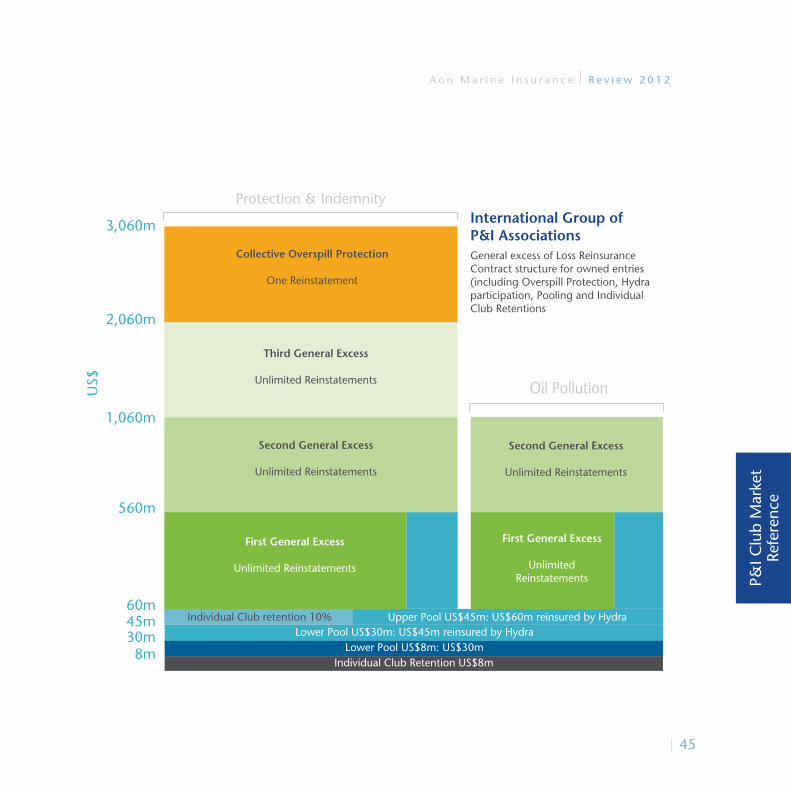
Pooling and structureFor the 2012/13 year the individual club retention
figure remained unchanged at USD8 million with the
Pool limit unchanged at USD60 million with Hydra,
the Group’s captive, participating in the Group’s upper
pool which is currently USD30 million.
There was one amendment to the Pool retention
structure whereby any club that brings a large claim
to the Pool will now bear a 10% retention within the
layer USD15 million excess of USD45 million, with the
balance being apportioned between all Group Clubs.
Claims that exceed the overall limit of the Group’s
excess reinsurance contract, including the reinsured
overspill layer, are then be pooled among the Group
Clubs.
The overall limit for this overspill remains unchanged
at 2.5% of the limitation funds under the 1976
Limitation Convention for all mutual ships entered in
the Group Clubs.
2012 Policy Year Mutual Reinsurance Structure
43
A o n M a r i n e I n s u r a n c e R e v i e w 2 0 1 2
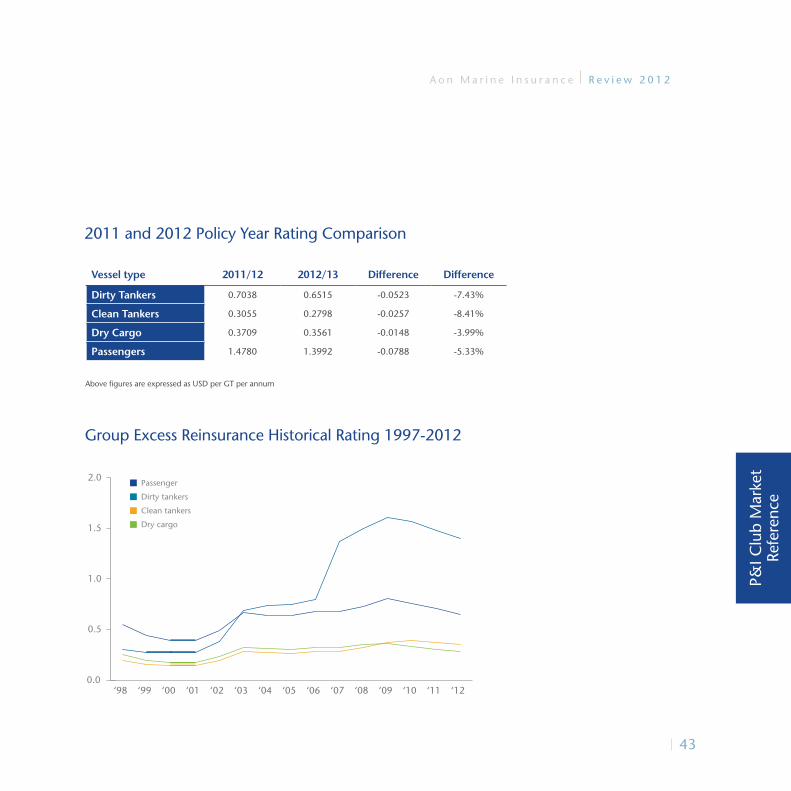
2011 and 2012 Policy Year Rating Comparison
Vessel type 2011/12 2012/13 Difference Difference
Dirty Tankers 0.7038 0.6515 -0.0523 -7.43%
Clean Tankers 0.3055 0.2798 -0.0257 -8.41%
Dry Cargo 0.3709 0.3561 -0.0148 -3.99%
Passengers 1.4780 1.3992 -0.0788 -5.33%
Above figures are expressed as USD per GT per annum
Group Excess Reinsurance Historical Rating 1997-2012
P&I C
lub
Mar
ket
Refe
renc
e
‘98 ‘99 ‘00 ‘01 ‘02 ‘03 ‘04 ‘05 ‘06 ‘07 ‘08 ‘09 ‘10 ‘11 ‘12
Passenger
Dirty tankers
Clean tankers
Dry cargo
0.0
0.5
1.0
1.5
2.0

44
A o n M a r i n e I n s u r a n c e R e v i e w 2 0 1 2
Excess of LossThe International Group’s excess of loss reinsurance
programme was severely impacted by two major
losses by the end of the 2011 policy year.
Whereas the record had been showing signs of
improvement over the previous years, the enormity of
these incidents had a detrimental effect on the overall
loss record and although rating for 2012 had already
been published, an additional premium was paid
by the group to its reinsurers in order to finalise the
contract renewal.
The contract was renewed for the 2012/13 year on
a similar structure to the previous year with only one
slight variation in the pooling arrangement.
Historically separate rating categories, determined by
vessel types, have been utilised to allocate premium
and this format continued for the 2012/13 year with
downward variations in the individual rating categories
as shown opposite:
45
A o n M a r i n e I n s u r a n c e R e v i e w 2 0 1 2
P&I C
lub
Mar
ket
Refe
renc
e
3,060m
Protection & Indemnity
Oil Pollution
2,060m
1,060m
560m
60m45m30m8m
International Group of P&I AssociationsGeneral excess of Loss Reinsurance Contract structure for owned entries (including Overspill Protection, Hydra participation, Pooling and Individual Club Retentions
Collective Overspill Protection
One Reinstatement
Third General Excess
Unlimited Reinstatements
Second General Excess
Unlimited Reinstatements
Second General Excess
Unlimited Reinstatements
First General Excess
Unlimited Reinstatements
Individual Club retention 10% Upper Pool US$45m: US$60m reinsured by HydraLower Pool US$30m: US$45m reinsured by Hydra
Lower Pool US$8m: US$30mIndividual Club Retention US$8m
First General Excess
UnlimitedReinstatements
US$

46
A o n M a r i n e I n s u r a n c e R e v i e w 2 0 1 2
P&I Class Supplementary Call History
Policy year 01/02 02/03 03/04 04/05 05/06 06/07 07/08 08/09 09/10 10/11 11/12 12/13
American Club 25/60 40/70 20/56 0/0 0/20 0/35 0/30 0/25 20/20 25/25 25/25 0/0
Britannia 25/25 40/40 40/40 40/30 40/30 30/30 30/30 40/40 40/32.5 40/40 40/40 40/40
Gard 25/25 25/25 25/25 25/25 25/20 25/20 25/25 25/25 25/10 25/15 25/20 25/25
Japan Club 20/10 20/20 30/10 30/30 30/30 30/60 30/30 30/30 40/40 40/50 40/40 40/40
London Steamship 40/40 40/40 40/40 40/40 40/40 40/89 40/89 40/75 40/40 0/0 0/0 0/0
North of England 25/25 25/25 25/25 0/0 0/0 0/0 0/0 0/0 0/0 0/0 0/0 0/0
Shipowners 25/0 25/0 25/0 25/0 25/0 25/0 25/0 25/0 10/0 10/0 10/0 10/0
Skuld 20/20 0/0 0/0 0/0 0/0 0/0 0/0 0/0 0/0 0/0 0/0 0/0
Standard 25/25 0/0 0/0 0/0 0/0 0/0 0/0 0/0 0/0 0/0 0/0 0/0
Steamship 0/40 0/0 0/0 0/0 0/0 0/12.5 0/14 0/20 0/0 0/0 0/0 0/0
Swedish 0/0 0/0 0/0 0/0 0/0 0/35 0/35 0/0 0/0 0/0 0/0 0/0
UK 0/0 0/0 0/0 0/0 0/0 0/20 0/25 0/20 0/0 0/0 0/0 0/0
West of England 20/20 20/20 20/20 20/35 20/35 20/55 20/55 20/65 30/30 30/30 30/30 30/30
Original estimate/actual or current estimate as percentage of advance call/estimated total call as applicable.
Excess Supplementary Call
Reduced Supplementary Call
Open Year

47
A o n M a r i n e I n s u r a n c e R e v i e w 2 0 1 2
Policy year 2001 2002 2003 2004 2005 2006 2007 2008 2009 2010 2011 2012
American 10 26 25 17.5 10 10 10 20 29 4.16 2 5
Britannia 10 28.8 15 8.5 7.5 2.5 5 23.8 12.5 5 5 5
Gard 10 25 15 7.5 5 7.5 5 10 15 0 0 5
Japan 0 0 10 0 0 0 10 20 21.1 12.5 10 3
London 10 27.5 25 15 12.5 12.5 7.5 17.5 15 5 5 5
North 10 25 25 17.5 12.5 7.5 7.5 17.5 17.5 5 3 5
Shipowners 0 20 15 0 0 0 5 15 10 5 0 0
Skuld 10 30 25 15 7.5 5 2.5 7.5 15 5 n/a n/a
Standard 7.5 2.5 25 20 12.5 5 5 15 15 3 3.5 5
Steamship 10 25 25 20 12.5 5 9 15 17.5 5 0 5
Swedish 7.5 25 25 15 10 10 7.5 15 15 2.5 2.5 5
UK 7.5 20 25 17.5 12.5 12.5 7.5 17.5 12.5 5 5 3
West 5 10 25 15 12.5 12.5 5 15 19.2 5 5 5
average 7.5 20.4 21.5 13 8.8 6.9 6.7 16.1 16.5 4.8 3.4 4.3
P&I Class General Increase History
Percentage of advance call/estimated total call as applicable including any change in budgeted supplementary
call estimate.
P&I C
lub
Mar
ket
Refe
renc
e

Specialist Markets.The International Group of P&I Clubs has traditionally provided P&I cover for around 90% of the world’s ocean-going tonnage. However the fixed premium market continues to offer some credible options particularly in the smaller vessel division. Over the coming months there are expected to be significant developments in this sector of the P&I market with some new and interesting entrants emerging supported by some internationally recognised security. However in this review we have concentrated on the larger and more established fixed premium P&I providers to date.

49
A o n M a r i n e I n s u r a n c e R e v i e w 2 0 1 2
British Marine 50
Eagle Ocean Marine 51
Hydor 52
Navigators 53
Osprey 54
RaetsMarine 55
Spec
ialis
t M
arke
ts
Commentary on individual insurers has been supplied by the insurers themselves.
50
A o n M a r i n e I n s u r a n c e R e v i e w 2 0 1 2
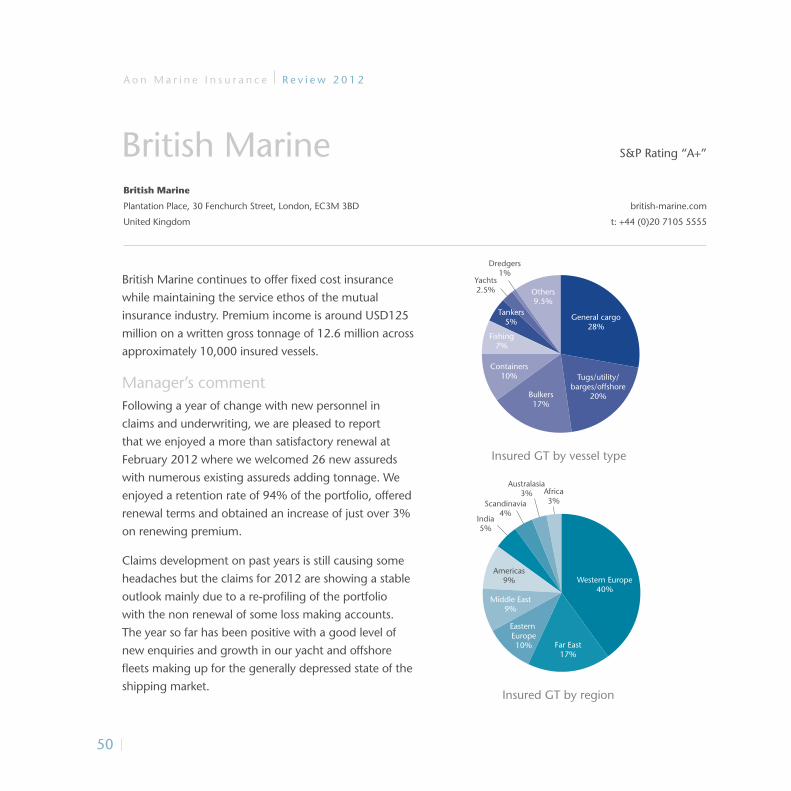
British Marine continues to offer fixed cost insurance
while maintaining the service ethos of the mutual
insurance industry. Premium income is around USD125
million on a written gross tonnage of 12.6 million across
approximately 10,000 insured vessels.
Manager’s commentFollowing a year of change with new personnel in
claims and underwriting, we are pleased to report
that we enjoyed a more than satisfactory renewal at
February 2012 where we welcomed 26 new assureds
with numerous existing assureds adding tonnage. We
enjoyed a retention rate of 94% of the portfolio, offered
renewal terms and obtained an increase of just over 3%
on renewing premium.
Claims development on past years is still causing some
headaches but the claims for 2012 are showing a stable
outlook mainly due to a re-profiling of the portfolio
with the non renewal of some loss making accounts.
The year so far has been positive with a good level of
new enquiries and growth in our yacht and offshore
fleets making up for the generally depressed state of the
shipping market.
British Marine
Western Europe40%
Far East17%
Eastern Europe10%
Middle East9%
Americas9%
India5%
Africa3%Scandinavia
4%
Australasia3%
Insured GT by region
British Marine
Plantation Place, 30 Fenchurch Street, London, EC3M 3BD
United Kingdom
british-marine.com
t: +44 (0)20 7105 5555
General cargo28%
Tugs/utility/barges/offshore
20%Bulkers17%
Containers10%
Fishing7%
Tankers5%
Others9.5%
Yachts2.5%
Dredgers1%
Insured GT by vessel type
S&P Rating “A+”

51
A o n M a r i n e I n s u r a n c e R e v i e w 2 0 1 2
Eagle Ocean Marine
A relatively recent entrant into the fixed premium
market the facility, operated by Eagle Ocean Agencies,
offers full P&I, and FD&D cover with security is
provided by the American Club. Policy limits up to
USD25 million for P&I and USD2 million for FD&D
with a further layer for P&I risks of USD25 million
excess of the primary layer available with Lloyd’s and
company security. Eagle Ocean’s annual premium
income is approximately USD5million with 125 vessels
at risk for a total gross tonnage of just under 500,000.
Manager’s commentEagle Ocean Marine provides attentive, sensibly priced
Protection and Indemnity and Defence insurance
to the operators of smaller vessels for whom a fixed
premium rather than a mutual product is the natural
choice. Eagle Ocean Marine seeks to distinguish itself
from its competitors by linking American Club security
backed by an extensive reinsurance programme
at Lloyd’s and in Germany with a breadth of service,
depth of expertise and speed of response
second-to-none in the industry.
Eagle Ocean Marine
c/o Eagle Ocean Agencies, Inc., One Battery Park Plaza - 31st Floor, New York, NY 10004
United States
Spec
ialis
t M
arke
ts
Asia50%
Europe9%
Americas5%
ROW34%
Insured GT by region
Tank42%
Tug & Barge4%Bulk
15%
General29%
Others2%
Insured GT by vessel type
S&P Rating “BB+”
eagleoceanmarine.com
t: +1 212 847 4600

52
A o n M a r i n e I n s u r a n c e R e v i e w 2 0 1 2
Hydor
Another relatively new entrant into the market
having been in operation since 2012. With security
consisting of 100% Lloyd’s syndicates, Hydor currently
writes a premium income of around USD5million in
premium over 306 vessels on a total gross tonnage of
approximately 2.2 million.
Manager’s commentHydor is a Managing General Agent and writes 100%
of risks on behalf of various Lloyd’s syndicates. Brit
Syndicate 2987 fronts 100% up to USD25 million with
excess layers up to USD500 million underwritten by
17 Lloyd’s syndicates.
The current portfolio is geographically diverse with
largest entries from Norway and Germany. Growth
during the year is international and Hydor now sees
more business coming through London and local
producers globally. Hydor is able to write all kind
of vessels up to 10,000 GT and for Charterers P&I/
FDD, there is no GT limitation. Hydor is focused on
sustainable growth and quality shipping companies.
Hydor
Rådhusgata 25, Oslo
Norway
hydor.no
t: +47 2241 5000
Norway33%
Others12%
Americas6%
Germany13%
Greece9%
Russia6%
MiddleEast6%
Denmark6%
Turkey5%
Greenland4%
Insured GT by region
General cargo27%
Offshore15%
Tank12%
Multipurpose11%
Ferry8%
Bulk7%
Ro/Ro7%
Fishing6%
Tug4%
Others3%
Insured GT by vessel type
S&P Rating “A+”

53
A o n M a r i n e I n s u r a n c e R e v i e w 2 0 1 2
Spec
ialis
t M
arke
ts
Navigators
Being part of a large international marine insurer,
Navigators P&I is in an advantageous position of being
able to offer overall marine packages to include P&I for
operators involved in other types of marine activities.
Insuring around 2.2 million gross tons comprising
1,700 vessels, the estimated premium income of
Navigators is approximately USD22.5 million.
Manager’s commentNavigators P&I provides the unrivalled expertise
necessary to protect against or minimise disruption
to operation of their commercial ships and promptly
delivers funds to indemnify them in event of loss they
have become liable/pay to others arising from such
shipping operations. We continue to offer a USD50
million limit with an option to increase this to USD100
million in selective circumstances. We continue to
concentrate on vessels not exceeding 10,000 GT and
that do not trade trans-Atlantic or trans-Pacific have a
global network, a wide range of competence within
P&I with authority to settle claims. The main claims
handlers and lawyers are based in London.
Navigators P&I
7th floor, 2 Minster Court, Mincing Lane, London EC3R 7BB
United Kingdom
navg.com
t: +44 (0)20 7220 6900
Europe37%
Asia24%
Africa5%Middle
East9%
Mexico &CentralAmerica
10%
SouthAmerica
13%
Others2%
Insured GT by region
S&P rating “A”

54
A o n M a r i n e I n s u r a n c e R e v i e w 2 0 1 2
Osprey
Osprey provides P&I coverage to owners of smaller
craft and vessels, now up to 25,000 gross tons, to a
maximum limit of liability of USD100 million and
fixed premium basis via various Lloyd’s syndicates
and currently insures approximately 2,800 vessels
with an estimated premium income in excess of
USD34 million.
Manager’s commentOsprey Underwriting Agency is a specialist fixed
premium marine insurance provider. Established in
1991, Osprey has this year celebrated its 21st year
in operation, remaining the longest established
fixed premium P&I insurance provider in London.
The agency’s success remains down to the excellent
service and security provided. Against a backdrop
of continued worldwide economic uncertainty and
a changeable fixed premium insurance market, the
agency remains a stable and consistent market focused
on providing quality insurance products with the best
possible security.
Osprey Underwriting Agency Limited
Fountain House, 8th Floor, 130 Fenchurch Street, London, EC3M 5DJ
United Kingdom
osprey-uwr.co.uk
t: +44(0)20 7283 1277
USA66%
Europe14%
Caribbean7%
Asia5%
MiddleEast1%
Africa1%
ROW2%South
America4%
Insured GT by region
Tug & barge49%
Fishing25%
Oilfield services14%
Misc5%
Marine contractors
1%Dry cargo
3%Passenger
3%
Insured GT by vessel type
S&P rating “A+”

55
A o n M a r i n e I n s u r a n c e R e v i e w 2 0 1 2
Spec
ialis
t M
arke
ts
RaetsMarine
RaetsMarine, established in 1993 is a specialist marine
underwriting agency backed by Amlin Corporate
Insurance N.V. (ACI). RaetsMarine continues to
operate as a niche marine insurer with a head office
in Rotterdam and branch offices in Paris, London and
Singapore. The anticipated shipowners P&I premium
income for 2012 is USD62 million on an approximate
gross tonnage of 13 million.
Manager’s commentAt RaetsMarine we believe that the premium you pay
for your insurance should be based only on your actual
level of risk rather than on ‘one-size-fits-all’, generic
costs. That is why we create comprehensive P&I
insurance packages that are precisely tailored to you
and your vessel based on fixed premiums. As a ‘niche’
insurance provider, we go out of our way to cater for
shipowners with particular needs, such as small to
midsize cargo vessels, as well as supply vessels, fishing
boats, tugs and other specialist craft. There are no
restrictions on age, and singletons will be quoted.
RaetsMarine Insurance BV
Fascinatio Boulevard 622, Va Capelle A/D Ijssel,
The Netherlands
raetsmarine.com
t: + 311024 25000
Others2%Africa
2%
Asia Pacific28%
Central-South America5%
Europe55%
Middle East/India8%
Insured GT by region
Specialist craft17%
General cargo19%
Tug16%
Fishing15%
Barge15%
Tankers7%
Others7%
Passenger4%
Insured GT by vessel type
S&P Rating “A-”

Published by Aon UK Limited.
Registered office 8 Devonshire Square, London EC2M 4PL
© Copyright Aon UK Limited 2012. All rights reserved.
No part of this report may be reproduced, stored in a retrieval system, or transmitted in any way or by any means, including photocopying or recording, without the written permission of the copyright holder, application for which should be addressed to the copyright holder.
Aon UK Limited is authorised and regulated by the Financial Services Authority in respect of insurance mediation activities only.
Aon Risk Solutions | Global Broking Centre | Marine 8 Devonshire Square London EC2M 4PL United Kingdom
+44 (0)20 7086 5500
aon.co.uk
Simon Schnorr [email protected]
+44 20 7086 4231
Chris Chadwick [email protected]
+44 20 7086 4185
For media and editorial:
Magnus Allan
+44 20 7086 1277
For more information, please contact:
FP: 7565
This document has been produced using a minimum of 50% recycled material from a sustainable forest.


