62
California Energy Commission STAFF REPORT Review of Los Angeles Department of Water and Power’s 2017 Power Integrated Resource Plan Gavin Newsom, Governor September 2019 | CEC-200-2019-015

California Energy Commission
STAFF REPORT
Review of Los Angeles Department of Water and Power’s 2017 Power Integrated Resource Plan
Gavin Newsom, Governor September 2019 | CEC-200-2019-015

California Energy Commission
Robert Kennedy Melissa Jones David Vidaver Mark Kootstra Primary Author(s)
Mark Kootstra Project Manager
Le-Quyen Nguyen Office Manager SUPPLY ANALYSIS OFFICE
Siva Gunda Deputy Director ENERGY ASSESSMENTS DIVISION
Drew Bohan Executive Director
DISCLAIMER Staff members of the California Energy Commission prepared this report. As such, it does not necessarily represent the views of the Energy Commission, its employees, or the State of California. The Energy Commission, the State of California, its employees, contractors and subcontractors make no warrant, express or implied, and assume no legal liability for the information in this report; nor does any party represent that the uses of this information will not infringe upon privately owned rights. This report has not been approved or disapproved by the Energy Commission nor has the Commission passed upon the accuracy or adequacy of the information in this report.


i
ACKNOWLEDGEMENTS
Noel Crisostomo
Ingrid Neumann
Harinder Kaur
Kelvin Ke
Katharine Larson
Galen Lemei
Rachel MacDonald
David Vidaver
Micah Wofford

ii

iii
ABSTRACT
Senate Bill 350 (De León, Chapter 547, Statutes of 2015), (Public Utilities Code Section 9621) requires the California Energy Commission to review the integrated resource plans of identified publicly owned utilities to ensure they meet various requirements specified in the law, including GHG emission reduction targets and renewable energy procurement requirements. Integrated resource plans are long-term planning documents that outline how publicly owned utilities will meet demand reliably and cost effectively while achieving state policy goals and mandates. Los Angeles Department of Water and Power submitted its 2017 Power Integrated Resource Plan and supplemental information, which the Los Angeles City Council adopted on June 20, 2018, to the California Energy Commission for review on April 30, 2019. This staff paper presents the results of the Energy Commission staff review of the Los Angeles Department of Water and Power integrated resource plan.
Keywords: Publicly owned utility, integrated resource plan, demand, resources, portfolio, generation, transmission, distribution, Renewables Portfolio Standard, forecast, energy efficiency, transportation electrification, demand response, greenhouse gas, GHG, emissions, system reliability, integration, local reliability, energy storage, distributed generation,
Kennedy Robert, Melissa Jones, David Vidaver, and Mark Kootstra. 2019. Staff Paper: Review of Los Angeles Department of Water and Power’s 2017 Power Integrated Resource Plan. California Energy Commission. Publication Number: CEC-200-2019-015.

iv

v
TABLE OF CONTENTS Page
Acknowledgements ...................................................................................... i Abstract ...................................................................................................... iii Table of Contents ........................................................................................ v
List of Tables .............................................................................................. vi Executive Summary .................................................................................... 1
CHAPTER 1: Background, Demand Forecast, and Procurement Plan .................. 3 Introduction ................................................................................................. 3
Energy Commission IRP Review Process ......................................................................................... 3 Overview of Los Angeles Department of Water and Power .............................. 4 Los Angeles Department of Water and Power’s Planning Process .................... 5 Demand Forecast ......................................................................................... 5
Energy and Peak Forecast Methodology and Assumptions ................................................................ 6 Resource Procurement Plan .......................................................................... 8
Existing Resources ........................................................................................................................ 8 Resource Portfolio Evaluation ....................................................................................................... 11 Procurement Strategy ................................................................................................................. 12
CHAPTER 2: Review for Consistency with PUC Section 9621 Requirements ...... 15 Greenhouse Gas Emission Reduction Targets ............................................... 15 Renewables Portfolio Standard Planning Requirements ................................. 17 Retail Rates ............................................................................................... 19 System and Local Reliability ........................................................................ 20
System Reliability ....................................................................................................................... 21 Local Capacity Needs .................................................................................................................. 21 Flexible Capacity Needs ............................................................................................................... 22
Transmission and Distribution Systems ........................................................ 23 Transmission System .................................................................................................................. 24 Distribution System ..................................................................................................................... 24
Disadvantaged Communities and Localized Air Pollutants .............................. 25 Net Energy Demand in Peak Hours .............................................................. 26 Additional Procurement Goals ..................................................................... 27
Energy Efficiency and Demand Response Resources ...................................................................... 27 Energy Storage ........................................................................................................................... 29 Transportation Electrification ....................................................................................................... 30 Portfolio Diversification ................................................................................................................ 31
ACRONYMS................................................................................................... 33

vi
APPENDIX A: DEFINITIONS ............................................................................. 1
APPENDIX B: STANDARDIZED REPORTING TABLES .......................................... 1
ATTACHMENT I: PUBLIC UTILITIES CODE FOR SENATE BILL 350................... I-1
LIST OF FIGURES Page
Figure 1: LADWP and CEC Energy Forecasts 2018-2030 (GWh) ......................... 7
Figure 2: LADWP and Energy Commission Peak Forecasts 2018 — 2030 (MW) ... 8
Figure 3: Sources of Renewables Portfolio Standard Eligible Energy 2019 — 2030 (MWh).......................................................................................................... 18
Figure 4: LADWP Renewable Portfolio in 2019 ................................................ 19
Figure 5: LADWP Portfolio Comparison for 2019 and 2030 ............................... 31
LIST OF TABLES Page
Table 1: Energy Resources by Type 2019, 2025, and 2030 (MWh) ................... 13
Table 2: Capacity Resources by Type for 2019, 2025, and 2030 (MW) ............. 14
Table 3: Greenhouse Gas Emissions from LADWP Resource Portfolio................ 16
Table 4: LADWP Additional Achievable Energy Efficiency Estimates (GWh) ....... 28
Table B-1: Energy Resources, All Years (MWh) ............................................. B-1
Table B-2: Capacity Resources, All Years (MW) ............................................. B-6
Table B-3: GHG Emissions from LADWP’s Resource Portfolio (mT C02e), All Years................................................................................................................. B-10

1
EXECUTIVE SUMMARY
California Public Utilities Code (PUC) Section 9621 requires publicly owned utilities meeting an electrical demand threshold to adopt an integrated resource plan (IRP) that meets certain requirements, targets, and goals, including greenhouse gas emission reduction targets and renewable energy procurement requirements. The California Energy Commission’s (CEC) Publicly Owned Utility Integrated Resource Plan Submission and Review Guidelines require those utilities to file an IRP with data and supporting information sufficient to demonstrate that they meet these requirements and the various targets and planning goals from 2018 to 2030. The Energy Commission must review the IRPs to ensure consistency with the requirements of PUC Section 9621
The Los Angeles Department of Water and Power’s (LADWP) 2017 Power Integrated Resource Plan, submitted on April 30, 2019, outlines the utility’s strategy for procuring future resources that meet the requirements of PUC Section 9621. The IRP provides a path forward as LADWP begins studying and determining the investments needed to achieve the goal of 100 percent clean energy. LADWP relied on system modeling to analyze the long-term economic, environmental, and operational impact of alternative resources. The utility concluded the most cost effective approach for meeting long-term energy needs is a combination of strategies, including early coal replacement, along with increases in energy efficiency, Renewables Portfolio Standard eligible renewables, local solar, energy storage, and electrification of the transportation sector.
As LADWP moves toward a 100 percent clean energy portfolio, the utility faces operational cost and integration challenges posed by increasing levels of intermittent renewable resources. LADWP is currently assessing system reliability to determine viable clean alternatives to repowering of its in-basin natural gas-fired generation. LADWP anticipates additional benefits from higher levels of transportation electrification, including reduced local greenhouse gas and other constituent emissions, by switching from higher emitting fuels (gasoline and diesel) to cleaner electricity. Transportation electrification is also expected to increase electric sales and revenue for the utility, while absorbing potential over-generation of renewables by incentivizing charging when solar production is abundant.
In reviewing LADWP’s IRP and determining consistency with the requirements of PUC Section 9621, CEC staff relied on the four standardized reporting tables and narrative descriptions in the IRP, as well as analysis and verification of the materials submitted. Staff presents the following conclusions in accordance with the requirements of PUC Section 9621:

2
• Achieving Greenhouse Gas Emissions Targets and Renewables Portfolio Standard Requirements: The values reported in the standardized forms, along with the discussion in the IRP filing, demonstrate the utility plans to meet the greenhouse gas emission reduction requirements of PUC Section 9621(b)(1), and the renewable energy procurement requirements of PUC Section 9621(b)(2).
• Meeting Planning Goals: The values reported in the standardized forms, along with the analysis and discussion in the IRP filing, demonstrate the utility intends to meet planning goals related to retail rates, reliability, transmission and distribution systems, localized air pollution, and disadvantaged communities as set forth in PUC Section 9621(b)(3).
• Considering Peak Needs: The values reported in the standardized forms, along with analysis and narrative discussion, demonstrate the utility has considered the role of existing renewable generation, grid operational efficiencies, energy storage, and distributed resources (including energy efficiency) in helping ensure the utility’s energy and reliability needs in the peak hours as set forth in PUC Section 9621(c).
• Addressing Resource Procurement Types: The IRP filing includes values reported in the standardized forms and narrative discussion that demonstrate the utility has addressed the procurement requirements for energy efficiency and demand response, energy storage, transportation electrification, portfolio diversification, and resource adequacy as set forth in PUC Section 9621(d).
The IRP is consistent with the requirements of PUC Section 9621. In addition to the IRP provisions, Senate Bill 350 (De León, Chapter 547, Statutes of 2015) requires the CEC to establish statewide and utility-specific targets to achieve a statewide doubling of energy efficiency by 2030. Staff observes that aggressive energy efficiency and demand response programs are needed for utilities and other energy efficiency providers to meet the 2030 energy efficiency doubling targets and capture the benefits of demand response. As part of the 2019 Integrated Energy Policy Report, the CEC will report on progress in achieving the doubling targets, including those for LADWP, and update the targets as necessary.

3
CHAPTER 1: Background, Demand Forecast, and Procurement Plan
Introduction California Public Utilities Code (PUC) Section 9621 requires publicly owned utilities (POUs) with an annual electrical demand exceeding 700 gigawatt hours (GWh) to develop integrated resource plans (IRPs). IRPs are electricity system planning documents that describe how utilities plan to meet their energy and capacity resource needs between 2018 and 2030, while achieving policy goals and mandates, meeting physical and operational constraints, and fulfilling other priorities such as reducing effects on customer rates. Each IRP filing must include data and supporting information sufficient to demonstrate the utility is meeting these goals and targets. PUC Section 9621 requires the governing board of a POU to adopt an IRP and a process for updating it at least once every five years by January 1, 2019.1
Further, PUC Section 9621 requires POUs meeting the demand threshold to submit an IRP and updates to the California Energy Commission (CEC) for review to determine consistency with the requirements of PUC Section 9621. If the CEC determines an IRP is inconsistent with these requirements, the CEC shall provide recommendations to correct the deficiencies. The CEC adopted the Publicly Owned Utility Integrated Resource Plan Submission and Review Guidelines (POU IRP Guidelines) to govern the submission of the POUs IRPs.2 PUC Section 9622 requires the CEC to review POU IRPs to ensure they achieve PUC Section 9621 provisions (see Attachment I).
This chapter outlines the CEC’s review process and provides an overview of Los Angeles Department of Water and Power (LADWP) and its IRP development process. In addition, the chapter addresses the POU IRP Guidelines requirements that POUs provide a demand forecast and a procurement plan as part of its IRP.
Energy Commission IRP Review Process
1 Public Utilities Code Article 16 (commencing with Section 399.11) of Chapter 2.3 of Part 1 of Division 1. See Attachment I. 2 California Energy Commission. Publicly Owned Utility Integrated Resource Plan Submission and Review Guidelines. Revised Second Edition. October 2018, Publication Number CEC-200-2018-004-CMF.

4
On April 30, 2019, LADWP submitted its IRP and supporting documentation as outlined in the POU IRP Guidelines to the CEC for review.3 Staff’s review occurred in two stages. First, staff performed a completeness review to ensure the IRP filing contained the POU board-adopted IRP, the four standardized tables, and supporting information needed for staff to conduct the review. Then staff conducted a detailed review to determine consistency with the requirements of PUC Section 9621.
Staff assessed and analyzed the data in the standardized tables and narrative provided, conducted informal discussions with LADWP staff, and verified data and information as needed. Staff considered the data supporting the assertions in the IRP in assessing whether the IRP is consistent with the requirements of PUC Section 9621.
Staff relied on internal subject matter experts to review technical sections of the IRP filing including energy and peak demand forecasts, projections for renewable resource additions, and whether they achieved Renewables Portfolio Standard (RPS) procurement requirements, energy efficiency savings projections and programs, and plans for transportation electrification.
Overview of Los Angeles Department of Water and Power LADWP is the largest municipal utility in the U.S. and California’s third largest utility as described below:
• LADWP supplies power for over 1.5 million residential and business customers in the City of Los Angeles (City), as well as over 5,000 customers in the Owens Valley.
• Business and industry consume about 70 percent of the electricity in Los Angeles, while residents constitute the largest number of customers.
• In 2017, LADWP supplied about 26 million megawatt-hours (MWh) of electricity from its portfolio of over 7,880 MW of diverse thermal and renewable resources.
• LADWP’s highest instantaneous peak demand of 6,502 MW occurred on August 31, 2017.
• LADWP has over 3,500 miles of overhead transmission circuits spanning five Western states and 124 miles of underground transmission.
3 The POU IRP Guidelines define an IRP filing to include the IRP adopted by the governing board, along with standardized tables and other supporting information required to review the IRP for consistency with SB 350.

5
• The LADWP distribution system includes about 6,750 miles of overhead distribution lines and 3,625 miles of underground distribution cables that serve its customers.
Los Angeles Department of Water and Power’s Planning Process LADWP has historically used integrated resource planning to determine the mix of future resources that will best serve its customers’ electricity needs. LADWP’s IRP is based on its 2017 Power Strategic Long-Term Resource Plan (2017 SLTRP) that was approved by the General Manager in April 2018.4 The 2017 SLTRP re-examined and expanded LADWP’s analysis of previous resource cases to align with the latest regulatory framework. Revised scenario assumptions included a 55 percent RPS (by 2030), advanced energy efficiency, and higher levels of local solar, energy storage, and transportation electrification. The City of Los Angeles Board of Water and Power Commissioners approved LADWP’s IRP on November 27, 2018.
Demand Forecast The POU IRP Guidelines (Chapter 2.E.1) identify the need for a forecast of energy and peak demand to determine whether a POU’s IRP is consistent with the requirements of PUC Section 9621.5 In addition, under the POU IRP Guidelines (Chapter 2.E.2), the POU must provide information on the method used in developing the demand forecast if a POU uses a forecast other than the CEC’s adopted demand forecast.6 The demand forecast and the supporting information provided were determined to present an adequate estimation of future energy and peak demand that meets the POU IRP Guidelines requirements.
LADWP forecasts that electricity consumption in its service territory will initially increase slowly and then remain flat over the next eight years as energy efficiency and customer installed solar PV expansion offset growth from economic activity. However, after 2027, annual demand is expected to rise again for LADWP. In total, between 2019 and 2030, LADWP forecasts its annual energy demand will grow about 11 percent, reaching 29.7 million MWh by 2030. LADWP forecasts annual peak demand over the next ten years will decrease from 5,898 MW in 2019 to 5,660 MW in 2030, with more reduction occurring over the latter years due to increased implementation of energy efficiency and solar PV
4 2017 Power Strategic Long-Term Resource Plan. LADWP. 2018. 5 POU IRP Guidelines, Chapter 2, E., pp. 5-6. 6 The most recent adopted demand forecast is for the 2018 Integrated Energy Policy Forecast Update.

6
programs. Also aiding the reduction of peak demand is the growth of demand response programs, which reduces peak demand by 125 MW in 2019 and about 500 MW in 2030.
Energy and Peak Forecast Methodology and Assumptions LADWP’s IRP uses its official 2017 Load Forecast for its customer demand for electricity by retail class over the next 20 years.7 The utility uses econometric models to forecast sales in residential, commercial and industrial classes. Trend models are used to forecast sales in the streetlight and Owens Valley classes. LADWP used the CEC’s 2013 EV forecast for the electric vehicle sales. The drivers in the retail sales models include normalized weather, population, employment, construction activity, and personal consumption and income. The retail sales forecasted from the class models are adjusted for LADWP programs that affect consumption behind the meter such as energy efficiency and net-metered solar generation, as well as known state regulations.
From the sales forecast, the utility develops an energy, or net energy for load, forecast by applying a normalized loss factor of 12 percent.8 LADWP used an econometric model to develop weather response functions to forecast peak demand. The weather response model includes temperature, heat buildup, and time of the summer, as drivers. Peak demand grows over time as a function of the energy forecast adjusted for energy efficiency, net-metered solar, residential lighting, and charging of electric vehicles. The energy forecast is allocated into an hourly shape using the Loadform algorithm developed by Global Energy. The inputs into the algorithm include forecasted energy, peak demand, minimum demand, and historical system average load shape.
The CEC’s energy demand forecast for LADWP in the high demand case (low AAEE and AAPV) remains relatively flat over the forecast periods,9 while the mid demand case (mid AAEE and AAPV) decreases.10 Both CEC forecasts are lower than LADWP’s forecast as shown in Figure 1.
7 LADWP’s 2017 forecast is used as the basis for transmission and distribution planning, wholesale marketing and other planning activities. The forecast is a public document that uses only publicly available information. 8 For the purposes of IRP filings, a load-serving entity’s net energy for load is the total amount of energy that it must generate or purchase to meet its retail load obligations. It includes retail consumption and transmission, distribution, storage and other losses, but excludes energy needed to meet wholesale sales obligations. 9 The Energy Commission forecast is California Energy Demand Updated Forecast 2018-2030 (CEDU 2018), adopted February 20, 2019. 10 The Energy Commission produced seven different demand forecast for load-serving entities/balancing authorities for the 2018 Integrated Energy Policy Report that reflect varying demand conditions combined with varying amounts of energy efficiency and solar photovoltaic.

7
Figure 1: LADWP and CEC Energy Forecasts 2018-2030 (GWh)
Source: California Energy Commission, based on 2017 LADWP IRP filing and California Energy Commission 2019 Demand Forecast.
Figure 2 shows a comparison of LADWP’s peak demand forecast with the CEC’s forecasts. The CEC’s high demand forecast (low AAEE and AAPV) is relatively flat over the forecast period, while the mid demand case (mid AAEE and mid AAPV) shows a modest decline. For this figure, LADWP’s forecast falls between the CEC’s two cases.
AAEE refers to additional achievable energy efficiency and AAPV refers to additional achievable photovoltaic.
-
5,000
10,000
15,000
20,000
25,000
30,000
35,000G
Wh
CEC Mid Demand, Mid AAEE, AAPV CEC High Demand, Low AAEE, AAPV
LADWP

8
Figure 2: LADWP and Energy Commission Peak Forecasts 2018 — 2030 (MW)
Source: California Energy Commission, based on 2017 LADWP IRP filing and California Energy Commission 2019 Demand Forecast.
Resource Procurement Plan The POU IRP Guidelines require that POUs report the mix of resources they plan to use to meet demand from 2018 to 2030. POUs are also required to provide an IRP with data and supporting information sufficient to demonstrate that the POUs plan to meet targets and goals. Staff has determined that LADWP’s IRP meets the requirements. The following is a discussion of the utility’s existing resources, procurement strategy, the portfolio analysis underlying resource selections, and the resources in 2030 identified in the standardized forms.
Existing Resources LADWP maintains a policy of owning or controlling transmission and generation resources to serve its customer loads. Generation assets not wholly owned by LADWP are entitlement rights from interests in facilities jointly owned with other utilities. At times, LADWP makes purchases from the electricity market to ensure reliability. LADWP’s existing resources are described below.11 LADWP’s existing renewable resources are addressed in the section on Renewables Portfolio Standard Requirements.
Hydroelectric Generating Facilities LADWP owns the Castaic Pumped-Storage Hydroelectric Plant (Castaic) located in Castaic, California, which is its largest source of hydroelectric capacity. That 11 Descriptions of existing resources in this section come from LADWP’s 2017 SLTRP.
-
1,000
2,000
3,000
4,000
5,000
6,000
7,000M
W
CEC Mid Demand, Mid AAEE, AAPV CEC High Demand, Low AAEE, AAPV
LADWP

9
plant consists of seven units totaling 1,175 MW of dependable capacity.12 LADWP also has a power purchase agreement with the Western Area Power Administration (WAPA) for 432 MW of dependable capacity from the Hoover Dam, located on the Arizona-Nevada border.
LADWP owns a network of several small hydroelectric generating resources, referred to as the Owens Gorge and Owens Valley Hydroelectric Generation. These plants use water resources from the Los Angeles Aqueduct and three creeks along the eastern Sierra Nevada Mountains to provide about 136 MW of dependable capacity. In 2016, LADWP reconditioned or refurbished selected components of this system to extend the life, increase reliability, and improve efficiency. LADWP has a number of other small hydro resources north of Los Angeles, bringing the total dependable capacity from small hydroelectric facilities to 314 MW.
Natural Gas Power Plants LADWP is the sole owner and operator of four natural gas-fired electric generation stations located in the Los Angeles Basin (or in-basin units), totaling about 3,533 MW of dependable capacity. LADWP owns and operates three coastal power plants in the southern portion of the Los Angeles Basin: Haynes Generating Station, Harbor Generating Station, and Scattergood Generating Station. These coastal power plants were constructed from the 1940’s through the 1970’s. The Haynes Generating Station is the largest of LADWP’s in-basin natural gas plants with 11 generating units and a dependable capacity of 1,619 MW. The Harbor Generating Station combined cycle plant was modernized in 1995 to increase efficiency and reliability while reducing emissions and maintenance costs. It has eight units consisting of three combined cycle units and five peaking combustion turbines. Its dependable capacity is 558 MW. The Scattergood Generating Station has a dependable capacity of 798 MW; consisting of six units including combined cycles and combustion turbines. In addition to its coastal gas-fired plants, LADWP has the Valley Generating Station located in Sun Valley; which consists of four units with a combined dependable capacity of 558 MW.
To comply with the state’s once-through-cooling (OTC) policy, LADWP is required to eliminate the use of ocean water for cooling at the three coastal plants. Originally, LADWP planned to rebuild and modernize these three natural gas facilities to improve fuel efficiency, reduce greenhouse gas (GHG) emissions, and increase flexibility to integrate renewable resources, while maintaining in-basin reliability. The first two modernization projects, Haynes CT1 through 6 and
12 Dependable capacity is the amount of generating capacity that can be reliably counted on during the peak demand.

10
Scattergood CC3 and CT3, have been completed. LADWP is studying clean alternatives to repower the remaining units.
Out-of-State Generation Historically, LADWP received baseload coal generation from four out-of-state coal facilities, including the Navajo Generating Station, of which three have been divested. LADWP has one remaining contractual arrangement for up to 1,192 MW of power from the Intermountain Power Project (IPP), located near Delta, Utah that expires in 2027. LADWP has greatly reduced its dependence on coal power. In 2015, IPP and the Navajo Generating Station accounted for about 36 percent of the power delivered to its customers. By 2025 that drops to 5.8 percent, with all coal removed from its portfolio of resources in 2027.
LADWP and other owners of IPP intend to convert the facility from a coal-fired power plant to a combined cycle natural gas power plant by 2025. This will allow LADWP to accelerate its divestiture of all coal by two years (in 2025 rather than 2027). LADWP notes that the size of the repowered project is being negotiated at 840 MW rather than full replacement of the 1,800 MW coal facility.13 LADWP intends to use the plant to provide flexible capacity to help integrate renewable generation by providing firmed and shaped power.
LADWP also owns and operates the Apex Power Project, a natural gas facility located north of Las Vegas, Nevada. It was purchased on LADWP’s behalf by the Southern California Public Power Authority (SCPPA) to help compensate for the early divestiture of the Navajo Generating Station. The project includes a combined cycle generation station consisting of one steam turbine generator and two simple cycle combustion turbines, for a total of about 500 MW of dependable capacity.
LADWP also has contractual entitlements totaling approximately 380 MW of dependable capacity from the Palo Verde Nuclear Generating Station located near Phoenix, Arizona that expire in the mid-2040s.
Spot Purchases and Sales LADWP participates in energy markets even though LADWP has a policy of self-sufficiency, generating all of its energy needs from resources it owns or controls. When it is in LADWP’s economic interest or when needed to maintain reliability, it purchases energy under short-term or spot arrangements from different providers in the WECC. Since the availability and cost of energy from spot markets fluctuates and it cannot guarantee the future availability of energy 13 California’s Emissions Performance Standard limits long-term utility investments in baseload generation by requiring plants to meet an emissions performance standard of 1,100 pounds CO2 per megawatt hour to minimize GHG emissions. The repowering of IPP to a natural gas facility was certified by the Energy Commission as compliant with this standard in November 2018.

11
below the cost of its own resources, LADWP has not included spot market purchases in its long-term planning.
LADWP at times has a surplus of generating capacity and energy, which it offers into wholesale electricity markets at prices above their production costs or for reliability purposes. The utility’s customers benefit from the revenue generated by these sales. LADWP notes there is uncertainty about California utilities’ ability to price sales competitively in out-of-state markets, largely due to the costs of carbon that other states do not have to consider.
Resource Portfolio Evaluation In developing its 2017 SLTRP, LADWP examined 11 scenarios with different combinations of strategies to identify a portfolio of resources to meet the City’s future needs at the lowest cost and risk, consistent with environmental priorities and reliability standards. LADWP’s IRP includes updated assumptions that have influenced the potential resource portfolios. The strategies considered include early replacement of coal generation and higher levels of renewable resources, energy efficiency, local solar, energy storage, and transportation electrification. LADWP used average incremental generation costs (dollars per megawatt hour) and total CO2 emissions (in million metric tons) as metrics to compare each scenario. Selection of a preferred scenario was driven mainly by assumptions about the load forecast, prices of fuel, and amount of CO2 emissions.
One of the metrics used in evaluating the cases in the 2017 SLTRP was the cost of GHG emissions reductions measured as the incremental cost of removing one metric ton of GHG. LADWP estimates that the scenario for early replacement of IPP coal generation has an incremental cost of $12 per metric ton of GHG, which is lower than the anticipated cost of purchasing emission allowances under the cap-and-trade program. The incremental cost of removing one metric ton of GHG by increasing the RPS from 50 percent to 65 percent ranges from $110 to $130 per metric ton. A solar-focused RPS portfolio results in a net GHG increase compared to a diverse RPS portfolio due to the ramping up of local conventional resources to meet late afternoon peak demand. In addition, higher levels of solar resources increase the operational costs and challenges due to over-generation and ramping requirements.
The incremental cost of removing one metric ton of GHG through increased energy efficiency ranges from $170 to $190 per metric ton. Local solar and energy storage is less cost effective in removing GHG, with incremental costs ranging from $1,200 to $1,500 per metric ton for local solar and $200 to $400 per metric ton for energy storage. In contrast, the cost of GHG reduction through a high transportation electrification scenario ranges from $40 to $50 per metric

12
ton.14 LADWP plans to use transportation electrification to absorb over-generation from renewables by incentivizing peak hour charging when solar energy is abundant.
To understand how increasing generation of renewable resources impacts its power system, LADWP conducted additional analysis to evaluate the operational challenges associated with changes in the net load.15 This analysis is discussed in the section on Net Energy Demand in Peak Hours.
Procurement Strategy Based on its portfolio and other related analyses, LADWP concluded that a combination of different strategies provides the optimal solution for meeting long-term environmental objectives, while providing reliable electric service in a cost effective manner. LADWP’s recommended portfolio of resources to achieve GHG reductions includes the following components:
• Replacing coal resources two years ahead of schedule by 2025 • Accelerating RPS to 50 percent by 2025, 55 percent by 2030 • Doubling energy efficiency savings from 2017 through 2027 • Increasing local solar to 900 MW by 2025 • Implementing 404 MW of energy storage by 2025 • Accelerating transportation electrification (assuming 290,000 EVs in 2030
in LADWP’s Base Case forecast) to reduce GHG emissions from the transportation sector
LADWP’s recommended scenario is intended to balance the City’s objectives of exercising environmental stewardship, while maintaining high reliability and competitive rates. The utility notes that the preferred scenario is based on a number of assumptions such as projected fuel and purchase power costs, renewable generation costs and GHG emission costs, which are uncertain. LADWP plans to monitor for any major changes that might affect costs going forward and reflect changes in future IRP and other planning processes. A summary of LADWP’s projected capacity and generation portfolio can be seen in Table 1 and Table 2.
14 This includes program cost and increased cost of additional energy needed for electrification (additional RPS, fuel, and emissions cost). 15 Net load reflects the load that must be served by conventional dispatchable generation at times when renewable resources are not available.

13
Table 1: Energy Resources by Type 2019, 2025, and 2030 (MWh) Technology 2019 2025 2030 Total Net Energy for Load 27,005,030 28,021,270 29,726,920
Non-RPS
Coal 4,557,750 1,635,050 0
Large Hydroelectric 564,240 564,240 564,350
Natural Gas 8,898,850 8,508,650 9,710,680
Nuclear 3,177,000 3,177,000 3,176,380 Storage (pump storage) +
Battery 732,480 1,904,460 2,160,140
Spot Purchases 0 0 0
System Power 409,000 409,000 409,000
Non-RPS Solar 654,550 988,640 1,222,730
RPS Resources
Biofuels 104,240 0 0
Geothermal 1,007,000 549,000 249,000
Small hydroelectric 609,140 630,240 629,220
Solar PV 3,260,180 3,751,040 4,346,820
Wind 2,446,000 2,079,000 1,886,000
Generic RPS-Eligible 724,000 4,915,000 6,356,000
Total Energy Procured 27,144,430 29,111,320 30,710,320
Undelivered RPS Energy 44,210 369,060 262,720
Surplus/Shortfall 95,190 720,990 720,680 Source: California Energy Commission, based on LADWP 2017 IRP filing.

14
Table 2: Capacity Resources by Type for 2019, 2025, and 2030 (MW) Technology 2019 2025 2030 Peak Demand 6,341 7,185 7,800
Planning Reserve Margin 1,717 1,644 1,665
Peak Procurement Requirement 7,660 7,281 7,370
Non-RPS Resources
Coal 1,192 0 0
Large Hydroelectric 432 432 432
Natural Gas 4,052 4,728 4,813
Nuclear 388 388 388
Pump Storage 1,175 1,335 1,335
Solar (non-RPS) 367 575 725
Storage (Battery) 128 221 221
Planned System Capacity Contract(s) 18 14 18
RPS Resources
Biofuels 12 0 0
Geothermal 114 62 28
Small hydroelectric 219 226 226
Solar PV 545 897 1,034
Wind 375 265 301
Generic RPS 87 921 1,117
Total Capacity Procured 9,104 10,064 10,638
Surplus/(Shortfall) 1,444 2,783 3,270 Source: California Energy Commission, based on LADWP 2017 IRP filing.
15
CHAPTER 2: Review for Consistency with PUC Section 9621 Requirements
This chapter summarizes the main elements of LADWP’s IRP and provides staff’s findings regarding the consistency of the IRP filing with PUC Section 9621 requirements, as well as the POU IRP Guidelines. These findings include whether the utility meets GHG emission reduction targets and RPS energy procurement requirements, as well as planning goals for retail rates, reliability, transmission and distribution systems, net load, and disadvantaged communities. In addition, the IRP must address procurement of energy efficiency and demand response, energy storage, transportation electrification and portfolio diversification.
Greenhouse Gas Emission Reduction Targets POUs are required to meet the GHG targets established by the California Air Resources Board, in coordination with the CEC and California Public Utilities Commission.16 These GHG targets reflect the electricity sector’s percentage in achieving the economy-wide GHG emission reductions of 40 percent from 1990 levels by 2030. Staff reviewed the GHG emissions associated with LADWP’s portfolio of resources in 2030, as identified in its IRP and standardized reporting tables. Staff independently assessed the emission factors associated with various resources in LADWP’s portfolio to ensure consistency with other data available to staff.
Staff finds that LADWP’S plan achieves the GHG emission reduction target range established by the California Air Resources Board of 2.655 to 4.691 million metric tons of carbon dioxide equivalent (MMT CO2e). As shown in Table 3, LADWP’s resource portfolio is in the middle of the range, at roughly 3.682 MMT CO2e, which is consistent with the requirement of PUC Section 9621(b)(1).
LADWP plans to use coal replacement, RPS, energy efficiency, local solar, and energy storage to reduce GHG emissions from the electricity sector to nearly 78 percent below 1990 levels over the next 20 years. Transportation electrification provides a significant opportunity to dramatically shift and reduce overall GHG emissions and can further reduce LADWP’s GHG emissions to over 82 percent below 1990 levels. While the additional generation needed to charge a growing number of electric vehicles will increase LADWP’s GHG emissions, LADWP found that the reduction in GHG emissions from the transportation sector through
16 Public Utilities Code Section 9621(b)(1).

16
electrification is approximately four times that amount. The utility also found the amount of GHG emissions reduced by transportation electrification is more than double the amount of GHG emissions reduced through utility specific clean energy resources. LADWP used the CEC Transportation Electrification calculator tool to estimate GHG emission reductions of 5.3 MMT between 2017 and 2030 from increased transportation electrification.
LADWP developed its own specific emission intensity for each power plant and resource in its portfolio. Staff evaluated these emission intensities and found them to be reasonable when compared with data from the Quarterly Fuel and Energy Report.17Generation from each resource in LADWP’s portfolio was multiplied by the specific emission intensity to estimate their total portfolio emissions. Significant savings in emissions were achieved early in the planning horizon by divesting from coal plants. Later in the planning horizon between the years 2025 and 2027, 4.0 MMT of GHG emissions are eliminated by divestment of the remaining coal fired generation from IPP.
Table 3 shows GHG emissions for LADWP’s portfolio of resources in 2019, 2025, and 2030.
Table 3: Greenhouse Gas Emissions from LADWP Resource Portfolio
Resource Name Fuel Type GHG
Intensity (MT CO2e/MWh)
Total Emissions (mt CO2e) 2019
Total Emissions (mt CO2e) 2025
Total Emissions (mt CO2e) 2030
Harbor natural gas 0.48 62,814 18,589 140,059 Haynes (New Units) natural gas 0.42 82,523 129,612 2,117,945 Haynes (Existing Units) natural gas 0.41 1,424,567 1,162,377 0 Scattergood (New Units) natural gas 0.40 887,141 1,226,716 896,679 Scattergood (Existing Units) natural gas 0.73 0 0 0
Valley natural gas 0.42 277,677 174,301 36,482 APEX_X natural gas 0.37 10,925 703 0 APEX1P1 natural gas 0.37 422,022 39,248 0 APEX2P1 natural gas 0.37 349,828 32,549 0 Cogen natural gas 0.43 72,734 72,734 72,734 IPP1 coal 0.92 2,404,093 845,700 0 IPP2 coal 0.92 1,772,629 652,660 0 Utah CC natural gas 0.37 0 575,377 562,260 DC Loss Payback system 0.428 175,052 175,052 175,052
17 The Quarterly Fuel and Energy Report (QFER) is the collection of energy data relating to electric generation, control area exchanges, and natural gas processing and deliveries in California.

17
Resource Name Fuel Type GHG
Intensity (MT CO2e/MWh)
Total Emissions (mt CO2e) 2019
Total Emissions (mt CO2e) 2025
Total Emissions (mt CO2e) 2030
Total Portfolio Emissions NA NA 7,942,005 5,105,618 4,001,212 Adjusted Portfolio Emissions NA NA 7,717,686 4,742,263 3,682,938
Source: California Energy Commission, based on LADWP 2017 IRP filing.
Appendix B includes a table identifying the emission intensities and total emissions for individual resources for all years.
Renewables Portfolio Standard Planning Requirements PUC Section 9621(b)(2) requires that POU IRPs ensure procurement of at least 50 percent renewable energy resources by 2030, consistent with Public Utilities Code Article 16 (commencing with Section 399.11) of Chapter 2.3.18 Staff reviewed the renewable procurement table, the discussion in the IRP filing, and the renewable procurement plan submitted. Staff finds that LADWP’s plans are consistent with the RPS procurement requirements in 2030 and all interim compliance periods and are consistent with the requirements of PUC Section 9621(b)(2).
LADWP’s mix of renewable resources in 2018 included 40 percent solar, 34 percent wind, 11 percent eligible small hydro, 13 percent geothermal, and 0.7 percent biogas or biowaste. LADWP currently either owns or has power purchase agreements for nine wind facilities totaling about 232 MW of dependable capacity. In addition, LAWDP owns or has power purchase agreements for 19 solar units for a total of about 804 MW of dependable capacity. In 2018, renewable generation accounted for 36 percent of retail sales.
LADWP’s 2017 SLTRP sets targets that exceed the RPS targets of SB 350, including renewable generation of 55 percent of retail sales by 2030 and 65 percent by 2036. To meet these targets, LADWP plans to use existing as well as newly installed capacity from geothermal and biomass, wind, solar (local and utility), and generic RPS additions.
Figure 3 shows how LADWP’s renewable portfolio will evolve and grow over the forecast period.
18 PUC Section 9621(b) requires the governing board of POUs to adopt an IRP on or before January 1, 2019, while PUC Section 9621(b)(3) requires the IRP ensure procurement of at least 50 percent eligible renewable energy resources by 2030. SB 100 (De León, Chapter 312, Statutes of 2018) increases the RPS requirement for 2030 from 50 to 60 percent. However, since the POUs were required to adopt their IRPs before SB 100 went into effect, the POU was only required to plan for the 50 percent RPS target in their IRP. Future POU IRPs will need to meet the RPS requirements in effect when those updates are filed.

18
Existing geothermal production decreases substantially in 2022 due to the expiration of the contract with Hudson Ranch facility. Biofuels cease to be a part of LADWP’s portfolio in 2024 when the power purchase agreement for this expires. By 2030, nearly half of LADWP’s renewable portfolio will be made up of new planned renewable resources (mostly in the form of solar and generic renewables).
This aggressive plan will yield excess procurement renewable energy credits or RECs at the end of each RPS compliance period. According to the RPS Procurement Table, there will be 5,169,062 RECs at the end of the third compliance period. This number will increase to 15,078,329 by the end of the fourth compliance period. LADWP will have the option to use the excess RECs in future compliance periods. LADWP does not plan for future spot market purchases but will instead rely on renewable resource contracts and planned capacity.
Figure 3: Sources of Renewables Portfolio Standard Eligible Energy 2019 — 2030 (MWh)
Source: California Energy Commission, based on LADWP 2017 IRP filing.
Planned intermittent renewables in the form of wind, solar, and geothermal will ramp up significantly starting in 2020. Existing wind and geothermal resources will decrease slightly over the forecast period. Figure 4 shows how the renewable portfolio of 2019 compares with the projected renewable portfolio of 2030.
-
2,000,000
4,000,000
6,000,000
8,000,000
10,000,000
12,000,000
14,000,000
16,000,000
MW
h
Biofuels Geothermal Wind Hydro Solar Planned Intermittent

19
Figure 4: LADWP Renewable Portfolio in 2019
Source: California Energy Commission, based on LADWP 2017 IRP filing.
Retail Rates PUC Section 9621(b)(3) requires POUs to develop IRPs that enhance each POU’s ability to fulfill its obligation to serve its customers at just and reasonable rates and minimize impacts to ratepayer bills. Staff reviewed the analysis and information LADWP presented on the rate and bill impacts from different resource portfolios it evaluated and finds the IRP is consistent with PUC Section 9621(b)(3).
For its recommended resource plan, LADWP examined the rate contributions from several component strategies, including energy efficiency, renewable energy, energy storage, coal replacement, OTC repowering, electrification, and
Small hydro8%
Solar40%
Wind30%
Geothermal12%
RPS, Generic Intermittent
9% Biofuels1%
2019
Small hydro5%
Solar32%
Wind14%
Geothermal2%
RPS, Generic Intermittent
47%
2030

20
power system reliability, between 2017 and 2037. The combined effect of meeting a 65 percent RPS, along with increased local solar, energy storage, and energy efficiency, would increase average retail rates from about 15 cents/kWh in 2017 to 28 cents/kWh in 2037. In contrast, coal replacement and OTC repowering result in avoided cost savings from decreased operations and maintenance and lower GHG emissions that decrease average retail rates. High transportation electrification also results in an overall decrease in rates due to increased energy sales. Together, all of the strategies described above result in significant savings to customers over the long-term, decreasing forecasted rates from 28 cents/kWh to 26 cents/kWh by 2037.
System and Local Reliability Senate Bill 350 (De León, Chapter 547, Statutes of 2015) (SB 350) requires filing POUs to adopt an IRP that ensures system and local reliability and addresses resource adequacy requirements.19 Staff reviewed LADWP’s capacity reporting table and discussion and finds that LADWP has planned for sufficient resources to maintain a reliable electric system. In addition, LADWP’s selected portfolio of resources contains sufficient capacity to meet anticipated resource adequacy requirements in 2030. Staff finds that the IRP is consistent with the reliability requirements in PUC Section 9621(b)(3) and resource adequacy requirements in PUC Section 9621(d)(1)(E).
LADWP is its own balancing authority and as such is responsible for operating its electricity system in real time. This is done by finely balancing power system demand and supply while ensuring reliability.20 This includes controlling generation and transmission of electricity within its control area, as well as between balancing authorities. The Western Electricity Coordinating Council (WECC) establishes operating standards that all balancing authorities must meet to ensure reliability. State law also requires POUs to meet WECC’s most recently approved planning reserve and reliability criteria and “prudently plan for and procure resources that are adequate to meet its planning reserve margin and peak demand and operating reserves, sufficient to provide reliable service to its customers.”21
19 Public Utilities Code Section 9621(b)(3). 20 The North American Electric Reliability Corporation (NERC) requires balancing authorities to reliably plan for and operate bulk power systems. NERC delegates the authority to establish and enforce its reliability standards to regional entities, which includes the Western Electric Coordinating Council for the Western region of the U.S. and parts of Canada and Mexico. 21 Public Utilities Code Section 9620.
21
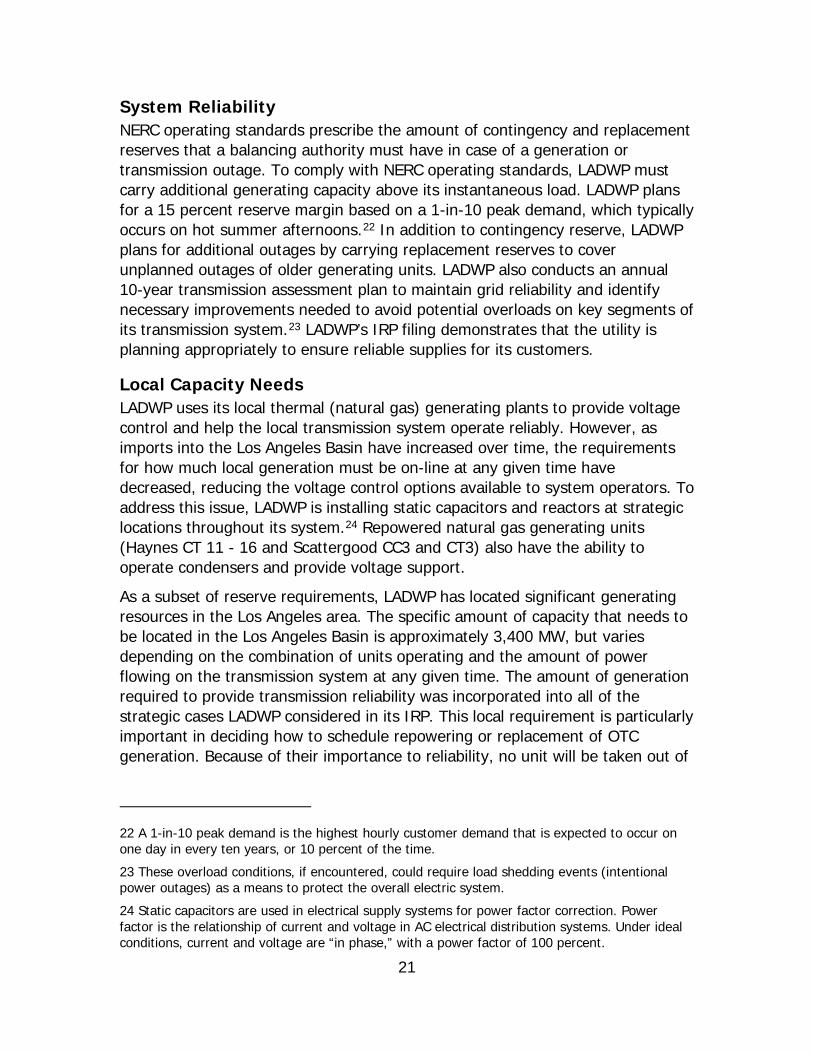
System Reliability NERC operating standards prescribe the amount of contingency and replacement reserves that a balancing authority must have in case of a generation or transmission outage. To comply with NERC operating standards, LADWP must carry additional generating capacity above its instantaneous load. LADWP plans for a 15 percent reserve margin based on a 1-in-10 peak demand, which typically occurs on hot summer afternoons.22 In addition to contingency reserve, LADWP plans for additional outages by carrying replacement reserves to cover unplanned outages of older generating units. LADWP also conducts an annual 10-year transmission assessment plan to maintain grid reliability and identify necessary improvements needed to avoid potential overloads on key segments of its transmission system.23 LADWP’s IRP filing demonstrates that the utility is planning appropriately to ensure reliable supplies for its customers.
Local Capacity Needs LADWP uses its local thermal (natural gas) generating plants to provide voltage control and help the local transmission system operate reliably. However, as imports into the Los Angeles Basin have increased over time, the requirements for how much local generation must be on-line at any given time have decreased, reducing the voltage control options available to system operators. To address this issue, LADWP is installing static capacitors and reactors at strategic locations throughout its system.24 Repowered natural gas generating units (Haynes CT 11 - 16 and Scattergood CC3 and CT3) also have the ability to operate condensers and provide voltage support.
As a subset of reserve requirements, LADWP has located significant generating resources in the Los Angeles area. The specific amount of capacity that needs to be located in the Los Angeles Basin is approximately 3,400 MW, but varies depending on the combination of units operating and the amount of power flowing on the transmission system at any given time. The amount of generation required to provide transmission reliability was incorporated into all of the strategic cases LADWP considered in its IRP. This local requirement is particularly important in deciding how to schedule repowering or replacement of OTC generation. Because of their importance to reliability, no unit will be taken out of
22 A 1-in-10 peak demand is the highest hourly customer demand that is expected to occur on one day in every ten years, or 10 percent of the time. 23 These overload conditions, if encountered, could require load shedding events (intentional power outages) as a means to protect the overall electric system. 24 Static capacitors are used in electrical supply systems for power factor correction. Power factor is the relationship of current and voltage in AC electrical distribution systems. Under ideal conditions, current and voltage are “in phase,” with a power factor of 100 percent.

22
service before appropriate replacement options are constructed, tested and ready to be placed in-service.
Recognizing the need to reduce fossil generation, LADWP is reassessing all planned repowering projects until a system-wide, in-depth and independent study is completed. The study is evaluating various hybrid clean energy options, in addition to modernizing its existing natural gas plants, to comply with environmental regulations, improve efficiency, better integrate renewables and provide for transmission capability. The study will consider energy resources and transmission planning, necessary investments in modifying local transmission and other infrastructure, generation reliability requirements, alternative technologies, including energy storage and other viable solutions, costs, and potential rate impacts.25
Flexible Capacity Needs LADWP will need additional flexible resources to accommodate increasing levels of intermittent renewables while ensuring system reliability. LADWP notes that as their renewable portfolio continues to increase with large amounts of solar and wind, the resource adequacy paradigm shifts from meeting a historical 1-in-10 peak customer load to meeting a net peak load, which measures load minus variable resources. Large amounts of solar generation shift LADWP’s peak hour from an afternoon peak to an evening peak. As a result, LADWP projects a resource shortfall starting in 2024, which means they have a critical need for dispatchable or flexible resources to contribute to meeting the evening peak. Meeting this need is further discussed in the section on Net Energy Demand in Peak Hours.
LADWP conducted a Maximum Generation Renewable Energy Penetration Study to assess the reliability implications of high levels of renewables and capture what LADWP characterizes as the true all-in costs, including integration costs.26 The analysis concluded that a 50 percent RPS results in significant challenges in managing daily load variability, with increased need for regulation and load following as solar production increases. LADWP will need sufficient flexibility to significantly ramp down its generation as the sun rises and dramatically ramp up its generation as the sun sets. This analysis estimated that up to 150 MW per
25 Depending on the outcome of this study, LADWP will develop a new comprehensive plan for replacing existing in-basin OTC units that may be significantly different from the original plan to the State Water Resources Control Board to comply with the OTC Policy. 26 Maximum Generation Renewable Energy Penetration Study.
23
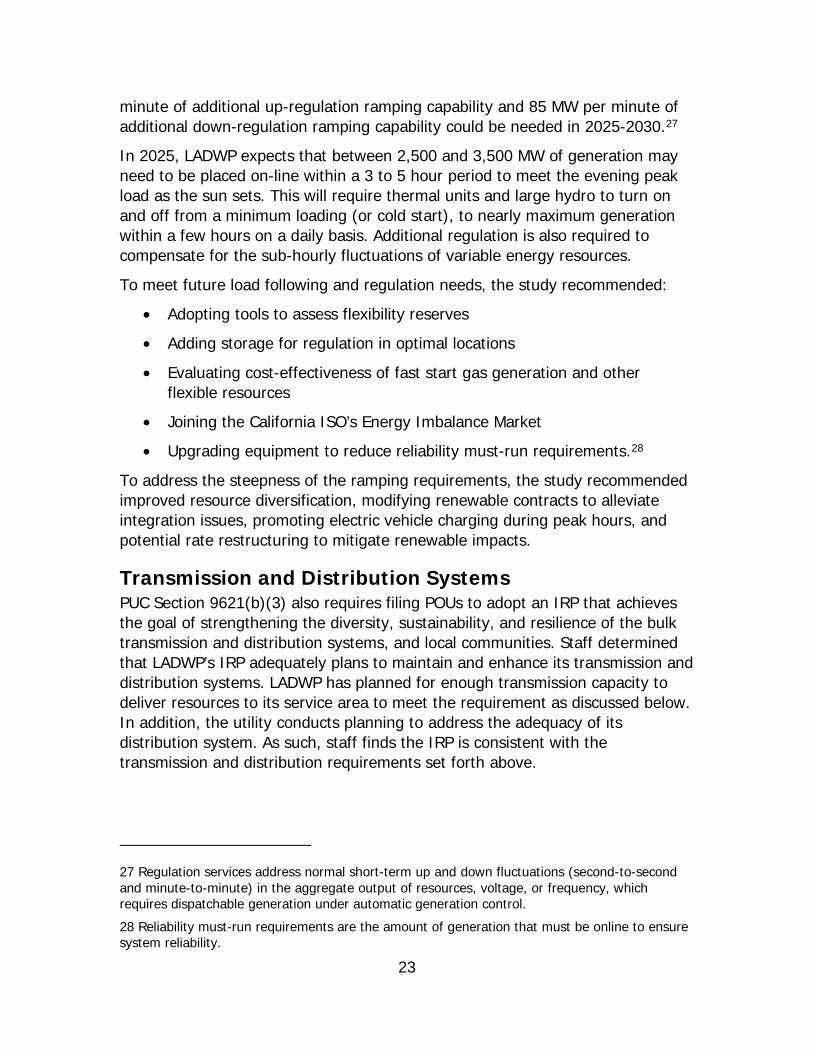
minute of additional up-regulation ramping capability and 85 MW per minute of additional down-regulation ramping capability could be needed in 2025-2030.27
In 2025, LADWP expects that between 2,500 and 3,500 MW of generation may need to be placed on-line within a 3 to 5 hour period to meet the evening peak load as the sun sets. This will require thermal units and large hydro to turn on and off from a minimum loading (or cold start), to nearly maximum generation within a few hours on a daily basis. Additional regulation is also required to compensate for the sub-hourly fluctuations of variable energy resources.
To meet future load following and regulation needs, the study recommended:
• Adopting tools to assess flexibility reserves
• Adding storage for regulation in optimal locations
• Evaluating cost-effectiveness of fast start gas generation and other flexible resources
• Joining the California ISO’s Energy Imbalance Market
• Upgrading equipment to reduce reliability must-run requirements.28
To address the steepness of the ramping requirements, the study recommended improved resource diversification, modifying renewable contracts to alleviate integration issues, promoting electric vehicle charging during peak hours, and potential rate restructuring to mitigate renewable impacts.
Transmission and Distribution Systems PUC Section 9621(b)(3) also requires filing POUs to adopt an IRP that achieves the goal of strengthening the diversity, sustainability, and resilience of the bulk transmission and distribution systems, and local communities. Staff determined that LADWP’s IRP adequately plans to maintain and enhance its transmission and distribution systems. LADWP has planned for enough transmission capacity to deliver resources to its service area to meet the requirement as discussed below. In addition, the utility conducts planning to address the adequacy of its distribution system. As such, staff finds the IRP is consistent with the transmission and distribution requirements set forth above.
27 Regulation services address normal short-term up and down fluctuations (second-to-second and minute-to-minute) in the aggregate output of resources, voltage, or frequency, which requires dispatchable generation under automatic generation control. 28 Reliability must-run requirements are the amount of generation that must be online to ensure system reliability.

24
Transmission System LADWP owns and/or operates an extensive transmission system consisting of over 20,000 miles of transmission and distribution circuits with operating voltages ranging from 120 volts to 500 kilovolts (kV). As previously mentioned, LADWP buys and sells excess electricity using its transmission in California and the WECC. LADWP also offers surplus transmission capacity for sale to other parties when it is available.29 In addition, at critical times other neighboring utilities turn to LADWP to provide surplus energy and transmission resources to bolster their power systems and avoid blackouts. For example, with the unexpected retirement of San Onofre Nuclear Generating Station in 2012, the California ISO and the California energy agencies, including the CPUC and CEC, are coordinating efforts with LADWP to ensure reliability in the Southern California region.
LADWP notes that transmission considerations are necessary inputs in resource planning so that alternative options are evaluated in a realistic and effective manner. As resource planning has become more dynamic and complex with the growing number of external factors, so has transmission planning.
LADWP will need adequate transmission for importing new renewable energy from distant locations, dealing with intermittent energy, switching away from coal (that may free up transmission capacity), addressing the need for potential new generation resources, and other resource planning issues. To access renewable resources located far from the City, LADWP has built new transmission and made a number of infrastructure improvements to increase transfer capabilities. In addition, since LADWP controls a large amount of transmission in the state and WECC, it intends to leverage those assets to best meet the needs of the City and its customers.
LADWP has identified a number of major transmission upgrades including:
• The Pacific Direct Current Intertie Upgrade • The Haskell Canyon – Olive Transmission Line Project • The Victorville – Los Angeles Project • The Los Angeles Basin Projects.
Distribution System Much of LADWP’s power infrastructure, including its distribution system, was installed during the City’s rapid growth between the 1940s and 1960s, and has reached the end of its useful lifespan. LADWP’s Power System Reliability Program 29 LADWP uses the Open Access Same-Time Information System, an internet-based system for obtaining access to transmission services on high-voltage transmission for moving wholesale electricity, in accordance with Federal Energy Regulatory Commission Orders 888 and 889.

25
addresses the problem of LADWP’s aging generation, transmission, substation, and distribution systems. The program maintains a robust and reliable power system through the replacement of infrastructure, such as the distribution poles, crossarms, transformers, and cables, as well as incorporating new technologies such as distribution automation. LADWP is looking ahead to new technologies, including smart grid applications that can benefit operations and improve reliability, while accommodating increased customer-owned distributed generation and renewables.30 LADWP developed a Smart Grid Implementation Program to adopt these technologies in a prudent, cost-effective, and phased manner that maximizes operational benefits for both customers and the utility. This program will incorporate high-tech digital devices throughout the transmission, substation and distribution system and integrate advanced intelligence to provide the information necessary to both optimize electric service and empower customers to make informed energy decisions.
The deployment of advanced metering technology will provide LADWP greater visibility into its distribution system, which is increasingly important with higher penetration of solar and other distributed energy resources. The installation of distribution automation devices will improve the measurement and control of voltage and VARs, which will improve reliability, power quality, and system efficiency.31 These smart grid technologies will enable LADWP to more efficiently integrate renewable generation. In addition, automated systems that manage the influx of electric vehicles (EV) can help the utility monitor the effects of EV charging on the grid and allow customers to understand how EV charging impacts their electricity use.
Disadvantaged Communities and Localized Air Pollutants PUC Section 9621(b)(3) requires POUs to minimize localized air pollutants and GHG emissions with early priority on disadvantaged communities. Staff reviewed LADWP’s IRP filing to determine the extent to which they are minimizing local air pollutants with a priority placed on disadvantaged communities. Staff finds LADWP has made efforts to address these issues in selecting the resources to include in its portfolio consistent with the requirement. LADWP is located in the South Coast Air Basin, which despite significant improvements in air quality over
30 Smart Grid refers to intelligent data gathering and advanced two-way digital communication capabilities overlaid on electric distribution networks to provide real- time data that enhances the utility’s ability to optimize energy use. 31 VAR is a unit of reactive power and stands for Volt Amperes Reactive. Reactive power is a by-product of alternating current systems when voltage and current are not in phase. Reactive power is required to maintain the voltage to deliver active power (watts) through transmission or distribution lines. VoltVAR optimization is a process of optimally managing voltage level and reactive power to achieve more efficient grid operation.

26
the past 20 years still exceeds federal public health standards for ozone and particulate matter. Nitrous oxide (NOx) emissions are a precursor to the formation of ground level ozone. In 2017, average annual emissions of NOx in the South Coast Air Basin is 398 tons per day and is expected to decline to 214 tons per day by 2031. LADWP’s in-basin power plants, which have advanced pollution control equipment, emit about 0.68 tons of NOx per day, representing 0.17 percent of the 2017 average daily emissions for the South Coast Air Basin. As previously discussed, LADWP is currently assessing clean alternatives to the repowering of its in-basin power plants.
LADWP’s Equity Metrics Data Initiative assesses how well its programs, services, and resources are distributed throughout the City and provides a tool for decision makers to ensure its programs reach all customers with fairness and equity. LADWP uses the California Environmental Protection Agency’s California Communities Environmental Health Screening Tool (CalEnviroScreen) to incorporate metrics such as socioeconomic impacts, water pollution, and air pollution to identify any disparities in the data.
CalEnviroScreen is used to develop and modify LADWP’s solar programs to provide services in an equitable and geographically diverse manner. Using a solar penetration metric, LADWP identified areas with low solar penetration and using CalEnviroScreen, confirmed that those areas were also disadvantaged communities. Based on this information, LADWP now has solar programs that offer increased monetary benefits and provide priority enrollment for customers living in areas of low solar penetration.
In addition, many of LADWP’s transportation electrification programs and investments will directly benefit low income customers and provide health benefits through improved air quality for the entire community. Additional transportation electrification programs will be designed to address areas within the City with low EV penetration.
Net Energy Demand in Peak Hours PUC Section 9621(c) requires POUs to consider existing renewable generation, grid operation efficiency, energy storage, distributed energy resources, and energy reduction measures (such as energy efficiency and demand response), to reduce the need for new or additional gas-fired generation, distribution and transmission resources. LADWP’s IRP includes a discussion of how preferred resources contribute to meeting peak demand and how that affects resource selection for its portfolio. This is consistent with the requirement that filing POUs address how they can meet peak hour demand with renewable and other preferred resources.
LADWP included a discussion of the potential role of preferred resources in helping to meet net peak demand when selecting its resource portfolio. To
27
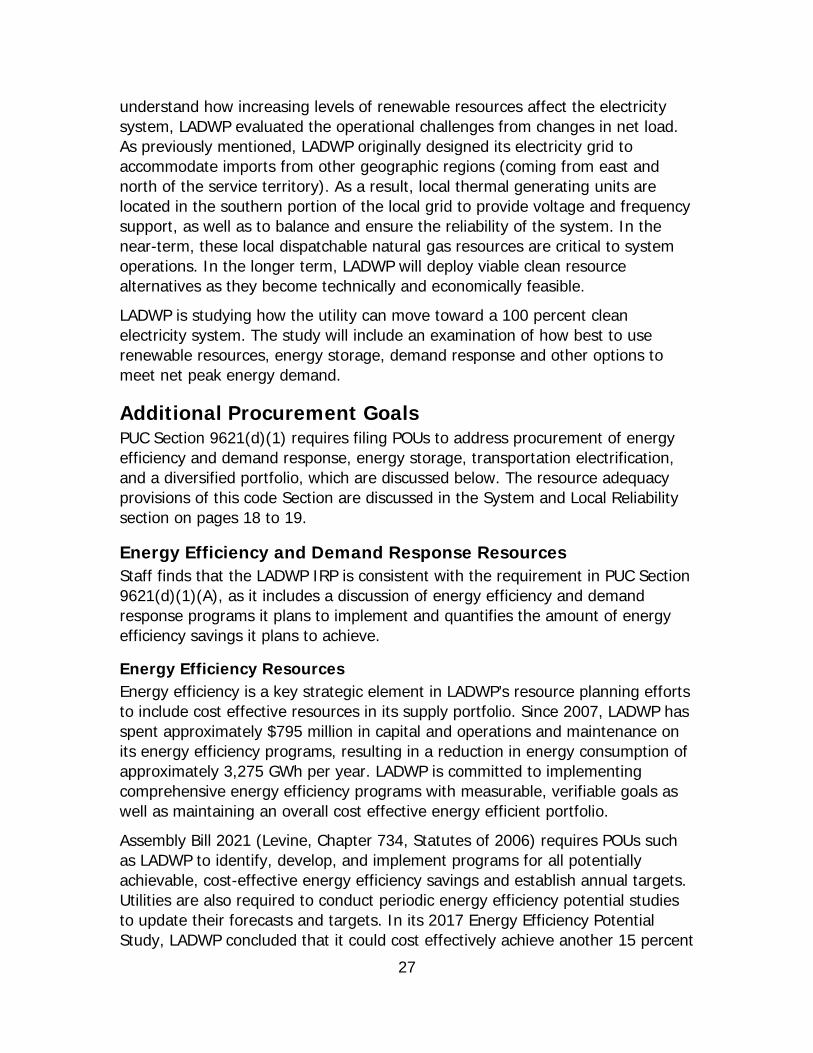
understand how increasing levels of renewable resources affect the electricity system, LADWP evaluated the operational challenges from changes in net load. As previously mentioned, LADWP originally designed its electricity grid to accommodate imports from other geographic regions (coming from east and north of the service territory). As a result, local thermal generating units are located in the southern portion of the local grid to provide voltage and frequency support, as well as to balance and ensure the reliability of the system. In the near-term, these local dispatchable natural gas resources are critical to system operations. In the longer term, LADWP will deploy viable clean resource alternatives as they become technically and economically feasible.
LADWP is studying how the utility can move toward a 100 percent clean electricity system. The study will include an examination of how best to use renewable resources, energy storage, demand response and other options to meet net peak energy demand.
Additional Procurement Goals PUC Section 9621(d)(1) requires filing POUs to address procurement of energy efficiency and demand response, energy storage, transportation electrification, and a diversified portfolio, which are discussed below. The resource adequacy provisions of this code Section are discussed in the System and Local Reliability section on pages 18 to 19.
Energy Efficiency and Demand Response Resources Staff finds that the LADWP IRP is consistent with the requirement in PUC Section 9621(d)(1)(A), as it includes a discussion of energy efficiency and demand response programs it plans to implement and quantifies the amount of energy efficiency savings it plans to achieve.
Energy Efficiency Resources Energy efficiency is a key strategic element in LADWP’s resource planning efforts to include cost effective resources in its supply portfolio. Since 2007, LADWP has spent approximately $795 million in capital and operations and maintenance on its energy efficiency programs, resulting in a reduction in energy consumption of approximately 3,275 GWh per year. LADWP is committed to implementing comprehensive energy efficiency programs with measurable, verifiable goals as well as maintaining an overall cost effective energy efficient portfolio.
Assembly Bill 2021 (Levine, Chapter 734, Statutes of 2006) requires POUs such as LADWP to identify, develop, and implement programs for all potentially achievable, cost-effective energy efficiency savings and establish annual targets. Utilities are also required to conduct periodic energy efficiency potential studies to update their forecasts and targets. In its 2017 Energy Efficiency Potential Study, LADWP concluded that it could cost effectively achieve another 15 percent

28
energy efficiency from 2017 through 2027, in addition to the previously committed 15 percent from 2010 through 2020.32 By 2027, LADWP does meet the SB 350 Energy Efficiency Doubling Goals established by the CEC.LADWP’s next EE Potential Study (in 2020) will establish targets through 2030. Table 4 shows LADWP’s estimated additional achievable energy efficiency from 2018 to 2030.
The energy efficiency programs required to meet the proposed savings targets of 15 percent will require substantial investments to continue at the same pace. This level of spending and energy savings is comparable to LADWP’s most recent historic levels, setting it on a path to achieve the savings targets. Notably, this level of funding keeps LADWP on par with the state’s investor owned utilities in terms of energy efficiency investment on a per-ratepayer basis, maintaining the utility’s position as having the third largest portfolio of energy efficiency programs in California. Projected budgets per fiscal year between 2021 and 2027 range roughly between $110 million and $140 million annually.33
Table 4: LADWP Additional Achievable Energy Efficiency Estimates (GWh) Year AAEE (GWh) SB 350 Targets
(GWh) 2018 690 1,082
2019 965 1,412
2020 1,209 1,713
2021 1,588 2,010
2022 1,962 2,304
2023 2,344 2,609
2024 2,734 2,926
2025 3,132 3,254
2026 3,531 3,586
2027 3,922 3,909
2028 3,973 4,230
2029 4,017 4,546
2030 4,067 Source: California Energy Commission, based on LADWP 2017 IRP filing
LADWP has numerous energy efficiency programs, including mass-market programs, commercial, industrial and institutional programs, and cross cutting
32 Energy Efficiency in California’s Public Power Sector 11th Edition. 2017. Southern California Public Power Agency and Northern California Power Agency. 33 Figure 4-3: Recommended Targets – Projected Budget per Fiscal Year (FY 2021-FY2027), LADWP, 2017 IRP, p. 17.

29
programs. A few of the mass marketing programs include commercial direct install, direct install for schools, refrigerator exchange and recycling, home energy improvements, and consumer rebates. Commercial, industrial, and institutional programs include custom performance (advanced, high efficiency technologies and strategies), commercial lighting incentives, savings by design (building design and construction practices), and low-income economic development. Cross cutting programs include codes and standards advocacy, city plants (free shade trees), upstream heating, ventilation, air conditioning, and embedded energy from water measures.
Demand Response Resources LADWP considers demand response to be an important energy management tool that facilitates reduction in energy use over a given time period in response to price signals, financial incentives or other triggering mechanisms. One key objective of LADWP’s demand response programs is to cost-effectively reduce peak demand to defer generation capacity investments while providing local transmission and distribution support and operating reserves to improve reliability. In addition, demand response can help integrate renewable energy by responding to fluctuations in intermittent wind and solar and in some cases may be initiated to increase demand to absorb abundant solar generation.
LADWP projects a maximum projected demand response portfolio of 506 MW in 2026, almost half (215 MW) of which would come from the Commercial, Industrial, and Institutional Curtailable Program which provides monthly capacity payments in return for guaranteed load reductions. Another large contributor of savings would be the Residential & Small Commercial Direct Load Control Program (145 MW).
Energy Storage Staff finds LADWP’s IRP is consistent with the requirement in PUC Section 9621(d)(1)(B) to address procurement of energy storage as it discusses the potential role of energy storage on its system. LADWP developed an energy storage target totaling 178 MW by 2020.
LADWP has been using pumped storage from Castaic for more than 40 years, but since the plant was established prior to January 1, 2010, it is disqualified from counting toward LADWP’s storage targets. LADWP is developing a strategic plan to identify storage technologies and applications that align with its needs and define various technologies that will support its unique grid and resource mix. In addition, it is examining storage projects that will help enable renewable integration, distributed generation, and demand side management, while ensuring reliability. To support its storage efforts LADWP is participating in several broader initiatives including:

30
• The U.S. Department of Energy working group to develop energy storage protocols for use in measuring and quantifying the performance of storage systems to make more informed design and operation decisions.
• Electric Power Research Institute projects: Strategic Intelligence and Technology Assessment of Energy Storage and Distributed Generation, Distributed Energy Storage for Power Delivery and End Use, and Bulk Power Storage Solutions.
• Collaboration with SCPPA researching and identifying viable energy storage for unique POU purposes.
Like demand response, advanced energy storage technologies, such as batteries and compressed air energy storage, can help absorb surplus renewable generation to be used in the late afternoon and early evening where they can provide greater benefit. However, these advanced energy storage technologies are still in development and are not yet available on a commercial scale suitable for large electric utilities. Until then, improved operations at Castaic will serve as LADWP’s primary energy storage solution to help alleviate over-generation issues. As energy storage continues to develop and improve both technologically and economically, LADWP will consider increasing energy storage on its system.
Transportation Electrification Staff finds that the LADWP IRP is consistent with the requirement of PUC Section 9621(d)(1)(C) as it addresses transportation electrification, primarily for light-duty electric vehicles. LADWP’s IRP recognizes the benefits of transportation electrification in reducing overall GHG and criteria pollutants in the Los Angeles Basin, increasing electric sales, and absorbing potential overgeneration from renewable resources. As a result, LADWP’s preferred portfolio incorporates high electrification, including an increase in the number of electric vehicles equivalents from 127,000 in 2020 to 580,000 in 2030.34 In addition to vehicle electrification, other transportation electrification opportunities are available, including power for cargo ships at the Port of Los Angeles, and electrified cargo transport and mass transit.
LADWP updated its electric transportation program to include the installation of 10,000 city and private commercial chargers for public, workplace, and city-owned vehicles, as well as supporting residential and commercial EV charging. Other transportation electrification efforts include:
• Electrifying the Los Angeles Metro bus fleet by installing charging infrastructure for depot (overnight) charging and en-route charging.
34 The energy use in 2030 for transportation electrification in the base case is 1,172 GWh, which increases to 2,344 GWh in the high electrification scenario. The 580,000 electric vehicle equivalents figure is based on the High Case IRP 2016 Cumulative # of EV equivalents.

31
• Purchasing 112 zero-emission electric buses for the Los Angeles Department of Transportation, while converting 100 percent of buses to electricity by 2030.
• Electrifying equipment to reduce emissions from ships, trucks, harbor craft, and cargo-handling equipment for the San Pedro Bay Ports, which could potentially increase load to 900 GWh by 2030.
• Purchasing 20 electric buses to replace 14 diesel-buses and add 6 buses to the Los Angeles World Airport fleet.
LADWP also participates in the electrification working group with SCPPA and the California Electric Transportation Coalition to address opportunities and challenges of a new, electrified transportation system, and identify trends, business models, and strategies for rolling out charging infrastructure.
Portfolio Diversification PUC Section 9621(d)(1)(D) requires that POUs address the procurement of a diversified portfolio of resources consisting of both short-term and long-term electricity, electricity related, and demand response products. Based on staff’s review of LADWP’s existing resources, its portfolio analysis, and the selection of resource additions in its IRP, staff concludes that the utility has fulfilled this requirement.
Figure 5 shows a comparison of the energy mix by resource in LADWP’s preferred portfolio in 2019 and 2030.
Figure 5: LADWP Portfolio Comparison for 2019 and 2030
Source: California Energy Commission, based on LADWP 2017 IRP filing.
In 2019, LADWP’s resource mix consisted of about 2 percent large hydro, 17 percent coal, 33 percent natural gas, 30 percent renewables, and the rest made
01,0002,0003,0004,0005,0006,0007,0008,0009,000
10,000
Natural Gas Coal Large Hydro RPS, SpecificContracts
RPS, Generic
GW
h
2019 2030

32
up by a combination of nuclear, storage, system power, and non-RPS solar. By 2030, LADWP has eliminated coal from its portfolio, kept natural gas generation at 32 percent, increased its reliance on renewables to 45 percent, and large hydro resources remained at 2 percent, with nuclear, storage, system power, and non-RPS solar rounding out its portfolio.

33
ACRONYMS
Acronym Term
AAEE additional achievable energy efficiency
AAPV additional achievable photovoltaic
CEC California Energy Commission
CO2 carbon dioxide
CO2e carbon dioxide equivalent
GHG greenhouse gas
GWh gigawatt-hour
IEPR Integrated Energy Policy Report
kWh Kilowatt-hour
LADWP Los Angeles Department of Water and Power
IRP integrated resource plan
mT metric ton
MT Thousands of metric tons
MMT Millions of metric tons
MW megawatt
MWh megawatt-hour
POU publicly owned utility
PUC Public Utilities Code
REC renewable energy credit
RPS Renewables Portfolio Standard
SB 350 Senate Bill 350 (De León, Chapter 547, Statutes of 2015)

A-1
APPENDIX A: DEFINITIONS
Additional achievable energy efficiency (AAEE): Energy efficiency savings not yet considered committed but deemed likely to occur, including impacts from future updates of building codes and appliance standards and utility efficiency programs expected to be implemented.
Additional achievable photovoltaic (AAPV): Distributed PV developed as a result of the requirement in the 2019 California Building Energy Efficiency Standards that new residential construction include solar PV as of January 1, 2020.
Assumption: A statement made about the future for a given load forecast, or demand-side or supply-side energy resource, that should be used for procurement and transmission modeling.
Bundled renewable energy credit: A renewable energy credit from an eligible renewable energy resource that is procured as part of the same contract or ownership agreement with the underlying energy from that resource
Committed energy efficiency: Energy efficiency savings estimated to occur from utility and public agency programs, codes, standards, legislation, and ordinances having final authorization, firm funding, and a design that can be readily translated into evaluable characteristics.
Demand forecast: A forecast of electricity demand served by the electric grid, measured by both peak demand and energy consumption. Some factors that determine load forecast include economics, demographics, behind-the-meter resources, and retail rates.
Excess balance: Any amount of RPS-eligible RECs that a utility holds at the end of a compliance period that may be used to meet their compliance obligation in the next compliance period. Excess balance can include excess procurement, historic carryover, or purchased RECs that have not been retired.
Filing POU: A local publicly owned electric utility with an annual electrical demand exceeding 700 gigawatt-hours, as determined on a three-year average commencing January 1, 2013.
Integrated resource plan (IRP): A plan adopted by the governing board of a POU pursuant to PUC Section 9621.
A-2
IRP filing: An IRP adopted by the filing POU’s governing board that is electronically submitted to the CEC, along with the standardized tables and supporting information, by the filing POU or authorized representative.
Net-peak demand: The highest hourly electricity demand in the utility area, when excluding demand met by variable renewable generation resources directly connected to a California Balancing authority. Net-peak demand is calculated by taking the highest hourly demand (peak demand) and subtracting the electricity produced by variable renewable resources meeting that demand.
Noncoincident peak demand: The largest amount of power a POU must generate or procure in any hour of the year. Compare this to coincident peak demand which is the amount of power the POU must generate or procure in the hour in which system wide demand is greatest. Noncoincident peak demand is referred to as peak demand throughout these guidelines.
Plug-in electric vehicle (EV): A vehicle that uses one or more electric motors for propulsion. Electric vehicles include but are not limited to, battery-electric and plug-in hybrid vehicles.
Renewable energy credit (REC): A certificate of proof, as defined in PUC Section 399.12 (h), associated with the generation of electricity from an eligible renewable energy resource. RECs are certificates that represent the environmental attributes or ‘greenness’ of renewable electricity production.
Renewables Portfolio Standard (RPS): A regulation that requires a minimum procurement of energy from renewable resources, such as wind, solar, biomass, and geothermal.
Retail sales: Electricity consumption after accounting for behind-the-meter onsite generation including storage charge and discharge. It indicates the net energy delivered through the meter to the end-use customer, and thus excludes any generation or procurement in satisfaction of firm wholesale commitments (e.g., firm and spot market sales).
Scenario: A set of assumptions about future conditions used in power system modeling performed to support generation or transmission planning.
Sensitivity: A technique that determines how scenario analysis changes when an assumption is varied with all other scenario assumptions unchanged.
Standardized tables: The four tables that are required with the IRP filing submitted to the CEC. These tables include information and data necessary to help staff determine if the IRP is consistent with PUC Section 9621. The four standardized tables are Capacity Resource Accounting Table, Energy Balance Table, Renewable Procurement Table, and Greenhouse Gas Emissions Accounting Table.
A-3
Supporting information: Analyses, studies, data, and work papers, or other material (on which inputs, assumptions, or conclusions are based) that the POU used or relied upon in creating the IRP (such as, but not limited to, market conditions current at the time of the analyses, energy infrastructure, state policies and laws, and needs of the filing POU) but are not included in the IRP itself; and additional information required by these guidelines. Supporting information may also include the inputs and assumptions that are based on the analyses, studies, data, work papers, and other material.
Unbundled renewable energy credit: A renewable energy credit from an eligible renewable energy resource that is not procured as part of the same contract or ownership agreement with the underlying energy from that eligible renewable energy resource; this includes RECs that were originally procured as a bundled product but were subsequently resold separately from the underlying energy.

B-1
APPENDIX B: STANDARDIZED REPORTING TABLES
Table B-1: Energy Resources, All Years (MWh) Resource
Name Technology 2019 2020 2021 2022 2023 2024 2025 2026 2027 2028 2029 2030 Total Net Energy for Load 27,005,030 27,148,720 27,439,950 27,645,330 27,705,410 28,026,500 28,021,270 28,045,160 28,152,930 28,620,300 28,869,950 29,726,920
Non-RPS Resources
Castaic Pump Storage 599,330 609,460 866,340 985,640 965,160 1,054,740 1,020,970 1,003,330 1,091,740 1,038,460 968,130 1,274,700
Harbor Natural Gas 119,660 151,210 62,120 44,930 45,930 38,470 35,380 17,650 3,650 4,050 9,830 354,090
Haynes (New Units) Natural Gas 147,450 300,040 153,410 91,200 95,740 101,990 232,440 1,777,100 1,443,660 1,880,360 5,524,840 5,342,960
Haynes (Existing Units) Natural Gas 3,482,230 3,439,330 3,225,530 3,070,910 3,168,970 2,873,310 2,837,810 2,306,090 2,812,090 2,448,310 0 0
Palo Verde 1 Nuclear 599,410 601,240 653,070 599,410 599,410 654,890 599,410 599,410 653,070 601,240 599,410 653,070
Palo Verde 2 Nuclear 661,660 609,220 607,300 661,660 607,300 609,150 661,660 607,300 607,300 663,510 607,300 607,300
Palo Verde 3 Nuclear 599,410 654,890 599,410 599,410 653,070 601,240 599,410 653,070 599,490 601,240 653,070 599,490
Scattergood (New Units) Natural Gas 2,227,680 2,083,620 1,854,500 1,901,730 1,806,600 1,855,900 3,088,710 2,959,980 2,568,930 3,085,180 2,539,810 2,256,710
Scattergood (Existing Units) Natural Gas 0 6,600 0 0 0 0 0 0 0 0 0 0
Valley Natural Gas 658,910 789,950 508,780 399,890 381,630 364,050 412,080 285,500 182,710 157,430 100,690 83,610
APEX_X Natural Gas 29,210 21,650 13,980 11,050 9,720 9,040 1,880 270 370 0 20 0
APEX1P1 Natural Gas 1,128,400 1,007,410 689,610 402,530 422,590 366,270 104,940 15,960 17,610 2,310 3,900 0
APEX2P1 Natural Gas 935,370 804,290 555,130 356,960 374,210 305,560 87,030 16,770 17,120 2,570 2,960 0
Battery_Storage _2Hour
Battery Storage 0 23,350 26,140 27,260 27,250 26,960 24,580 24,400 25,260 29,460 30,610 26,290

B-2
Resource Name Technology 2019 2020 2021 2022 2023 2024 2025 2026 2027 2028 2029 2030
Battery_Storage _4Hour
Battery Storage 116,530 115,630 126,930 121,530 153,080 185,480 222,270 222,630 212,700 216,590 220,020 220,030
Battery_Storage _Customer
Battery Storage 0 3,130 3,280 3,620 3,610 3,590 3,620 3,650 3,570 3,970 4,100 3,690
Battery_Storage _Hhour
Battery Storage 16,620 16,310 16,610 20,570 20,470 19,550 20,970 22,880 19,750 22,460 23,780 19,480
CAES Storage 0 0 0 605,840 599,740 612,170 612,050 607,120 612,260 593,350 597,860 615,950
Cogen Natural Gas 169,940 170,410 169,940 169,940 169,940 170,410 169,940 169,940 169,940 170,410 169,940 169,940
Hoover Large Hydroelectric 564,240 564,250 564,310 564,270 563,990 564,000 564,240 564,250 564,280 564,250 564,210 564,350
IPP1 Coal 2,623,410 2,430,630 2,566,090 2,349,100 2,453,360 2,227,790 922,850 0 0 0 0 0
IPP2 Coal 1,934,340 2,178,560 1,894,020 2,069,030 1,850,310 1,995,070 712,200 0 0 0 0 0
PV SCPPA 1 Nuclear 426,120 427,390 464,280 426,120 426,120 465,550 426,120 426,120 464,280 427,390 426,120 464,280
PV SCPPA 2 Nuclear 464,280 427,390 426,120 464,280 426,120 427,390 464,280 426,120 426,120 465,550 426,120 426,120
PV SCPPA 3 Nuclear 426,120 465,550 426,120 426,120 464,280 427,390 426,120 464,280 426,120 427,390 464,280 426,120
Solar_CNM_ nonRPS Solar PV 375,000 375,000 375,000 375,000 375,000 375,000 375,000 375,000 375,000 375,000 375,000 375,000
Solar_CNM_non RPS _P_760_MLS
Solar PV 279,550 326,140 372,730 421,590 468,180 517,050 613,640 660,230 706,820 753,410 801,140 847,730
Utah CC Natural Gas 0 0 0 0 0 0 1,538,440 2,229,620 2,530,430 2,282,590 1,409,060 1,503,370
RPS Resources
Aqueduct Small Hydroelectric 225,210 225,210 225,210 225,210 225,210 225,210 225,210 225,210 225,210 225,210 225,210 225,210
Aqueduct_PP_ Improvement_65
Small Hydroelectric 0 0 0 0 18,870 30,000 30,000 30,000 30,000 30,000 30,000 30,000
Castaic_ Improvements
Small Hydroelectric 95,090 95,210 96,580 97,390 97,580 97,580 95,880 96,360 97,700 97,100 97,970 94,870
NHollywood Small Hydroelectric 4,350 4,370 4,380 4,370 4,370 4,350 4,360 4,370 4,380 4,370 4,360 4,350
Owens Gorge Small Hydroelectric 213,660 213,660 213,660 213,660 213,660 213,660 213,660 213,660 213,660 213,660 213,660 213,660

B-3
Resource Name Technology 2019 2020 2021 2022 2023 2024 2025 2026 2027 2028 2029 2030
Owens Valley Small Hydroelectric 39,130 39,130 39,130 39,130 39,130 39,130 39,130 39,130 39,130 39,130 39,130 39,130
Sepulveda Small Hydroelectric 31,700 31,710 31,750 31,790 31,780 0 0 0 0 0 0 0
Solar_DWP_ Adelanto Solar PV 19,000 19,000 19,000 19,000 19,000 19,000 19,000 19,000 19,000 19,000 18,000 18,000
Solar_DWP_ PineTree Solar PV 17,000 17,000 17,000 17,000 17,000 17,000 17,000 17,000 17,000 17,000 17,000 17,000
Solar_Owens Solar PV 0 0 0 0 0 132,000 262,000 393,000 522,000 519,000 517,000 514,000
Wind_PineTree Wind 381,000 382,000 381,000 382,000 382,000 382,000 382,000 382,000 382,000 382,000 382,000 382,000
WSHydro_65 Small Hydroelectric 0 13,830 22,000 22,000 22,000 22,000 22,000 22,000 22,000 22,000 22,000 22,000
Geo_DonCamb Geothermal 114,000 114,000 114,000 114,000 114,000 114,000 114,000 114,000 114,000 114,000 114,000 114,000
Geo_DonCamb2 Geothermal 135,000 135,000 135,000 135,000 135,000 135,000 135,000 135,000 135,000 135,000 135,000 135,000
Geo_Herber1 Geothermal 300,000 300,000 300,000 300,000 300,000 300,000 300,000 25,000 0 0 0 0
Geo_Hudson_ Ranch_65 Geothermal 458,000 458,000 383,000 0 0 0 0 0 0 0 0 0
SB859_Biomass _PPA_2018 Biofuels 104,240 104,530 104,240 104,240 51,690 0 0 0 0 0 0 0
Solar_Community Solar PV 3,000 5,000 5,000 5,000 5,000 5,000 5,000 5,000 5,000 5,000 5,000 5,000
Solar_DWP_ Basin_E Solar PV 6,000 6,000 6,000 6,000 6,000 6,000 6,000 6,000 6,000 6,000 6,000 6,000
Solar_DWP_ Basin_P Solar PV 36,000 45,000 53,000 64,000 64,000 63,000 63,000 63,000 62,000 62,000 62,000 61,000
Solar_FIT_150 Solar PV 196,590 196,590 196,590 196,590 196,590 196,590 196,590 196,590 196,590 196,590 196,590 196,590
Solar_FIT_ 150_Exp Solar PV 50,000 148,860 248,860 298,860 298,860 298,860 298,860 296,590 295,450 294,320 292,050 290,910
Solar_FIT_400 _Exp_2035 Solar PV 0 0 0 0 0 0 0 79,550 159,090 238,640 318,180 397,730
Solar_FIT_E_65 Solar PV 71,590 71,590 71,590 71,590 71,590 71,590 71,590 71,590 71,590 71,590 71,590 71,590

B-4
Resource Name Technology 2019 2020 2021 2022 2023 2024 2025 2026 2027 2028 2029 2030
Solar_PPA_ Beacon_1 Solar PV 137,000 137,000 136,000 135,000 135,000 134,000 133,000 133,000 132,000 131,000 131,000 130,000
Solar_PPA_ Beacon_25 Solar PV 216,000 215,000 214,000 213,000 212,000 211,000 210,000 208,000 207,000 206,000 205,000 204,000
Solar_PPA_ Beacon_3 Solar PV 137,000 137,000 136,000 135,000 135,000 134,000 133,000 133,000 132,000 131,000 131,000 130,000
Solar_PPA_ Beacon_4 Solar PV 122,000 122,000 121,000 121,000 120,000 119,000 119,000 118,000 118,000 117,000 116,000 116,000
Solar_PPA_ CopperMountain Solar PV 515,000 515,000 515,000 515,000 515,000 515,000 515,000 515,000 515,000 515,000 515,000 515,000
Solar_PPA_ KMoapa_65 Solar PV 618,000 618,000 618,000 618,000 618,000 618,000 618,000 618,000 618,000 618,000 618,000 618,000
Solar_PPA_ RecurrentBR_65 Solar PV 180,000 179,000 178,000 177,000 177,000 176,000 175,000 174,000 173,000 172,000 171,000 170,000
Solar_PPA_ Springbok_65 Solar PV 281,000 280,000 279,000 277,000 276,000 274,000 273,000 272,000 270,000 269,000 268,000 266,000
Solar_PPA_ Springbok2_65 Solar PV 415,000 413,000 411,000 409,000 407,000 405,000 403,000 401,000 399,000 397,000 395,000 393,000
Solar_PPA_ Springbok3_65 Solar PV 240,000 239,000 238,000 236,000 235,000 234,000 233,000 232,000 231,000 229,000 228,000 227,000
Wind_Linden Wind 145,000 145,000 145,000 145,000 145,000 145,000 145,000 145,000 145,000 145,000 145,000 145,000
Wind_Milford1 Wind 434,000 434,000 434,000 434,000 434,000 434,000 434,000 434,000 434,000 434,000 434,000 434,000
Wind_Milford2 Wind 231,000 231,000 231,000 231,000 231,000 231,000 231,000 231,000 231,000 231,000 231,000 231,000
Wind_ PebbleSprings Wind 193,000 193,000 193,000 193,000 193,000 193,000 193,000 193,000 16,000 0 0 0
Wind_ PPMWyoming Wind 171,000 171,000 171,000 86,000 0 0 0 0 0 0 0 0
Wind_WillowCrk Wind 197,000 197,000 197,000 197,000 197,000 0 0 0 0 0 0 0
Wind_WindyPoint Wind 694,000 694,000 694,000 694,000 694,000 694,000 694,000 694,000 694,000 694,000 694,000 694,000

B-5
Resource Name Technology 2019 2020 2021 2022 2023 2024 2025 2026 2027 2028 2029 2030
Geo_PPA_ 2017_OR Geothermal 250,000 250,000 250,000 250,000 250,000 250,000 250,000 250,000 250,000 250,000 250,000 250,000
Geo_PPA_ 2018_NNV Geothermal 474,000 477,000 1,015,000 1,049,000 1,248,000 1,248,000 1,248,000 1,248,000 1,248,000 1,252,000 1,248,000 1,248,000
Wind_Ext_65 Wind 0 0 0 0 0 390,000 390,000 390,000 390,000 390,000 390,000 390,000
New Geothermal Geothermal 0 0 0 158,000 208,000 566,000 691,000 1,003,000 1,090,000 1,165,000 1,375,000 1,375,000
New Solar Solar PV 0 0 1,216,000 2,336,000 2,336,000 2,336,000 2,336,000 2,336,000 2,336,000 2,336,000 2,336,000 2,336,000
New Wind Wind 0 0 0 0 0 0 0 0 0 0 263,000 757,000
Total Energy N/A 27,144,430 27,284,340 27,688,740 28,534,420 28,620,110 28,939,980 29,111,320 29,009,720 29,189,070 29,599,090 29,841,940 30,710,320
Surplus/ (Shortfall) N/A 95,190 96,390 97,010 703,070 697,920 710,640 720,990 718,710 727,750 705,980 704,840 720,680
Source: California Energy Commission, based on LADWP 2017 IRP filing Energy Balance Table.

B-6
Table B-2: Capacity Resources, All Years (MW) Resource Name Technology 2019 2020 2021 2022 2023 2024 2025 2026 2027 2028 2029 2030 Peak Demand 6,341 6,500 6,612 6,620 6,789 7,060 7,185 7,372 7,393 7,422 7,676 7,800 Planning Reserve Margin 1,717 1,717 1,717 1,723 1,723 1,723 1,644 1,643 1,643 1,643 1,657 1,666 Peak Procurement Requirement 7,660 7,658 7,611 7,579 7,529 7,437 7,281 7,164 7,141 7,293 7,282 7,370
Non-RPS Resources
Castaic Pump Storage 1,175 1,175 1,175 1,175 1,175 1,175 1,175 1,175 1,175 1,175 1,175 1,175 Harbor Natural Gas 558 558 558 558 558 558 558 558 558 558 558 502 Haynes (New Units) Natural Gas 600 600 600 600 600 600 600 936 936 936 1,608 1,608 Haynes (Existing Units) Natural Gas 1,019 1,019 1,019 1,019 1,019 1,019 1,019 575 575 575 0 0 Palo Verde 1 Nuclear 76 76 76 76 76 76 76 76 76 76 76 76 Palo Verde 2 Nuclear 77 77 77 77 77 77 77 77 77 77 77 77 Palo Verde 3 Nuclear 76 76 76 76 76 76 76 76 76 76 76 76 Scattergood (New Units) Natural Gas 514 514 514 514 514 514 850 850 850 850 850 850 Scattergood (Existing Units) Natural Gas 284 284 284 284 284 284 0 0 0 0 0 0
Valley Natural Gas 558 558 558 558 558 558 558 558 558 558 558 558 APEX_X Natural Gas 20 20 20 20 20 20 20 20 20 20 20 20 APEX1P1 Natural Gas 210 210 210 210 210 210 210 210 210 210 210 210 APEX2P1 Natural Gas 270 270 270 270 270 270 270 270 270 270 270 270 Battery_Storage_2Hour Battery Storage 0 25 25 25 25 25 25 25 25 25 25 25 Battery_Storage_4Hour Battery Storage 78 78 78 78 100 122 144 144 144 144 144 144 Battery_Storage_Customer Battery Storage 0 2 2 2 2 2 2 2 2 2 2 2 Battery_Storage_Hhour Battery Storage 50 50 50 50 50 50 50 50 50 50 50 50 CAES Storage 0 0 0 160 160 160 160 160 160 160 160 160 Cogen Natural Gas 19 19 19 19 19 19 19 19 19 19 19 19

B-7
Resource Name Technology 2019 2020 2021 2022 2023 2024 2025 2026 2027 2028 2029 2030 Hoover Large
Hydroelectric 432 432 432 432 432 432 432 432 432 432 432 432
IPP1 Coal 596 596 596 571 521 471 0 0 0 0 0 0 IPP2 Coal 596 596 596 571 521 471 0 0 0 0 0 0 PV SCPPA 1 Nuclear 53 53 53 53 53 53 53 53 53 53 53 53 PV SCPPA 2 Nuclear 53 53 53 53 53 53 53 53 53 53 53 53 PV SCPPA 3 Nuclear 53 53 53 53 53 53 53 53 53 53 53 53 Solar_CNM_nonRPS Solar (non-RPS) 191 191 185 184 184 191 189 192 186 185 191 192 Solar_CNM_nonRPS _P_760_MLS Solar (non-RPS) 176 204 234 265 294 324 386 416 445 474 504 534
Utah CC Natural Gas 0 0 0 0 0 0 624 624 776 776 776 776 RPS Resources
Aqueduct Small Hydroelectric 64 64 64 64 64 64 64 64 64 64 64 64
Aqueduct_PP_ Improvement_65
Small Hydroelectric 0 0 0 0 9 9 9 9 9 9 9 9
Castaic_Improvements Small Hydroelectric 24 24 24 24 24 24 24 24 24 24 24 24
NHollywood Small Hydroelectric 1 1 1 1 1 1 1 1 1 1 1 1
Owens Gorge Small Hydroelectric 109 109 109 109 109 109 109 109 109 109 109 109
Owens Valley Small Hydroelectric 12 12 12 12 12 12 12 12 12 12 12 12
Sepulveda Small Hydroelectric 9 9 9 9 9 0 0 0 0 0 0 0
Solar_DWP_Adelanto Solar PV 5 5 0 0 5 5 5 5 5 5 5 4 Solar_DWP_PineTree Solar PV 4 4 0 0 4 4 4 4 4 4 4 4 Solar_Owens Solar PV 0 0 0 0 0 32 64 96 122 127 124 123 Wind_PineTree Wind 1 3 13 30 28 1 1 3 13 28 0 1

B-8
Resource Name Technology 2019 2020 2021 2022 2023 2024 2025 2026 2027 2028 2029 2030 WSHydro_65 Small
Hydroelectric 0 7 7 7 7 7 7 7 7 7 7 7
Geo_DonCamb Geothermal 13 13 13 13 13 13 13 13 13 13 13 13 Geo_DonCamb2 Geothermal 15 15 15 15 15 15 15 15 15 15 15 15 Geo_Herber1 Geothermal 34 34 34 34 34 34 34 3 0 0 0 0 Geo_Hudson_ Ranch_65 Geothermal 52 52 44 0 0 0 0 0 0 0 0 0
SB859_Biomass _PPA_2018 Biofuels 12 12 12 12 0 0 0 0 0 0 0 0
Solar_Community Solar PV 2 3 2 2 2 3 3 3 2 2 3 3 Solar_DWP_Basin_E Solar PV 2 2 0 2 2 2 2 2 0 2 2 2 Solar_DWP_Basin_P Solar PV 9 11 13 15 16 15 15 15 15 15 15 15 Solar_FIT_150 Solar PV 100 101 97 97 97 100 99 101 98 97 100 101 Solar_FIT_150_Exp Solar PV 26 76 123 147 147 153 151 153 147 145 148 149 Solar_FIT_400_Exp_2035 Solar PV 0 0 0 0 0 0 0 41 79 118 162 204 Solar_FIT_E_65 Solar PV 0 45 47 0 39 0 39 0 40 40 40 40 Solar_PPA_Beacon_1 Solar PV 4 38 38 40 40 4 25 37 37 39 39 4 Solar_PPA_Beacon_25 Solar PV 7 59 60 63 62 7 39 57 58 61 61 6 Solar_PPA_Beacon_3 Solar PV 4 38 38 40 40 4 25 37 37 39 39 4 Solar_PPA_Beacon_4 Solar PV 4 34 34 36 35 4 22 32 33 34 35 4 Solar_PPA_ CopperMountain Solar PV 123 125 121 123 125 123 125 125 121 125 123 123
Solar_PPA_ KMoapa_65 Solar PV 143 144 146 138 122 143 151 143 146 122 148 143
Solar_PPA_ RecurrentBR_65 Solar PV 55 56 52 56 56 54 55 54 51 55 54 52
Solar_PPA_ Springbok_65 Solar PV 17 80 78 82 81 17 22 78 76 79 81 16
Solar_PPA_ Solar PV 25 118 115 121 119 25 32 115 112 117 119 24

B-9
Resource Name Technology 2019 2020 2021 2022 2023 2024 2025 2026 2027 2028 2029 2030 Springbok2_65 Solar_PPA_ Springbok3_65 Solar PV 15 68 67 69 69 14 19 66 65 67 69 14
Wind_Linden Wind 25 25 25 25 25 25 25 25 25 25 25 25 Wind_Milford1 Wind 117 7 115 50 27 115 75 7 115 27 3 117 Wind_Milford2 Wind 41 2 43 18 15 41 13 2 43 15 2 41 Wind_PebbleSprings Wind 33 33 33 33 33 33 33 33 0 0 0 0 Wind_PPMWyoming Wind 6 0 0 0 0 0 0 0 0 0 0 0 Wind_WillowCrk Wind 34 34 34 34 34 0 0 0 0 0 0 0 Wind_WindyPoint Wind 118 118 118 118 118 118 118 118 118 118 118 118 Geo_PPA_2017_OR Geothermal 29 28 29 29 29 28 29 29 29 28 29 29 Geo_PPA_2018_NNV Geothermal 54 54 116 120 142 142 142 142 142 143 142 142 Wind_Ext_65 Wind 4 38 38 40 40 4 25 37 37 39 39 4 New Geothermal Geothermal 0 0 0 18 24 64 79 114 124 132 157 157 New Solar Solar PV 0 0 286 644 650 636 646 644 616 650 646 634 New Wind Wind 0 0 0 0 0 0 0 0 0 0 45 151 Total Capacity Procured 8,999 9,370 9,569 9,592 9,542 9,193 9,129 9,213 9,594 9,566 9,714 9,505 Surplus/Shortfall 1,444 1,846 2,441 2,882 2,916 2,648 2,783 3,029 3,415 3,283 3,509 3,270
Source: California Energy Commission, based on LADWP 2017 IRP filing Capacity Resource Accounting Table.

B-10
Table B-3: GHG Emissions from LADWP’s Resource Portfolio (mT C02e), All Years
Resource Name Fuel
GHG Intensity
(MT CO2e/ MWh)
2019 2020 2021 2022 2023 2024 2025 2026 2027 2028 2029 2030
Harbor Natural Gas 0.48 62,814 79,397 32,629 23,599 24,110 20,198 18,589 9,265 1,926 2,126 4,883 140,059
Haynes (New Units)
Natural Gas 0.42 82,523 167,905 85,855 51,026 53,566 57,084 129,612 747,425 604,874 780,270 2,189,098 2,117,945
Haynes (Existing Units)
Natural Gas 0.41 1,424,567 1,409,770 1,319,374 1,256,463 1,296,571 1,175,607 1,162,377 944,058 1,151,685 1,002,144 0 0
Scattergood (New Units)
Natural Gas 0.40 887,141 832,462 738,346 756,384 719,357 739,591 1,226,716 1,175,817 1,020,611 1,225,402 1,008,849 896,679
Scattergood (Existing Units)
Natural Gas 0.73 0 4,733 0 0 0 0 0 0 0 0 0 0
Valley Natural Gas 0.42 277,677 337,270 216,851 168,789 161,153 153,580 174,301 121,536 78,436 67,409 43,450 36,482
APEX_X Natural Gas 0.37 10,925 8,097 5,229 4,133 3,635 3,381 703 101 138 0 7 0
APEX1P1 Natural Gas 0.37 422,022 376,771 257,914 150,546 158,049 136,985 39,248 5,969 6,586 864 1,459 0
APEX2P1 Natural Gas 0.37 349,828 300,804 207,619 133,503 139,955 114,279 32,549 6,272 6,403 961 1,107 0
Cogen Natural Gas 0.43 72,734 72,935 72,734 72,734 72,734 72,935 72,734 72,734 72,734 72,935 72,734 72,734
IPP1 Coal 0.92 2,404,093 2,227,429 2,351,565 2,152,715 2,248,259 2,041,547 845,700 0 0 0 0 0
IPP2 Coal 0.92 1,772,629 1,996,432 1,735,680 1,896,059 1,695,624 1,828,282 652,660 0 0 0 0 0
Utah CC Natural Gas 0.37 0 0 0 0 0 0 575,377 833,878 946,381 853,689 526,988 562,260
DC Loss Payback N/A 0.43 175,052 175,052 175,052 175,052 175,052 175,052 175,052 175,052 175,052 175,052 175,052 175,052
Portfolio emissions portfolio NA 7,942,005 7,989,057 7,198,848 6,841,003 6,748,065 6,518,521 5,105,618 4,092,107 4,064,826 4,180,852 4,023,628 4,001,212
Source: California Energy Commission, based on LADWP 2017 IRP filing Greenhouse Gas Emissions Accounting Table.

ATTACHMENT I-1
ATTACHMENT I: PUBLIC UTILITIES CODE FOR SENATE BILL 350
Public Utilities Code - PUC
DIVISION 4.9. RESTRUCTURING OF PUBLICLY OWNED ELECTRIC UTILITIES IN CONNECTION WITH THE RESTRUCTURING OF THE ELECTRICAL SERVICES INDUSTRY [9600 - 9622]
( Division 4.9 added by Stats. 1996, Ch. 854, Sec. 12. )
9621. (a) This section shall apply to a local publicly owned electric utility with an annual electrical demand exceeding 700 gigawatthours, as determined on a three-year average commencing January 1, 2013. (b) On or before January 1, 2019, the governing board of a local publicly owned electric utility shall adopt an integrated resource plan and a process for updating the plan at least once every five years to ensure the utility achieves all of the following: (1) Meets the greenhouse gas emissions reduction targets established by the State Air Resources Board, in coordination with the commission and the CEC, for the electricity sector and each local publicly owned electric utility that reflect the electricity sector’s percentage in achieving the economywide greenhouse gas emissions reductions of 40 percent from 1990 levels by 2030. (2) Ensures procurement of at least 50 percent eligible renewable energy resources by 2030 consistent with Article 16 (commencing with Section 399.11) of Chapter 2.3 of Part 1 of Division 1. (3) Meets the goals specified in subparagraphs (D) to (H), inclusive, of paragraph (1) of subdivision (a) of Section 454.52, and the goal specified in subparagraph (C) of paragraph (1) of subdivision (a) of Section 454.52, as that goal is applicable to each local publicly owned electric utility. A local publicly owned electric utility shall not, solely by reason of this paragraph, be subject to requirements otherwise imposed on electrical corporations. (c) In furtherance of the requirements of subdivision (b), the governing board of a local publicly owned electric utility shall consider the role of existing renewable generation, grid operational efficiencies, energy storage, and distributed energy resources, including energy efficiency, in helping to ensure each utility meets energy needs and reliability needs in hours to encompass the hour of peak demand of electricity, excluding demand met by variable renewable generation

ATTACHMENT I-2
directly connected to a California balancing authority, as defined in Section 399.12, while reducing the need for new electricity generation resources and new transmission resources in achieving the state’s energy goals at the least cost to ratepayers. (d) (1) The integrated resource plan shall address procurement for the following: (A) Energy efficiency and demand response resources pursuant to Section 9615. (B) Energy storage requirements pursuant to Chapter 7.7 (commencing with Section 2835) of Part 2 of Division 1. (C) Transportation electrification. (D) A diversified procurement portfolio consisting of both short-term and long-term electricity, electricity-related, and demand response products. (E) The resource adequacy requirements established pursuant to Section 9620. (2) (A) The governing board of the local publicly owned electric utility may authorize all source procurement that includes various resource types, including demand-side resources, supply side resources, and resources that may be either demand-side resources or supply side resources, to ensure that the local publicly owned electric utility procures the optimum resource mix that meets the objectives of subdivision (b). (B) The governing board may authorize procurement of resource types that will reduce overall greenhouse gas emissions from the electricity sector and meet the other goals specified in subdivision (b), but due to the nature of the technology or fuel source may not compete favorably in price against other resources over the time period of the integrated resource plan. (e) A local publicly owned electric utility shall satisfy the notice and public disclosure requirements of subdivision (f) of Section 399.30 with respect to any integrated resource plan or plan update it considers. (Amended by Stats. 2017, Ch. 389, Sec. 2. (SB 338) Effective January 1, 2018.)
ATTACHMENT I-3
Public Utilities Code - PUC
DIVISION 1. REGULATION OF PUBLIC UTILITIES [201 - 3260] ( Division 1 enacted by Stats. 1951, Ch. 764. )
PART 1. PUBLIC UTILITIES ACT [201 - 2120]
( Part 1 enacted by Stats. 1951, Ch. 764. ) CHAPTER 3. Rights and Obligations of Public Utilities [451 - 651]
( Chapter 3 enacted by Stats. 1951, Ch. 764. )
ARTICLE 1. Rates [451 - 467]
( Article 1 enacted by Stats. 1951, Ch. 764. )
454.52. (a) (1) Beginning in 2017, and to be updated regularly thereafter, the commission shall adopt a process for each load-serving entity, as defined in Section 380, to file an integrated resource plan, and a schedule for periodic updates to the plan, to ensure that load-serving entities do the following: (A) Meet the greenhouse gas emissions reduction targets established by the State Air Resources Board, in coordination with the commission and the CEC, for the electricity sector and each load-serving entity that reflect the electricity sector’s percentage in achieving the economywide greenhouse gas emissions reductions of 40 percent from 1990 levels by 2030. (B) Procure at least 50 percent eligible renewable energy resources by December 31, 2030, consistent with Article 16 (commencing with Section 399.11) of Chapter 2.3. (C) Enable each electrical corporation to fulfill its obligation to serve its customers at just and reasonable rates. (D) Minimize impacts on ratepayers’ bills. (E) Ensure system and local reliability. (F) Strengthen the diversity, sustainability, and resilience of the bulk transmission and distribution systems, and local communities. (G) Enhance distribution systems and demand-side energy management. (H) Minimize localized air pollutants and other greenhouse gas emissions, with early priority on disadvantaged communities identified pursuant to Section 39711 of the Health and Safety Code. (2) (A) The commission may authorize all source procurement for electrical corporations that includes various resource types including demand-side resources, supply side resources, and resources that may be either demand-side
ATTACHMENT I-4
resources or supply side resources, taking into account the differing electrical corporations’ geographic service areas, to ensure that each load-serving entity meets the goals set forth in paragraph (1). (B) The commission may approve procurement of resource types that will reduce overall greenhouse gas emissions from the electricity sector and meet the other goals specified in paragraph (1), but due to the nature of the technology or fuel source may not compete favorably in price against other resources over the time period of the integrated resource plan. (3) In furtherance of the requirements of paragraph (1), the commission shall consider the role of existing renewable generation, grid operational efficiencies, energy storage, and distributed energy resources, including energy efficiency, in helping to ensure each load-serving entity meets energy needs and reliability needs in hours to encompass the hour of peak demand of electricity, excluding demand met by variable renewable generation directly connected to a California balancing authority, as defined in Section 399.12, while reducing the need for new electricity generation resources and new transmission resources in achieving the state’s energy goals at the least cost to ratepayers. (b) (1) Each load-serving entity shall prepare and file an integrated resource plan consistent with paragraph (2) of subdivision (a) on a time schedule directed by the commission and subject to commission review. (2) Each electrical corporation’s plan shall follow the provisions of Section 454.5. (3) The plan of a community choice aggregator shall be submitted to its governing board for approval and provided to the commission for certification, consistent with paragraph (5) of subdivision (a) of Section 366.2, and shall achieve the following: (A) Economic, reliability, environmental, security, and other benefits and performance characteristics that are consistent with the goals set forth in paragraph (1) of subdivision (a). (B) A diversified procurement portfolio consisting of both short-term and long-term electricity and electricity-related and demand reduction products. (C) The resource adequacy requirements established pursuant to Section 380. (4) The plan of an electric service provider shall achieve the goals set forth in paragraph (1) of subdivision (a) through a diversified portfolio consisting of both short-term and long-term electricity, electricity-related, and demand reduction products. (c) To the extent that additional procurement is authorized for the electrical corporation in the integrated resource plan or the procurement process authorized pursuant to Section 454.5, the commission shall ensure that the costs are allocated in a fair and equitable manner to all customers consistent with Section 454.51, that there is no cost shifting among customers of load-serving

ATTACHMENT I-5
entities, and that community choice aggregators may self-provide renewable integration resources consistent with Section 454.51. (d) To eliminate redundancy and increase efficiency, the process adopted pursuant to subdivision (a) shall incorporate, and not duplicate, any other planning processes of the commission. (e) This section applies to an electrical cooperative, as defined in Section 2776, only if the electrical cooperative has an annual electrical demand exceeding 700 gigawatthours, as determined based on a three-year average commencing with January 1, 2013. (Amended by Stats. 2018, Ch. 92, Sec. 174. (SB 1289) Effective January 1, 2019.)

RESOLUTION NO: 19-1211-7a
STATE OF CALIFORNIA
STATE ENERGY RESOURCES
CONSERVATION AND DEVELOPMENT COMMISSION
RESOLUTION FINDING LOS ANGELES DEPARTMENT OF WATER AND POWER’S INTEGRATED RESOURCE PLAN CONSISTENT WITH PUBLIC UTILITIES CODE
SECTION 9621
WHEREAS, Public Utilities Code Sections 9621 and 9622 require specified local publicly owned electric utilities to adopt Integrated Resource Plans at least once every five years and submit them to the California Energy Commission; and
WHEREAS, Public Utilities Code Section 9622 requires that the California Energy Commission review the local publicly owned electric utilities’ Integrated Resource Plans for consistency with the requirements of Section 9621, and to provide recommendations to correct deficiencies; and
WHEREAS, on April 30, 2019, the Los Angeles Department of Water and Power (LADWP) submitted an Integrated Resource Plan and supporting documentation (the IRP Filing); and
WHEREAS, on May 20, 2019, the Energy Commission notified LADWP that the IRP Filing was complete, as described in the Publicly Owned Utilities’ Integrated Resource Plan Guidelines adopted by the Energy Commission; and
WHEREAS, the Energy Commission posted the IRP Filing on its website for public comment and accepted comments for at least 30 days and did not receive any public comment; and
WHEREAS, on August 28, 2019, the Energy Commission Executive Director signed a letter informing LADWP that he had determined the IRP Filing is consistent with the requirements of Public Utilities Code Section 9621, which was posted on the Energy Commission website along with a supporting staff paper on August 28, 2019 for a 45 day comment period; and
WHEREAS, the Energy Commission did not receive any comments on the staff paper; and
THEREFORE BE IT RESOLVED, that the Energy Commission adopts the determination of the Executive Director, that the IRP Filing is consistent with the requirements of Public Utilities Code Section 9621.
2
CERTIFICATION
The undersigned Secretariat to the Commission does hereby certify that the foregoing is a full, true, and correct copy of a Resolution duly and regularly adopted at a meeting of the CEC held on December 11, 2019. AYE: NAY: ABSENT: ABSTAIN:
__________________________ Cody Goldthrite Secretariat


![Los Angeles herald (Los Angeles, Calif. : 1900) (San ... · Los Angeles herald (Los Angeles, Calif. : 1900) (San Francisco) 1907-02-17 [p 10]](https://static.documents.pub/doc/80x56/5acba5097f8b9aa1518b6473/los-angeles-herald-los-angeles-calif-1900-san-angeles-herald-los-angeles.jpg)


