18
Los Angeles • New York Review of Private Equity Portfolio Rhode Island State Investment Commission Tom Lynch, Senior Managing Director, CFA October 5, 2016
| Date post: | 11-Aug-2018 |
| Category: |
Documents |
| Upload: | truonglien |
| View: | 216 times |
| Download: | 0 times |
Los Angeles • New York
Review of Private Equity Portfolio
Rhode Island State Investment Commission
Tom Lynch, Senior Managing Director, CFA
October 5, 2016

Review of ERSRI Private Equity Portfolio

3
Private Equity Portfolio
Portfolio Summary Since Inception as of June 30, 2016• Inception Date: December 20, 1982• Total Commitments: $2.1 billion• Number of Partnerships
• Cash Flows (millions)
Committed 128 partnerships
Liquidated 46 partnerships
Active 82 partnerships
Commitments $2,117
Contributions $1,883
Distributions $2,260
Unfunded $293
Market Value $536
Since Inception Annualized IRR (net of fees)
13.4%
Total Value/InvestedCapital (net of fees)
1.48x

4
Status of Active Partnerships (June 2016)
66%
50%
33%
34%
50%
67%
0%
10%
20%
30%
40%
50%
60%
70%
80%
90%
100%
Number of Partnerships Market Value Total Exposure
Fund Harvesting Funds Investing
Number ofPartnerships Market Value Uncalled Capital Total Exposure
Harvesting (Past Investment Period) 54 $268,996,465 $3,035,182 $272,031,647Investing (Still in Investment Period) 28 $266,939,261 $290,100,000 $557,039,261Total Active Funds 82 $535,935,726 $293,135,182 $829,070,908

5
Long Term Performance
Partnership Sector Vintage Year Commitment Amount Since Inception Annual IRR
Nautic Partners VII US Buyout 2014 $20.0 87.8%
CVC European Equity III European Buyout 2001 $20.0 41.1%
First Reserve X Energy 2004 $20.0 31.0%
Providence Equity Partners IV US Buyout 2001 $25.0 23.4%
Nordic Capital Fund V European Buyout 2003 $15.9 21.1%
Top Five Performing Active Partnerships based on Since Inception IRR through June 30, 2016
Notes: All returns are since inception annualized IRRs net of fees through June 2016. For Vintage Year returns, no commitments were made in 2009‐10 and 2015‐16 returns are too early to be meaningful.
Returns by Vintage Year Returns by Sector
4.37%
8.96%
10.38%
11.02%
20.37%
23.86%
0.00% 5.00% 10.00% 15.00% 20.00% 25.00% 30.00%
Venture
Direct Lending
Distressed Debt
US Buyouts
Intl Buyouts
Energy14.26%
11.19%
8.08%
5.36%
10.14%
6.77% 7.29%6.62%
8.08%
11.78%
0.00%
2.00%
4.00%
6.00%
8.00%
10.00%
12.00%
14.00%
16.00%
2003 2004 2005 2006 2007 2008 2011 2012 2013 2014
6
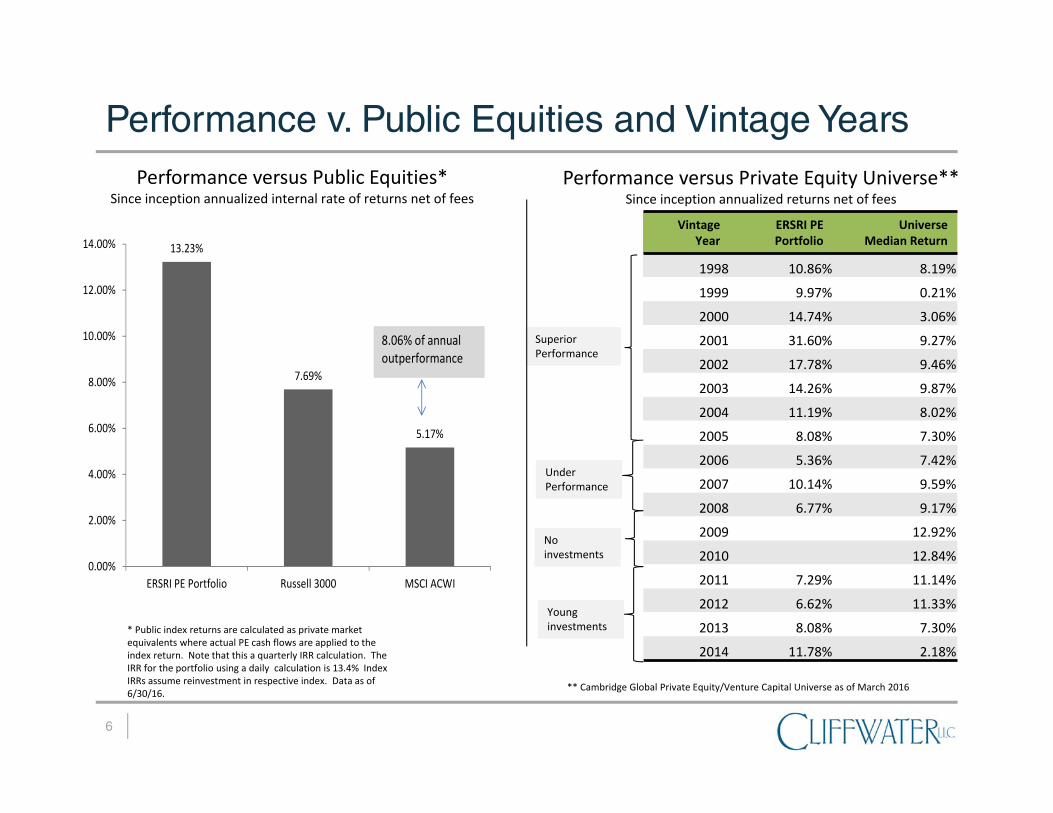
Performance v. Public Equities and Vintage Years
VintageYear
ERSRI PE Portfolio
UniverseMedian Return
1998 10.86% 8.19%
1999 9.97% 0.21%
2000 14.74% 3.06%
2001 31.60% 9.27%
2002 17.78% 9.46%
2003 14.26% 9.87%
2004 11.19% 8.02%
2005 8.08% 7.30%
2006 5.36% 7.42%
2007 10.14% 9.59%
2008 6.77% 9.17%
2009 12.92%
2010 12.84%
2011 7.29% 11.14%
2012 6.62% 11.33%
2013 8.08% 7.30%
2014 11.78% 2.18%
SuperiorPerformance
Under Performance
Young investments
Performance versus Public Equities*Since inception annualized internal rate of returns net of fees
Performance versus Private Equity Universe**Since inception annualized returns net of fees
** Cambridge Global Private Equity/Venture Capital Universe as of March 2016
* Public index returns are calculated as private market equivalents where actual PE cash flows are applied to the index return. Note that this a quarterly IRR calculation. The IRR for the portfolio using a daily calculation is 13.4% Index IRRs assume reinvestment in respective index. Data as of 6/30/16.
13.23%
7.69%
5.17%
0.00%
2.00%
4.00%
6.00%
8.00%
10.00%
12.00%
14.00%
ERSRI PE Portfolio Russell 3000 MSCI ACWI
8.06% of annual outperformance
No investments

7
Exposures by Sector and Vintage Year
Exposure by Fund Sector Strategy(exposure equals market value plus undrawn
capital)
Commitments by Vintage YearIn thousand of dollars
Portfolio is diversified by strategySome vintage year concentration with large exposure to 2006 and no exposure to 2009/10
Venture Capital 17%
Distressed 3%
Private Debt 14%
Other 1%
Large Buyout 10%
Mid Buyout 18%
Small Buyout 12%
Europe Buyout 14%
Asia Buyout 5%
Energy 5%
$0
$50,000
$100,000
$150,000
$200,000
$250,000
$300,000
$350,000
$400,000

8
Exposures by Fund and Manager
Exposure by Fund(exposure equals market value plus undrawn capital)
Portfolio is diversified by fund with largest exposure less than 4% of total
Larger fund exposures are represented by newer commitments that have yet to reach distribution stage
Portfolio is diversified by manager with largest exposure at 6.2% of total
Larger manager exposures represent managers who have performed well and commitments have been made to multiple funds over time
Exposure by Manager(exposure equals market value plus undrawn capital)
Firm $ Exposure % ExposureNautic Partners 54,497,730 6.20%Centerbridge Capital Partners 53,692,372 6.11%Industry Ventures 52,051,001 5.93%Nordic Capital 46,540,785 5.30%Providence Equity Partners 43,257,611 4.92%
Fund $ Exposure % ExposureGarrison Opportunity Fund IV, LLC 30,583,016 3.48%CapitalSpring Investment Partners V, LP 30,000,000 3.42%Southvest Fund VII, L.P. 29,540,239 3.36%Sorenson Capital Partners III, L.P. 28,977,710 3.30%Paine & Partners Capital Fund IV 28,553,207 3.25%

9
Exposures by Industry and Company as of March 2016
Company Sector Partnership
Griffin Holdings Real EstateOaktree European Principal Fund III
Sleep Country Canada Consumer Birch Hill Equity Partners III
Lionsgate Comm/Media MHR Institutional Partners III
Veracode Information Technology Point 406 Ventures I
ConvaTec Group Health Care Nordic Capital Fund VII
Shred‐it International Business Services Birch Hill Equity Partners III
Tate’s Holding Consumer Riverside Micro‐Cap Fund III
ConvaTec Group Health Care Nordic Capital Fund VII
Esperion Therapeutics Health Care Alta Partners VIII
CradlePoint Inc Information Technology Sorenson Capital III
Exposure by IndustryBased on market value
Examples of Largest Company Holdings
Portfolio is diversified by industry
Portfolio consists of over 950 companies with no company larger than 2% of total market value
Consumer 22%
Comm/Media 10%
Information Technology 12%
Industrial/Transport 9%
Energy 7%
Financial/Business Services 12%
Materials 1%
Health Care 16%
Real Estate 8%
Other 4%

Private Equity Market Outlook 3rd Quarter 2016
11
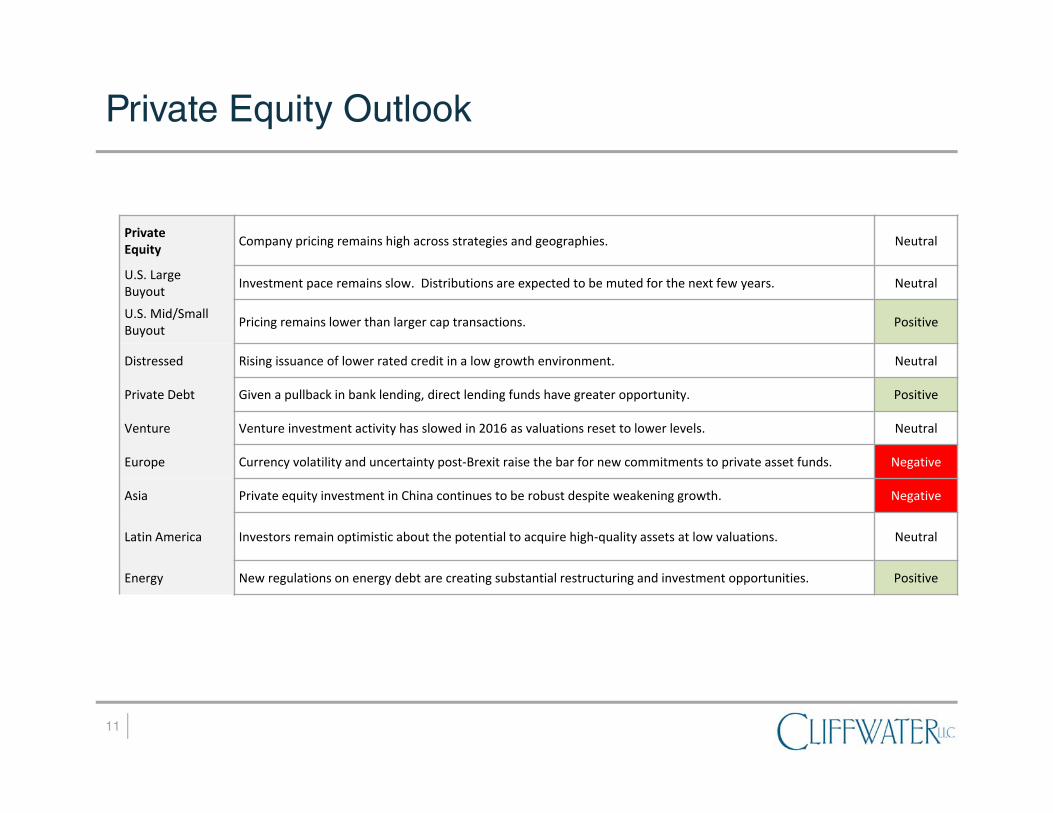
Private Equity Outlook
PrivateEquity Company pricing remains high across strategies and geographies. Neutral
U.S. LargeBuyout Investment pace remains slow. Distributions are expected to be muted for the next few years. Neutral
U.S. Mid/SmallBuyout Pricing remains lower than larger cap transactions. Positive
Distressed Rising issuance of lower rated credit in a low growth environment. Neutral
Private Debt Given a pullback in bank lending, direct lending funds have greater opportunity. Positive
Venture Venture investment activity has slowed in 2016 as valuations reset to lower levels. Neutral
Europe Currency volatility and uncertainty post‐Brexit raise the bar for new commitments to private asset funds. Negative
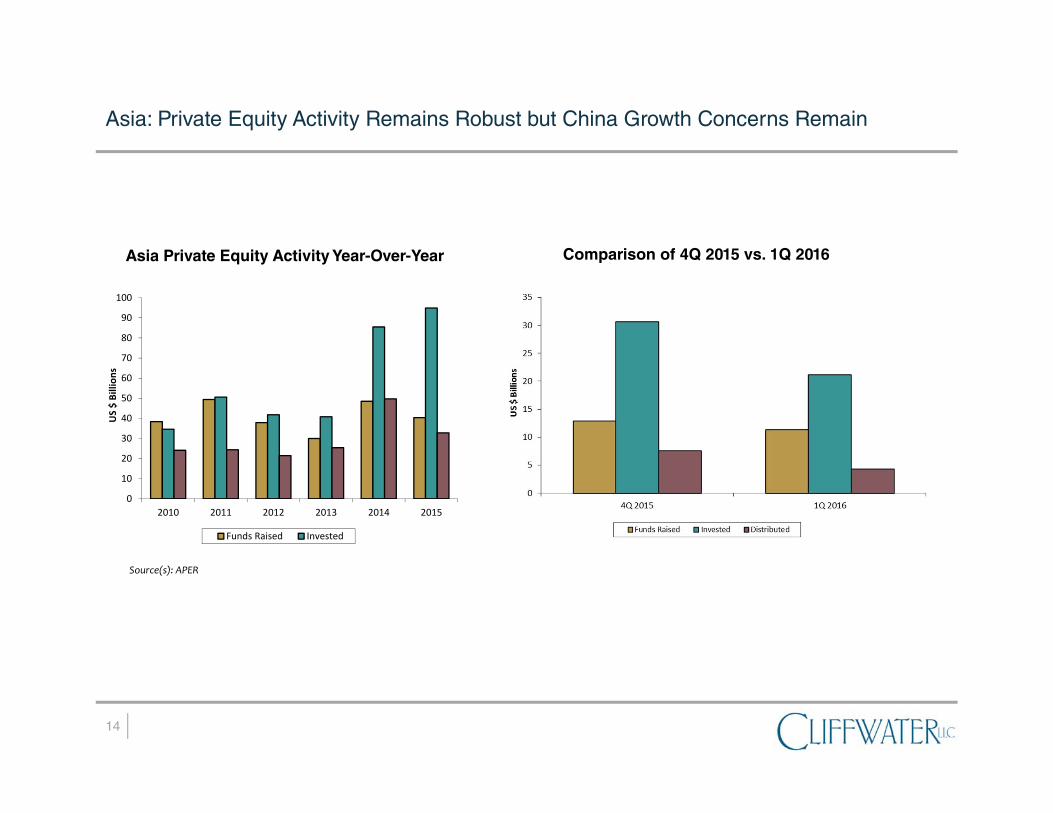
Asia Private equity investment in China continues to be robust despite weakening growth. Negative
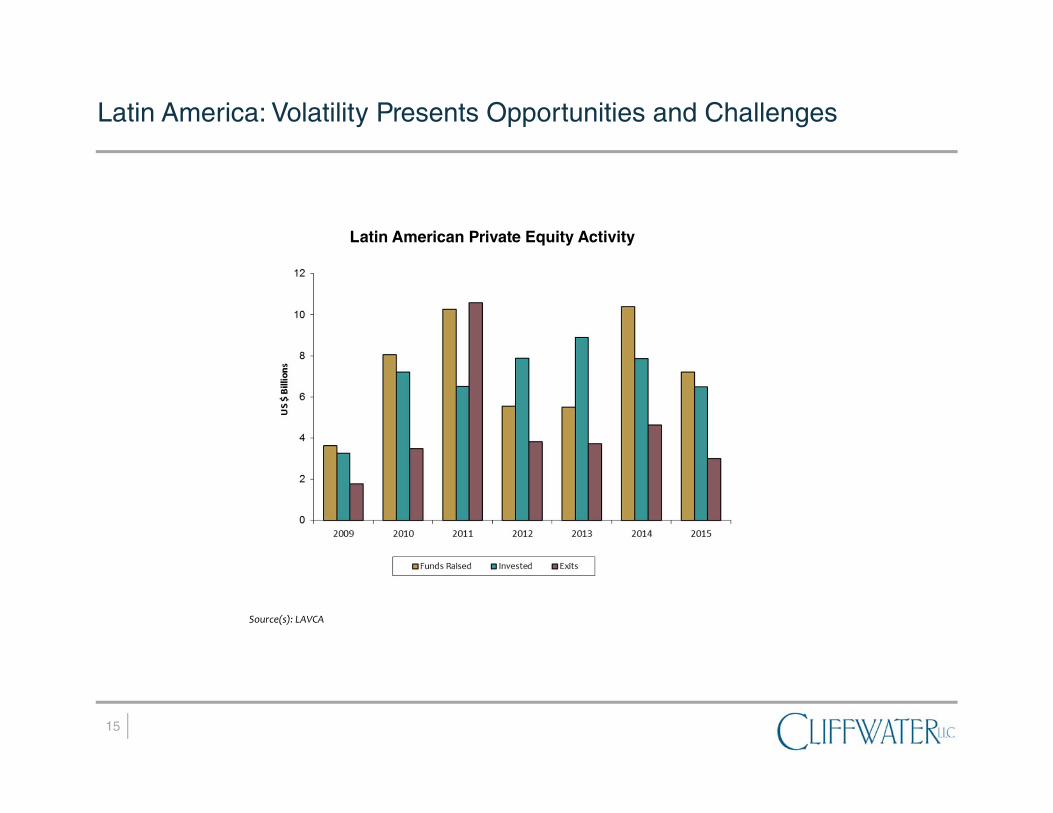
Latin America Investors remain optimistic about the potential to acquire high‐quality assets at low valuations. Neutral
Energy New regulations on energy debt are creating substantial restructuring and investment opportunities. Positive

12
U.S. Buyout: Higher Prices Persist, Especially on the Larger End of the Market
11.4x
6.5x5.3x
0.0x
2.0x
4.0x
6.0x
8.0x
10.0x
12.0x
14.0x
1Q 2Q 3Q 4Q 1Q 2Q 3Q 4Q 1Q 2Q 3Q 4Q 1Q 2Q 3Q 4Q 1Q
2012 2013 2014 2015 2016
U.S. Purchase Price Multiples
$250M+ (EV) $25M‐$250M (EV) Under $25M (EV)
Med
ian EV
/EBITD
Amultip
les
5.75.5
4.4
2.02.53.03.54.04.55.05.56.06.5
Deb
t/EB
ITDA
LBO Debt/EBITDA Multiples
Large Market (EBITDA >$50m) All LBOsMiddle Market (EBITDA <$50m)
Source: Pitchbook
13
Europe: Uncertainty Favors a Differentiated Approach
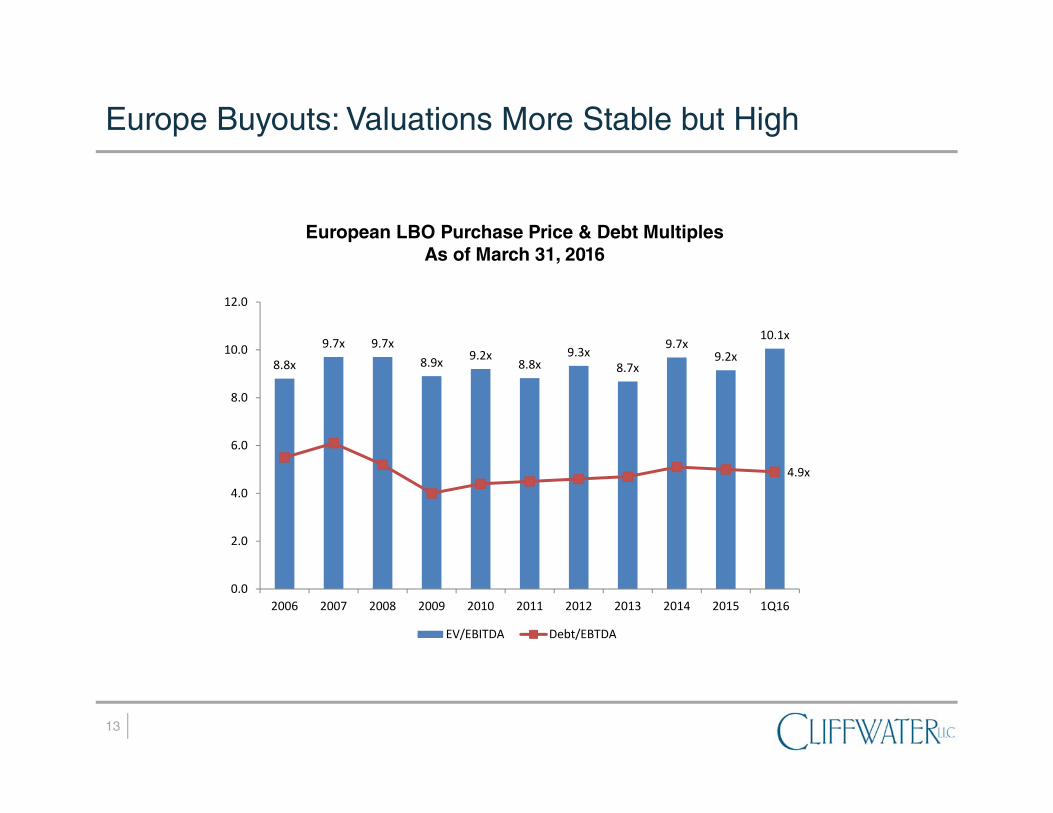
European LBO Purchase Price & Debt Multiples As of March 31, 2016
8.8x
9.7x 9.7x8.9x 9.2x
8.8x9.3x
8.7x
9.7x9.2x
10.1x
4.9x
0.0
2.0
4.0
6.0
8.0
10.0
12.0
2006 2007 2008 2009 2010 2011 2012 2013 2014 2015 1Q16
EV/EBITDA Debt/EBTDA
Europe Buyouts: Valuations More Stable but High
14
Asia: Pursuing a Barbell Approach in Maturing Market
Source(s): APER
Asia Private Equity Activity Year-Over-Year
0
10
20
30
40
50
60
70
80
90
100
2010 2011 2012 2013 2014 2015
US $ Billion
s
Funds Raised Invested
Comparison of 4Q 2015 vs. 1Q 2016
Asia: Private Equity Activity Remains Robust but China Growth Concerns Remain
15
Latin America: Volatility Presents Opportunities and Challenges
Source(s): LAVCA
Latin American Private Equity Activity

16
Venture Capital: Investing and Valuations Remain at High Levels
Source: Pitchbook
VC Investments by year as of June 30, 2016 ($ Billions)
Median Venture Capital round size as of June 30, 2016 ($ Millions)
$0.79$1.00
$5.00$5.50
$11.00$10.00
0
2
4
6
8
10
12
2005 2006 2007 2008 2009 2010 2011 2012 2013 2014 2015 2016*
Angel/Seed Early VC Later VC
$29
$36
$37
$26
$31
$44
$41
$44
$68
$79
$40
3235
42364658
4411
5377
6711
7967
9209
10425 10173
3967
0
2000
4000
6000
8000
10000
12000
$0
$10
$20
$30
$40
$50
$60
$70
$80
$90
2006 2007 2008 2009 2010 2011 2012 2013 2014 2015 2016*
Deal value ($B)
# of deals closed
*1H 2016 *1H 2016
Venture Capital Undergoing a Market Correction
Valuations and investment levels declined in the first half of 2016 due to weak IPO market and struggles of the “Unicorns”
Technology and business formation remain attractive with positive trends in biotechnology, big data, and cybersecurity

17
Distressed and Private Debt: Market Volatility Creates Opportunities
Normalized European Equity Market Performance
As of July 8, 2016
80
85
90
95
100
105
110
May‐16 Jun‐16 Jul‐16
FTSE 100 FTSE 250
Brexit
0.0%
2.0%
4.0%
6.0%
8.0%
10.0%
12.0%
14.0%
16.0%
18.0%
20.0%
Source: Barclays
HY Opt
ion‐Adjus
tedSp
read
Average: 5.83%5.94%
U.S. High Yield Bonds Option Adjusted SpreadAs of June 30, 2016
Brexit may create distressed debt opportunities in domestic UK companies
US credit markets subject to more volatility due to less liquid markets
Continued opportunities to provide private debt where banks are no longer present

18
Cliffwater Disclosures Important Notice
This presentation has been provided to you for the purpose of discussing an investment advisory relationship. The material contained herein isconfidential and is intended for one-on-one or small group meetings with qualified, sophisticated, institutional investors. It may not be copied,transmitted, given, or disclosed to any person other than your authorized representatives. This presentation is not an advertisement and is notintended for public use for distribution. This material is not meant to be, nor shall it be construed as, an offer or solicitation of an offer for thepurchase or sale of any security.
This presentation was prepared exclusively for information and discussion purposes, and is not meant to be, nor shall it be construed as, anattempt to define all information that may be material to you. All information including opinions or facts expressed herein are current as of thedate appearing in this presentation and is subject to change without notice. All information has been obtained from sources believed to bereliable. No representation, warranty, or undertaking, express or implied, is given as to the accuracy or completeness of the information oropinions contained in this presentation. The information and opinions in this presentation do not constitute investment advice. The list of clientsincluded in this presentation is a partial list selected to illustrate size and type and does not represent an endorsement or approval of Cliffwateror the advisory services provided.
This presentation may include sample or pro forma performance. Such information is presented for illustrative purposes only and is based onvarious assumptions, not all of which are described herein. Such assumptions, data, or projections may have a material impact on the returnsshown. Nothing contained in this presentation is, or shall be relied upon as, a representation as to past or future performance, and noassurance, promise, or representation can be made as to actual returns. Past performance does not guarantee future performance.
References to market or composite indices (such as the S&P 500), benchmarks or other measures of relative market performance over aspecified period of time (each, an “index”) are provided for information only. Reference to an index does not imply that a portfolio will achievereturns, volatility or other results similar to the index. The composition of an index may not reflect the manner in which a portfolio is constructedin relation to expected or achieved returns, portfolio guidelines, restrictions, sectors, correlations, concentrations, volatility or tracking errortargets, all of which are subject to change over time.
• Hedge Fund Research, Inc. (“HFR”) is the source and owner of the HFR data contained or reflected in this report and all trademarksrelated thereto.
• Frank Russell Company (“FRC”) is the source and owner of the Russell Index data contained or reflected in this material and alltrademarks and copyrights related thereto. The Russell Index data may contain confidential information and unauthorized use,disclosure, copying, dissemination or redistribution is strictly prohibited.
• Thomson Financial Inc. is the owner and/or licensor of the Cambridge Associates LLC data contained or reflected in this material.


