1 Review of Regulation 206/2012 and 626/2011 Air conditioners and comfort fans Alternative testing methods Draft Date: 5 March 2021 Viegand Maagøe A/S Nr. Farimagsgade 37 1364 Copenhagen K Denmark viegandmaagoe.dk
ARMINES and Viegand Maagøe Study team: Flemming Andersen, Rikke Naeraa, Philippe Riviere Quality manager: Jan Viegand Contract manager: René Kemna, VHK Prepared for:
2.3 Is it possible to introduce the compensation method? ........................................................ 24
2.4 When could we start applying the compensation method in regulations? .......................... 25
2.5 Alternatives proposed by manufacturers.............................................................................. 25
2.5.1 Request of technical information allowing independent testing .................................. 25
4
2.5.2 Control verification procedure ...................................................................................... 27
2.5.3 Conclusion on alternatives proposed by manufacturers .............................................. 28
Annex A: Discussion paper of June 18th (Version of June 19th, as sent after the meeting) ................... 30
5
Introduction This report is to update the information and possible scenarios from the review study and to improve
test methods for air-to-air heat pumps and air-to-air air conditioners. The report is based on:
— the document prepared to support the June 18th 2020 meeting with stakeholders on test
methods (See Annex A)
— the discussions during the June 18th 2020 meeting
— the comments received after the meeting
Part 1 is related to thermal comfort. Part 2 is related to the independent test method with unlocked
compressor.
1 Thermal comfort
1.1 Background
June 18th document
The review study1, task 3, section 3.1.7, already touched upon this topic and identified that: • In heating mode, the temperature of the air that blows out of the heat pump (supply air
temperature) should not be below 32 °C (temperature of the skin) and probably closer to 40 °C to ensure thermal comfort.
• In cooling mode, units should dehumidify to ensure thermal comfort. In the current test method, it is not mandatory to consider these factors. In reality, when the supply air temperature is too cold air in heating mode, the end-user is likely to increase the indoor set point in heating mode to improve comfort levels. Similarly, when the unit does not dehumidify in cooling mode, the end-user is likely to decrease the indoor set point in cooling mode to improve comfort levels. These actions will lead to increased heating/cooling loads and decreased efficiencies. As a result, the declared energy efficiency values are potentially exaggerated.
The review study proposed to solve this issue by declaring the values for the supply air temperature in heating and cooling mode and the humidity in cooling mode in the technical documentation and to set requirements during the review based on these data.
However, according to APPLiA, 45 % of the units (based on 215 tests) on the market today do not dehumidify sufficiently in between ambient temperatures of 30-35 °C in cooling mode during the test. This means that the current policy options are partly based on exaggerated energy efficiency values. As such, without a solution in this review, the remaining manufacturer would be forced to rate their units in the same way to be able to pass the revised energy efficiency requirements.
Comments received regarding the rationale
BAM-UBA: It is assumed that the user increases or decreases the set-point, respectively, if the supply
air-temperature is too cold in heating mode or the unit does not dehumidify in cooling mode. Are
these observations or assumptions? Please give a reference to the underlying assessment.
1 Baijia Huang, Peter Martin Skov Hansen, Jan Viegand, Philippe Riviere, Hassane Asloune, et al.. Air conditioners and comfort fans, Review of Regulation 206/2012 and 626/2011 Final report. [Research Report] European Commission, DG Energy. 2018. ⟨hal-01796759⟩
6
It is true that no study could be found showing comfort complaints or change in set point due to too
low temperature air supply in heating mode or of a lack of dehumidification. However, the same
observation of too high air flows possibly affecting comfort was also made in the USA, which have
already plans to limit the maximum air flows to allow dehumidification (standard AHRI 1230 – 2020).
During June 18th meeting and in the comments received afterwards, no manufacturer denied the
existence of this reaction. As a consequence, it seems important to plan countermeasures to stop
the indoor air flow increase, even if the precise quantification on the set point change reaction is not
yet known. A study on the link between temperature set point, air flow settings and comfort felt by
end-users is recommended in future actions.
1.2 Heating mode
1.2.1 Cold local air flow
The reason to require a minimum air supply temperature in heating mode is the local discomfort
brought by cold local air flow. Comfort standards, such as the EN ISO 7730:20062, include the impact
of air speed, but not the combined effect of air speed and of temperature difference between the
supply air temperature and the indoor air temperature.
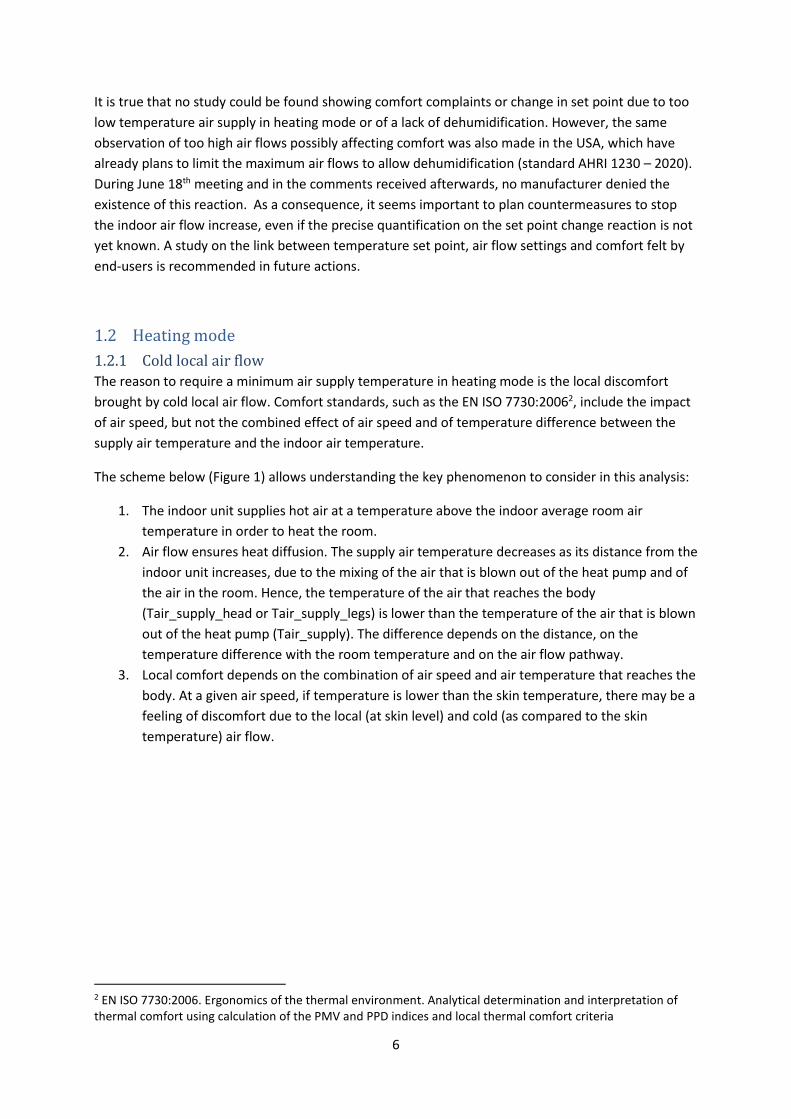
The scheme below (Figure 1) allows understanding the key phenomenon to consider in this analysis:
1. The indoor unit supplies hot air at a temperature above the indoor average room air
temperature in order to heat the room.
2. Air flow ensures heat diffusion. The supply air temperature decreases as its distance from the
indoor unit increases, due to the mixing of the air that is blown out of the heat pump and of
the air in the room. Hence, the temperature of the air that reaches the body
(Tair_supply_head or Tair_supply_legs) is lower than the temperature of the air that is blown
out of the heat pump (Tair_supply). The difference depends on the distance, on the
temperature difference with the room temperature and on the air flow pathway.
3. Local comfort depends on the combination of air speed and air temperature that reaches the
body. At a given air speed, if temperature is lower than the skin temperature, there may be a
feeling of discomfort due to the local (at skin level) and cold (as compared to the skin
temperature) air flow.
2 EN ISO 7730:2006. Ergonomics of the thermal environment. Analytical determination and interpretation of thermal comfort using calculation of the PMV and PPD indices and local thermal comfort criteria
7
Figure 1: Thermal comfort in heating mode, illustrative scheme
1.2.2 Comments received and positions of the stakeholders
All stakeholders propose the same type of solution, which consists of requiring a minimum supply air
temperature at the outlet of the indoor unit. To achieve this, stakeholders prefer a maximum air flow
rate per kW (heating capacity of the unit alone at – 7°C and bivalent point) because a minimum
supply air temperature would be more difficult to check experimentally. They propose maximum air
flow rates by comparing the corresponding supply air temperature at the outlet of the indoor unit
with the skin temperature, either of the whole body or of exposed parts (head, neck, hands) for
winter clothing (Table 1).
Table 1. Average skin temperature by body parts under various environmental conditions (Extraction and adaptation from
Tamura et al., 1980)3
3 Teruko Tamura: A note on Estimating of Whole and Regional Mean Skin Temperature by Using Thermography, Journal of Home economics of Japan Vol.31 Issue 6 page 461-463, 1980. URL: https://www.jstage.jst.go.jp/article/jhej1951/31/6/31_6_461/_pdf/-char/en (in Japanese only)
Comfort Disturbed by Local Airflows in Winter, Journal of Asian Architecture and Building Engineering, 3:1, 55-62, DOI: 10.3130/jaabe.3.55
10
Figure 2. Percentage of people dissatisfied by thermal environment when body parts are exposed to an air flow of 0.5 m/s with different temperatures; average of two sequences, one with increasing temperature and one with decreasing temperature. Ambient temperature is 23 °C. Temperature difference the difference between air flow temperature and ambient. Source: Hudu et al. (2004).
Still, the results of Hudu et al. (2004) indicate that indeed the temperature of cold local air flow does
impact comfort. However, the impact on comfort at neck level only becomes significant when
temperature is 5 to 10 °C below the room temperature (the room temperature in Figure 2 is 23 °C).
The impact at ankle level is however more important. A comfortable situation would correspond to
less than 15 % of dissatisfied people, which would be reached for an air flow temperature of at least
25 to 26 °C for a 23 °C ambient (according to Figure 2). Although ankles are likely to be covered with
winter clothing, hands are not. Judging from the skin temperature variations with indoor air
temperatures in Table 1, the temperature of the hands is likely to be lower than 24 °C for a 20 °C
indoor temperature (from table 1, direct extrapolation at 20 °C ambient gives hand temperature of
21 °C and toe temperature –as proxy to ankle - about 23 °C).
Hence, both scenarios A and B could ensure sufficiently comfortable conditions.
It is important to notice several limitations to these considerations whichever scenario is kept:
• Comfort might be different in Europe as compared to Japan.
• The temperature decay between the indoor unit and the person is not fully considered, and
is highly variable depending on the type of unit, its installation position, the size and type of
room, the position of the person in the room.
• There are different strategies regarding the direction of air blowing into the room; some
units are equipped with systems which may allow not to direct the flow directly to the
person in the room (by combining sensor and image treatment). It could be a basis for
possible innovations on that matter which could allow in the future to have lower air
temperature supply (and thus higher efficiency); however, presently these systems appear
not to be linked to air flow (air speed) but only to air direction. In any case, this means that
even if a maximum air flow per kW is imposed for the present revision, its limit value should
be subject to review and checked for the need to maintain, increase or decrease this value
depending on the innovations in this field and on comfort information.
11
• The link between local discomfort in heating mode and temperature set point change has not
been quantified. For air-to-air heat pumps in Europe, surveys on set point used in heating
mode and on local discomfort brought by varied flow temperatures would be useful to allow
the determination of an optimal setting of the minimum supply air temperature
requirement.
1.3 Cooling mode
1.3.1 Link between humidity and comfort
Humidity is one of the factors affecting comfort. EN 16798-1 standard6 indicates 3 classes regarding
upper relative humidity thresholds for buildings equipped with dehumidification systems (class I: <
50 %, class II: < 60 %, class III: < 70 %). The impact of relative humidity on comfort is relatively low;
according to Figure 3, moving from the relative humidity line of 30 % (RH=30%) and 27 °C to 70 % and
27 °C would not change dramatically the comfort perception (the PPD – predicted % of people
dissatisfied – would remain between 5 % and 7 % for upper humidity boundary of 70 %).
However, a supplementary recommendation in EN16798-1 is that the absolute humidity should
remain below 0.012 kg vapour / kg dry air. This leads to stronger dehumidification needs than
requiring 70 % RH at 27 °C, as shown in Figure 4, as this would correspond to dehumidification needs
starting at 0.0158 kg vapour / kg dry air.
6 EN 16798-1:2019 - Energy performance of buildings - Ventilation for buildings - Part 1: indoor environmental input parameters for design and assessment of energy performance of buildings addressing indoor air quality, thermal environment, lighting and acoustics - Module M1
12
Figure 3: Illustration of comfort zone according to EN16798-1:2019 standard, calculation using online software (Tartarini et
al., 2020)7.
Figure 4: Illustration of comfort zone based on Figure 3 and adding the absolute humidity limit and EN14511:2 standardized
indoor condition.
Dehumidification capability of air conditioner is mostly useful in warm European climates. Under the
hypothesis that ventilation is installed and would allow to have the same absolute humidity level
outside and inside the building without dehumidification in summer (meaning that mechanical
ventilation allows to evacuate efficiently the humidity emitted by occupants and their activities),
outdoor absolute humidity can be used as a proxy of the indoor absolute humidity. Conditions of
occurrence of too humid conditions in summer (summer period is approximated here by keeping
only temperatures above 20 °C) are shown in Table 3 for warm, average and cold climates in Europe.
Only in Athens humid conditions represent a significant proportion of the time, where on average
specific humidity levels above 12 g/kg amount to about 12 % (period 1982 – 2006) to 13.5 % (period
1990 – 2014) of the summer conditions.
Table 3. Climate information for Athens, Strasbourg and Helsinki, source ASHRAE8,9
Climate
Humidity occurrence (for T ≥ 20 °C)
RH > 70 % W > 0.012 kg/kg
Athens 5.5 %8 / 6.2 %9 12.0 %8 / 13.5 %9
Strasbourg 2.8 %8 / 2.7 %9 3.7 %8 / 3.7 %9
Helsinki 0.6 %8 / 0.8 %9 0.4 %8 / 0.7 %9
7 Tartarini, F., Schiavon, S., Cheung, T., Hoyt, T., 2020. CBE Thermal Comfort Tool: online tool for thermal comfort calculations and visualizations. SoftwareX 12, 100563. https://doi.org/10.1016/j.softx.2020.100563 8 ASHRAE Weather Data Viewer, V 4.0, 2007. (Weather statistics compiled over 1982 – 2006 measurement time series) 9 ASHRAE Weather Data Viewer, V 6.0, 2017. (Weather statistics compiled over 1990 – 2014 measurement time series)
0.000
0.005
0.010
0.015
0.020
0.025
0.030
0.035
0.040
10 12 14 16 18 20 22 24 26 28 30 32 34 36 38 40
Scp
ecif
ic h
um
idit
y (k
g va
po
ur
/ kg
dry
air
T °C
Saturation
RH=90%
RH=80%
RH=70%
RH=60%
RH=50%
RH=40%
RH=30%
EN14511 indoor
W=0.012
EN16798_max
EN16798_min
13
1.3.2 Comments received and positions of the stakeholders
Formula linking the sensible heat ratio (SHR), the bypass factor and the air flow rate has been
corrected following JRAIA comments as follows:
Original equation in the June 18th document: �̇� =𝑃𝑐.𝑆𝐻𝑅
𝜌∙(h𝑖𝑛𝑑𝑜𝑜𝑟−h𝑑𝑒𝑤𝑝𝑜𝑖𝑛𝑡).(1−𝐵𝐹)
The dew point was kept constant which is only valid for SHR = 0. Modified equation following JRAIA
comment is:
�̇� =𝑃𝑐 . 𝑆𝐻𝑅
𝜌 ∙ (h3 − h2)=
𝑃𝑐𝜌 ∙ (h𝑖𝑛𝑑𝑜𝑜𝑟 − h1). (1 − 𝐵𝐹)
Where:
- h1 is the enthalpy of point 1; this point is defined as being the intersection between the
cooling line and the saturation curve in the psychrometric chart. The lower the SHR, the
lower the temperature and enthalpy of point 1.
- h2 is the enthalpy at the outlet of the coil;
- h3 is the enthalpy of the point with specific humidity of point 1 and temperature of the
indoor air.
- hindoor is the enthalpy of indoor air (dry bulb temperature 27 °C and wet bulb temperature 19
°C).
Figure 5, extracted from JRAIA comments, illustrates the impact of the SHR and of the bypass factor.
All stakeholders prefer to have a constraint on the air flow rate rather than on the SHR. SHR has the
advantage to be already measured. However, as the coils do not dehumidify in C and D test
conditions, it would be impossible to apply a SHR requirement for these test points, only an air flow
rate requirement can be applied.
Figure 4: Illustration of the impact of SHR and bypass factor and link with temperature at point 1, source JRAIA comments to
June 18th technical document
14
All stakeholders emphasised the need to account for different possible bypass factors in the analysis.
In the June 18th document, the bypass factor was fixed to 0.1, a rather efficient coil, while in the
review study, for the base case the bypass factor was fixed to 0.24. Stakeholders argued that 0.24 is
the bypass factor of a standard unit, which should be used for the calculations.
Due to the formula modification and the different bypass factors, the air flow rates have been
recomputed in Table 4. The impact of this correction increases as the SHR decreases.
A first proposal is to use a minimum air flow rate of 247 m3/h/kW, which ensures that for 27 °C dry
bulb (db) and 19 °C wet bulb (wb) temperature (standard indoor conditions), all air conditioners will
dehumidify (Table 4, BF=0 and SHR = 0).
A second proposal builds on the first one and argues that in the condition 27(db)/19(wb),
dehumidification is not necessary. Indeed, according to Section 1.3.1, dehumidification only needs to
start at 27 °C for a specific humidity of 0.012 kg vapour / kg dry air. This corresponds to a relative
humidity of 53.5 %. For the base case bypass factor of 0.24, the air flow was computed with formula
of Annex A. In order to have a SHR of 0.7 at 27(db)/21(wb) condition (21 wet bulb results from the 59
% hypothesis but it would rather be 20.1 with 53.5 %), it is necessary to allow an air flow rate up to
317 m3/h/kW. Such an air flow rate would be equivalent to what was presented in Annex A, i.e.
0.975 SHR in standard condition 27(db)/19(wb). This proposal was recalculated according to the new
formula and bypass factor to an air flow rate of 312 m3/h/kW.
A third proposal is to use a SHR of 0.95 for a standard unit with bypass factor 0.24 in conditions
27(db)/19(wb). This leads to 293 m3/h/kW and is recalculated according to the new formula to an air
flow rate of 300 m3/h/kW.
Table 4. Revised air flow calculation including different bypass factors
Revised air flow estimates and sensitivity to bypass factor (BF) Test condition: A / 35 °C / 27(19) / 100 %
Stakeholders’ proposals lead to limit the air flow to three different scenarios, either at 247 m3/h/kW,
300 m3/h/kW or 312 m3/h/kW. As most stakeholders propose to have the same air flow rate
constraints in both cooling and heating mode, only the two scenarios 247 and 300, closest to the two
proposals in heating mode (247 and 296 m3/h/kW), are kept.
As mentioned above in the second proposal, there is indeed no dehumidification need in
27(db)/19(wb) conditions. Dehumidification needs start when specific humidity reaches 0.012 kg
vapour / kg dry air, which corresponds to a condition 27(db)/20.1(wb).
15
According to stakeholders, the majority of products have bypass factors between 0.2 and 0.3, which
corresponds well to the base case of the review study. But there are also units on the market with
lower bypass factors, down to 0.08. So different bypass factors need to be considered from 0.1 to
0.3.
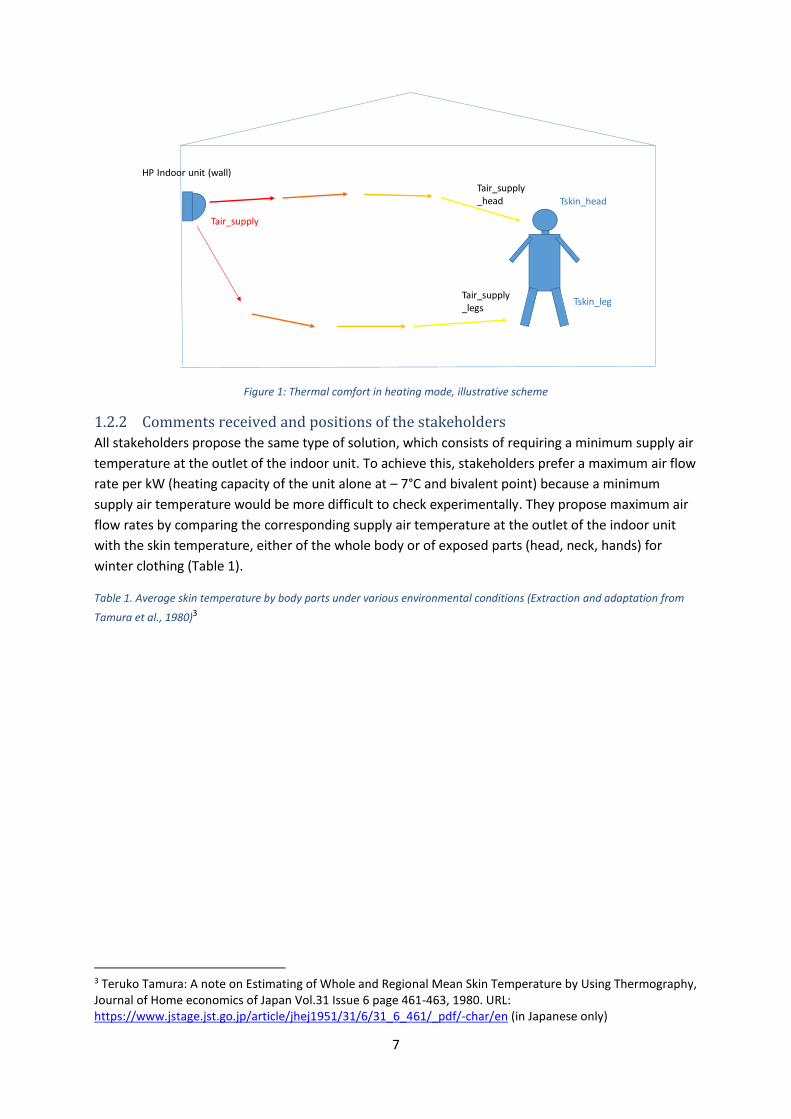
Figure 5 below shows the SHR for the two conditions 27(db)/19(wb) and 27(db)/20.1(wb) for the two
proposed maximum flow rates and varying bypass factors.
Figure 5: SHR obtained for different bypass factors, with 247 m3/h/kW constraint and 300 m3/h/kW constraint, for indoor
condition 27(db)/19(wb) (left) and 27(db)/20.1(wb) (right)
The condition 247m3/h/kW allows all coils to dehumidify in both temperature regimes. The
condition 300 m3/h/kW allows all coils to dehumidify only in the condition 27/20.1, when
dehumidification needs are starting.
1.4 Criteria to choose a scenario
1.4.1 Possible scenarios
Two possible scenarios are kept, based on upon analysis and accepting the principle proposed by
most stakeholders to have symmetrical air flow constraints:
- Scenario A: 247 m3/h/kW, which corresponds to a minimum 32 °C air supply in heating
mode at bivalent point -7 °C and dehumidification for all coils ensured when absolute
humidity is higher than humidity in standard conditions 27 °C (db) / 19 (wb);
- Scenario B: 300 m3/h/kW, which corresponds to 29.9 °C air supply in heating mode at
bivalent point -7 °C (296 m3/h/kW corresponds to 30 °C, but this value was equalized to 300
m3/h to match the proposed cooling mode scenario), and dehumidification for all coils
ensured when absolute humidity is higher than humidity in conditions 27 °C (db) / 20.1 °C
(wb), where dehumidification needs start.
1.4.2 How do these values compare to existing requirements abroad?
At the moment, only the USA have adopted maximum air flow requirements.
For multi-split and VRF units whose cooling capacity is higher than 19 kW, there is already an existing
maximum air flow per kW ratio in standard rating conditions of about 320 m3/h/kW10. As explained in
Annex A, the USA are planning for stricter requirements expressed in terms of maximum SHR values
10 AHRI standard 1230 2014 – With addendum 1. The exact constraint is 55 SCFM per 1000 Btu.h-1; the constraint applies to each indoor unit, with its own air flow and capacity in standard rating conditions; the maximum air flow obtained in cooling mode also applies in heating mode.
0.6
0.65
0.7
0.75
0.8
0.85
0.9
0.95
1
0 0.1 0.2 0.3 0.4
SHR
Bypass factor
"AF=247 m3/h/kW"
"AF=300 m3/h/kW"Condition 27/19
0.6
0.65
0.7
0.75
0.8
0.85
0.9
0.95
1
0 0.1 0.2 0.3 0.4
SHR
Bypass factor
"AF=247 m3/h/kW"
"AF=300 m3/h/kW"
Condition 27/20.1
16
in standard rating conditions (SHR ≥ 82 %) and at 75 % load (SHR ≥ 85 %). These stricter values have
been determined by averaging simulation results of tertiary building sensible and latent demand
across the different USA climates and economic sectors.
With corrections to calculations made in part 1.3.2, it is estimated that the standard rating condition
constraint would correspond to a ratio of 230 m3/h/kW for a bypass factor of 0.24 (base case value).
Hence, scenario A proposed here is close to the stricter requirement (although a bit less strict), while
scenario B is close (although a bit more demanding) to the present AHRI 1230 requirement.
In the USA, there is no air flow maximum requirement for air conditioners with cooling capacity
lower than 19 kW.
1.4.3 Impact on MEPS / labels
The life cycle cost analysis in the Review study based on two distinct base cases of 3.5 and 7.1 kW.
In the review study, different MEPS levels are proposed per product size, the 3.5 kW unit
representing the 0 – 6 kW product range, and the 7.1 kW the 6 – 12 kW product range. In each case,
part of the improvement potential was built on increasing the indoor heat exchanger surface and
indoor air flow.
Setting a maximum air flow requirement may limit the improvement potential and thus may lower
SEER and SCOP at best not available technology (BNAT) level. This occurs if the indoor air flow at
BNAT level is above the threshold. In that situation, BNAT level cannot be reached and the labelling
scale proposed in the Review study, whose A label threshold is the BNAT level of the 3.5 kW product,
would need to be adapted.
In case the indoor air flow is above the threshold at least life cycle cost (LLCC) level, the air flow
limitation requirement would also imply that MEPS level proposed, which are based on LLCC level,
should be recalculated.
It is thus necessary to compare the air flow ratios at LLCC and BNAT levels with the proposed
requirements of A and B scenarios in order to establish the need to adapt the MEPS and labelling
scale.
As regards the 3.5 kW base case from the Review study:
• Its cooling capacity is 3.5 kW in cooling mode and 2.74 kW in heating mode and the air flow
rate is 600 m3/h in both cooling and heating modes. This corresponds to an air flow rate per
kW of 171 m3/h/kW in cooling mode and 219 m3/h/kW in heating mode.
• At LLCC level, the indoor air flow and cooling and heating capacities are the same as for the
base case. Hence at LLCC level, the base case air flow in cooling and in heating mode is lower
than both A and B proposed thresholds. There is no need to revise the MEPS levels.
• The maximum air flow for this product at BNAT level is 180 % of the air flow of the base case,
which leads to an air flow rate of 309 m3/h/kW in cooling mode and of 350 m3/h/kW in
heating mode. Hence at BNAT level, the base case air flow in cooling and heating mode is
higher than both A and B proposed thresholds. For both A and B scenarios, BNAT levels
should be decreased because of air flow restrictions.
17
As regards the 7.1 kW base case from the Review study:
• Its capacity is 7.1 kW in cooling mode and 5 kW in heating mode and the air flow rate is 1200
m3/h in both heating and cooling mode. This corresponds to an air flow rate per kW of 169
m3/h/kW in cooling mode and 240 m3/h/kW in heating mode.
• At LLCC level, the indoor air flow and cooling and heating capacities are the same as for the
base case. Hence at LLCC level, the base case air flow in cooling and heating mode is lower
than both A and B proposed thresholds. There is no need to revise the MEPS levels.
• The maximum air flow for this product at BNAT level is 160 % of the air flow of the base
case, which leads to an air flow rate of 270 m3/h/kW in cooling mode and 384 m3/h/kW in
heating mode. Hence at BNAT level in cooling mode, the base case air flow is higher than
scenario A proposed threshold. In heating mode, BNAT levels should be decreased because
of air flow restrictions for both A and B scenarios.
It is mentioned by a stakeholder that for an air flow constraint corresponding to scenario A, it would
be necessary to lower the MEPS because low capacity units (2.0, 2.5 kW in cooling mode) have today
larger air flow per kW than 3.5 kW units. This stakeholder’s proposal is for less than 6 kW units and
would be to decrease the SCOP MEPS from 4 to 3.9 in heating mode and the SEER MEPS from 6 to
5.1 in cooling mode. However, in scenario B, this stakeholder considers that the MEPS can remain
unchanged.
For scenario A, MEPS might need to be revised for low capacity units; energy label proposed scale
needs to be revised.
For scenario B, MEPS may remain unchanged and only the energy label needs to be revised.
1.4.4 Air flow measurement
Currently, in the EN 14825, there are two test methods, i.e. the enthalpy method and the calorimeter
method. When using the enthalpy method, air flow is measured in all conditions as it is used to
determine heating and cooling capacities. However, when using the calorimeter method (which is
the dominant method being used), indoor air flow is measured separately with the cooling and
heating functions off. It is not feasible to make the air flow measurement while doing the energy
performance tests as the air flow measurement equipment cannot be put inside the calorimeter
room.
For both scenarios A and B, it is necessary to make sure that the same air flow is used for all tests in
cooling mode, and for all tests in heating mode.
Stakeholders ask to ensure that the air flow measurement is feasible before enforcing thermal
comfort requirements.
The following proposal for air flow measurement in the calorimeter room has been formulated:
- Measure air flow of indoor unit and frequency of indoor fan motor in standard rating
conditions in cooling mode and at bivalent point in heating mode.
- Measure only motor frequency (rotations per second in Hz) for performance points to ensure
the same frequency is used in all tests. Frequency here is a proxy for air flow; at equal
frequency, there could be slight variations of air flow which still need to be evaluated.
18
In any case, this will require to adapt the EN14825 standard, and possibly the EN14511-3 standard.
This should thus be included in the next mandate for revision of Regulation (EU) 206/2012 and (EU)
626/2011.
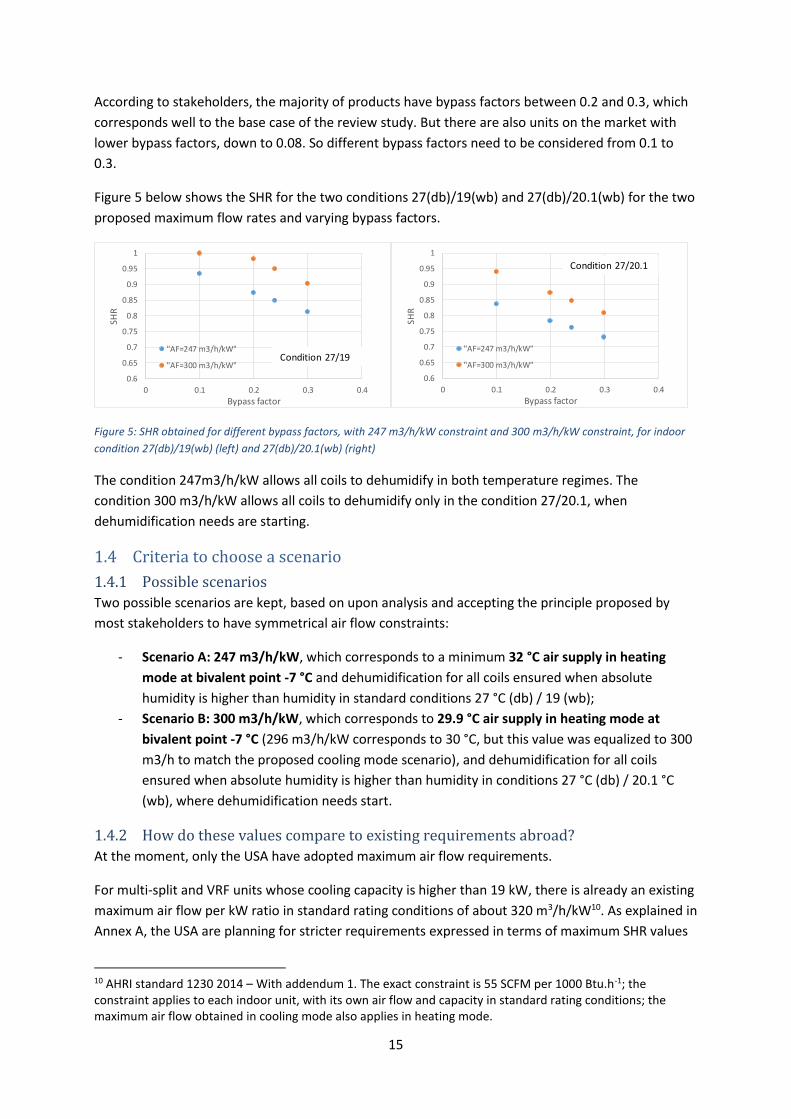
1.4.5 Additional impact of air flow restriction on the market
Figure 6 below, extracted from a stakeholder’s comments, shows the potential impact of choosing a
specific scenario on the existing market. Scenario A (247/m3/h/kW, 32 °C air blowing in heating
mode) implies the redesign of about half of the units on the market. Scenario B (300/m3/h/kW, 32
°C air blowing in heating mode) implies the redesign of about 35 % of the units with a capacity of less
than 6 kW and 15 % of the units with a capacity of more than 6 kW.
It can be noted however that the percentage of units that have to be redesigned was not used by
manufacturers to argue on the intensity of the air flow restriction, it was used to argue for sufficient
time to ensure that the products can be redesigned.
Figure 6: Estimate air supply temperature in heating mode by number of models, source stakeholder’s comments
1.4.6 Bivalent point
All stakeholders note the necessity, in association with air flow restrictions, to fix the bivalent point
at a temperature of -7 °C or lower, because the capacity at this bivalent point is used to calculate the
air flow to capacity ratio in heating mode. This is the simplest solution as it allows to make sure that
at -7 °C, only the heat pump is working and the constraint on air flow can directly be applied.
In case the bivalent point would not be fixed at – 7 °C or lower, but allowed to be declared between
– 7 °C and + 2 °C for the average climate (as is presently the case in Regulation (EU) 206/2012), it
would be necessary to adapt the constraint to the bivalent point chosen by the manufacturer. The
• AFR is the air flow ratio between indoor unit air flow and heating capacity at a given
temperature, the threshold (AFRmax) being fixed for a bivalent temperature of – 7 °C.
19
• Tbiv is the bivalent temperature in °C, in that case higher than – 7 °C.
However, as shown in the Review study, most units are already using a bivalent point at – 7 °C or
lower; it also appears that manufacturer associations agree to fix the bivalent point at -7 °C or lower
(comments received following June 18th 2020 meeting on testing methods); this would also give
more clarity to heating capacity declarations at low temperature and thus better indication for
product installation.
It is proposed to fix the bivalent point at -7 °C or lower for the average climate.
1.4.7 Multi-split
For multi-split air conditioners, information requirement in regulation (EU) 206/2012 and the energy
label in regulation (EU) 626/2011 are only required for a capacity ratio of 1 (“‘capacity ratio’ means
the ratio of the total declared cooling or heating capacity of all operating indoor units to the declared
cooling or heating capacity of the outdoor unit at standard rating conditions”). However, MEPS in
regulation (EU) 206/2012 apply to all combinations.
In general, as regards to thermal comfort requirements, all stakeholders mention a specific
adaptation is required for multi-split air conditioners and heat pumps and some suggest that the
constraint applies for multi-split with a capacity ratio of 1. The same constraints in cooling and in
heating mode can then be applied as for other air conditioners. However, there is no reason to limit
the thermal comfort requirement only to multi-split with a capacity ratio of 1.
In case the capacity ratio differs from 1, the maximum air flow should be allowed to be adjusted: a
capacity ratio higher than one could for instance occur in case load diversity allows to undersize the
outdoor unit because thermal loads of the different rooms are not simultaneous. Each indoor unit
should still be allowed to have sufficient air flow for operation, independently of the capacity ratio. In
case the capacity ratio is lower than one, the maximum air flow allowed should be decreased.
It is thus proposed to adopt the following formula:
AFRmaxMS = AFRmax x capacity ratio
Where:
• AFRmax is the maximum air flow ratio (in heating or in cooling mode) in m3/h/kW
• AFRmaxMS is the constraint adapted for a multi-split with a capacity ratio not equal to 1, in
m3/h/kW. To compute AFRmaxMS, the sum of the indoor air flow of all indoor units and the
capacity of the outdoor unit11 are used.
For multi-split, it is proposed to correct the maximum air flow per kW ratio as follows:
AFRmaxMS = AFRmax x capacity ratio
11 The capacity of the outdoor unit is the capacity of the sum of indoor units connected for a capacity ratio of 1; in practice, this is established by manufacturers for a reference set of indoor units.
20
1.4.8 Process application / close control units
In Regulation 206/2012, the air conditioner definition encompasses both comfort and process
applications without distinction. For information technology (IT) application, either the same types of
units or dedicated products for IT with refined specifications as regards temperature and humidity
control may be used. There are also specific types of indoor units (with the appearance of a server
room rack) dedicated to the IT sector. Some manufacturers use the term close control units to
distinguish these units.
For close control and other process units covered by regulation 206/2012 and 626/2011, thermal
comfort is not a preoccupation. Hence, manufacturers ask that these units be exempted of this
supplementary requirement. On the other hand, there is presently no distinction between these
units and comfort air conditioners, and as mentioned above some units may be used for both
applications comfort and process application; it means that the creation of distinct categories might
lead to potential loopholes. In addition, it is not clear if maximum air flow requirements proposed in
scenario A and B are really demanding for these products.
It is proposed to apply comfort requirements to all air conditioners.
1.5 Final proposal and implementation The most justifiable case is for scenario B, corresponding to 30 °C temperature limit in heating mode
and a dehumidification when needed according to the comfort standard in cooling mode. For the
residential sector and the EU climate, scenario A or other more demanding scenario as for future
requirements of VRF and multi-split in the USA (see part 1.4.2) seems unnecessarily demanding.
It is proposed to keep scenario B (300 m3/h/kW), to keep MEPS unchanged and to revise label
thresholds. It is also proposed to include in the Regulation the need to review this limit at the next
revision based on a survey on the thermal comfort perception, air flows and set points.
Stakeholders ask for consultation of revised values for MEPS and labels.
In addition, manufacturers require additional time to adapt their products and also for
standardisation of air flow measurement. They request two to three years in between publication
and application of the regulation, i.e. Tier 1 application in January 2024 or 2025.
It is proposed to ask for a mandate including air flow measurement with a timeline for 2023 and to
start to apply comfort requirements for Tier 1 in January 2024.
21
2 Independent test method with unlocked compressor As mentioned in the June 18th document (Annex A), NGOs and some member states have requested
the Commission to look into the possibilities for introducing an alternative independent method
without locking in the compressor (and outdoor fan) frequency already during this review.
During the June 18th meeting, it appeared that both Sweden and Germany were supporting the compensation method, the dynamic method proposed by Germany being a further possible evolution of the compensation method to be introduced at a later time. Hence, amongst alternative methods, only the compensation method is discussed here. On one side, more information was brought by BAM/UBA regarding both the EN14825 method and the compensation method including the recent developments in the latter one. On the other side, all other contributions were received from individual manufacturers and manufacturer associations, which mainly focused on the compensation method.
2.1 EN14825
Advantages Disadvantages
Established method No independent testing
Robust method Interpolation of the temperature profile needed
Known measurement uncertainties Cycling is modelled (an option exists for compensation cycling test which is not used)
Trusted by manufacturers and test houses
Lowest test time
Data on the market is based on this method, this makes it easier to set requirements
Calculation on the basis of design from another model possible
Both air enthalpy and calorimeter methods can be used
Table 5. Pros and cons of EN14825 standard (June 18th document, see Annex A to this report)
Supplementary cons (BAM/UBA)
- Real life Pdesign can be very different from the Pdesign for which the unit is tested because of the declaration of a backup heater that is not supplied with the unit. In addition, regarding cycling, UBA/BAM observations are that units are cycling at higher part load ratios when using the compensation than according to tests done for the EN14825 method. All in all, UBA/BAM notices deviations between tested capacities and declared capacities following the EN14825 load curves from 50 % (it could be the case in design conditions in heating mode) and up to 256 % (it could be the case if the unit cycles on/off, when the minimum capacity is much higher than the one required by the EN14825 load curve) according to BAM/UBA tests. In heating mode, part of the deviation could be resolved by limiting the choice of the bivalent temperature (see conclusions in part 1.4.5). Regarding cycling, it is not yet proven however that the compensation method leads to results closer to real life operation (see part 2.2).
- Fully automated testing is not possible, this results in higher personnel costs; however, the possible automation of the compensation method seems to be challenging for the industry (see part 2.2).
22
Advantages to be removed (BAM/UBA): - lower test time for EN14825 is not evident as the method cannot be automatized, as
opposed to the compensation method; however, the possible automation of the compensation seems to be challenging for the industry (see part 2.2).
- Calculation based on design from another model is principally also possible for the compensation method. This opinion is not shared by manufacturers however.
2.2 Compensation method
Advantages Disadvantages
Method recognised by standardisers The method for ducted units is still to be developed
Method uses the same test conditions as the EN 14825, results more comparable
The repeatability is not ensured (due to control)
Independent testing The reproducibility is not yet ensured (due to interaction between control and test room)
More representative Time(*) and cost for testing might increase significantly
No pre-setting of the unit Interpolation of the temperature profile needed
Cycling is measured on one point Not a lot of experience with the method
Product sensor bias may be accounted
Not trusted by manufacturers
It is not yet known if air enthalpy measurement method is compatible
(*) depending on the time to reach stabilized operations (which depends on the control of the unit)
Table 6. Pros and cons of the compensation method (June 18th document, see Annex A to this report)
Stakeholder feedback to the advantages
- More representative: this point is not clear for the industry. To prove that the compensation method is more representative of real life operations, it is suggested that the compensation method should be compared with real life measurements in different climates.
- No pre-setting of the unit: BAM/UBA explains pre-setting of the unit is in fact necessary.
- According to BAM, cycling could happen in more than one test point in real life (cycling beginning more commonly at 47 % according to compensation method tests).
- Regarding product sensor bias, BAM suggests that product with temperature sensors having too large offsets might be declared as non-compliant.
Stakeholder feedback to the disadvantages
23
- Applicability to all types of units: BAM/UBA explains the method has been applied to ducted units, but refers to tests performed on single duct products. More generally, it should be checked that indeed the method can be applied to all products in Regulation 206/2012 which are covered by EN14825, which entails the different types of indoor units (Wall was mainly tested, not cassette, floor standing, ceiling suspended nor ducted units and of all sizes in the 0-12 kW range). Manufacturers add that a RRT is ongoing for air-to-air units in cooling mode (according to BAM/UBA, it is planned to be finished at the end of 2020), but that no such programme is planned for the heating mode. However, a RRT in heating mode should start soon with results planned to be available in 2021.
- Repeatability: according to BAM repeatability is ensured with figures available for two test laboratories in cooling mode (“The intra-laboratory deviations for different labs and models are as follows in our tests (from tests before we wrote the BAM test guidelines): Lab1: 0,54% - 3,07%; Lab2: 2,85%. We are convinced that repeatability can be increased further with the test guideline, which will be refined based on the experience from the RRT.”) However, according to manufacturers’ comments, there are still unsolved issues as regards the test procedure itself. Manufacturers explain that for the design condition it is not the unit temperature set point that should be adjusted for the unit to match the load but the heat load supplied to the machine (by changing the set point, the unit capacity is artificially increased and the fact that the unit cannot reach the design load is lost). But then the procedure should be explained and made repeatable (avoiding human decision in the process). They add that the criteria on the moving average wet bulb is not enough to ensure a precise measurement if humidity fluctuates. It is not explained either which water vapour quantity to add to the room to obtain the required wet bulb condition. Finally, the concept of tolerance on the cooling capacity cannot be defined because the unit supplies what is required to face the heat load of the test room: in these conditions capacity could not have been different and so the capacity obtained is not directly comparable to the one measured by the EN14825 standard. Test results on the same unit and test room show a variation of +/- 2 % on the A (100 % load / 35 outdoor /27(19) indoor) test condition in the same laboratory depending on the wet bulb temperature during the test, due to latent load variation. In addition, in heating mode for defrosting cycles, specifications as regards the number of cycles, their duration and the tolerances in dynamic conditions should be given.
- Reproducibility: in addition to possible interactions between the two control systems (of the air conditioner and test room), the impact of the room size and of the fluctuations of the wet bulb temperature make an important difference in the result (tests are reported in Figure 7 for the same unit tested in two different laboratories with both the compensation and EN14511-3 standard; there is an 8 % difference in EER in standard rating conditions between the two test laboratories with the compensation method). In addition, manufacturers consider it difficult to analyse the impact of the size of the test room and equipment’s control logic through BAM RRT, and that consequently additional analysis will most likely be necessary.
- Time and cost for testing: BAM explains that the procedure can be automatized and that consequently the time for testing could be lowered but this view is not shared by manufacturers.
- Possible adaptation of test room size: BAM will give room size recommendations per unit size as a result of its RRT. However, one manufacturer fears that if different room sizes are required, there might not be enough test rooms in the coming years to make all required
24
tests. In addition, this could also have a significant impact on the testing costs for Member States.
- Circumvention: several stakeholders notice that there is no procedure to prevent the circumvention in BAM test guidelines nor any such proposal for the compensation method.
Figure 7: Test results for the same unit tested in two different laboratories according both to EN14825 and the
compensation method (RAC4 and RAC2 results), source: comments received from the industry
2.3 Is it possible to introduce the compensation method?
June 18th document For regulatory purposes, any alternative method needs to be reliable, accurate and reproducible and take into account the generally recognised state-of-the-art. In addition to that, any alternative method should not increase the cost and test time significantly. Based on the above evaluation, it seems that none of the alternative methods is ready for regulatory purposes today. Stakeholders have shown interest in continuing the development of a method that can fulfil the above requirements. A round robin test has already started for the dynamic testing method and the compensation method.
The review of the different criteria - reliability, accuracy, reproducibility, cost and test time - required to accept a new testing method has been presented above. For none of these criteria all stakeholders can agree that it is reached. In particular, there are still fundamental comments on the test method itself, which means its adoption by CEN might not be presently possible. As regards accuracy, the method should be as much representative of real life performances as possible. However, it is in fact not proven that the test procedure proposed for the compensation method is indeed closer to real life performances than the EN14825 method.
25
Thus, the conclusion is not different after the technical meeting and after receiving the comments. It is not possible to implement the compensation method right now.
The compensation method is not yet fit for regulatory application.
2.4 When could we start applying the compensation method in regulations?
June 18th document The remaining review process will take about 1,5 - 2 years’ time, this means an estimated publication and entry into force by mid-2022.
• A standardisation request takes about 1 year to develop
• A standard takes about 20 months to develop
• 1 to 1,5 year will be needed to test the units according to the new test standard This means that a newly standardised testing method can be ready to apply for regulatory purposes at the earliest in about 4-5 years, i.e. 2024-2025.
According to BAM/UBA, the test method could be standardized in one year based on the fact that
guidelines are already available and that consequently standardization process can be faster.
However, all industry comments state it is not ready and cannot be implemented before the next
review, and after all criteria above are fulfilled (paragraph 2.3). Indeed, in the present situation it is
not possible to answer to any of these criteria.
However, it seems important to sustain the efforts in the direction of the compensation method, as it
could ultimately give an efficiency indication closer to real life performances by the inclusion of the
control impact in the SEER and SCOP values. It is thus proposed to ask for an early review clause, of 3
years instead of the standard 5 years, which will allow to evaluate the compensation method when
enough material has been gathered.
The conclusion is that the compensation method cannot be applied before next revision, and that
it is proposed to require an early review 3 years after the publication of the revised regulation.
2.5 Alternatives proposed by manufacturers
As an alternative to the adoption of the compensation method, or not to wait it is ready to be used in
the regulation, several manufacturers proposed to use two methods. The first method intends to
make sure that the test can be conducted independently from the manufacturer. The second test
method is to ensure that the unit uses operating conditions during the test that are set within their
normal operating range for field operation by using a control verification procedure. These two
methods are described and discussed hereafter.
2.5.1 Request of technical information allowing independent testing
26
In order to allow the independent testing of air conditioners, supplementary information is required
from manufacturers on the setting of the unit and on operating frequencies.
Operating frequencies
For each test condition, the supplementary information corresponds to the settings of the motor
voltage frequency for the outdoor fan, for the compressor and for the indoor fan. This
supplementary information can be added as information requirement. The corresponding
frequencies should be measured during tests used to establish SEER/SCOP metrics. Tolerances should
be defined. Measurement periods to be used to check the declared values need to be specified. In
both cases, this requires standardisation works, which however, is thought to be compatible with tier
1 requirements.
Information on unit setting
This information is seen as sensitive by manufacturers because the normal functioning of the unit is
altered, by overriding some of the control parameters, to allow stable operations. The misuse of this
information, including by end-users, may compromise the functionality of the unit. It then cannot be
published in product documentation.
In Regulation (EU) 206/2012, the information requirement is formulated as follows (Annex I.3
paragraph (b)): “The manufacturer of air conditioners and comfort fans shall provide laboratories
performing market surveillance checks, upon request, the necessary information on the setting of the
unit as applied for the establishment of declared capacities, SEER/EER, SCOP/COP values and service
values and provide contact information for obtaining such information.”
Manufacturers have proposed to include this information in a restricted area of the EPREL database,
which would be accessible only to authorized bodies, including market surveillance authorities.
However, and although it is necessary to make the information accessible to market surveillance
authorities, there is no reason to make this information accessible only to market surveillance
authorities. Any test laboratory should be allowed to check the performances of the units, including
test laboratories mandated by NGOs or other manufacturers. In these conditions, the coupling with
the EPREL database does not seem necessary. Information can be made available through
manufacturers’ websites.
To make the requirement enforceable however, the maximum time period to answer to the request
should be specified. The only point to be checked is the purpose of the test, which can be made
through a declaration by the solicitor. This declaration would allow to protect the manufacturer in
case of misuse of this information. It means the delivery could be immediate after registration.
There is no specific delay foreseen for this requirement.
27
2.5.2 Control verification procedure
Manufacturers also proposed to conduct test(s) in addition to performance tests required to
establish SEER/SCOP metrics, following a “control verification procedure”; the objective is to confirm
that the test settings used by manufacturers in performance tests are within the normal operating
range of the product.
This type of test was introduced in Japan for commercial air conditioners Test standard (JIS B
8616:2015). It is planned to be introduced in the next revision of ASHRAE 1230 in the USA for VRF air
conditioner with a cooling capacity above 19 kW. The ASHRAE standard uses a similar test procedure
as the Japanese standard, but the conformity criterion is formulated differently.
This type of procedure help reducing the apparent differences in performance at low loads between
tests in stabilized conditions and with the compensation method; these differences are an important
contribution of the performance discrepancies with these two test methods12.
The test procedure is illustrated in Figure 8 in the cooling mode. A specific set of indoor and outdoor
conditions is established for a specific part load test with corresponding outdoor and indoor
temperature and humidity conditions. After the preconditioning of the room, the unit is started and
this phases goes on until stabilized conditions are reached. The temperature in the room is then
decreased using a predefined temperature slope in °C/h (and tolerances around the set values). The
unit stops when it reaches its thermostat off level.
Figure 8: Test for control verification procedure, adapted from JIS B 8616:2015 test standard
In the Japanese test standard, the declared frequency of operation of the compressor for the
stabilized test in the same operating conditions is validated if, during this control verification test, the
12 Palkowski, C.; Zottl, A.; Malenkovic, I.; Simo, A. Fixing Efficiency Values by Unfixing Compressor Speed:
Dynamic Test Method for Heat Pumps. Energies 2019, 12, 1045. https://doi.org/10.3390/en12061045
28
unit operates for at least 30 s at the declared frequency before the unit stops (thermostat off
temperature is reached).
In the ASHRAE 1230 draft standard, the validation criterion differs. A one-hour time period before
thermostat off temperature is used. Over this period, a statistical indicator is calculated which
represents the average deviation between measured parameters in the test and the parameter
values indicated for the stabilized test for the same test condition. These parameters are the ones
that the manufacturer declares as being overridden during the steady-state tests. These can relate to
compressor(s) speed(s), outdoor fan(s) speed(s) and outdoor unit(s) variable valve position(s). A
different weighting coefficient is applied for each category of parameters. The weighted average
index obtained should be lower than a certain threshold.
In both test standards, the slope temperature variation is a manufacturer declaration (as it depends
on the control parameters of each unit), with lower and higher bounds. The range authorized is
similar in both standard, between -0.2 °C/h and – 2 °C/h.
Although the criteria for defining compliance can be adjusted more precisely in the case of the
ASHRAE 1230 draft standard, it also requires more parameters to be declared, and more means to
measure these parameters. This type of criterion may be necessary for complex units as VRF with
many possible combinations of compressor frequencies, outdoor fan frequencies and variable
position valves. However, for more simple units as air conditioners below 12 kW, it appears relatively
complex. Some of the measurement required (e.g. valve positioning) cannot be measured without
the use of a service equipment or software provided by the manufacturer to installers and/or
maintenance staff. This type of tool is not commonly used for less than 12 kW units, and so its use
could delay the possibility to enact a control verification procedure. At least in a first step, it seems
reasonable to adopt the procedure in standard JIS B 8616:2015.
In the JIS standard, each test corresponds to 8 hours (with in some cases up to 14 hours if
thermostat-off is not reached within 6 hours). It is not possible to add too many tests without
increasing significantly the test burden. The main objective being to check the low load points, 2 test
could be proposed, one in cooling mode and one in heating mode at temperatures corresponding to
low load points (20 °C outdoor temperature in cooling mode and 12 °C outdoor temperature in
heating mode).
As the JIS B 8616:2015 standard is available, the incorporation of the control verification procedure
in the EN14825 standard could be ready for the first tier.
2.5.3 Conclusion on alternatives proposed by manufacturers
While waiting for the compensation method to be ready for regulatory purpose, the alternatives
proposed by manufacturers could help in increasing the confidence in the measured SEER and SCOP
values. Because of their relative simplicity it appears feasible to adopt those additional measures
with no delay.
29
The control verification procedure proposed by manufacturers could ensure that the units are able to
reach the part load levels declared for standard assessment of SEER and SCOP in real life. Part of the
benefits of the compensation method could be reached.
It is proposed to require additional technical information allowing independent testing, to require
manufacturers to make available the necessary information on the setting of the unit to any test
lab without delay after registration, and to enforce a “control verification procedure” for the
lowest load point in cooling and in heating mode. The test method to verify declared additional
technical information and the “control verification procedure” would be added in the CEN
mandate and both could be used starting from tier 1 in January 2024.
30
Annex A: Discussion paper of June 18th (Version of June 19th, as
sent after the meeting) Discussion paper: Alternative methods for the testing and rating of air-to-air air conditioners and air-to-air heat pumps at part load conditions and calculation of seasonal performance of fixed air-to-air air conditioners and air-to-air heat pumps in the scope of Regulations (EU) No 206/2012 and 626/2011 1. Background Regulations (EU) No 206/2012 and 626/2011 rely on harmonized standard EN 14825 for the testing and rating of air-to-air air conditioners and heat pumps. This method is not completely independent, as the manufacturer has to provide the setting of the unit in the different test conditions. It is however, a worldwide practice and a well established method. At the consultation forum meeting of 9 September 2019, many participants voiced their concerns with this approach. These concerns were two-fold: 1) The current test method doesn’t require manufacturers to take into account thermal comfort. 2) The current test method requires manufacturers to give the settings of the unit during test and
locks the compressor13 during test. Members requested to set up a working group meeting to discuss these issues and their solutions in more detail. 2. Thermal comfort
2.1. Discussion in the review study and developments since then The review study, task 3, section 3.1.7, already touched upon this topic and identified that: • In heating mode, the temperature of the air that blows out of the heat pump (supply air
temperature) should not be below 32 °C (temperature of the skin) and probably closer to 40 °C to ensure thermal comfort.
• In cooling mode, units should dehumidify to ensure thermal comfort. In the current test method, it is not mandatory to consider these factors. In reality, when the supply air temperature is too cold air in heating mode, the end-user is likely to increase the indoor set point in heating mode to improve comfort levels. Similarly, when the unit does not dehumidify in cooling mode, the end-user is likely to decrease the indoor set point in cooling mode to improve comfort levels. These actions will lead to increased heating/cooling loads and decreased efficiencies. As a result, the declared energy efficiency values are potentially exaggerated.
The review study proposed to solve this issue by declaring the values for the supply air temperature in heating and cooling mode and the humidity in cooling mode in the technical documentation and to set requirements during the review based on these data.
13 In real life operation, the control of the unit regulates the compressor frequency to match the capacity of the unit to a certain load. In the current test method, this is not the case, the compressor is locked at the frequency declared by the manufacturer.
31
However, according to APPLiA, 45 % of the units (based on 215 tests) on the market today do not dehumidify sufficiently in between ambient temperatures of 30-35 °C in cooling mode during the test. This means that the current policy options are partly based on exaggerated energy efficiency values. As such, without a solution in this review, the remaining manufacturer would be forced to rate their units in the same way to be able to pass the revised energy efficiency requirements.
2.2. Possible solutions
2.2.1. Heating mode Possible solutions could be: a) minimum supply air temperature (Tsupply) supply in heating mode between 32°C and 40°C (to be
discussed), or;
b) limit the indoor air flow rate (�̇�) to ensure that the air blowing temperature is between at least 32°C and 40 °C.
The indoor air flow rate (m³/h) and supply air temperature are related, as follows:
�̇� =𝑃ℎ
𝐶𝑝 ∙ 𝜌 ∙ (Tsupply − Tindoor)
with 𝑃ℎ, the heating capacity in kW; 𝐶𝑝, the specific heat of humid air, equal to 1,012 kJ/kgha K; 𝜌,
the density of humid air equal to 1,199 kgha/m³; Tindoor, the indoor temperature equal to 20 °C.14 In order to support the discussion, 4 scenarios are proposed based on desk research and stakeholder input: - scenario 1: Constant indoor air flow rate, Tsupply equal to 32 °C at an outdoor air temperature equal
to the bivalent temperature (Tbiv); - scenario 2: Constant indoor air flow rate, Tsupply equal to 40 °C at Toutdoor equal to Tbiv; - scenario 3: Variable indoor air flow rate, Tsupply equal to 40 °C at Toutdoor equal to Tbiv and Tsupply equal
to 32 °C at Toutdoor equal to 12°C (rating point D). - scenario 4: Variable indoor air flow rate according to EN14825 water based fan coil conditions with
variable water supply temperature15. The relationship between the supply air temperature and indoor air flow for these scenarios is shown in Table 1 and Figure 116,17. Note:
How to read �̇�/𝑃ℎ variations in table 1? The table gives air flow variations normalised by 𝑃ℎ=𝑃ℎ(𝐴) so
that these values can be used for units of all sizes. Example 1: in scenario 1, supplied air temperature varies and indoor air flow is set constant to nominal value Example 2: in scenario 3, to reach 34 °C supplied air temperature in C test conditions, it is necessary to reduce the A test point air flow rate by 82/148.
14 ha refers to humid air 15 computed using the intermediate conditions in EN14825 for average climate with a fan coil effectiveness of 0.85. 16 for the calculations, the relative humidity of the indoor air was set at 50 % 17 for the calculations, Tbiv was set at -7°C
32
Table 1: relationship between the minimum supply air temperature and minimum indoor air flow
Rating point
Toutdoor (°C)/ Load
ratio (-)
Scenario 1 Scenario 2 Scenario 3 Scenario 4
Tsupply (°C)
�̇�/𝑃ℎ (m3/h/kW)
Tsupply (°C)
�̇�/𝑃ℎ (m3/h/kW)
Tsupply (°C)
�̇�/𝑃ℎ (m3/h/kW)
Tsupply (°C)
�̇�/𝑃ℎ (m3/h/kW)
A (Tbiv) -7 / 88 % 32 247 40 148 40 148 40 152
B 2 / 54 % 27 247 32 148 36 111 34 125
C 7 / 35 % 25 247 28 148 34 82 31 105
D 12 / 15
% 22 247 23 148 32 43
27 76
Figure 1: Supply air temperature as a function of the outdoor air temperature. Scenario 1: green dotted, Scenario 2: blue, dashed (short), Scenario 3: red, dashed (long)
2.2.2. Cooling mode
Possible solutions could be: a) minimum sensible to heat ratio (SHR) for certain conditions in cooling mode between 0,70 and
0,95 (to be discussed), these are the general design values for dehumidification in apartments and houses, or;
b) limit the indoor air flow rate (to be discussed) to ensure that the SHR is in between 0,70 and 0,95 (to be discussed).
The relationship between the SHR and the indoor air flow rate in m3/h/kW18 is as follows:
�̇� =𝑃𝑐 . 𝑆𝐻𝑅
𝜌 ∙ (h𝑖𝑛𝑑𝑜𝑜𝑟 − h𝑑𝑒𝑤𝑝𝑜𝑖𝑛𝑡) . (1 − 𝐵𝐹)
18 for the calculation of the air flow rate, the bypass factor was kept constant and equal 0,1
20
22
24
26
28
30
32
34
36
38
40
-10 -5 0 5 10 15
Tsu
pp
ly °
C
Outdoor air temperature °C
Scenario 1
Scenario 2
Scenario 3
Scenario 4
33
with 𝑃𝑐, the cooling capacity in kW; ℎ𝑖𝑛𝑑𝑜𝑜𝑟, the specific enthalpy of humid air, equal to 53,953 53,392 kJ/kgha K; ℎ𝑑𝑒𝑤_𝑝𝑜𝑖𝑛𝑡, the specific enthalpy of humid air at dew point, equal to 40,933 kJ/kgha K 𝜌,
the density of humid air equal to 1,169 kgha/m³; Tindoor, the indoor temperature equal to 20 °C. Table 2 shows the relationship between the SHR and the indoor air flow rate in m3/h/kW. In order to support the discussion, two scenarios are proposed based on desk research and stakeholder input: - scenario 119 (Table 2, light grey): indoor air flow rate equal to 192 m3/h/kW in all test conditions,
this will ensure that dehumidification occurs in A (SHR 0,7) and B (SHR 0,95) conditions; or, - scenario 220 (Table 2, dark grey): indoor air flow rate equal to 220 m3/h/kW in the A condition and
172 m3/h/kW in the B condition, this will ensure that dehumidification occurs in A (SHR 0,8) and B (SHR 0,85) conditions.
How to read �̇�/𝑃𝑐 variations in table 2? The table give air flow variations normalised by 𝑃𝐶=𝑃𝐶(𝐴) so
that these values can be used for units of all sizes. Example 1: in scenario 1, supplied air temperature and SHR vary and indoor air flow is set constant to nominal value 192 m3/h/kW, kW and air flow are computed on A test condition Example 2: in scenario 2, it is necessary to reduce nominal air flow rate of A test by 172/220 to reach a SHR of 0.85 in B test condition. Table 2: Relationship between the SHR and the indoor air flow rate
SHR 1 0,95 0,9 0,85 0,8 0,75 0,7 0,65 0,6
𝑉/𝑃𝑐̇ (m³/h/kW)
A / 35 °C / 27(19) / 100 % 275 261 247 233 220 206 192 179 165
B / 30 °C / 27(19) / 74 % 202 192 182 172 162 152 142 132 121
C / 25 °C / 27(19) / 47 % 130 124 117 111 104 98 91 85 78
D / 20 °C / 27(19) / 21 % 58 55 52 49 46 43 40 38 35
3. Independent method with unlocked compressor
3.1. Discussion in the review study and developments since then In the review study, task 1, Section 1.2.1.2, already touched upon the topic and identified that:
• The current regulations (according to the EN 14825) requires the manufacturer to supply information on how to fix (or lock-in) the frequency of the compressor (and probably of fans). This practice is applied worldwide, however the performance of units in real life may differ from the performances measured in standard test conditions.
• An alternative method, the compensation method, in which the unit has to maintain the required set point temperature to compensate a given heat load with unlocked compressor (and outdoor fan) and active control, is described in an informative annex of the EN 14825 for water based units but also applicable to air based units. There remains however practical issues to be solved, i.e.: - it has not yet been used for ducted units; - the volume of the calorimeter chamber might need to be adjusted/specified depending on
unit total indoor air flow / capacity; - the repeatability is not ensured;
19 based on a proposal from a stakeholder 20 current requirements in the draft AHRI 1230 standard for VRF systems
34
- it is difficult to stay within the deviation tolerances of the standard; - the time for testing might increase significantly depending on the time to reach stabilized
operations (which depends on the control of the unit). Based on this analysis, the review study concluded that the compensation method is not yet fit for regulatory purposes, but that it is important to continue the development of the compensation method as it could ultimately lead to seasonal figures closer to real life performances. Since the review study, the Bundesanstalt für Materialforschung und prüfung (BAM) has developed test guidelines for dynamic testing of air conditioners and heat pumps. This method was developed as an alternative to the compensation method. In both dynamic and compensation methods, the unit has to maintain the temperatures to compensate a given heating/cooling load with unlocked compressor (and outdoor fan) and active control. The main difference with the compensation method is that in the case of the dynamic method, a continuous dynamic test with 21 time steps of 2.5 hours covering the whole load curve and outdoor air conditions21 is performed. Compensation method can use the same test conditions as in EN14825. In addition, Canada has published and the USA are preparing an energy efficiency legislation based on a testing method similar to the compensation method and the dynamic testing method. As such, NGOs and some member states have requested the Commission to look into the possibilities for introducing an alternative independent method without locking in compressor (and outdoor fan) already during this review.
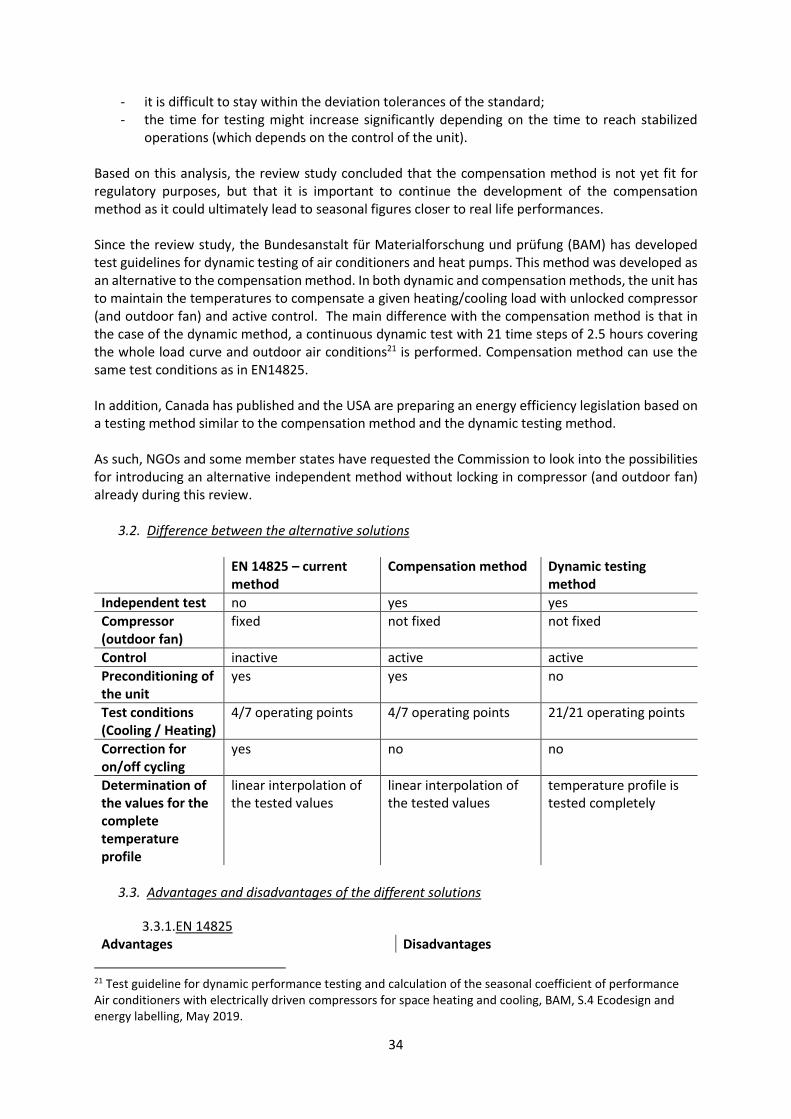
Determination of the values for the complete temperature profile
linear interpolation of the tested values
linear interpolation of the tested values
temperature profile is tested completely
3.3. Advantages and disadvantages of the different solutions
3.3.1. EN 14825 Advantages Disadvantages
21 Test guideline for dynamic performance testing and calculation of the seasonal coefficient of performance Air conditioners with electrically driven compressors for space heating and cooling, BAM, S.4 Ecodesign and energy labelling, May 2019.
35
Established method No independent testing
Robust method Interpolation of the temperature profile needed
Known measurement uncertainties Cycling is modelled (an option exists for compensation cycling test which is not used)
Trusted by manufacturers and test houses
Lowest test time
Data on the market is based on this method, this makes it easier to set requirements
Calculation on the basis of design from another model possible
Both air enthalpy and calorimeter methods can be used
3.3.2. Compensation method
Advantages Disadvantages
Method recognised by standardisers The method for ducted units is still to be developed
Method uses the same test conditions as the EN 14825, results more comparable
The repeatability is not ensured (due to control)
Independent testing The reproducibility is not yet ensured (due to interaction between control and test room)
More representative Higher measurement uncertainties (due to the product sensors) (**)
No pre-setting of the unit Time(*) and cost for testing might increase significantly
Cycling is measured on one point Interpolation of the temperature profile needed
(**) Product sensor bias may be accounted
Not a lot of experience with the method
Not trusted by manufacturers
It is not yet known if air enthalpy measurement method is compatible
(*) depending on the time to reach stabilized operations (which depends on the control of the unit)
No interaction from manufacturers needed New testing method
Shorter test time than the compensation method
Insufficient experience gained (round robin test ongoing)
No interpolation needed, all temperature conditions are tested
Possibly no calculation on the basis of design or extrapolation from another model possible
More representative Not trusted by manufacturers and test houses
No pre-setting of the unit Test is continuous also during the night, which means that if an error occurs the test needs to be restarted
Cycling is measured on several points Not a lot of experience with the method
The method for ducted units is still to be developed
The repeatability is not ensured (due to control)
The reproducibility is not yet ensured (due to interaction between control and test room)
36
It is not yet known if air enthalpy measurement method is compatible
3.4. What is needed to introduce an alternative testing method?
For regulatory purposes, any alternative method needs to be reliable, accurate and reproducible and take into account the generally recognised state-of-the-art. In addition to that, any alternative method should not increase the cost and test time significantly. Based on the above evaluation, it seems that none of the alternative methods is ready for regulatory purposes today. Stakeholders have shown interest in continuing the development of a method that can fulfil the above requirements. A round robin test has already started for the dynamic testing method and the compensation method.
3.5. When could we start applying the alternative method in regulations? The remaining review process will take about 2 years’ time, this means an estimated publication and entry into force by mid-2022.
• A standardisation request takes about 1 year to develop
• A standard takes about 20 months to develop
• 1 to 1,5 year will be needed to test the units according to the new test standard This means that a newly standardised testing method can be ready to apply for regulatory purposes at the earliest in about 4-5 years, i.e. 2024-2025. 4. A possible way forward? Based on the above, a possible way forward could be to continue the review of the regulation and envisage a two-tier approach:
• Tier 1 (1 year after entry into force): improve the thermal comfort and set resource efficiency requirements
• Tier 2 (5 years after entry into force): mandatory application of an independent method that doesn’t fix the compressor and which fulfils the requirements for a method fit for regulatory purposes (see 3.4)


![Dies Irae - Requiem in D Minor K. 626 [K. 626]](https://static.documents.pub/doc/80x56/616e2e726c1eb666d037d848/dies-irae-requiem-in-d-minor-k-626-k-626.jpg)


