96

2
2016Contents
Executive Summary 6
The International Economy 8Global Overview 8United States 8Canada 8The United Kingdom 9The Euro Zone 9Japan 10Emerging and Developing Asia 10Latin America and the Caribbean 10Commonwealth of Independent States 12Sub-Saharan Africa 12
Economic Performance of Caricom States 14Overview 14Barbados 15Jamaica 15Guyana 16ECCU 16
The Real Economy 18Gross Domestic Product 18Petroleum 22
Drilling 22Crude Oil and Condensate 23Natural Gas 24Liquefied Natural Gas (Lng) 25Petrochemicals (Ammonia, Urea and Methanol) 26
Agriculture 27Overview 27Domestic Agriculture 29Export Agriculture 30
Manufacturing 30Overview 30Iron and Steel 31Cement 32
Services 33Overview 33Construction 34Tourism 34
Prices 35Productivity 36Population 37Labour Force and Employment 37
Unemployment 37Labour Force / Job Creation 39
Central Government Operations 40Overview 40Revenue 41Expenditure 42Financing 44Public Debt and Debt Service 44Trinidad and Tobago Credit Ratings 47
Rest of The Non- Financial Public Sector Operations 51
Overview 51Cash Operations 51Current Transfers to State Enterprises and Public Utilities 52Capital Expenditure 52Capital Transfers from Central Government 52

3
The Monetary Sector 54Monetary Conditions 54Central Bank Operations 54
Exchange Rates/Foreign Exchange Market 54Money Supply and Commercial Banks’ Deposits and Credits 55Interest Rates 55Liquidity 57
Financial Sector Performance 57Capital Market Activity 57
Regulatory Developments 60Legislative Developments 60
Trade and Payments 62Balance of Payments 62
Current Account 62Capital Account 62Foreign Reserves 62
Heritage And Stabilisation Fund (HSF) 64Balance of Visible Trade 64
Caricom Trade 65Trade Agreements 65
4
2016List of Figures
List of Tables
Figure 1: Development and Exploratory Drilling 22Figure 2: Natural Gas Production and Utilisation 25Figure 3: Exports of LNG by Destination 26Figure 4: Petrochemical Prices (Ammonia, Urea and Methanol) 27Figure 5: Production, Exports and Local Sales of Iron and Steel 31Figure 6: Cement Production, Export and Local Sales 33Figure 7: Prices – Percentage Change (Year-on-Year) 35Figure 8: Distribution of Unemployed Persons by Age Group 38Figure 9: Central Government Fiscal Operations 41Figure 10: Central Government Revenue 42Figure 11: Central Government Expenditure 44Figure 12: Major Components of Current Expenditure 44Figure 13: Composition of Net Public Sector Debt 45Figure 14: Public Sector Debt and Debt Servicing 46Figure 15: Average Time to Maturity of Debt Stock 2011-2016 47Figure 16: Exchange Rates- Buying Rate (TT$ per US$) 55Figure 17: Repo Rate and Prime Lending Rate 56Figure 18: Commercial Banks’ weighted average deposit and loan spread 56Figure 19: Liquidity Indicators 57Figure 20: Comparative Analysis 59
CONTENTS
Table 1: Macroeconomic Indicators for Selected Economies 13Table 2: Macroeconomic Indicators for Selected CARICOM Economies 17Table 3: Oil and Gas Prices 24Table 4: Operational Status of Farm Sites under the Commercial Large Farms Programme 28Table 5: Trinidad and Tobago Credit Rating History by Moody’s Investors Service: 2007 - 2016 48Table 6: Trinidad and Tobago Credit Rating History by Standard and Poor’s Ratings Services: 2008 - 2016 49Table 7: Trinidad and Tobago Credit Rating History by CariCRIS: 2010 – 2016 50Table 8: Cash Statement of Operations of the Rest of the Non-Financial Public Sector 53Table 9: Commercial Banks and Non-Bank Financial Institutions Foreign Currency Sales and Purchases (US$ Mn.) 54Table 10: Total Registrants 57Table 11: Summary Balance of Payments (US$ million) 63
5
List of Appendices
Appendix 1 Gross Domestic Product of Trinidad and Tobago at Constant (2000) Prices/TT$ Millions/ 67Appendix 2 Gross Domestic Product of Trinidad and Tobago at Constant (2000) Prices/Percentage Change/ 68Appendix 3 Gross Domestic Product of Trinidad and Tobago at Constant (2000) Prices/ Percentage Contribution/ 69Appendix 4 Gross Domestic Product of Trinidad and Tobago at Market Prices (Current Prices)/TT$ Millions/ 70Appendix 5 Gross Domestic Product of Trinidad and Tobago at Market Prices (Current Prices)/ Percentage Change/ 71Appendix 6 Gross Domestic Product of Trinidad and Tobago at Market Prices (Current Prices)/Percentage
Contribution/ 72Appendix 7 Development and Exploratory Drilling and Domestic Crude Production 73Appendix 8 Natural Gas and Liquefied Natural Gas Production and Utilisation 74Appendix 9 Petrochemicals Production and Exports/Tonnes ‘000/ 75Appendix 10 Iron and Steel Production/Tonnes ‘000/ 76Appendix 11 Change in Prices, Productivity and Average Weekly Earnings/Percentage Change/ 77Appendix 12 Population, Labour Force and Employment (Mid-year) 78Appendix 13 Mid-year Estimates of Population by Age 79Appendix 14 Labour Force by Industry and Employment Status (CSSP Estimates)/Hundreds (‘00)/ 80Appendix 15 Exchange Rate for Selected Currencies 81Appendix 16 Money Supply/TT$ Millions/ 82Appendix 17 Commercial Banks’ Liquid Assets/TT$ Millions/ 83Appendix 18 Commercial Banks’ Domestic Credit/TT$ Millions/ 84Appendix 19 Commercial Banks’ Interest Rates 85Appendix 20 Secondary Market Activities 86Appendix 21 Central Government Fiscal Operations/TT$ Millions/ 87Appendix 22 Central Government Revenue/TT$ Millions/ 88Appendix 23 Central Government Expenditure and Net Lending/TT$ Millions/ 89Appendix 24 Central Government Budget Financing/TT$ Millions/ 90Appendix 25 Total Public Debt and Debt Service/TT$ Millions/ 91Appendix 26 Trinidad and Tobago - Net Foreign Reserves/US$ Millions/ 92Appendix 27 Trade with CARICOM Countries/TT$ Millions/ 93Appendix 28 Balance of Visible Trade/TT$ Millions/ 94

6
2016Executive Summary
World economic growth in 2016 is estimated to remain at the 2015 level of 3.1 percent. Most of the regional groupings of the world will contribute to global expansion with the exception of Latin America and the Caribbean region (-0.4 percent) as well as in the Commonwealth of Independent States (-0.6 percent).
Growth performance in Caribbean territories differed widely in 2016, with prolonged decline in commodity prices auguring well for the tourism-based economies, while exacerbating external imbalances and diminishing international reserves on the commodity-based economies of the region.
The Central Statistical Office (CSO), the official source of national statistics in Trinidad and Tobago has revised its estimate for both nominal and real Gross Domestic Product (GDP) downwards for 2014 and 2015; citing changes in commodity prices as the major reason for the revisions. Consequently, growth in 2014 and 2015 was revised from -1.0 percent to -0.6 percent and 0.2 percent to -0.6 percent respectively. For 2016, the CSO estimates that the Trinidad and Tobago economy would contract by a further -2.3 percent. The performance reflects lower real economic activity in both the Petroleum and Non-Petroleum sectors, with estimated contractions of 9.6 percent and 1.8 percent respectively in 2016. Consequently, the Petroleum sector’s share of real GDP is expected to fall from 34.6 percent in 2015 to 32.0 percent in 2016.
The performance in the Non-Petroleum sector is attributed to the spillover effects from the contracting Petroleum sector and a lower fiscal injection into the Non-Petroleum sector by the Central Government.
Real economic activity in the Manufacturing sub-sector, the second largest Non-Petroleum sub-sector, is forecast to decline by 5.7 percent in 2016, as compared to the 1.6 percent expansion registered in 2015. Likewise, a contraction of 6.0 percent is anticipated in the Agriculture sub-sector, weaker than the sub-sector’s 1.2 percent growth attained during 2015.
Headline inflation was contained within the low single digits during the first six months of calendar 2016, holding relatively steady between 3.3 percent and 3.5 percent for most of the period. Starting the year at 2.4 percent, the year-on-year rate of change in the All Items Retail Price Index (RPI) increased to 3.4 percent in February, edged down to 3.3 percent in March before nudging upward to 3.5 percent in April. Headline inflation settled at 3.4 percent over the remaining two months. Overall, inflation rates in Trinidad and Tobago have remained below 5.0 percent since August 2015.
Unemployment moved upward to 3.8 percent in the second quarter of fiscal 2016, up from 3.6 percent the previous year. The number of persons unemployed rose from 22,300 in 2015 to 24,100 in 2016. In most industries, with the exception of Other Mining and Quarrying, Construction, Petroleum and Gas and Wholesale and Retail Trade, Restaurants and Hotels, unemployment rates were recorded below the national average.
The Budget for fiscal 2016 was originally predicated on an average oil price of US$45 per barrel of crude and a natural gas price of US$2.75 per million of British Thermal Units (mmBtu). On this basis, Total Revenue and Grants was estimated at $60,286.4 million, representing 39.0 percent of GDP. Total Expenditure was estimated at $63,048.7 million or 40.8 percent of GDP, the budget deficit was projected to be $2,762.3 million or 1.8 percent of GDP.
As energy prices continued to decline during the year, the Minister of Finance presented the 2016 Mid-Year Budget Review which revised the average oil price to US$35 per barrel of crude and the natural gas price to US$2.50 per mmBtu. The Minister advised that Central Government’s fiscal operations were expected to culminate in an Overall Deficit of $6.7 billion or about 4.0 percent of GDP. Total Revenue and Grants was anticipated to decline from its budgeted estimate to $52,677.2 million or 34.1 percent of GDP. The Government’s intention at the time was to contain total expenditure in 2016 to $59 billion or 38.2 percent of GDP.
7
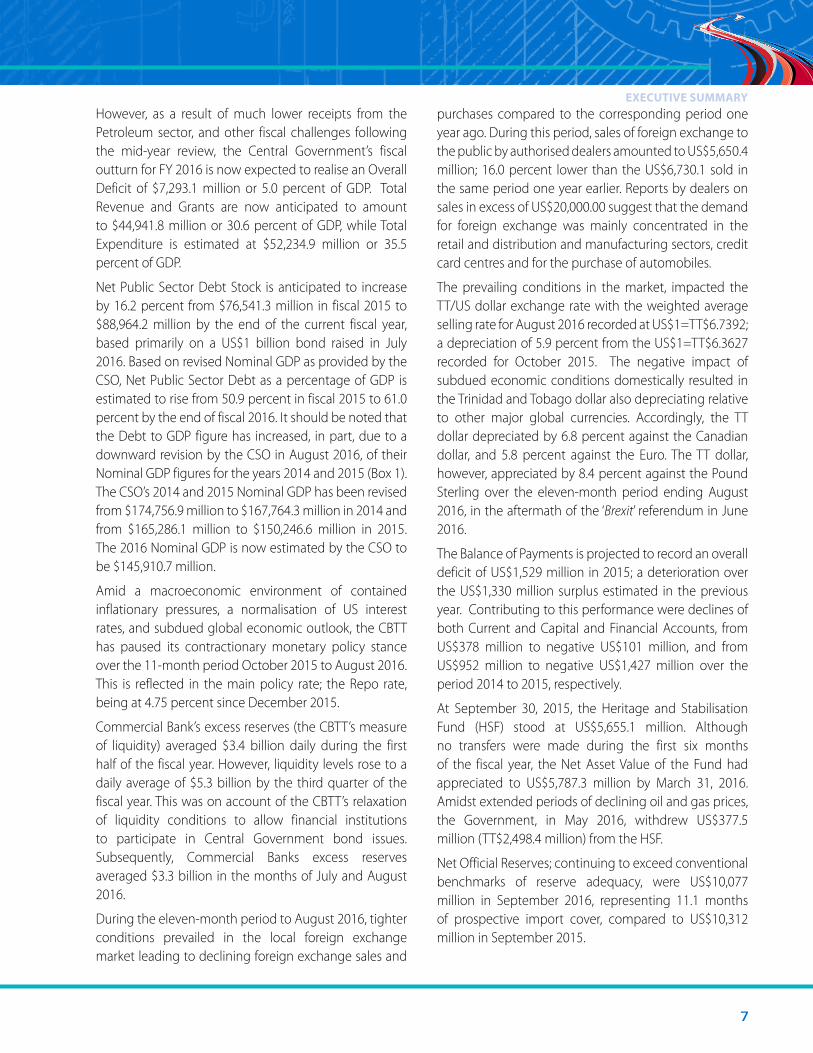
However, as a result of much lower receipts from the Petroleum sector, and other fiscal challenges following the mid-year review, the Central Government’s fiscal outturn for FY 2016 is now expected to realise an Overall Deficit of $7,293.1 million or 5.0 percent of GDP. Total Revenue and Grants are now anticipated to amount to $44,941.8 million or 30.6 percent of GDP, while Total Expenditure is estimated at $52,234.9 million or 35.5 percent of GDP.
Net Public Sector Debt Stock is anticipated to increase by 16.2 percent from $76,541.3 million in fiscal 2015 to $88,964.2 million by the end of the current fiscal year, based primarily on a US$1 billion bond raised in July 2016. Based on revised Nominal GDP as provided by the CSO, Net Public Sector Debt as a percentage of GDP is estimated to rise from 50.9 percent in fiscal 2015 to 61.0 percent by the end of fiscal 2016. It should be noted that the Debt to GDP figure has increased, in part, due to a downward revision by the CSO in August 2016, of their Nominal GDP figures for the years 2014 and 2015 (Box 1). The CSO’s 2014 and 2015 Nominal GDP has been revised from $174,756.9 million to $167,764.3 million in 2014 and from $165,286.1 million to $150,246.6 million in 2015. The 2016 Nominal GDP is now estimated by the CSO to be $145,910.7 million.
Amid a macroeconomic environment of contained inflationary pressures, a normalisation of US interest rates, and subdued global economic outlook, the CBTT has paused its contractionary monetary policy stance over the 11-month period October 2015 to August 2016. This is reflected in the main policy rate; the Repo rate, being at 4.75 percent since December 2015.
Commercial Bank’s excess reserves (the CBTT’s measure of liquidity) averaged $3.4 billion daily during the first half of the fiscal year. However, liquidity levels rose to a daily average of $5.3 billion by the third quarter of the fiscal year. This was on account of the CBTT’s relaxation of liquidity conditions to allow financial institutions to participate in Central Government bond issues. Subsequently, Commercial Banks excess reserves averaged $3.3 billion in the months of July and August 2016.
During the eleven-month period to August 2016, tighter conditions prevailed in the local foreign exchange market leading to declining foreign exchange sales and
purchases compared to the corresponding period one year ago. During this period, sales of foreign exchange to the public by authorised dealers amounted to US$5,650.4 million; 16.0 percent lower than the US$6,730.1 sold in the same period one year earlier. Reports by dealers on sales in excess of US$20,000.00 suggest that the demand for foreign exchange was mainly concentrated in the retail and distribution and manufacturing sectors, credit card centres and for the purchase of automobiles.
The prevailing conditions in the market, impacted the TT/US dollar exchange rate with the weighted average selling rate for August 2016 recorded at US$1=TT$6.7392; a depreciation of 5.9 percent from the US$1=TT$6.3627 recorded for October 2015. The negative impact of subdued economic conditions domestically resulted in the Trinidad and Tobago dollar also depreciating relative to other major global currencies. Accordingly, the TT dollar depreciated by 6.8 percent against the Canadian dollar, and 5.8 percent against the Euro. The TT dollar, however, appreciated by 8.4 percent against the Pound Sterling over the eleven-month period ending August 2016, in the aftermath of the ‘Brexit’ referendum in June 2016.
The Balance of Payments is projected to record an overall deficit of US$1,529 million in 2015; a deterioration over the US$1,330 million surplus estimated in the previous year. Contributing to this performance were declines of both Current and Capital and Financial Accounts, from US$378 million to negative US$101 million, and from US$952 million to negative US$1,427 million over the period 2014 to 2015, respectively.
At September 30, 2015, the Heritage and Stabilisation Fund (HSF) stood at US$5,655.1 million. Although no transfers were made during the first six months of the fiscal year, the Net Asset Value of the Fund had appreciated to US$5,787.3 million by March 31, 2016. Amidst extended periods of declining oil and gas prices, the Government, in May 2016, withdrew US$377.5 million (TT$2,498.4 million) from the HSF.
Net Official Reserves; continuing to exceed conventional benchmarks of reserve adequacy, were US$10,077 million in September 2016, representing 11.1 months of prospective import cover, compared to US$10,312 million in September 2015.
EXECUTIVE SUMMARY

8
2016THE INTERNATIONAL ECONOMY1
United StatesCanada
The United KingdomThe Euro Zone
JapanEmerging and
Developing Asia
Latin America and the Caribbean
CIS Economies Sub Saharan Africa
GLOBAL OVERVIEWThe rate of growth of world output in 2016 is estimated to remain at the 2015 level of 3.1 percent. Growth is anticipated in Advanced Economies2 (1.8 percent), the Euro Zone (1.6 percent), Emerging and Developing Asia (6.4 percent), the Middle East, North Africa, Afghanistan and Pakistan region (3.4 percent) as well as Sub-Saharan Africa (1.6 percent). However, economic contraction is forecasted for Latin America and the Caribbean (-0.4 percent) as well as the Commonwealth of Independent States (-0.6 percent).
In 2016, global inflation is forecasted to remain steady at the 2015 rate of 2.8 percent. A marginal rise in inflation is anticipated among Advanced Economies, the Euro Zone, Emerging and Developing Asia, Latin America and the Caribbean and Sub-Saharan Africa.
1 Source: International Monetary Fund: World Economic Outlook April and July 2016, Fiscal Monitor April 2016, Various Regional Economic Outlooks 2016; and Various Publications from Central Banks and Statistical Offices.
2 Comprises the United States, Canada, Euro Zone, Japan, Korea, Australia, Taiwan Province of China, Sweden, Switzerland, Hong Kong SAR, Singapore, Czech Republic, Norway, Israel, Denmark, New Zealand, Iceland.
UNITED STATES2016 United States (US) GDP is expected to marginally decrease to 2.2 percent from 2.4 percent in the previous year. This is consequent to the steep drop in global oil prices, and lower investments in oil wells, and drilling and mining structures.
Unemployment in the US is expected to decline to 4.9 percent in 2016 from 5.3 percent in 2015. This can be attributed to increases in nonfarm payroll employment and the continued upward trends in service providing industries such as food services, professional and technical services and financial services. Inflation is anticipated to marginally increase from 0.1 percent in 2015 to 0.8 percent in 2016, well below the inflation target of 2.0 percent, and attributable to continued low prices for energy and imports, as well as personal consumption expenditures.
Over the corresponding period, exports drastically decreased; attributable to poor global growth, and
weaker demand for American products, consequent to the appreciation of the US dollar. Owing to the decline in exports, and the simultaneous fall in investment income, the current account balance for the US is expected to remain in deficit at -2.9 percent of GDP in 2016 from -2.7 percent in 2015.
The US fiscal balance is projected to marginally decrease from -3.7 percent of GDP in 2015 to -3.8 percent in 2016.
CANADADriven by solid growth in US domestic demand, increased federal infrastructure spending, and other fiscal measures, real GDP in Canada is forecast to increase by 1.4 percent in 2016 from 1.1 percent in 2015. This movement can be attributed to the pass-through of the earlier exchange rate depreciation.
Canada’s inflation rate is expected to increase marginally from 1.1 percent in 2015 to 1.3 percent in 2016. However,

9
THE INTERNATIONAL ECONOMYinflation is still within the inflation target of 1 to 3 percent.3 Unemployment, projected at 7.3 percent in 2016, will be higher than the 6.9 previously recorded in 2015, while an expansion of the current account deficit from -3.3 percent in 2015 to -3.5 percent in 2016 is projected. The fiscal balance is anticipated to worsen to -1.8 percent of GDP in 2016 from -0.7 percent in 2015.
THE UNITED KINGDOMGrowth in real GDP in the United Kingdom (UK) is projected at 1.7 percent in 2016, falling from 2.2 percent one year earlier and attributable mainly to declines in construction and manufacturing, weaker demand for exports and a marked decline in demand from extraction sectors globally.
On June 23, 2016, the UK voted in a historic referendum in favour of a British exit from the European Union (EU). The “Brexit” victory sent economic shockwaves throughout the global markets and UK stocks plunged for the first time since the financial crisis in 2007. Following the Brexit vote, the Pound Sterling fell to its lowest rate since 1985. Britain also lost its top AAA credit rating.
In order for the UK to formally leave the EU, Article 50 of the Lisbon Treaty must be invoked, which gives parties involved two years to agree on the terms of the split. However, the incoming Prime Minister, Theresa May has delayed triggering Article 50 until the end of 2016. Until its formal withdrawal, the UK will continue to abide by EU treaties and law, but not partake in any decision-making.
UK inflation is projected to rise from 0.1 percent in 2015 to 0.8 percent in 2016; well below the 2 percent inflation target. This shortfall is predominantly due to unusually large drags from energy and food prices, weak global price pressures, the past appreciation of the Pound Sterling, and restrained domestic cost growth. The unemployment rate will record its fifth consecutive decrease in 2016 to 5.0 percent, from 5.4 percent in 2015. The current account deficit is expected to stagnate at -4.3 percent of GDP while the fiscal balance will contract from a deficit of -4.4 percent of GDP in 2015 to -3.2 percent of GDP in 2016.
3 Monetary Policy Report July 2016- Bank of Canada
THE EURO ZONE 4
Following four years of consecutive expansion in real GDP, further growth of 1.6 percent is expected in the Euro Zone in 2016, representing a minor decrease from the 1.7 percent recorded in 2015, and attributable to a weakening in net exports. Decreased growth is projected for: Greece (to -0.6 percent, from -0.2 percent in 2015); Ireland (to 5.0 percent, from 7.8 percent in 2015); Portugal (to 1.4 percent, from 1.5 percent in 2015); and Spain (to 2.6 percent, from 3.2 percent in 2015). However, the German economy is projected to expand by 1.6 percent in 2016.
The Euro Zone is expected to record an increase of 0.4 percent in inflation in 2016 from 0.0 percent in 2015. Similar marginal increases are predicted for: Germany (from 0.1 percent in 2015 to 0.5 percent in 2016); Greece (from -1.1 percent in 2015 to 0.0 percent in 2016); Portugal (from 0.5 percent in 2015 to 0.7 percent in 2016); and Spain (from -0.5 percent in 2015 to -0.4 percent in 2016). However, a more significant increase in the consumer price index is expected for Ireland (from 0.0 percent in 2015 to 0.9 percent in 2016). Over the medium term, the European Central Bank aims to target inflation rates below 2 percent. 5
Unemployment in the Euro Zone is expected to decline for the fourth consecutive year (to 10.3 percent in 2016, from 10.9 percent in 2015). This anticipated improvement is reflected in Spain (from 22.1 percent in 2015 to 19.8 percent in 2016); Portugal (from 12.4 percent in 2015 to 11.6 percent in 2016); and Ireland (from 9.4 percent in 2015 to 8.3 percent in 2016). Unemployment for Germany and Greece will remain constant at the 2015 level of 4.6 percent and 25 percent respectively.
In 2016, the current account balance for the Euro Zone is projected to increase to 3.5 percent of GDP from the 3.0 percent reported in 2015. The current account deficit in Greece is anticipated to increase to -0.2 percent of GDP in 2016, from 0.0 percent in 2015. It is anticipated that the current account balance for Spain and Portugal will increase from 1.4 percent in 2015 to 1.9 percent
4 Comprises 19 countries: Austria, Belgium, Cyprus, Estonia, Finland, France, Germany, Greece, Ireland, Italy, Latvia, Lithuania, Luxembourg, Malta, Nether-lands, Portugal, Slovak Republic, Slovenia, and Spain
5 European Central Bank- Monetary Policy

1 0
2016in 2016 and from 0.5 percent in 2015 to 0.9 percent in 2016 respectively, whilst Germany and Ireland will report declines from 8.5 percent to 8.4 percent and from 4.5 percent to 4.0 to percent respectively.
Within the Euro Zone, the fiscal balance is anticipated to improve from -2.0 percent of GDP in 2015 to -1.9 percent in 2016. A positive but low fiscal balance of 0.1 percent is expected for Germany in 2016 as compared to 0.6 percent in the preceding year. The fiscal balance for Portugal and Ireland is projected to improve to -2.9 percent and 0.4 percent in 2016 from -4.4 percent and 1.6 percent in 2015 respectively.
JAPANAccording to the Bank of Japan’s Outlook for Economic Activity and Prices, July 2016, GDP growth is expected to continue its moderate recovery, although exports and production have been sluggish due mainly to the effects of the slowdown in emerging economies. GDP growth is estimated to remain at the 2015 level of 0.5 percent in 2016. Inflation is forecast to fall from 0.8 percent in 2015 into negative territory of -0.2 percent in 2016. The Bank of Japan attributes this decline to the effects of the fall in energy prices. Unemployment in Japan is estimated to reduce to 3.3 percent in 2016 from 3.4 percent in 2015.
The current account balance for Japan is expected to marginally increase from 3.3 percent of GDP in 2015 to 3.8 percent in 2016. Japan’s fiscal balance is projected to continue along its path of improvement from -5.2 percent of GDP in 2015 to -4.9 percent of GDP in 2016.
EMERGING AND DEVELOPING ASIA 6
GDP growth in Emerging and Developing Asia will record its sixth consecutive decline since 2010 (9.6 percent), falling to 6.4 percent in 2016 from 6.6 percent in 2015. This contraction is reflected in the slowdown in China’s economy from 6.9 percent in 2015 to 6.6 percent in 2016. The contraction in China is due to a weakening
6 Comprises 29 countries: Bangladesh, Bhutan, Brunei Darussalam, Cambodia, China, Fiji, India, Indonesia, Kiribati, Lao P.D.R., Malaysia, Maldives, Marshall Islands, Micronesia, Mongolia, Myanmar, Nepal, Palau, Papua New Guinea, Philippines, Samoa, Solomon Islands, Sri Lanka, Thailand, Timor-Leste, Tonga, Tuvalu, Vanuatu, and Vietnam.
THE INTERNATIONAL ECONOMYof the industrial sector, as excess capacity continues to unwind, especially in Real Estate and Manufacturing. India’s economy is expected to record a minor increase in growth of 7.4 percent in 2016, compared to 7.3 percent in 2015, despite muted investment and a prolonged contraction in exports.
Inflation for Emerging and Developing Asia is forecasted to increase from 2.7 percent in 2015 to 2.9 percent in 2016. Similarly, inflation in China is also expected to increase from 1.4 percent in 2015 to 1.8 percent in 2016. The uptick in inflation in China can be attributed to higher prices of fruits and vegetables due to crop damage from extreme cold weather early in the year. Inflation in India is also anticipated to increase from 4.9 percent in 2015 to 5.3 percent in 2016; well within the inflation target of 6.0 percent set by the Reserve Bank of India. 7 The rise in Indian inflation is attributed to unseasonal rains and floods in the southern states which resulted in increased prices of vegetables and cereals. China’s unemployment rate is anticipated to remain unchanged at the 2015 level of 4.1 percent.
The current account balance for the area is anticipated to decline from 1.9 percent of GDP in 2015 to 1.7 percent in 2016. India’s current account balance is projected to move from a deficit of -1.3 percent in 2015 to -1.5 percent in 2016. Concomitantly, this indicator is estimated to record a slight reduction for China, from a reported level of 2.7 percent in 2015 to 2.6 percent expected in 2016.
China’s fiscal balance will continue its downward trajectory in 2016 to a deficit of -3.1 percent of GDP from -2.7 percent deficit the previous year. Comparably, India’s deficit is expected to marginally improve to -7.0 percent in 2016 from -7.2 percent recorded in 2015.
LATIN AMERICA AND THE CARIBBEAN 8
Growth in real GDP for Latin America and the Caribbean is projected to move into negative territory in 2016 to -0.4
7 Monetary Policy Report April 2016 – Reserve Bank of India
8 Comprises 32 countries: Antigua and Barbuda, Argentina, The Bahamas, Barbados, Belize, Bolivia, Brazil, Chile, Colombia, Costa Rica, Dominica, Dominican Republic, Ecuador, El Salvador, Grenada, Guatemala, Guyana, Haiti, Honduras, Jamaica, Mexico, Nicaragua, Panama, Paraguay, Peru, St. Kitts and Nevis, St. Lucia, St. Vincent and the Grenadines, Suriname, Trinidad and Tobago, Uruguay, and Venezuela.

1 1
The current account balance is anticipated to show slight improvement in 2016 with an estimated smaller deficit of -2.0 percent of GDP in comparison to the -3.3 percent deficit reported in 2015. The fiscal position is expected to improve slightly from a deficit of -10.3 percent of GDP in 2015 to -8.7 percent in 2016.
In 2016, Mexico’s output is anticipated to remain fixed at the 2015 level of 2.5 percent, while the rate of inflation is expected to remain within Mexico’s target of 3.0 percent. The country’s CPI is expected to be 2.9 percent in 2016, marginally higher than the 2.7 percent recorded in 2015, and is generated by a considerable increase in vegetable prices triggered by prevailing weather factors. Consumer spending, fueled by job growth and rising remittances prompted a slip in Mexico’s unemployment rate which is projected from 4.3 percent in 2015 to 4.0 percent in 2016; the lowest rate of joblessness for Mexico in almost last 8 years. The current account balance for Mexico is estimated to fall from -2.8 percent of GDP in 2015 to -2.6 percent in 2016. Mexico’s fiscal balance will also record a marginal increase from -4.1 percent of GDP in 2015 to -3.5 percent in 2016.
The upward movement of growth in Panama (from 5.8 percent in 2015 to 6.1 percent in 2016) is expected to continue as its favorable business environment attracts more foreign investment into the country’s construction industry, which combined with a strengthening of the consumer and financial services sectors underpin the country’s growth. Also, the opening of the Panama Canal expansion in late June of 2016 will provide further impetus to the Panamanian economy. The Consumer Price Index for Panama is expected to climb from 0.1 percent in 2015 to 0.8 percent in 2016, reflecting price increases for four out of the twelve indices. The unemployment rate in Panama remains unchanged at 5.1 percent for 2016. In 2016, Panama recorded a deficit of -3.4 percent of GDP on its current account balance, which remains unchanged from the deficit recorded in 2015.
percent (from 0.0 percent in 2015). This notwithstanding, most countries are handling the transition to persistently low commodity prices in an orderly fashion and some continue to record modest growth. Inflation for the region is expected to hover around 5.7 percent in 2016; increasing from 5.5 percent in 2015. Current account deficits remain large in most countries and for the region as a whole, contracting from -3.6 percent of GDP in 2015 to -2.8 percent of GDP in 2016. Minor improvement is expect for the fiscal deficit of the region, from -3.0 percent of GDP in 2015 to -2.9 percent of GDP in 2016.
Growth in Argentina is projected to move from a surplus of 1.2 percent in 2015 to a deficit of -1.0 percent in 2016. The slowdown in economic activity reflects the decline in exports as traditional trading partners, notably Brazil, are negatively affected by lower terms of trade. Unemployment is expected to increase from 6.5 percent in 2015 to 7.8 percent in 2016. Subsequent to two consecutive annual declines of -7.4 percent and -16.1 percent in 2014 and 2015 respectively. In Argentina a smaller current account deficit of -7.3 percent is expected in 2016, despite weaker external demand, lower commodity prices, and the real appreciation of the peso which have weighed on exports. A small improvement in the fiscal deficit is anticipated in 2016 from -7.4 percent of GDP in 2015 to -6.4 percent, despite lower energy prices, reduced energy subsidies, lower export taxes, weaker import tariffs and increased spending on wages and pensions.
Real GDP in Brazil is projected at -3.3 percent in 2016 from -3.8 percent in 2015. The recession being experienced in Brazil is set to continue against the backdrop of high political uncertainty and ongoing corruption allegations that are undermining consumer and business confidence and leading to a severe contraction in domestic demand. A minor decline in the inflation rate is projected for Brazil, from 9.0 percent in 2015 to 8.7 percent in 2016, as the recession reduces inflationary pressures and the strong increases in prices in early 2015 are beginning to fall out of the 12-month window. Inflation is on a decline but still remains well above the inflation target of 4.5 percent. Along with the constant decline in growth, the rate of unemployment is expected to rise to 9.2 percent in 2016 from 6.8 percent in the previous year.
THE INTERNATIONAL ECONOMY

1 2
2016COMMONWEALTH OF INDEPENDENT STATES 9
Growth in the Commonwealth of Independent States (CIS) contracted to -0.6 percent in 2016 compared to -2.8 percent in 2015, as a sharp fall in commodity prices and the deepening recession in Russia weighed heavily on the region’s performance. Despite the weakness in early 2016, the region demonstrated more resilience to heightened volatility in global financial markets and a renewed fall in commodity prices, particularly in oil and gas. Growth in Russia is expected to narrow to -1.2 percent in 2016 in comparison to -3.7 percent in 2015 as the country continues to adjust to low oil prices, Western sanctions, domestic structural weaknesses, and geopolitical tensions.
Consequent on the lagging impact of excess capacity, declining commodity prices, and low global inflation, the CIS will record decreased inflation from 15.5 percent in 2015 to 9.4 percent in 2016. Attributable to tighter monetary policy and weak activity, the CPI in Russia is also anticipated to decline to 8.4 percent in 2016 from 15.5 percent in 2015.
In 2016, the unemployment rate for Russia is expected to increase from 5.6 percent in 2015 to 6.5 percent in 2016 due to weakening economic activity and slowing employment creation due to falling commodity prices.
Paralleling the decrease in the current account balance of the CIS region in 2016 to 2.0 percent of GDP from 2.8 percent in 2015, it is anticipated that Russia will also report a decline in their current account balance from 5.0 percent in 2015 to 4.2 percent in 2016 as low oil prices are weighing on the value of Russia’s exports. A reduction in the burden of foreign debt repayments greatly reduced the size of capital flows Russia makes abroad. Similarly, the fiscal deficit for Russia is estimated to worsen from -3.1 percent of GDP in 2015 to -3.7 percent in 2016.
9 Comprises Russia, Ukraine, Kazakhstan, Belarus, Azerbaijan, Turkmenistan, Mongolia, Uzbekistan, Georgia, Armenia, Tajikistan, Kyrgyz Republic and Moldova
THE INTERNATIONAL ECONOMY
SUB-SAHARAN AFRICASub Saharan Africa experienced its 15th consecutive decline in GDP growth in 2015. In 2016, it is anticipated that GDP will further contract by 1.6 percent. This is attributable to sharp declines in commodity prices, slow recovery from the Ebola epidemic and severe drought in Southern and Eastern African countries. Economic activity in Nigeria is forecast to slow from 2.7 percent is 2015 to -1.8 percent in 2016, as the country grapples with falling commodity prices and production levels. Non-energy-commodity exporters, including South Africa are also expected to report decreases with real GDP growth in 2016 of 0.1 percent compared to 1.3 percent in 2015, owing to lower export prices, elevated policy uncertainty and tighter monetary and fiscal policy.
Inflation is expected to rise for the region to 9.0 percent in 2016 from 7.0 percent in 2015. This upward movement is mirrored for South Africa (from 4.6 percent in 2015 to 6.5 percent in 2016) and Nigeria (from 9.0 percent in 2015 to 10.4 percent in 2016). Many currencies in the region have depreciated significantly against a strong U.S. dollar, limiting the decline of oil prices in domestic currency terms and accelerating inflation.
The current account for the region is expected to worsen to -6.2 percent of GDP in 2016 from -6.0 percent in 2015. This downward movement is reflected in Nigeria (from -2.4 percent in 2015 to -2.8 percent in 2016). However, Ghana will experience a marginal improvement in their current account balance of -8.3 percent in 2015 to -7.2 percent in 2016 despite the waning of international prices for oil and gold. The 2015 reported current account balance for these countries were 2.4 percent and 8.3 percent respectively. The current account balance for South Africa will remain constant at - 4.4 percent.
For the region, revenue shortfalls have been significant, and fiscal balances have deteriorated despite some collective adjustment in expenditures, from 2.8 percent of GDP in 2015 to 3.2 percent in 2016.

1 3
THE INTERNATIONAL ECONOMYTable 1: Macroeconomic Indicators for Selected Economies
RealGDP
Consumer Prices
Unemployment(%)
Current AccountBalance1
FiscalBalance2
2015 2016 2015 2016 2015 2016 2015 2016 2015 2016
Advanced Economies 1.9 1.8 0.3 0.7 6.7 6.3 0.7 0.7 n/a n/a
United States 2.4 2.2 0.1 0.8 5.3 4.9 -2.7 -2.9 -3.7 -3.8
Japan 0.5 0.3 0.8 -0.2 3.4 3.3 3.3 3.8 -5.2 -4.9
Canada 1.1 1.4 1.1 1.3 6.9 7.3 -3.3 -3.5 -0.7 -1.8
Euro Zone 1.7 1.6 0.0 0.4 10.9 10.3 3.0 3.5 –2.0 –1.9
United Kingdom 2.2 1.7 0.1 0.8 5.4 5.0 -4.3 -4.3 -4.4 -3.2
Germany 1.5 1.6 0.1 0.5 4.6 4.6 8.5 8.4 0.6 0.1
Spain 3.2 2.6 -0.5 -0.4 22.1 19.8 1.4 1.9 -4.5 -3.4
Greece -0.2 -0.6 -1.1 0.0 25.0 25.0 0.0 -0.2 -4.2 n/a
Portugal 1.5 1.4 0.5 0.7 12.4 11.6 0.5 0.9 -4.4 -2.9
Ireland 7.8 5.0 0.0 0.9 9.4 8.3 4.5 4.0 -1.6 -0.4
Advanced Asia n/a n/a n/a n/a n/a n/a n/a n/a n/a n/a
Hong Kong 2.4 2.2 3.0 2.5 3.3 3.2 3.0 3.1 1.5 0.8
Korea 2.6 2.7 0.7 1.3 3.6 3.5 7.7 8.2 -0.6 0.1
Singapore 2.0 1.8 -0.5 0.2 1.9 2.0 19.7 21.2 -0.3 0.6Emerging and Developing Asia 6.6 6.4 2.7 2.9 n/a n/a 1.9 1.7 n/a n/a
China 6.9 6.6 1.4 1.8 4.1 4.1 2.7 2.6 -2.7 -3.1
India 7.3 7.4 4.9 5.3 n/a n/a -1.3 -1.5 -7.2 -7.0Latin America and the Caribbean 0.0 -0.4 5.5 5.7 n/a n/a -3.6 -2.8 -3.0 -2.9
Argentina 1.2 -1.0 n/a n/a 6.5 7.8 -2.8 -1.7 -7.4 -6.4
Brazil -3.8 -3.3 9.0 8.7 6.8 9.2 -3.3 -2.0 -10.3 -8.7
Mexico 2.5 2.5 2.7 2.9 4.3 4.0 -2.8 -2.6 -4.1 -3.5
Panama 5.8 6.1 0.1 0.8 5.1 5.1 -3.4 -3.4 n/a n/a
Commonwealth of
Independent States-2.8 -0.6 15.5 9.4 n/a n/a 2.8 2.0 n/a n/a
Russia -3.7 -1.2 15.5 8.4 5.6 6.5 5.0 4.2 -3.1 -3.7
Middle East, North Africa, Afghanistan, and Pakistan 2.3 3.4 5.7 5.2 n/a n/a -3.6 -6.9 -0.8 -9.6
Sub-Saharan Africa 3.3 1.6 7.0 9.0 n/a n/a -6.0 -6.2 -2.8 -3.2
South Africa 1.3 0.1 4.6 6.5 25.4 26.1 -4.4 -4.4 -0.7 -0.2
Nigeria 2.7 -1.8 9.0 10.4 9.9 n/a -2.4 -2.8 -2.9 -3.9
Ghana 3.5 4.5 17.2 15.7 n/a n/a -8.3 -7.2 1.7 2.8
Source: International Monetary Fund: World Economic Outlook April 2016; Fiscal Monitor April 2016n/a: not available1 & 2: % of GDP

1 4
2016ECONOMIC PERFORMANCE OF CARICOM STATES 10
OverviewBarbadosJamaicaGuyana
ECCU Countries
OVERVIEWGrowth in Caribbean territories11 differed widely in 2015, impelled by varying domestic and external forces. While the prolonged decline in commodity prices augured well for the tourism-based economies, growth prospects in commodity-based economies deteriorated, exacerbating external imbalances and diminishing international reserves. In the tourism-dependent Caribbean, average growth measured 1.6 percent, while growth in the commodity-exporting Caribbean tapered to 0.7 percent from 2.1 percent in the previous year.
On balance, economic recovery is expected to remain modest in 2016, led by The Bahamas, Jamaica and several Eastern Caribbean Currency Union (ECCU) countries. 12
In addressing fiscal vulnerabilities, some countries have strengthened their overall fiscal balances, notably, The Bahamas, Grenada, Guyana and Haiti. However, public debt remains high, particularly in tourism-dependent economies.
Overall, inflation remained restrained, with the exception of Haiti where double digits persist.
Despite the benefits of a lower commodity environment, public finances remained under strain. Among the tourism-dependent economies, the average current account deficit, financed mainly through foreign direct investment and official flows, was estimated to be in excess of 11.0 percent of GDP in 2015, while in commodity-exporting economies, this projection was lower at 9.0 percent of GDP.
10 Source:- IMF Regional Economic Report-April 2016/Western Hemisphere IMF Country Report
11 Aruba, The Bahamas, Barbados, Belize, ECCU, Guyana, Haiti, Jamaica, Suriname, Trinidad and Tobago, Curacao and St. Maarten.
12 Antigua and Barbuda, Dominica, Grenada, St. Kitts and Nevis, St. Lucia, St. Vincent and the Grenadines, as well as Anguilla and Montserrat which are dependent territories of the United Kingdom.

1 5
ECONOMIC PERFORMANCE OF CARICOM STATES
BARBADOSGiven the magnitude of Barbados’ fiscal challenge, its 19-month fiscal adjustment programme, which commenced in August 2013, had mixed results. While real GDP grew to 0.5 percent in 2015, buttressed by a surge in tourist arrivals and projected to rise to 2.1 percent in 2016, fiscal reforms have yielded less than expected. Notwithstanding significant consolidation in FY2014/15, the deficit in FY2015/16 remained unchanged, while delayed implementation of the June 2015 tax measures and sluggish reform of state-owned enterprises fell short of the Government’s objective.
The average unemployment rate for the twelve months ending March 2016 measured 10.7 percent, compared with 12.4 percent for the twelve months ending March 2015. During the period April to June 2016, the fiscal deficit widened by BDS$28 million to BDS$204 million while the primary surplus diminished by BDS$14 million to BDS$25.3 million. Fiscal consolidation continues to be a priority, with the goal of reducing the deficit by 2 percentage points of GDP for the FY2016/17.
While tourist arrivals exceeded those of the previous year, the 5 percent expansion was marginally lower than for the first quarter. This coupled with external debt service requirements, reduced international reserves by BDS$43 million to BDS$884 million, equivalent to 13.6 weeks of imports compared to BDS$968 million (14.4 months of imports) recorded at the end of June 2015.
On July 8, 2016 Moody’s Investor Services lowered its long-term sovereign credit ratings on Barbados to ‘Caa1’ from ‘B3-’ with a stable outlook. Debt was measured at 108 percent of GDP by June 2016, compared to 101.2 percent of GDP one year earlier. Inflation is expected to remain subdued at 0.4 percent in 2016, reflecting a sharp reduction in import prices.
JAMAICAReforms aimed at reducing macroeconomic vulnerabilities, fostering growth, inciting the conditions for financial deepening and inclusion, reallocating public resources and improving competitiveness have reversed the trajectory of the once-afflicted Jamaican economy.
Economic growth is projected at 2.2 percent in 2016; double the growth recorded in the previous year while inflation has more than halved; from a high of 7.2 percent from the inception of the IMF’s Extended Fund Facility (EFF) 13 Programme to a historical low of 3.0 estimated for 2015. Inflation measured 2.4 percent in April 2016, owing to lower global oil prices and weak domestic demand. The current account deficit narrowed sharply by 71.1 percent from US$1,128 million in 2014 to US$326 million in 2015, largely as a result of lower oil prices. Consequently, Jamaica has successfully re-entered the international financial market and, abetted by upgrades in the country’s credit ratings, issued external bonds of US$800 million and US$2 billion in 2014 and 2015, respectively. Driven by strong arrears collection and enhanced filing, tax revenues in FY2015/16 were for the first time on target with budget. Business confidence attained its highest level in February 2016 and private sector credit growth increased by 11 percent year-on-year in the first quarter of 2016, mirroring increased capital investments and business process outsourcing (BPO) industries.
Public debt remained on a downward trajectory through strong fiscal consolidation and, as the buyback of PetroCaribe debt, instantly reduced its debt by 10 percent in 2015. As a result, Jamaica’s public sector debt declined from 135.6 percent of GDP in 2014 to 124.3 percent in 2015 and is projected to fall further to 123.1 percent of GDP in 2016.
Notwithstanding the substantial progress engendered by the EFF, hindrances to growth and job creation persist. These include the cost and availability of credit, tax compliance cost and a large informal economy. Buoyed by low inflation, the real effective exchange rate depreciated by 2.2 percent year-on-year while the Jamaican dollar depreciated 6 percent against the US dollar. In July 2014, Jamaica regained international market access, supported by strong programme performance, investors’ search for yield, and the exclusion of international bonds from the National Debt Exchange.
13 The EFF is intended for countries which are: (i) experiencing serious pay-ments imbalances because of structural impediments; or (ii) characterised by slow growth and an inherently weak balance of payments position. It provides assistance in support of comprehensive programs that include policies aimed at correcting structural imbalances over an extended period. Financing under the EFF currently carries the IMF’s basic rate of charge, with a grace period of 4.5 years and a maturity of 10 years.
1 6
2016ECONOMIC PERFORMANCE OF CARICOM STATES
In February 2016, the Government, taking advantage of a liquidity injection of J$60.4 billion (4 percent of GDP), successfully issued J$15 billion bonds domestically, with no adverse effects on the yield curve and financial sector balance sheets.
Net international reserves is projected at US$2.6 billion in 2016, exceeding the projected EFF Programme path while the main fiscal anchor of the programme, a primary surplus target of 7.5 percent of GDP in 2014, was comfortably met with public enterprises recording stronger surpluses. Net foreign direct investment (FDI) amounted to US$760 million in 2015, up from US$511 million in 2014 while portfolio flows, more volatile than FDI inflows, were negative at US$225 in 2015 following a positive contribution of US$775 in 2014.
GUYANA 14
The Guyanese economy, supported by public investment and the opening of two large gold mines in the last quarter of 2015, is projected to grow by 3.4 percent in 2016 as compared to 3 percent in 2015 and 3.8 percent in 2014.
Subdued prices for imported goods, including fuel, and a one-off increase in goods exempted from VAT continued to restrain inflationary pressures on the real economy, despite an expansionary fiscal policy. Inflation is estimated at a low of 2.1 percent by year end.
The current account deficit narrowed considerably to an estimated 4.8 percent in 2015 from 12.6 percent in 2014 and 14.3 percent in 2013. However, the overall balance was broadly unaltered, reflecting lower disbursements from multilateral donors and PetroCaribe. The non-financial public sector (NFPS) deficit also narrowed to 0.2 percent of GDP in 2015 from 5.7 percent in 2014.
The real effective exchange rate (REER) appreciated by approximately 18 percent between July 2014 and January 2016, reflecting developments in the value of the US dollar. International reserves were 3.5 months of imports at end-2015.
An Exxon Mobil Corporation discovery in the Atlantic Ocean off Guyana in 2015 encountered more than 295
14 Source:- IMF”s Press Release No. 16/214 and Bank of Guyana Annual Report 2015
feet of high-quality oil-bearing sandstone reservoirs. Preliminary estimates are that the well may hold oil and natural gas reserves, 12 times more valuable than the nation’s entire current economic output. The Liza-1 well, which is estimated to contain the equivalent of more than 700 million barrels of oil, may begin producing crude by the end of the decade.
ECCURecovery in the international economy, strategies for indigenous bank resolution and improvements in financial stability indicators are all contributing factors to the ongoing recovery in the ECCU. Output growth for the region has steadily increased over the past few years and is estimated at 2.2 percent in 2015 with a prospect of 2.6 percent in 2016. In St. Kitts and Nevis, growth measured 6.6 percent in 2015; the strongest in the region, while Grenada recorded robust growth of 4.6 percent due to continued expansion in agricultural, tourism and tourism-related construction. Growth in St. Kitts and Nevis and Grenada is expected to wane to 4.7 percent and 3.0 percent, respectively, in 2016.
In 2016, inflation in the ECCU countries is forecasted at 0.2 percent, from -1.0 percent in 2015. Inflationary rates in 2015 varied from 0.9 percent in Antigua and Barbuda to -2.9 percent in St. Kitts and Nevis. The overall external current account deficit narrowed to 12.2 percent in 2015 from 14.3 percent in 2014. A further narrowing of the external current account deficit to 11.7 percent is envisaged for 2016. In Belize, the current account deficit widened to 9.8 percent of GDP as exports fell by 9 percent (mainly oil and marine products) and imports continued to grow, partly due to investment projects.
In Grenada, for the first time in a decade, a primary surplus of 2.2 percent of GDP was achieved, departing significantly from the deficit of 3.9 percent of GDP in 2013. Grenada’s debt restructuring is nearing completion and public sector debt has shrunk from 106.8 percent of GDP in 2013 to 92.7 percent in 2015. The debt-to-GDP ratio is projected to fall to 79 percent by end-2017 and to below 60 percent by 2020.
The Dominican economy suffered a severe blow from tropical storm Erika in August 2015, with output growth estimated to have declined from 3.9 percent in 2014

1 7
ECONOMIC PERFORMANCE OF CARICOM STATESto -4.3 percent in 2015. Output growth is expected to remain subdued in 2016 at 1.3 percent following recovery from the storm and as investment in reconstruction work picks up. The current account deficit, though checked by lower oil imports in 2015, is forecasted to deteriorate to -16.6 percent of GDP in 2016 from -14.4 percent in 2015.
In St. Kitts and Nevis, macroeconomic performance remained robust as the country exited the Post-Programme Monitoring Framework in October 2015,
seven months ahead of schedule. The economy grew at an estimated 6.6 percent in 2015, underpinned by large real estate projects through the Citizenship-by-Investment Programme as well as large public sector investment projects. The banking system, propped by comfortable capital buffers and high levels of liquidity, remained stable though high levels of non-performing loans continued to temper banks’ lending.
Table 2: Macroeconomic Indicators for Selected CARICOM Economies
Real GDP Growth
Consumer Prices(End of period,
percent)Unemployment
(%)Current Account
Balance Fiscal Balance1
2014 2015e 2016p 2014 2015e 2016p 2014 2015e 2016p 2014 2015e 2016p 2014 2015e 2016p
Barbados 0.2 0.5 2.1 2.3 -0.7 0.4 12.3 12.2 10.7 -8.9 -5.2 -4.6 -2.5 -2.3 -0.7
Guyana 3.8 3.0 3.4 1.2 -1.8 2.1 n/a n/a n/a -12.6 -4.8 -5.2 -3.8 -0.2 -3.7
Jamaica 0.5 1.1 2.2 6.4 3.0 5.3 15.3 13.5 n/a -7.1 -4.3 -2.9 7.5 7.3 7.0
ECCU (All Countries):
2.9 2.2 2.6 1.2 -1.0 0.2 n/a n/a n/a -14.3 -12.2 -11.7 1.4 0.4 1.0
Antigua and Barbuda
4.2 2.2 2.0 1.3 0.9 1.4 n/a n/a n/a -14.5 -10.0 -6.2 -0.2 -5.6 6.7
Dominica 3.9 -4.3 4.9 0.5 -0.1 -0.1 n/a n/a n/a -13.1 -14.1 -16.6 -2.9 1.0 -0.2
Grenada 5.7 4.6 3.0 -0.6 -1.2 -0.1 n/a n/a n/a -15.5 -15.1 -12.2 -1.1 2.2 3.1
St. Kitts and Nevis 6.1 6.6 4.7 -0.6 -2.9 0.2 n/a n/a n/a -7.6 -13.0 -18.4 12.2 7.7 5.4
St. Lucia 0.5 1.6 1.4 3.7 -2.1 -0.7 n/a n/a n/a -6.7 -7.5 -7.9 0.1 0.3 0.7
St. Vincent and the Grenadines
-0.2 1.6 2.2 0.1 -1.7 1.1 n/a n/a n/a -29.6 -24.8 -21.3 -1.5 -0.2 0.1
Source: Regional Economic Outlook (REO), Western Hemisphere – Main Economic indicators, April 2016n/a: not availablee- estimatedp- projected1 Public Sector Primary Balance of the REO, Western Hemisphere, April 2016

1 8
2016THE REAL ECONOMY
Gross Domestic ProductPetroleum Agriculture
ManufacturingServices
PricesProductivityPopulation
Labour Force and Employment
GROSS DOMESTIC PRODUCT 15
According to the latest estimates of the CSO 16, the Trinidad and Tobago economy is projected to contract for a third consecutive year, with a decline of 2.3 percent in real GDP in 2016, following smaller contractions of 0.6 percent in both 2014 and 2015. The weaker performance during 2016 reflects lower real economic activity in both the Petroleum and Non-Petroleum sectors, with estimated contractions of 9.6 percent and 1.8 percent respectively. (Appendices 1 to 3).
The Non-Petroleum sector is expected to register negative growth of 1.8 percent in 2016, which is a deterioration from the sector’s 1.2 percent growth recorded in 2015. The contribution of the Non-Petroleum sector to real GDP is however, forecast to rise slightly to 65.4 percent in 2016, from 65.1 percent in 2015, given the comparatively weaker performance expected in the Petroleum sector. The loss of vigor in the Non-Petroleum sector in 2016 is largely due to the spillover effects from the contracting Petroleum sector. Sharp declines in Government’s current revenue in 2015 and 2016 due to lower international oil and gas prices and domestic output, have led to a reduction in government expenditure, and a lower fiscal injection into the Non-Petroleum sector. Whilst this has reduced private sector demand and economic activity in the Non-Petroleum sector over the short-term, the move towards fiscal stability would set the stage for greater private sector investment over the medium and long term.
Services, the largest Non-Petroleum sub-sector, is projected to contract by 1.2 percent in 2016, after registering positive growth of equal magnitude (1.2 percent) in 2015. The sub-sector’s share of real GDP is nevertheless forecasted to rise to 57.2 percent in 2016, from 56.6 percent in 2015. Real economic activity in the Manufacturing sub-sector, the second largest Non-Petroleum sub-sector, is forecast to decline by 5.7 percent in 2016, a turnaround from the 1.6 percent expansion achieved in 2015. The sub-sector’s contribution to real GDP is therefore projected to fall to 7.8 percent in 2016, from 8.1 percent one year earlier. Likewise, a contraction of 6.0 percent is anticipated in the remaining Non-Petroleum sub-sector, Agriculture, weaker than the sub-sector’s 1.2 percent growth registered during 2015. Agriculture’s share of real GDP is however expected to remain unchanged at 0.4 percent in 2016.
15 Gross Domestic Product is quoted in constant (2000) prices unless otherwise stated.
16 Details on the estimation of Trinidad and Tobago’s GDP and on the wider institutional reform of the Central Statistical Office are provided at Text Boxes 1 and 2.

1 9
downstream industries, leading to contractions of 10.3 percent in the second major Petroleum sub-sector, Refining (including Atlantic LNG) (down from a smaller contraction of 7.9 percent in 2015); and 2.9 percent in the third major sub-sector, Petrochemicals (reversing the sub-sector’s 3.0 percent expansion in 2015). The negative outturn in Refining (including Atlantic LNG), reflects lower output of liquefied natural gas and reduced natural gas processing volumes compared to one year earlier. A recovery in crude and condensate refining is however projected in calendar 2016, with throughput at the Petrotrin Refinery increasing by 18.6 percent during the January to June 2016 period (refinery utilisation rates had been negatively impacted in the first quarter of calendar 2015 by Plant mechanical availability issues). Within the Petrochemical sub-sector, although there have been small increases in the output of Ammonia and Urea during the first half of calendar 2016, these have been outweighed by a larger decline in Methanol production during the period.
Following a vigorous expansion of 28.5 percent in 2015, the Service Contractors sub-sector is expected to contract at an almost equivalent rate of 25.3 percent in 2016. This sub-sector has been severely pressured by a decrease in demand for its services within Trinidad and Tobago, including from many onshore exploration and production companies that have been forced to reduce their drilling, production and capital spending and to implement other cost saving measures (such as performing in-house, work that was previously contracted out) in response to the continued fall in commodity prices. Given the growing cash flow constraints of clients, service contractors have also been financially impacted by the need to reduce the price of their services, and to increasingly accept late-payments. The remaining two Petroleum sub-sectors, Distribution, and Asphalt Production, are forecast to achieve positive outturns in 2016, albeit only at a marginal 0.1 percent rate in the case of the former (compared to growth of 1.9 percent in 2015). Robust growth of 7.6 percent is however anticipated for Asphalt Production, which is a marked reversal from its 16.0 percent decline in 2015.
The Petroleum sector is expected to register its third consecutive year of negative growth, declining by 9.6 percent in 2016, higher than the contractions of 2.5 percent and 4.0 percent recorded in 2014 and 2015 respectively. Reduced economic activity is expected in the three largest Petroleum sub-sectors, Exploration and Production; Refining (including Atlantic LNG); and Petrochemicals. The sharpest contraction during 2016 is however expected to take place in the Service Contractors sub-sector. In contrast to the aforementioned sub-sectors, Asphalt production is forecast to register strong positive growth, whilst the real value added in the Distribution sub-sector should remain virtually unchanged from 2015. The Petroleum sector’s share of real GDP is expected as a result to fall from 34.6 percent in 2015 to 32.0 percent in 2016.
In 2016, an 11.0 percent contraction in real economic activity is expected in Exploration and Production, the largest Petroleum sub-sector, following a smaller 5.5 percent drop in 2015. The sub-sector’s outturn in 2016 is on account of a projected sharp decline in natural gas production, which should outweigh a small rise in crude and condensate production. The reduction in natural gas output reflects the natural rate of decline in extraction from the country’s maturing gas reservoirs and shutdowns by upstream producers in order to conduct upstream maintenance and upgrade activities, as well as tie-in works to facilitate hydrocarbon flow from new fields. Natural gas production is however expected to bottom out and then pick-up towards the end of 2016 as output from new fields come on stream (The positive impact of production from the Angostura Phase 3 oil and gas field, and the Sercan gas field is expected in the 4th quarter of calendar 2016). In terms of crude and condensate, the anticipated small rise in production in 2016 is on account of the new output from Angostura Phase 3 as well as the Mango field within the final four months of 2016, which should outweigh the country’s naturally falling extraction levels. The contribution of the Exploration and Production sub-sector to GDP is expected to fall, as a result, from 19.6 percent in 2015 to 17.9 percent in 2016.
The curtailment in natural gas production during 2016 has further reduced the supply of natural gas to
THE REAL ECONOMY

2 0
2016THE REAL ECONOMY
Box 1 : Estimation and Revision of GDP by the Central Statistical Office
The Central Statistical Office of Trinidad and Tobago (CSO) was established in 1952 through the Statistics Ordinance, Chap.42, No. 11 of the Revised Ordinances 1952. The Ordinance was later replaced by the Statistics Act, Chapter 19:02 of the Revised Laws of the Republic of Trinidad and Tobago, 1982. The Statistics Act provides the legal framework for the operations of the CSO to:
(i). Take any census in Trinidad and Tobago;
(ii). Collect, compile, analyze and publish statistical information relating to all social and economic activities of the people of the Republic of Trinidad and Tobago;
(iii). Collaborate with other Government Departments in the collection, compilation, analysis and publication of statistical records of administration; and
(iv). Generally organise a coordinated scheme of economic and social statistics relating to The Republic of Trinidad and Tobago.
The CSO uses the Production Approach in the compilation of its annual GDP estimates. This approach is also referred to as the Value-Added Approach, since it is based on computing the value added by each industry involved in the production of goods and services.
All economic activities in Trinidad and Tobago are categorised by the CSO into 20 industries. Each industry is divided into sub-industries and most sub-industries are further divided into sub-sub-industries. Estimates of value added are produced at the lowest (most disaggregated) level possible.
The Primary Source of information for the estimation of GDP is The Annual Survey of Establishments. Other data sources include economic indices of output and price generated by the CSO. Revenue, costs, production output and price data are also obtained directly from establishments surveyed, Government Ministries, and administrative sources.
Data from the Annual Survey of Establishments are edited according to detailed established editing procedures. All other data obtained are reviewed for consistency and reasonableness accompanied by consultation where necessary with responding establishments and other interested parties.
GDP estimates at current prices are obtained using the production approach. The method of compilation is consistent with the United Nations System of National Accounts (1993 SNA). GDP at constant prices are estimated using the single indicator method of deflation by applying appropriate price deflators and production output extrapolators.
The methodology and procedures utilised by the CSO in the estimation have been extensively reviewed, modified as necessary, and approved by regional and international bodies such as the Caribbean Regional Technical Assistance Centre (CARTAC) and the International Monetary Fund (IMF). This process continues as part of the CSO current transformation exercise.
In the most recent estimates prepared in August 2016, the CSO has revised its previous estimates for both nominal and constant GDP downwards for 2014 and 2015 as follows:
2014 2015
Original Estimate GDP Current Prices (TT$ Millions) 174,756.9 165,286.1
Revised Estimate GDP Current Prices (TT$ Millions) 167,764.3 150,246.6
Original Estimate GDP Constant Prices (TT$ Millions) 93,840.9 94,008.2
Revised Estimate GDP Constant Prices (TT$ Millions) 94,620.5 94,073.1
Original Estimate GDP Growth Rate (%) -1.0 0.2
Revised Estimate GDP Growth Rate (%) -0.6 -0.6
There were significant revisions to the overall GDP estimates made for the reference years 2014 and 2015. The estimated GDP for 2014 was revised downwards by $7,004.6 million and that for 2015 was also revised downward by $15,039.5 million.

2 1
THE REAL ECONOMY
In general, a further revision to previously published preliminary (or revised) estimates for one or more years are due to additional data (such as responses to Business Establishment Surveys) being obtained by the CSO beyond that which had been available at the time estimates were prepared in the previous year . On this occasion in particular, the revised estimates can largely be attributed to revisions in the estimated revenues of oil and natural gas as a result of estimation changes for oil and natural gas prices.
Box 2: Transformation of the Central Statistical Office to the National Statistical Institute and Ongoing Improvements in the Production and Dissemination of National Statistics.
In its September 2014 Staff Report on the Article IV Consultations with Trinidad and Tobago, the International Monetary Fund noted that:
“Data shortcomings have reached critical mass and now severely constrain staff’s ability to conduct economic surveillance. The government data collection agency, the CSO, temporarily ceased operations in mid-2013 and now operates under extreme resource constraints, leading to very long lags for GDP, trade and labor data”.
In response to the above and similar concerns expressed by other stakeholders, over deficiencies impacting data that is produced via Trinidad and Tobago’s National Statistical System, the Government of Trinidad and Tobago approved, in June 2015, the transformation of the CSO into the National Statistical Institute (NSI). The new NSI would function as an independent, autonomous agency responsible for the production, development and management of the country’s National Statistical System. Government also appointed a Task Force to oversee the implementation of the transformation of the CSO, and has mandated the Task Force to have the NSI implemented by January 2017.
The transformation of the CSO to the NSI entails: - (i) Development of new legislation; (ii) Restructuring of the organisation and governance of the CSO; (iii) Supporting the staff of the CSO during the transition process; (iv) Procurement and installation of an Information System; (v) Completion of a review of existing products and the development of new products; and (vi) Empowerment of various source agencies to produce higher quality data (Strengthening of the supply side).
This transformation exercise has benefited from technical assistance from numerous international partners including CARTAC, PARIS21, UNDP, Statistics Canada, and CARICOM.
Key achievements in addressing the deficiencies experienced in the production and dissemination of national statistics by the CSO include:-
Improved Staff Accommodation: In response to the closure of the National Statistical Building in Port of Spain in 2013, a new building “Plaza 47” was acquired and outfitted to house the CSO. The process of moving CSO staff into Plaza 47 commenced in mid-June 2015, and over seventy-five (75) percent of all officers have now been relocated. This process is expected to be completed shortly.
Strengthened Human Resources: A Memorandum of Understanding (MOU) between the Central Bank of Trinidad and Tobago and the CSO has been implemented resulting in the acquisition of eighteen (18) persons to assist in addressing the backlog of work, bringing the requisite datasets up to date, and meeting deadlines within the National Accounts, Economic Statistics, and Continuous Sample Survey of Population (CSSP) divisions. One hundred and thirty-two (132) employees of the CSO are also currently being regularised so as to enhance staff morale and reduce employee turnover.

2 2
2016THE REAL ECONOMY
On-going Training and Methodological Updates: Following an IMF/CARTAC technical assistance mission in May 2016 on the production of annual GDP and quarterly GDP estimates, new methodologies are currently being developed with the intention of beginning a non-benchmark rebase of the National Accounting GDP estimates with reference year 2012. Further training is also planned in a number or areas including the preparation of quarterly GDP.
Improvements in the Dissemination of Statistics:
• A new CSO website was formally launched in late 2015 and is being continuously updated;
• Labour force reporting is now up to date. The latest Labour Force Bulletin for January to March 2016 was released in August 2016.
• Annual trade data is available for 2012, 2013 and 2014, and finalised monthly trade data is available for the January to October 2015 period. Provisional trade data is available for the period November 2015 to August 2016. By the end of 2016, it is anticipated that the CSO will able to release trade data within one (1) month after the period under review.
Travel statistics on tourist arrivals and departures are currently available for the January 2014 to July 2016 period. The CSO is working with the Immigration Division to address data gaps for the years 2011, 2012 and 2013. The January to June 2016 Travel Bulletin is currently being compiled. Tourism expenditure data for Trinidad and Tobago is now available up to June 2016, and has been produced on a monthly basis since January 2016.
PETROLEUMDrillingThe total number of wells drilled by oil companies fell by 24.0 percent to 57 wells during the first nine months of fiscal 2016, from 75 wells in the previous reporting period. The fall in the number of wells drilled was on account of a 60.0 percent decline in exploratory wells from 5 to 2, and a 21.4 percent drop in development wells from 70 to 55 (Appendix 7).
The total footage drilled during the 2015/2016 period likewise decreased by 5.9 percent from 99.0 thousand metres to 93.2 thousand metres. Approximately 84.4 thousand metres of the total footage drilled were for development purposes (down from the 88.3 thousand metres one year earlier) whilst 8.8 thousand metres were drilled as part of an exploration programme (compared 10.8 thousand metres in the previous corresponding period) (Figure 1).
A disaggregation by land and marine indicates that there was a 35.9 percent decline in onshore drilling from 68.8 thousand metres to 44.1 thousand metres during the
current period, which more than offset a 62.5 percent rise in offshore drilling from 30.2 thousand metres to 49.1 thousand metres.
Figure 1: Development and Exploratory Drilling
Total Depth Drilled Development Drilling Exploratory Drilling
Oct '14/ Jun '15 Oct '15/ Jun '16
Foo
tag
e D
rille
d(T
hous
and
of M
etr
es)
0
20
40
60
80
100
Source: Ministry of Energy and Energy Industries
2 3
THE REAL ECONOMY
Crude Oil and CondensateTrinidad and Tobago’s annual average crude oil and condensate production has been on a downward trajectory, declining every year since fiscal 2006/2007. This has been primarily due to the natural wane in the rate of extraction from the country’s maturing hydrocarbon fields, amidst the absence of significant new crude oil discoveries. After attaining a decade high rate of 148,170 barrels per day in fiscal 2005/2006, production declined steadily, falling below 100,000 barrels per day in fiscal 2010/2011, to an average of 91,976 barrels per day. Regular and at times protracted curtailments to upstream operations for maintenance, upgrade, and rig tie-in activities since 2010 further impacted the output of major energy companies, and by fiscal 2014/2015 production tumbled further to 80,601 barrels per day. This downward trend is expected to continue for most of fiscal 2015/2016.
In addition to Trinidad and Tobago’s larger oil producers, the rapid decline in international oil prices since mid-2014 have been particularly challenging for Petrotrin’s Lease Operators and producers under Petrotrin’s Incremental Production Service Contracts. Lower crude output from these smaller independent oil producers (year-on-year drops of 10.9 percent and 32.8 percent respectively over the October 2015 to June 2016 period) have also contributed to the accelerated rate of decline in production during fiscal 2016, as many operators were forced to reduce their drilling activities, and cancel or postpone investment projects, as a result of the low oil price environment (In contrast, output from Petrotrin’s Farm out producers has held steady during the period, declining marginally by 0.3 percent). Notwithstanding, an increase in Trinidad and Tobago’s national crude oil and condensate output is anticipated sometime between September and December 2016 on account of the commencement of production from new oil and gas fields operated by BPTT, BHP Billiton and EOG Resources.
Over the period October 2015 to June 2016, petroleum companies produced an estimated 73,784 barrels of crude oil and condensate per day. This represented a contraction of 10.0 percent from the 81,987 barrels per day produced over the similar period of fiscal 2014/2015. Condensate production fell by 27.0 percent from 15,202 barrels per day to 11,102 barrels per day, whilst crude oil
production fell by 6.1 percent from 66,785 barrels per day to 62,682 barrels per day (Appendix 7).
Approximately 71.2 percent (52,532 barrels per day) of total crude oil and condensate output was produced in marine areas. This was 10.2 percent lower than the 58,483 barrels per day produced offshore in the previous reporting period. Onshore production also fell by 9.6 percent from 23,504 barrels per day to 21,257 barrels per day, and represented 28.8 percent of total output.
Year-on-year, monthly average crude oil prices fell for twenty-five consecutive months to the end of the review period (July 2016). The price decline in fiscal 2016, however, occurred at a much slower rate than in fiscal 2015. With global growth remaining sluggish and OPEC members (particularly Saudi Arabia) continuing to produce at near maximum levels in an attempt to crowd out the United States’ rival shale oil, an excess supply of crude oil globally (exacerbated by the return of Iranian production, weak global demand growth, and large global inventories) continued to exert downward pressures on oil prices during most of the first half of the fiscal year. These pressures appeared to ease somewhat between March and June as market sentiment improved in response to declines in US shale output and lower output levels from several producers (primarily Canada, Nigeria, Venezuela and Libya) due to unplanned, though sometimes short-term disruptions to production. The oil markets however adopted a more cautionary and bearish approach following Britain’s surprise decision in late June to leave the European Union, as the industry sought to assess the impact of Brexit on the financial markets, global growth and oil prices in the months ahead.
Consequently, during the October 2015 to July 2016 period, the West Texas Intermediate (WTI) price of a barrel of crude oil averaged US$40.63, which was 31.1 percent lower than the average price of US$58.95 obtained during the corresponding fiscal 2014/2015 period. In monthly terms, the average price of a barrel of WTI crude fell steadily from US$46.22 in October to US$30.32 in February, its lowest level since September 2003. The monthly average price then trended upwards over the next four months, rising sharply to US$37.55 per barrel in March, and reaching a fiscal year high of US$48.76 per barrel in June, before receding once again to US$44.65 per barrel in July (Table 3).

2 4
2016THE REAL ECONOMY
The European Brent spot price averaged US$41.33 per barrel over the October 2015 to July 2016 period, a 34.7 percent decline from its US$63.26 per barrel average for the October to July 2014/2015 period. During the current review period, the monthly average European Brent spot price fell sharply from US$48.43 per barrel in October 2015 to US$30.70 per barrel in January 2016 before rising steadily to US$48.25 per barrel in June. The price per barrel subsequently dropped to US$44.95 in July.
The differential in the ten-month average price of a barrel of WTI and European Brent crude oil narrowed to US$0.71 over the 2015/2016 period, from US$4.31 in 2014/2015. In monthly terms, the differential stood at a fiscal year high in October 2015 with Brent exceeding WTI by US$2.21 per barrel. This was however reversed in January and June when the monthly average WTI price exceeded Brent by US$0.98 and US$0.51 per barrel respectively. Notwithstanding, the pricing differences between the two crudes were generally smaller in fiscal 2015/2016 than in the previous fiscal period.
Natural GasAs is the case with crude and condensate output, Trinidad and Tobago’s natural gas output levels have trended downwards in recent years. This pattern began in fiscal year 2010/2011 on account of disruptions to production at upstream facilities to enable major upgrade and maintenance works to be undertaken by BPTT and BHP Billiton. For similar reasons, production declined almost every year thereafter (output only rose in fiscal 2012/2013, by a marginal 0.5 percent), contracting by an average of 2.3 percent over the five-year fiscal 2010/2011 to fiscal 2014/2015 period. The contraction in production
accelerated during fiscal 2014/2015 (when output fell by 5.2 percent) and more so in the current fiscal year 2015/2016. This is because the new gas reserves which have been brought into production in recent years have been insufficient to compensate for losses to output arising from both the naturally declining extraction rates in existing fields and the upstream stoppages associated with the enhanced multi-year upstream work programmes of the major energy companies.
In view of the persistent supply shortages experienced over the past six years therefore, the Government of Trinidad and Tobago has been pursuing strategies to revitalise Trinidad and Tobago’s indigenous natural gas output, and to also access nearby undeveloped Venezuelan natural gas fields as a supplemental source. These strategies include a review of Trinidad and Tobago’s energy sector fiscal (taxation) regime, and the signing of two Agreements with the Government of Venezuela in May 2016, for the purchase by this country of natural gas from Venezuela’s Dragon field, and for the development and production of the 10.3 trillion cubic foot Loran-Manatee cross-border natural gas field.
Natural gas output declined by 9.5 percent during the first nine months of fiscal 2015/2016 to 3,555.2 million standard cubic feet per day, from 3,927.0 million standard cubic feet per day during the corresponding 2014/2015 period (Appendix 8 and Figure 2). This represented the fifth annual decline over the past six years and the seventeenth consecutive year-on-year monthly decline. In monthly terms, expansions in natural gas production have been sporadic since June 2013, with lower output being recorded in all but five months.
Table 3: Oil and Gas Prices
2015 2016
Oct Nov Dec Jan Feb Mar Apr May Jun Jul
Crude Oil (Spot Price US$/Barrel)
West Texas Intermediate 46.22 42.44 37.19 31.68 30.32 37.55 40.75 46.71 48.76 44.65
European Brent 48.43 44.27 38.01 30.70 32.18 38.21 41.58 46.74 48.25 44.95
Natural Gas (US$/Thousand Cubic feet)
Henry Hub 2.34 2.09 1.93 2.28 1.99 1.73 1.92 1.92 2.59 2.82
Source: Energy Information Administration (US)

2 5
industries’ consumption share of total natural gas output rose to 8.0 percent and 2.2 percent respectively. With the stoppage of production at the ArcelorMittal iron and steel plant in October 2015, natural gas utilisation by the Iron and Steel industry more than halved (-51.8 percent) during the fiscal 2015/2016 period, to 44.8 million standard cubic feet per day (from 92.9 million standard cubic feet per day), representing a decrease in consumption share from 2.4 percent to 1.3 percent.
The average Henry Hub natural gas price per thousand cubic feet fell by 30.6 percent to US$2.16 during October 2015 to July 2016, from US$3.12 during the corresponding period of fiscal 2014/2015. This occurred against the backdrop of an ongoing supply glut of shale gas in the United States market that has precipitated a drop in the monthly average Henry Hub price of natural gas for twenty consecutive months (year-on-year), to July 2016. During the current fiscal period, the monthly average Henry Hub price of natural gas fell from US$2.34 per thousand cubic feet in October 2015 to US$1.93 per thousand cubic feet in December. Subsequently, the price rose to US$2.28 per thousand cubic feet in January 2016 before falling once again to US$1.73 per thousand cubic feet in March. The natural gas price then increased slightly and held steady at US$1.92 per thousand cubic feet in April and May, before rising sharply over the following two months to end the period at US$2.82 per thousand cubic feet in July (Table 3).
Liquefied Natural Gas (LNG)Total Liquefied Natural Gas (LNG) production fell sharply, by 14.7 percent to 443.5 trillion British Thermal Units (BTU) during the period October 2015 to June 2016, from 519.9 trillion BTU during October 2014 to June 2015. Over the current nine-month fiscal period, LNG output fell each month on a year-on-year basis, except for a marginal increase of 0.1 percent in May 2016. The sharpest contraction occurred in October 2015 when production fell by 22.0 percent. All other months recorded shortfalls in excess of 12.0 percent. LNG output was constrained during the period by the continued fall in the natural gas supply which resulted from ongoing major upstream works, and an accelerated natural rate of decline in producing gas fields, amidst the loss of the
THE REAL ECONOMYFigure 2: Natural Gas Production and Utilisation
Production Power Generation Ammonia ManufactureMethanol Manufacture Other Utilisation L.N.G.
Oct 2014/Jun 2015 Oct 2015/Jun 2016
Mill
ions
of S
tand
ard
C
ubic
Fe
et p
er d
ay
(MM
SCF/
D)
0
500
1000
1500
2000
2500
3000
3500
4000
Source: Ministry of Energy and Energy Industries
In terms of consumption, half of all end-use classifications recorded higher natural gas utilisation levels during the October 2015 to June 2016 period, whilst the other half reported lower utilisation. The leading user of Trinidad and Tobago’s natural gas was Atlantic LNG, which received 49.6 percent (1,763.9 million standard cubic feet per day) of total national output, for the production of Liquefied Natural Gas (LNG). This was 16.1 percent lower than the 2,101.3 million standard cubic feet per day received during the similar period of fiscal 2015, and also represents a fall in Atlantic’s share of natural gas consumption from 53.5 percent one year earlier.
The quantity of natural gas used for the manufacture of Ammonia rose by 3.7 percent to 554.4 million standard cubic feet per day from 534.7 million standard cubic feet per day, representing an increase in consumption share from 13.6 percent to 15.6 percent. In contrast, the amount of natural gas utilised in the manufacture of Methanol decreased by 2.2 percent, falling from 528.3 million standard cubic feet per day to 516.8 million standard cubic feet per day. The methanol industry’s consumption share, however, increased from 13.5 percent to 14.5 percent during the period under review.
The amount of natural gas used for power generation likewise fell by 3.3 percent to 282.7 million standard cubic feet per day (from 292.2 million standard cubic feet per day), whilst the quantity used in refining increased by 13.2 percent to 78.3 million standard cubic feet per day (from 69.2 million standard cubic feet per day). These
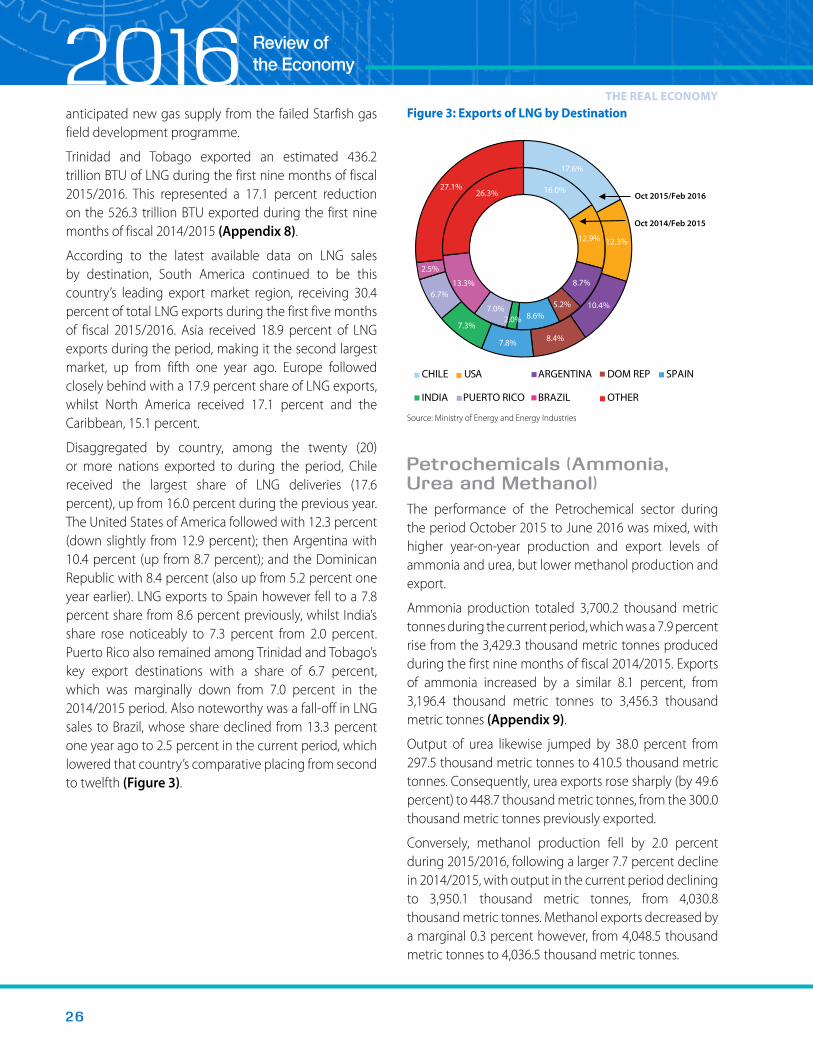
2 6
2016THE REAL ECONOMY
anticipated new gas supply from the failed Starfish gas field development programme.
Trinidad and Tobago exported an estimated 436.2 trillion BTU of LNG during the first nine months of fiscal 2015/2016. This represented a 17.1 percent reduction on the 526.3 trillion BTU exported during the first nine months of fiscal 2014/2015 (Appendix 8).
According to the latest available data on LNG sales by destination, South America continued to be this country’s leading export market region, receiving 30.4 percent of total LNG exports during the first five months of fiscal 2015/2016. Asia received 18.9 percent of LNG exports during the period, making it the second largest market, up from fifth one year ago. Europe followed closely behind with a 17.9 percent share of LNG exports, whilst North America received 17.1 percent and the Caribbean, 15.1 percent.
Disaggregated by country, among the twenty (20) or more nations exported to during the period, Chile received the largest share of LNG deliveries (17.6 percent), up from 16.0 percent during the previous year. The United States of America followed with 12.3 percent (down slightly from 12.9 percent); then Argentina with 10.4 percent (up from 8.7 percent); and the Dominican Republic with 8.4 percent (also up from 5.2 percent one year earlier). LNG exports to Spain however fell to a 7.8 percent share from 8.6 percent previously, whilst India’s share rose noticeably to 7.3 percent from 2.0 percent. Puerto Rico also remained among Trinidad and Tobago’s key export destinations with a share of 6.7 percent, which was marginally down from 7.0 percent in the 2014/2015 period. Also noteworthy was a fall-off in LNG sales to Brazil, whose share declined from 13.3 percent one year ago to 2.5 percent in the current period, which lowered that country’s comparative placing from second to twelfth (Figure 3).
Figure 3: Exports of LNG by Destination
DOM REP USACHILE ARGENTINA SPAIN
INDIA PUERTO RICO BRAZIL OTHER
16.0%
12.9%
8.7%
5.2% 8.6% 2.0%
7.0%
13.3%
26.3%
17.6%
12.3%
10.4%
8.4% 7.8%
7.3%
6.7%
2.5%
27.1% Oct 2015/Feb 2016
Oct 2014/Feb 2015
Source: Ministry of Energy and Energy Industries
Petrochemicals (Ammonia, Urea and Methanol)The performance of the Petrochemical sector during the period October 2015 to June 2016 was mixed, with higher year-on-year production and export levels of ammonia and urea, but lower methanol production and export.
Ammonia production totaled 3,700.2 thousand metric tonnes during the current period, which was a 7.9 percent rise from the 3,429.3 thousand metric tonnes produced during the first nine months of fiscal 2014/2015. Exports of ammonia increased by a similar 8.1 percent, from 3,196.4 thousand metric tonnes to 3,456.3 thousand metric tonnes (Appendix 9).
Output of urea likewise jumped by 38.0 percent from 297.5 thousand metric tonnes to 410.5 thousand metric tonnes. Consequently, urea exports rose sharply (by 49.6 percent) to 448.7 thousand metric tonnes, from the 300.0 thousand metric tonnes previously exported.
Conversely, methanol production fell by 2.0 percent during 2015/2016, following a larger 7.7 percent decline in 2014/2015, with output in the current period declining to 3,950.1 thousand metric tonnes, from 4,030.8 thousand metric tonnes. Methanol exports decreased by a marginal 0.3 percent however, from 4,048.5 thousand metric tonnes to 4,036.5 thousand metric tonnes.

2 7
THE REAL ECONOMYThe export prices for all three petrochemical products fell sharply in fiscal 2016 due to continued oversupply conditions on the global markets. The average Tampa US Gulf Spot price for ammonia decreased by 35.1 percent to US$342.78 per metric tonne during October 2015 to June 2016, from US$527.78 per metric tonne during October 2014 to June 2015. The monthly average ammonia price fell from US$435.00 per metric tonne in October 2015 to US$400.00 per metric tonne in November and December, before dropping further to US$310.00 per metric tonne in January 2016. The Tampa US Gulf Spot Price remained unchanged until March, and then rose to US$320.00 per metric tonne in April, before declining once again to a period low of US$285.00 per metric tonne in June (Figure 4).
Figure 4: Petrochemical Prices (Ammonia, Urea and Methanol)
US$
Ammonia US$/MT
Urea US$/MT
Methanol US$/MT
100
200
300
400
500
Jan-
15Fe
b-15
Mar
-15
Apr
-15
May
-15
Jun-
15Ju
l-15
Aug
-15
Sep-
15O
ct-1
5N
ov-1
5D
ec-1
5Ja
n-16
Feb-
16M
ar-1
6A
pr-1
6M
ay-1
6Ju
n-16
Source: Ministry of Energy and Energy Industries
The export price for urea (US Gulf Granular Barge Spot Price) averaged US$250.44 per metric tonne during the first nine months of fiscal 2016, which was a 30.3 percent fall from the corresponding nine-month average price of US$359.44 per metric tonne one year earlier. In monthly terms, the average price slid from US$276.00 per metric tonne in October 2015 to US$221.00 per metric tonne in January 2016, recovered briefly to US$292.00 per metric tonne in February, but then resumed a downward trajectory to US$201.00 per metric tonne in June.
Similarly, the nine-month average US Gulf Granular Barge Spot price of methanol fell by 45.5 percent to US$206.56 per metric tonne during the fiscal 2015/2016 period, from US$379.00 per metric tonne in fiscal 2014/2015. On a month by month basis, the average US Gulf Granular Barge Spot price of methanol fell precipitously from US$283.00 per metric tonne in October 2015 to US$142.00 per metric tonne in January 2016. The monthly average spot price then rose steadily to US$213.00 per metric tonne in April, then after easing slightly to US$210.00 per metric tonne in May, the price advanced a bit to US$215.00 per metric tonne in June.
AGRICULTUREOverviewA contraction of 6.0 percent is forecasted for the Agriculture sector in calendar 2016, which is a downturn from the 1.2 expansion achieved during calendar 2015. Driving this outlook is reduced economic activity in the largest agricultural sub-sector, Domestic Agriculture which is estimated to decline by 9.3 percent in 2016, its worst performance since 2010. A contraction is also projected in Distilleries, the second largest agricultural sub-sector, with the real value-added of this sub-sector falling by 4.2 percent, marginally more than the 4.1 percent declines recorded in each of the preceding three years. Robust positive growth is however expected to be registered in the smaller Export Agriculture sub-sector, which should rebound strongly in 2016 with growth of 76.8 percent, after declining by 3.4 percent in 2015. The Agriculture sector is projected to account for 0.4 percent of Trinidad and Tobago’s real GDP in 2016 as a result, a level it has maintained since 2012. (Appendices 2 and 3).
Mindful of the longstanding challenges which have constrained the sustainable development of Trinidad and Tobago’s agricultural sector, Government has continued to advance the Commercial Large Farms Programme (CLFP) with the aim of increasing domestic food production, improving food security and correcting the institutional and infrastructural shortcomings within the agricultural sector. These large commercial agricultural farms are targeted at the production

2 8
2016THE REAL ECONOMY
of vegetables and root crops, orchards, cocoa, rice, aquaculture and livestock, and are being operated under public-private partnership arrangements where the State provides paved roadway access along with potable water and electricity to the farm gate. The agri-investor is issued with a long-term renewable agricultural lease and is responsible for the financing, development and operation of the farm in keeping with agreed terms and conditions. The lands on which these farms are located are State Agricultural Lands formerly used primarily for sugar cane cultivation.
The original objective of the CLFP was to establish 15 farms. This was, however, subsequently expanded to 17 farms. At present, 13 farms have been allocated to investors, of which 9 are in production, and 4 are awaiting statutory approvals before production commences. Four (4) farms have not yet been allocated to investors. An update on the operational status of each farm site under the CLFP is provided at Table 4.
Table 4: Operational Status of Farm Sites under the Commercial Large Farms Programme
No. Farm Location Firm Farm
AcreageCommencement
DateMajor Commodities Being Produced
1 Couva PCS Nitrogen 75 January 2010Breadfruit, Papaya, Pommecythere, Sweet Corn, Ochro, Tomato, Lettuce, Hot Pepper, Sweet Pepper, Dasheen Bush, Cucumber
2 Edinburgh Edinburgh Farms 100 July 2011Sweet Corn, Hot Pepper, (Papaya and Cucumber were planted in June)
3 Orange Grove 1 Technology Farms 100 October 2011 Sweet Corn, Hot Pepper, Papaya , Plantain
4 Caroni Two2 Brothers Corp 100 August 2011 Rice
5 Picton IV Evergreen Ranch 262 November 2011 Livestock (Beef Cattle)
6 Picton III Unallocated 267 Unallocated Livestock/Tree Crops
7 Orange Grove 2 Kent Farms Limited 44 July 2014 Aquaculture – Not Yet in Production
8 Orange Grove 3 O G Rice Producers 156 August 2013 Rice
9 Bejucal Two2 Brothers Corp 171 April 2015 Rice – Not Yet in Product ion
10 Felicity Fazal Akaloo 215 June 2014 Rice
11 La Gloria 1 AGA Agriculture 148 Awaiting approvals Short-term crops - Not Yet In Production
12 La Gloria 2 Garden Choice 147 July 2012 Orange, Mango, Guava, Passion Fruit, Pumpkin, Sweet Corn, Hot pepper
13 Picton I Unallocated 241 Unallocated Livestock/Tree Crops
14 Picton 11 Unallocated 220 Unallocated Livestock/Tree Crops
15 Picton V Trinidad and Tobago Small Ruminant Dev. Co.
104 July 2015 Small Ruminants – Not Yet In Production
16 Mora Valley Unallocated 151 Unallocated Cocoa
17 Tucker ValleyCaribbean Chemicals and Agency Ltd
100 July 2013Onion, Sweet Corn, Plantain, Green String Beans, Dwarf Bodi Beans, Tomatoes, Cauliflower
Source: Ministry of Agriculture, Land and Fisheries

2 9
Vegetables
During the first five months of fiscal 2016 (October 2015 to February 2016) the production performances of vegetable crops were uneven, when compared to one year earlier. There were output gains for dasheen bush (107.7 percent), hot peppers (95.0 percent), tomatoes (53.2 percent), melongene (48.4 percent), ochro (36.2 percent), and pumpkin (27.0 percent). However, reduced output were reported for other vegetables, including sweet pepper (60.6 percent), patchoi (59.7 percent), lettuce (40.2 percent), and cucumber (12.3 percent). These declines were mainly due to unfavorable weather conditions, and the challenges posed by pests and disease.
Other CropsPineapple
Pineapple production fell by 12.9 percent from 579,300 kg to 504,300 kg during the review period, as farmers reduced the acreages planted in response to labour shortages. Pineapple farmers are however reported to be seeking to increase production in the upcoming year to facilitate the establishment of a privately owned pineapple processing plant.
Paw Paw
Paw Paw production decreased by 36.8 percent to 496,300 kg, from 785,000 kg due to the increased prevalence of pest and disease as well as a reduction in the acreage planted.
Livestock and Dairy ProductsPoultry
The latest available CSO data indicates that there was a 1.8 percent decrease in broiler meat production during the first quarter of fiscal 2016 to 16.7 million kg, from 17.0 million kg, in the first quarter of fiscal 2015. The decline in output has been attributed to an increase in the cost of feed and to the extreme high temperatures experienced during the fiscal 2016 period. These factors impacted the performance and physiological response of broiler chickens, resulting in smaller birds reaching maturity.
During the six-month fiscal October 2015 to March 2016 period, the agriculture sector exhibited a mixed performance when compared to the comparative 2014/2015 period. There were increases in the production of most root crops and some vegetables. However, there were decreases in the production of most meats and some fruits. Details on the production of some agricultural products during the period are provided below.
Domestic AgricultureRoot Crops
There were increases in the production of most root crops during the first half of fiscal 2016. Cassava output increased by 215.8 percent (from 534.1 kg to 1,686.8 kg); eddoes output rose by 56.9 percent (from 822.9 kg to 1,291.1 kg); and the output of ginger by 29.0 percent (from 285.1 kg to 367.7 kg). Increased production was also recorded for sweet potato (23.9 percent, from 799.7 kg to 991.0 kg) which was achieved despite an infestation of sweet potato weevil in the latter part of 2015. In contrast, dasheen production declined by 32.8 percent, from 1,213.4 kg to 815.1 kg. The support of the Ministry of Agriculture, Land and Fisheries (MALF) via the provision of infrastructure, institutional and technical support to farmers has positively impacted the performance of root crops during the period.
Copra
Production of Copra rose by 90.8 percent from 17,698 kg to 33,764 kg during the review period. Support from the Ministry of Trade and Industry via the Coconut Subsidy, as well as the implementation of the Coconut Rehabilitation and Replanting Programme by the MALF has stimulated the sub-sector.
Rice
The production of rice declined by 41.0 percent from 2,146,430 kg to 1,266,010 kg, primarily on account of low crop yield due to the poor viability of imported rice seeds. Farmers were also hindered during the period by their inability to obtain water abstraction licenses in a timely manner.
THE REAL ECONOMY

3 0
2016Notwithstanding, broiler meat output is expected to trend upwards during the remainder of fiscal 2016.
Small Ruminants
Mutton production declined by 3.9 percent to 32,155 kg, during the first quarter of fiscal 2016, from 33,454 kg, one year earlier, on account of increased costs of inputs.
Goat meat production also declined during the period, from 24,955 kg, to 14,025 kg, or by 43.8 percent. This was due to a number of factors including a limited supply of quality breeding stock; the high cost of inputs (feed, drugs and other consumables); the use of labour intensive production systems amidst a scarcity of trained labour; and the prevalence of praedial larceny, each of which reduced production efficiencies at the farm level.
Dairy and Beef
During the first quarter of fiscal 2016 dairy milk production decreased by 9.0 percent to 807,100 litres from 887,100 litres in the corresponding fiscal 2015 quarter. The decline in milk output resulted from the exit of dairy farmers from the industry, increased costs of production and insufficient application of technology to production methods. The industry is characterised by small farms that are below an economically viable size, the absence of modern technology in the production process, heavy reliance on feed concentrates, and poor pasture development.
Production of beef and veal also fell during the period, from 111,241 kg to 73,675 kg, or by 33.8 percent.
Pigs
Approximately 29,938 live pigs were sold during the first quarter of 2016, 12.1 percent below the 34,040 sold in first quarter of 2015. A shortage of labour, increased competition from imports, the high cost of feed and challenges related to waste disposal have continued to negatively impact the industry.
Export AgricultureCocoa
Official cocoa production data for fiscal 2016 is not yet available. However, the industry continues to experience a number of challenges including a decline in the number of active cocoa farmers, labour shortages and
THE REAL ECONOMYinadequate infrastructural development in some cocoa growing areas. The Government is therefore continuing to work towards the operationalisation of the Cocoa Development Company of Trinidad and Tobago (CDCTT) in order to provide institutional and sector support to cocoa farmers.
MANUFACTURINGOverviewDuring 2015 the Manufacturing sector was negatively impacted by the slowdown and subsequent stoppage of production at the country’s major iron and steel manufacturing facility due to weak prices and demand. The Manufacturing sector is expected to further contract in 2016 as domestic consumption demand softens during the nation’s current economic adjustment period, and the permanent loss of production from the closure of the iron and steel plant in March 2016 is fully registered. The depth of the contraction in manufacturing output is being moderated however, by the commencement of exports of selected Trinidad and Tobago manufactured products to Venezuela from June 2016 onwards through a Trade Agreement between both countries, which is being financed by a US$50 million revolving fund created by the Government of Venezuela.
The latest available data from the CSO on economic activity within Trinidad and Tobago suggests that the Manufacturing sector should contract sharply in real terms, by 5.7 percent during 2016, following its modest expansion of 1.6 percent in 2015. The Manufacturing sector’s contribution to GDP is as a consequence expected to decline to 7.8 percent in the current calendar year from 8.1 percent in the previous year (Appendices 2 and 3).
The adverse outturn for Manufacturing is premised on negative growth projections for all Manufacturing sub-industries, with the exception of Printing, Publishing etc. The Food Beverages and Tobacco sub-industry, the largest contributor to manufacturing GDP, is expected to contract by 5.8 percent. This is a sharp reversal from the 7.9 percent growth achieved in 2015.
Real economic activity in the second largest manufacturing sub-industry, Chemicals and Non-
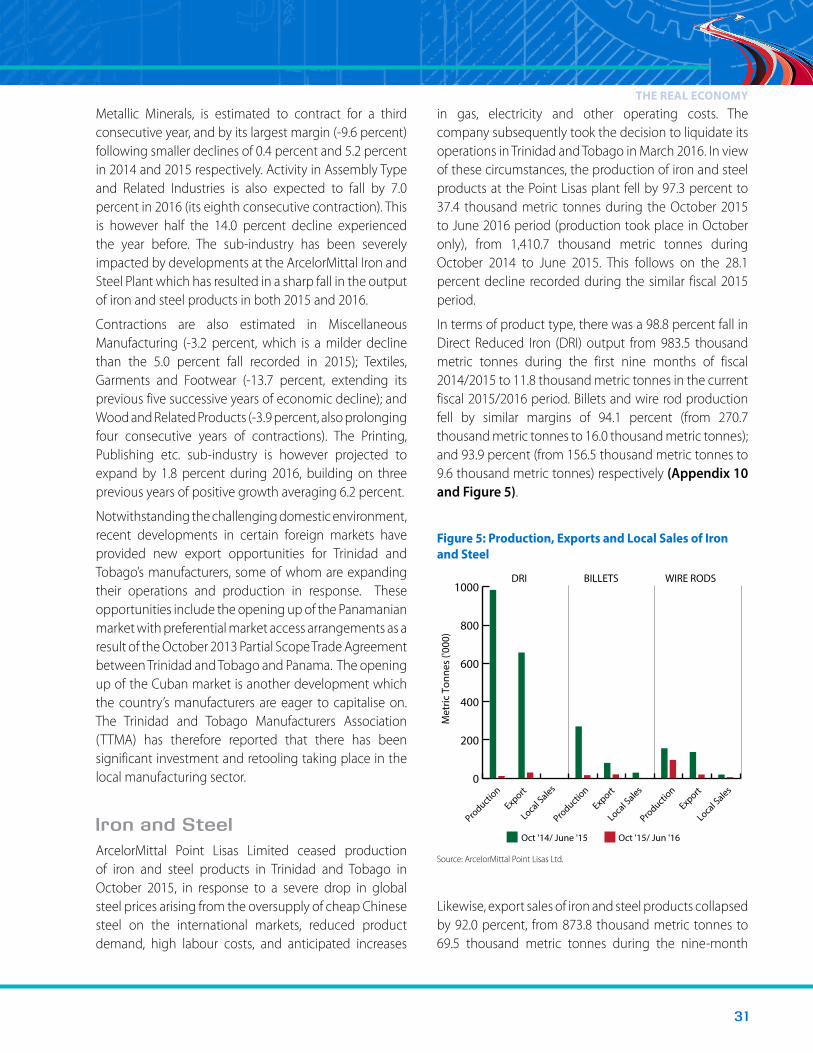
3 1
in gas, electricity and other operating costs. The company subsequently took the decision to liquidate its operations in Trinidad and Tobago in March 2016. In view of these circumstances, the production of iron and steel products at the Point Lisas plant fell by 97.3 percent to 37.4 thousand metric tonnes during the October 2015 to June 2016 period (production took place in October only), from 1,410.7 thousand metric tonnes during October 2014 to June 2015. This follows on the 28.1 percent decline recorded during the similar fiscal 2015 period.
In terms of product type, there was a 98.8 percent fall in Direct Reduced Iron (DRI) output from 983.5 thousand metric tonnes during the first nine months of fiscal 2014/2015 to 11.8 thousand metric tonnes in the current fiscal 2015/2016 period. Billets and wire rod production fell by similar margins of 94.1 percent (from 270.7 thousand metric tonnes to 16.0 thousand metric tonnes); and 93.9 percent (from 156.5 thousand metric tonnes to 9.6 thousand metric tonnes) respectively (Appendix 10 and Figure 5).
Figure 5: Production, Exports and Local Sales of Iron and Steel
Oct '14/ June '15 Oct '15/ Jun '16
Met
ric T
onne
s ('0
00)
DRI BILLETS WIRE RODS
Local S
ales
Producti
on
Export
Local S
ales
Producti
on
Export
Local S
ales
Producti
on
Export0
200
400
600
800
1000
Source: ArcelorMittal Point Lisas Ltd.
Likewise, export sales of iron and steel products collapsed by 92.0 percent, from 873.8 thousand metric tonnes to 69.5 thousand metric tonnes during the nine-month
THE REAL ECONOMY
Metallic Minerals, is estimated to contract for a third consecutive year, and by its largest margin (-9.6 percent) following smaller declines of 0.4 percent and 5.2 percent in 2014 and 2015 respectively. Activity in Assembly Type and Related Industries is also expected to fall by 7.0 percent in 2016 (its eighth consecutive contraction). This is however half the 14.0 percent decline experienced the year before. The sub-industry has been severely impacted by developments at the ArcelorMittal Iron and Steel Plant which has resulted in a sharp fall in the output of iron and steel products in both 2015 and 2016.
Contractions are also estimated in Miscellaneous Manufacturing (-3.2 percent, which is a milder decline than the 5.0 percent fall recorded in 2015); Textiles, Garments and Footwear (-13.7 percent, extending its previous five successive years of economic decline); and Wood and Related Products (-3.9 percent, also prolonging four consecutive years of contractions). The Printing, Publishing etc. sub-industry is however projected to expand by 1.8 percent during 2016, building on three previous years of positive growth averaging 6.2 percent.
Notwithstanding the challenging domestic environment, recent developments in certain foreign markets have provided new export opportunities for Trinidad and Tobago’s manufacturers, some of whom are expanding their operations and production in response. These opportunities include the opening up of the Panamanian market with preferential market access arrangements as a result of the October 2013 Partial Scope Trade Agreement between Trinidad and Tobago and Panama. The opening up of the Cuban market is another development which the country’s manufacturers are eager to capitalise on. The Trinidad and Tobago Manufacturers Association (TTMA) has therefore reported that there has been significant investment and retooling taking place in the local manufacturing sector.
Iron and SteelArcelorMittal Point Lisas Limited ceased production of iron and steel products in Trinidad and Tobago in October 2015, in response to a severe drop in global steel prices arising from the oversupply of cheap Chinese steel on the international markets, reduced product demand, high labour costs, and anticipated increases

3 2
2016fiscal 2016 period on account of the closure of the Point Lisas facility. Disaggregated by product, export sales of billets decreased by 75.0 percent to 20.1 thousand metric tonnes, from 80.2 thousand metric tonnes; whilst exports of DRI fell by 95.4 percent from 656.4 thousand metric tonnes to 30.0 thousand metric tonnes. A slightly smaller fall of 85.9 percent was also recorded in the export sales of wire rods over the 2015/2016 period (from 137.2 thousand metric tonnes to 19.4 thousand metric tonnes).
In terms of the export prices for iron and steel products, the three month contract price per tonne of DRI fell from US$216.00 in September 2015 to US$170.00 in October 2015. This was a 45.7 percent fall from the US$313.00 per tonne received in October 2014. During the previous nine months of calendar 2015, the three-month contract price spiraled downwards, falling by 12.1 percent to US$275.00 per tonne during January to March, then by a further 16.0 percent in the April to June period, and again by another 6.5 percent to US$216.00 per tonne during July to September. The average contract price of DRI over the January to October 2015 period was US$223.00 per tonne, which was 32.8 percent below the average contract price of US$332.00 per tonne over the same period in 2014.
The export price per tonne of billets also fell precipitously by 43.6 percent from US$480.00 in October 2014 to US$270.50 in October 2015. This was the final price received for billet exports as production ceased that month. Earlier in the calendar year the price tumbled by 31.8 percent from US$434.38 per tonne in January to US$296.25 per tonne in September. Over the ten-month 2015 period the export price averaged US$360.60 per tonne, reflecting a contraction of 27.2 percent, from the average price of US$495.16 per tonne in 2014.
Similarly, the export price of wire rods contracted by 42.5 percent to US$328.00 per tonne in October 2015, from US$570.00 per tonne one year earlier. During the course of calendar 2015 wire rod prices plunged, falling by 11.4 percent to US$505.00 per tonne in April and May 2015 (from US$570.00 per tonne in January), dropping another 18.8 percent to US$410.00 per tonne in July and August, and by a further 11.0 percent to US$365.00 per tonne in September, prior to its 10.1 percent fall in October. Over the January to October 2015 period, the average export price of wire rods fell by 22.4 percent to US$454.93 per
THE REAL ECONOMY
tonne from US$586.29 per tonne in the corresponding calendar 2014 period.
Driven by the termination of operations of the local steel manufacturer, the sale of domestically produced steel products within the Trinidad and Tobago market plummeted by 86.1 percent, from 49.2 thousand metric tonnes to 6.9 thousand metric tonnes during the fiscal 2015/2016 review period. Local sales of billets declined by 97.1 percent (from 29.5 thousand metric tonnes to 0.9 thousand metric tonnes); whilst the sale of wire rods on the local market fell less sharply, by 69.5 percent, from 19.6 thousand metric tonnes to 6.0 thousand metric tonnes, on account of the sale of the remaining wire rod inventories during the first three quarters of the fiscal year.
CementThere was lower demand for cement in Trinidad and Tobago’s domestic market and in some export markets during the period October 2015 to June 2016. As a consequence, cement production fell by 13.0 percent to 557.6 thousand metric tonnes, from 640.6 thousand metric tonnes one year earlier (Figure 6). Production contracted over most of the nine-month period with the sharpest year-on-year declines taking place in May (29.4 percent) and June (21.9 percent). There were however small increases in output in December 2015 (0.4 percent) and January 2016 (2.9 percent).
Total cement sales fell by 12.8 percent during the 2015/2016 review period to 557.6 thousand metric tonnes, from 639.7 thousand metric tonnes in the previous comparative period, reflecting declines in both local and export sales. Local cement sales contracted by 16.0 percent to 421.7 thousand metric tonnes from 501.8 thousand metric tonnes. The fall-off in local sales during the first nine months of fiscal 2016 could be attributed to the de-stimulating effects of a weaker economy amidst lower global energy prices. The reduced domestic demand for cement reflected therefore, the resultant general slowdown in construction activity. Additionally, local cement demand was negatively impacted by the customary slowdown in the rate of implementation of public sector capital projects following the change in government in September 2015, as the new
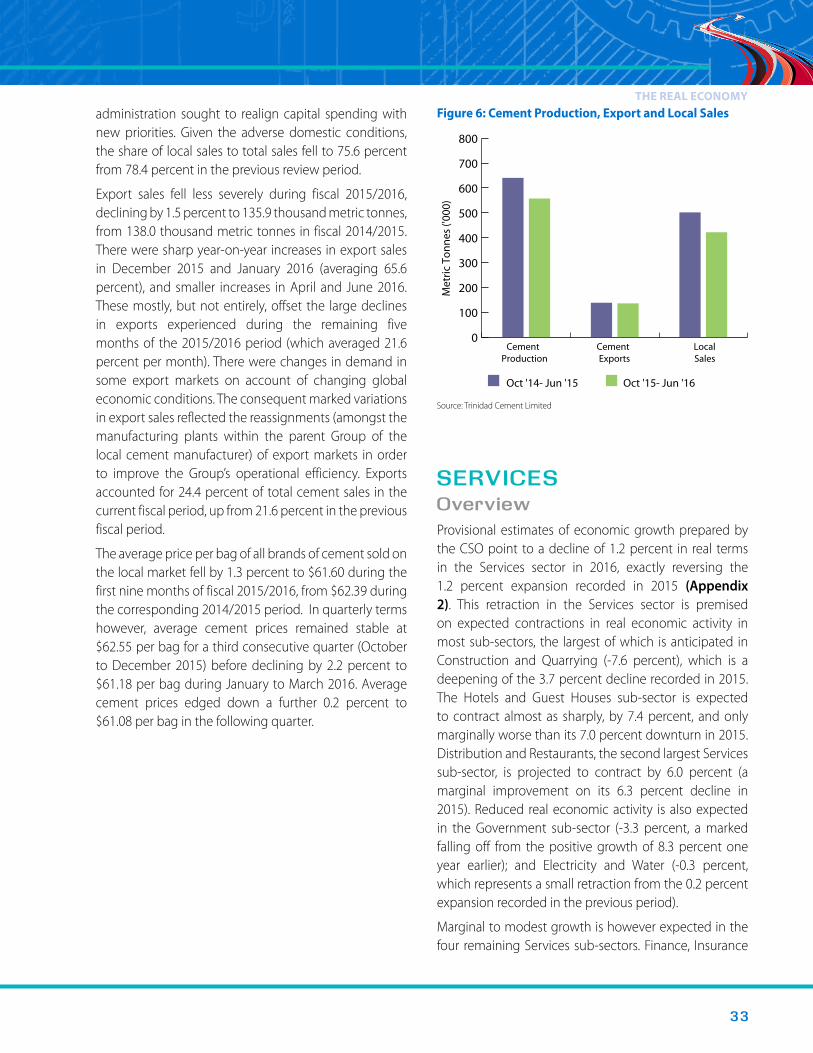
3 3
Figure 6: Cement Production, Export and Local Sales
Oct '14- Jun '15 Oct '15- Jun '16
Cement Production
CementExports
LocalSales
Met
ric T
onne
s ('0
00)
0
100
200
300
400
500
600
700
800
Source: Trinidad Cement Limited
SERVICESOverviewProvisional estimates of economic growth prepared by the CSO point to a decline of 1.2 percent in real terms in the Services sector in 2016, exactly reversing the 1.2 percent expansion recorded in 2015 (Appendix 2). This retraction in the Services sector is premised on expected contractions in real economic activity in most sub-sectors, the largest of which is anticipated in Construction and Quarrying (-7.6 percent), which is a deepening of the 3.7 percent decline recorded in 2015. The Hotels and Guest Houses sub-sector is expected to contract almost as sharply, by 7.4 percent, and only marginally worse than its 7.0 percent downturn in 2015. Distribution and Restaurants, the second largest Services sub-sector, is projected to contract by 6.0 percent (a marginal improvement on its 6.3 percent decline in 2015). Reduced real economic activity is also expected in the Government sub-sector (-3.3 percent, a marked falling off from the positive growth of 8.3 percent one year earlier); and Electricity and Water (-0.3 percent, which represents a small retraction from the 0.2 percent expansion recorded in the previous period).
Marginal to modest growth is however expected in the four remaining Services sub-sectors. Finance, Insurance
administration sought to realign capital spending with new priorities. Given the adverse domestic conditions, the share of local sales to total sales fell to 75.6 percent from 78.4 percent in the previous review period.
Export sales fell less severely during fiscal 2015/2016, declining by 1.5 percent to 135.9 thousand metric tonnes, from 138.0 thousand metric tonnes in fiscal 2014/2015. There were sharp year-on-year increases in export sales in December 2015 and January 2016 (averaging 65.6 percent), and smaller increases in April and June 2016. These mostly, but not entirely, offset the large declines in exports experienced during the remaining five months of the 2015/2016 period (which averaged 21.6 percent per month). There were changes in demand in some export markets on account of changing global economic conditions. The consequent marked variations in export sales reflected the reassignments (amongst the manufacturing plants within the parent Group of the local cement manufacturer) of export markets in order to improve the Group’s operational efficiency. Exports accounted for 24.4 percent of total cement sales in the current fiscal period, up from 21.6 percent in the previous fiscal period.
The average price per bag of all brands of cement sold on the local market fell by 1.3 percent to $61.60 during the first nine months of fiscal 2015/2016, from $62.39 during the corresponding 2014/2015 period. In quarterly terms however, average cement prices remained stable at $62.55 per bag for a third consecutive quarter (October to December 2015) before declining by 2.2 percent to $61.18 per bag during January to March 2016. Average cement prices edged down a further 0.2 percent to $61.08 per bag in the following quarter.
THE REAL ECONOMY

3 4
2016and Real Estate etc, the largest Services sub-sector, is projected to expand by 3.7 percent, which is albeit less than half of its 8.4 percent growth estimate for 2015. In contrast, growth in the Transport, Storage and Communication sub-sector is expected to accelerate to 2.1 percent from 1.8 percent in 2015; whilst the Education and Cultural Services sub-sector is expected to expand at double the rate from one year ago (from 0.7 percent in 2015 to 1.4 percent in 2016). Growth in the Personal Services sub-sector is expected to remain at marginal levels in 2016 however (0.4 percent), very similar to the flat 0.7 percent expansion experienced in 2015.
ConstructionThe Construction and Quarrying sub-sector is expected to contract by 7.6 percent in 2016, a further deterioration from its 3.7 percent contraction in 2015. The sector’s share of GDP is therefore projected to fall marginally to 4.7 percent, from 4.9 percent in 2015 (Appendices 2 and 3).
The sub-sector’s worsened 2016 outturn is on account of the cut back in fiscal injections into the non-petroleum sector due to lower fiscal revenue and the customary slowdown in public sector capital spending as projects are streamlined in the year following the election of a new Government. The performance of the sub-sector has also been negatively impacted by reduced private sector construction activity due to the de-stimulating effects of economic adjustment. The resultant weaker demand for construction material has been apparent in the reduced local sales of major construction materials such as cement and iron and steel products, the latter being a contributor to the closure of the country’s major iron and steel plant earlier in the year.
Tourism 17
The total number of air and cruise passenger arrivals to Trinidad and Tobago increased by 14.1 percent to 519,330 persons in calendar 2015 from 455,269 persons one year earlier. This was primarily attributable to a significant increase in the number of passengers arriving
17 Source: Ministry of Tourism, Port Authority of Trinidad and Tobago (PATT) and Tobago House of Assembly (THA)
THE REAL ECONOMYby cruise ship, which was complemented by a modest rise in airline arrivals.
Total visits to Trinidad and Tobago by air and sea also rose over the January to June 2016 period, with 278,444 persons arriving; and 3.9 percent above the 267,895 visitors received during the same period in 2015. A sharp increase in cruise ship arrivals more than offset a decline in air arrivals during the 2016 period.
Airline Arrivals
Approximately 439,749 persons visited Trinidad and Tobago by air during calendar 2015, an increase of 6.6 percent from the 412,447 visitors in 2014. Arrivals to Trinidad rose by 8.0 percent from 386,262 persons in 2014 to 417,314 persons in 2015, increasing its share of total air arrivals from 93.7 percent to 94.9 percent. The number of visitors to Tobago, however, fell by 14.3 percent from 26,185 persons to 22,435 persons, which lowered the island’s share of air arrivals to 5.1 percent in 2015 from 6.3 percent in 2014.
Over the 2015 period, the major source market for international air arrivals to Trinidad and Tobago was North America (53.5 percent), of which 41.4 percent came from the United States and 12.1 percent from Canada. The other major sources of air visitors during the period were, the Caribbean (18.3 percent) and Europe (primarily the United Kingdom at 8.4 percent). The leading reasons why foreign nationals travelled to Trinidad and Tobago during 2015 were to visit friends and relatives (38.1 percent); for leisure or beach vacation (21.6 percent); and for business or to attend a convention (14.7 percent).
Airline visitor arrivals fell by 5.9 percent to 209,778 persons over the six-month period January to June 2016 this compares to 222,946 persons received over the corresponding period in 2015. A total of 199,183 persons visited Trinidad (4.5 percent less than the 208,659 persons which visited during the first six months of 2015), and 10,595 persons visited Tobago (a 25.8 percent decline from the 14,287 arrivals to the island one year earlier). Trinidad’s share of air visitors increased from 93.6 percent during January to June 2015 to 94.9 percent during January to June 2016, whilst Tobago’s share fell to 5.1 percent from 6.4 percent.

3 5
Figure 7: Prices – Percentage Change (Year-on-Year)
Headline Food Core Pe
rce
nt (
%)
6102 5102
0
3
6
9
12
15
Jan
ua
ry
Feb
rua
ry
Ma
rch
Ap
ril
Ma
y
Jun
e
July
Au
gu
st
Sep
tem
be
r
Oc
tob
er
No
vem
be
r
De
ce
mb
er
Jan
ua
ry
Feb
rua
ry
Ma
rch
Ap
ril
Ma
y
Jun
e
Source: Central Statistical Office
The general rise in food prices, the main driver of overall inflation, more than doubled, however, from 4.5 percent in January 2016 to 9.4 percent in February 2016. Food price inflation subsequently fluctuated, decreasing to 8.6 percent in March, rising to 10.0 percent in April, before declining again to 9.5 percent and 9.4 percent in May and June respectively. The general increase in food price inflation over the period was attributed to sharper price increases for Vegetables (15.5 percent); Non-Alcoholic Beverages (15.5 percent); Food Products not elsewhere classified (21.8 percent), particularly Salt, Pepper and Spices and Culinary Herbs and Seasoning Mix; and Bread, Cereal and Cereal Preparations (7.3 percent). These inflationary pressures were however tempered by stable core inflation 20 which, on average, held steady at 2.1 percent, with a marginal variation to 2.0 percent and 2.2 percent in January and March respectively.
On a calendar year-to-date basis, the All Items RPI (headline) increased by 1.9 percent during the period January to June 2016, as compared to the 0.0 percent rate recorded for the similar six-month period of 2015. A reversal from non-existent or deflationary pressures
20 Core inflation measures the rate of change in All Items in the Index of retail Prices excluding Food and Non-alcoholic Beverages.
Cruise Ship Arrivals
The total number of cruise ships which berthed in Trinidad and Tobago in calendar 2015, increased by 79.5 percent to 70 vessels from the 39 vessels which docked in calendar 2014. In 2015, a total of 79,581 passengers travelled to the islands aboard these ships, which was 85.8 percent higher than the 42,822 passengers who disembarked in 2014. Of those that visited during 2015, Trinidad received 15,024 persons, a 14.8 percent increase from the 13,085 tourists that came ashore in 2014; whilst Tobago received 64,557 persons, a 117.1 percent rise over the 29,737 cruise arrivals in 2014.
Cruise arrivals continued to increase in 2016 with 47 cruise vessel calls during the January to June 2016 period 18, a 17.5 percent rise over the corresponding period in 2015 when 40 vessels docked. During the six-month 2016 period, a total of 68,666 cruise passengers stopped over in Trinidad and Tobago, representing a 52.8 percent increase from the 44,949 passengers that landed in the first half of calendar 2015. Trinidad received 21,023 passengers onboard 14 vessels in the 2016 period, compared to the 5,278 passengers onboard 8 vessels in 2015, whilst Tobago welcomed 47,643 passengers upon 33 vessels up from 39,671 passengers onboard 32 vessels one year earlier.
PRICESHeadline inflation19 remained contained within the low single digits during the first six months of calendar 2016, holding relatively steady between 3.3 percent and 3.5 percent for most of the period. Starting the year at 2.4 percent, the year-on-year rate of change in the All Items Retail Price Index (RPI) increased to 3.4 percent in February, edged down to 3.3 percent in March before nudging upward to 3.5 percent in April. Headline inflation settled at 3.4 percent over the remaining two months (Figure 7). Overall inflation rates in Trinidad and Tobago have as a consequence remained below 5.0 percent since August 2015.
18 The annual cruise season typically extends from October to May each year.
19 Headline inflation measures the rate of change in All Items in the Index of Retail Prices.
THE REAL ECONOMY

3 6
2016to inflationary pressures for Food (from -1.4 percent to 5.1 percent); Transport (from -0.1 percent to 3.0 percent); and Communication (from 0.0 percent to 10.1 percent); as well as stronger price increases for Health (from 1.0 percent to 3.5 percent) were the main drivers of this outcome (Appendix 11). The turnaround in food price inflation was driven by price increases for Vegetables (5.5 percent); Food Products not elsewhere classified (13.1 percent); and Bread, Cereal and Cereal Preparations (5.6 percent). Core inflation, however, slowed to 1.1 percent from 1.4 percent due to lower inflation rates for Recreation and Culture (0.1 percent compared to 6.0 percent) and lower prices for Housing (-0.7 percent); and Miscellaneous Goods and Services (-0.3 percent).
Annual average headline inflation fell to 4.7 percent in 2015 from 5.8 percent in 2014 on account of a decrease in inflation rates for Food (8.6 percent from 10.0 percent); Transport (1.0 percent from 2.8 percent); Miscellaneous Goods and Services (4.7 percent form 5.7 percent); and Health (1.0 percent form 3.0 percent) (Appendix 11).
On a month by month basis, year-on-year headline inflation plummeted from 7.6 percent in January 2015 to 1.4 percent in November before increasing marginally to 1.5 percent in December. There were small fluxes in the rate during a few months of 2015 but inflation generally trended downward over the period (Figure 7).
The trend in headline inflation during 2015 reflected the wavering but general easing in pressure on food prices. Food price inflation oscillated between single and double digits during the year falling from 14.6 percent in January to 8.5 percent in May, rising to 11.4 percent by July, before falling once again to 8.1 percent in August. These inflationary pressures picked up once more in September, increasing to 11.0 percent, before plunging to a fifty-two (52) month low of 2.2 percent in November. Food inflation then increased marginally to 2.7 percent in December. A sharp deceleration in the price increases for Food Products not elsewhere classified (including Salt, Pepper and Spices) in conjunction with price decreases for Vegetables and Milk, Cheese and Eggs were the primary influences behind the movements in food inflation during 2015.
Core inflation decelerated slightly to an annual average rate of 1.8 percent in 2015 from 2.1 percent in 2014. In monthly terms, core inflation exhibited some
THE REAL ECONOMYslight fluctuation during most of calendar 2015 before accelerating in the final three months. The rate rose from 1.5 percent year-on-year in January to 2.3 percent in December. The trajectory of core inflation was strongly influenced by developments in Recreation and Culture. Following a fall in Recreation and Culture prices during January to March (-1.4 percent), inflationary pressures returned within this sub-group in April. After a gradual rise in the subsequent months, Recreation and Culture prices jumped in October (7.7 percent) and then held steady for the remainder of the year. Accelerated price rises were also recorded for Miscellaneous Goods and Services (from 3.0 percent in January to 5.5 percent in December); Clothing and Footwear (from 4.2 percent to 5.9 percent); and Hotels, Cafes and Restaurants (from 1.0 percent to 4.8 percent).
PRODUCTIVITYDuring the twelve-month fiscal 2015 period, the All Items Productivity Index21, which measures the productivity of all workers in all industries in Trinidad and Tobago, fell by 1.4 percent. This follows on the 1.1 percent gain in productivity which was realised during fiscal 2014 (Appendix 11).
The productivity of all workers in all industries declined by 7.1 percent year-on-year in the first fiscal quarter (October to December 2015), a further weakening on the 5.2 percent productivity loss recorded in the first quarter of fiscal 2015. This outcome reflected lower productivity levels in Assembly Type and Related Products (-70.1 percent) primarily from the cessation of production at the ArcelorMittal Iron and Steel Plant in October 2015; Textiles, Garments and Footwear (-17.8 percent); which reflected a decline in the industry’s Domestic Production Index (DPI) of approximately 19 percent, amidst a smaller decline of about 2 percent in its Index of Hours Worked; Printing, Publishing and Paper Converters (-3.6 percent); Water (-3.6 percent); and Food Processing (-2.1 percent). The contractions in productivity in the aforementioned industries surpassed the higher productivity levels achieved in Petrochemicals (46.0 percent); Oil and Natural Gas Refining (40.4 percent); Exploration and
21 The All Items Productivity Index is calculated as the ratio of the Index of Domestic Production (DPI) to the Index of Hours Worked.
3 7
POPULATIONThe Central Statistical Office’s mid-year population estimates for 2016 indicate a 0.3 percent increase in Trinidad and Tobago’s population, to 1,353,895 persons from 1,349,667 persons in 2015. The number of births per thousand persons, also known as the provisional birth rate, is projected to decline from 14.0 in 2015 to 12.83 in 2016. The provisional death rate per thousand persons is likewise projected to decline from 8.58 in 2015 to 8.23 in 2016 (Appendix 12).
The composition of Trinidad and Tobago’s population in terms of age and gender is expected to remain the same for a fourth consecutive year, with persons aged 24 years or younger representing 36.6 percent of the population and those 60 years and over representing 13.4 percent. The remaining 50.0 percent of the population are within the ages of 25 years to 59 years (Appendix 13). In terms of gender distribution, 50.2 percent of the population (679,288 persons) are male, whilst 49.8 percent (674,607 persons) are female (Appendix 12).
LABOUR FORCE AND EMPLOYMENTUnemploymentThe rate of unemployment in Trinidad and Tobago increased for a third successive quarter to 3.8 percent in the January to March 2016 period; marginally above the 3.5 percent level recorded during October to December 2015 (Appendix 14). This was driven by a rise in the number of unemployed persons from 22,300 to 24,100. On a sectoral basis, the highest unemployment rates were reported in: Other Mining and Quarrying (30.0 percent); Construction (6.6 percent); Petroleum and Gas (5.8 percent); and Wholesale and Retail Trade, Restaurants and Hotels (4.9 percent). In contrast, unemployment rates below the national average were recorded in: Other Agriculture, Forestry, Hunting and Fishing (1.4 percent); Transport, Storage and Communication (1.6 percent); Community, Social and Personal Services (2.5 percent); Electricity and Water (2.9 percent); Finance, Insurance, Real Estate and Business Services (3.1 percent); and Other Manufacturing (3.6 percent).
Production of Oil and Natural Gas (15.7 percent); Drink and Tobacco (11.5 percent); Wood and Related Products (9.7 percent); Miscellaneous Manufacturing (8.1 percent); Chemicals (4.6 percent); and Electricity (2.7 percent). The sharp increases in productivity in Petrochemicals and Oil and Natural Gas Refining during the quarter were due to notable increases in their respective production indices (approximately 41 percent and 30 percent respectively), concurrent with a decline in the Index of Hours Worked (a marginal -0.03 percent in Petrochemicals and about -8 percent in Refining). Conversely, an estimated fall of about 21 percent in the Index of Hours Worked for Exploration and Production of Oil and Natural Gas in the first quarter, outstripped a smaller decline of about 8 percent in the industry’s DPI, resulting in the sharp rise in productivity observed. Overall, productivity in the non-energy sector contracted by 22.6 percent, a significant deterioration from the 1.4 percent decline recorded in the first quarter of fiscal 2015.
There was a further reduction in the productivity of all workers in all industries in the second quarter of fiscal 2016, with a year-on-year loss of 5.4 percent (sharper than the 2.2 percent year-on-year decline over the same period in fiscal 2015). The decrease in productivity in the most recent quarter was driven by productivity losses in Assembly Type and Related Products (-69.7 percent), reflecting the absence of ArcelorMittal; Textiles, Garments and Footwear (-15.1 percent); Water (-3.6 percent); and Printing, Publishing and Paper Converters (-0.6 percent). Increases in productivity were nonetheless recorded in most industries, namely: Oil and Natural Gas Refining (40.0 percent); Food Processing (25.8 percent); Drink and Tobacco (15.7 percent); Exploration and Production of Oil and Natural Gas (9.5 percent); Miscellaneous Manufacturing (8.5 percent); Electricity (5.1 percent); Wood and Related Products (5.1 percent); Petrochemicals (2.1 percent); and Chemicals (0.2 percent). The productivity of the overall non-energy sector declined by 16.5 percent year-on-year in the second quarter of fiscal 2016, which was almost double the 8.6 percent loss experienced in the second quarter of fiscal 2015. The decline in the second quarter was driven by an approximate 22 percent drop in the sector’s DPI which was accompanied by a roughly 6 percent reduction in its Index of Hours Worked.
THE REAL ECONOMY

3 8
2016A disaggregation of unemployment by age reveals that young people between the ages of 15 and 29 years represented approximately 50.6 percent of all unemployed persons during January to March 2016. This was a sharp rise on this age group’s 44.8 percent share one quarter earlier. Conversely, persons 30 to 49 years of age accounted for a smaller share of the unemployed (35.7 percent, significantly lower than their 46.6 percent share in the previous quarter). Persons aged 50 to 64 years accounted for 13.3 percent of the unemployed during the 2016 period, up from 8.1 percent (Figure 8).
Figure 8: Distribution of Unemployed Persons by Age Group
15-29 30-49 50-64 65+Age Group
Oct-Dec 2015 Jan-Mar 2016
Perc
ent
(%
)
0
10
20
30
40
50
60
Source: Central Statistical Office
Male unemployment increased to 3.7 percent in the second quarter from 3.4 percent in the first quarter. Female unemployment also rose, but by a smaller margin, to 3.8 percent from 3.6 percent.
According to the latest CSO data, the number of unemployed individuals in Trinidad and Tobago rose by 400 persons in the first quarter of fiscal 2016 (to 22,300 persons from 21,900 persons in the fourth quarter of fiscal 2015), and then increased again by another 1,800 persons in the second quarter (to 24,100 persons).
Similarly, the Ministry of Labour and Small and Micro Enterprise Development (MLSMED) has reported that it has received notices from local companies that a total of 1,693 persons were to be retrenched during the period
October 2015 to September 2016. These notices were related to the following sectors: Energy (26.1 percent); Construction (20.1 percent); Manufacturing (19.6 percent) 22, Financial Services (18.7 percent), Other Services inclusive of the hospitality industry (9.6 percent); and Transport, Storage and Communications (5.9 percent). A major and widely reported event during fiscal 2016 was the termination of 590 employees of ArcelorMittal Point Lisas Limited in March 2016, as a consequence of the cessation of the company’s operations in Trinidad and Tobago. The downturn in the iron and steel industry also triggered the termination of jobs at Central Trinidad Steel Limited (CENTRIN) and Tube City IMS Limited during the fiscal period. These terminations have contributed to the large decline in the number of persons with jobs in the Other Manufacturing industry during the quarter.
In response to the increase in reported job losses in Trinidad and Tobago, the MLSMED developed a Ten-Point Plan entitled “Empowering Unemployed Persons: Turning Adversity into Opportunity.” The objective of this Plan is to provide immediate, short-term and medium-term assistance to unemployed persons and, where necessary, their families, to mitigate against the negative effects of unemployment and empower them towards re-integration into decent work in the shortest possible time.
The key activities identified in the Ten-Point Plan are: (i) the establishment of a National Register of Unemployed Persons; (ii) the development of a marketing campaign to solicit new job opportunities for retrenched workers and facilitate jobs and skills matching; (iii) the operationalisation of training, re-training, upskilling and multi-skilling programmes for retrenched workers; (iv) the provision of pre- and post-retrenchment psychological and financial counseling to retrenched workers and their families; (v) the provision of seed capital and start-up business financing for retrenched workers and support in forming Co-operatives; (vi) the formation of small businesses and Co-operatives; (vii) the holding of discussions with financial institutions to adopt a humane approach to retrenched workers with loans and mortgages; (viii) the exploration of overseas employment opportunities for retrenched workers;
22 This excludes ArcelorMittal Point Lisas Limited and other companies whose employees were not retrenched but terminated.
THE REAL ECONOMY

3 9
participation rate 23 decreased slightly from 60.4 percent to 60.1 percent during the period (Appendix 12).
The fall in employment levels during the January to March 2016 period reflected job losses in: Transport, Storage and Communication (6,500 persons); Other Manufacturing (5,000 persons); Finance, Insurance, Real Estate and Business Services (3,100 persons); Construction (2,100 persons); and Petroleum and Gas (100 persons). The effects of these were mitigated by gains in employment in: Community, Social and Personal Services (5,800 persons); Wholesale and Retail Trade, Restaurants and Hotels (2,900 persons); Other Agriculture Forestry, Hunting and Fishing (2,200 persons); Electricity and Water (1,800 persons); and Other Mining and Quarrying (300 persons).
More than half of all persons with jobs in the second quarter were male (58.0 percent or 358,300 persons) which was marginally down from 58.6 percent in the first quarter. The female share of the employed accordingly rose from 41.4 percent to 42.0 percent (259,500 persons) during the period. Most females (81.2 percent) were employed in only three industries during the second quarter, namely Community, Social and Personal Services (111,400 persons); Wholesale and Retail Trade, Restaurant and Hotels (65,800 persons); and Financing, Insurance, Real Estate and Business Services (33,400 persons). The other leading sources of female employment were Other Manufacturing (16,400 persons); Transport, Storage and Communication (11,000 persons); and Construction (10,400 persons).
23 The participation rate is the portion of the non-institutional population, aged 15 years and over, that is part of (participates in) the labour force.
(ix) the upskilling of suitable retrenched workers to the standard of technical and vocational teachers to fill the shortage of these teachers in Secondary Schools; and (x) the holding of an Empowerment Jobs Expo for Retrenched Workers.
To facilitate tripartite engagement, dialogue and consultation, Government also agreed in March 2016 to the establishment of a National Tripartite Advisory Council comprising representatives of Government, Labour and the Private Sector. The Council would provide sound and informed multi-sectoral advice to the Government on a wide range of initiatives including the identification and review of sustainable national development goals and job creation in Trinidad and Tobago. Government has also undertaken a comprehensive review of the country’s labour legislation to improve the governance of the labour sector. Towards this end a number of National Consultations were held during fiscal 2016 on various legislation including the Industrial Relations Act (IRA), the Retrenchment and Severance Benefits Act, and the Basic Terms and Conditions of Employment Code/Legislation.
Labour Force / Job CreationOn an aggregate level, Trinidad and Tobago’s labour force shrunk to 641,900 persons during the second quarter of fiscal 2016 from 643,900 persons in the first quarter. The exit of 2,000 persons from the labour force occurred amidst a decline in the total number of persons employed from 621,600 to 617,800. Consequently, the
THE REAL ECONOMY
4 0
2016CENTRAL GOVERNMENT OPERATIONS
OverviewRevenue
ExpenditureFinancing
Public Debt and Debt ServiceTrinidad and Tobago Credit Ratings
Overview The fiscal 2016 Budget was predicated on an average oil price of US$45 per barrel of crude and a natural gas price of US$2.75 per million of British thermal units (mmBtu). On this basis, Total Revenue and Grants was estimated at $60,286.4 million, representing 39.0 percent of GDP. 24 Current Revenue was expected to contribute 84.1 percent of Total Revenue and Grants, with Capital Revenue, inclusive of Grants, contributing 15.9 percent. With Total Expenditure estimated at $63,048.7 million or 40.8 percent of GDP, the budget deficit was projected for fiscal 2016 to be $2,762.3 million or 1.8 percent of GDP.
As energy prices continued to decline, the Mid-Year Revised projections for fiscal 2016 were recalibrated on an average oil price of US$35 per barrel of crude and a natural gas price of US$2.00 per mmBtu. The Minister advised that Central Government’s fiscal operations were expected to culminate in an Overall Deficit of $6.7 billion or about 4.0 percent of GDP. Total Revenue and Grants was anticipated to decline from the budgeted estimate to $52,677.2 million or 34.1 percent of GDP. The Government’s intention at the time was to contain total expenditure in 2016 to $59,000.0 million or 38.2 percent of GDP.
The most recent revised estimates for fiscal 2016, forecast an Overall Deficit of $7,293.1 million or 5.0 percent of GDP, 25 while on the Current Account, a deficit of $6,499.6 million is also projected. Total Revenue and Grants are anticipated to amount to $44,941.8 million or 30.6 percent of GDP, while Total Expenditure is estimated at $52,234.9 million or 35.5 percent of GDP.
As at September 30, 2015, the Heritage and Stabilisation Fund (HSF) stood at US$5,655.1 million. In order to support economic stabilisation, amidst an extended period of declining oil and gas prices, a drawdown of TT$2,498.4 million (US$377.5 million) was made in May 2016. Accordingly, the Net Asset Value of the Fund stood at US$5,454.6 million at the end of June 2016; down from US$5,787.3 million recorded in March 2016. No transfers are expected to be made to the Fund during the 2016 fiscal year.
24 Budget 2016 as well as Mid-Year revised estimates for 2016 based on fiscal 2015 GDP of $154,626 million.
25 Revised estimates for 2016 based on fiscal 2016 GDP of $146,994.7 million.

4 1
CENTRAL GOVERNMENT OPERATIONSFigure 9: Central Government Fiscal Operations
Revenue Expenditure
Current Account Balance Fiscal Balance
Oct '11/ Oct '12/ Oct '13/ Oct '14/ Oct ‘15/Sep '12 Sep '13 Sep '14 Sep '15 Sep ‘16
TT$
Mill
ions
-100000
1000020000300004000050000600007000080000
Source: Ministry of Finance
RevenueIn fiscal 2016, Total Revenue and Grants, amounting to $44,941.8 million, is expected to be lower than originally budgeted by $15,344.6 million. The main contributors to the weaker revenue performance in 2016 is anticipated reductions in collections from Taxes on Income and Profits, Taxes on Goods and Services and Capital Revenue.
Taxes on Income and Profits
Taxes on Income and Profits, accounting for 36.5 percent of Total Revenue and Grants, are expected to be the largest contributor to Total Revenue receipts in the current fiscal year. Projected receipts of $16,391.1 million would be lower than the fiscal 2015 receipts of $29,027.6 million, mainly owing to the anticipated 90.3 percent decline in collections from Oil Companies, from $10,512.7 million to $1,016.5 million. This negative variance reflects reduced remittances by Exploration and Production companies, due to prevailing low oil and gas prices on the global market. The estimated 32.9 percent decrease in collections from Other Companies, to $6,360.2 million in 2016, is the next major contributor to the reduction in receipts from these taxes, as a result of lower remittances by companies due to current global energy prices. Along with lower contributions to the Unemployment Fund, of $535.4 million, on account of lower collections of Petroleum Profits Tax (PPT) from Oil Companies; projected declines in receipts from Individual Income Tax, Withholding Tax and Health Surcharge, by $107.9 million, $81.0 million and $52.6 million, in that order,
have also contributed to the weaker revenue outturn in the current fiscal year. However, increases are expected in the Business Levy and in contributions to the Green Fund, in amounts of $217.7 million and $209.9 million, in that order. Increases in contributions to the Business Levy and the Green Fund were as a result of increased quarterly rates of contribution from 0.2 percent to 0.6 percent and from 0.1 percent to 0.3 percent, respectively.
Taxes on Goods and Services
Taxes on Goods and Services, estimated at $8,840.2 million, are expected to be 0.7 percent lower than the $8,903.7 million collected for fiscal 2015. A $207.3 million decline in Value Added Tax (VAT) collections is anticipated to be the major contributor to this weaker outturn, consequent to the shortfall in tax collections from companies in both the Energy and Non-Energy sectors, as well as delays in implementing new compliance measures, in relation to broadening the tax base and reducing the rate of VAT from 15.0 percent to 12.5 percent. This reduction in the collection of VAT is hence expected to offset the $40.4 million rise in Excise Duties, as well as the $23.4 million increase in Motor Vehicle Taxes and Duties, totalling $735.1 million and $598.9 million, respectively.
Taxes on International Trade
The estimated outturn of $3,003.2 million in Taxes on International Trade, consisting mainly of Import Duties, represents a marginal 0.4 percent decline as compared to receipts of the previous fiscal year.
Taxes on Property
Collections of $3.0 million from Taxes on Property, solely due to receipts from Land and Building Taxes, are projected to be $0.4 million less than the fiscal 2015 outturn.
Non-Tax Revenue
In the current fiscal year, Non-Tax Revenue receipts are estimated to increase to $11,831.6 million; 18.6 percent higher than fiscal 2015. Contributing to this stronger estimate is a $2,652.1 million increase in Repayment of

4 2
2016Past Lending, to $2,679.8 million, due to the repayment of a loan granted by the State to Trinidad Generation Unlimited (TGU). As a result of the higher than anticipated returns on the Government’s overdraft account at the Central Bank in 2016, as well as the receipt of payments of arrears on interest remitted by the Bank; the projected $631.6 million increase in Equity Profits of the Central Bank, totalling $809.0 million, also contributed to increased Non Tax Revenue collections in the current fiscal year.
Reductions in collections, as compared to fiscal 2015, are anticipated in Royalties on Oil, Profits from State Enterprises, Interest Income and Administrative Fees and Charges. A 36.6 percent decline is anticipated in Royalties on Oil, to $697.7 million and a 17.2 percent fall in Profits from State Enterprises, totalling $5,162.9 million in 2016, is also projected. This decline in profits is consequent to reduced dividend payments by State Enterprises, particularly the National Gas Company (NGC). Furthermore, decreases of $50.0 million and $13.7 million are estimated in Administrative Fees and Charges and Interest Income, respectively.
Capital Revenue
Capital Revenue receipts in fiscal 2016, amounting to $3,915.2 million, are projected to fall short of receipts for fiscal 2015 by $1,074.0 million or 21.5 percent. Extraordinary revenue items, in particular, the balance of proceeds from the sale of shares in Methanol Holdings Trinidad Limited (MHTL) of $1,000.0 million, along with $2,560.0 million in revenue received from CLICO, are expected to be the main contributors to Capital Revenue in this fiscal year. However, revenue inflows from these extraordinary items are anticipated to be 25.8 percent less than those of fiscal 2015. Additionally, Grants are estimated to rise from $92.3 million to $114.9 million in the current year.
CENTRAL GOVERNMENT OPERATIONSFigure 10: Central Government Revenue
Total Revenue and Grants Tax Revenue
Non-Tax Revenue
TT$
Mill
ions
Oct '11/ Oct '12/ Oct '13/ Oct '14/ Oct’15/ Sep '12 Sep '13 Sep '14 Sep '15 Sep’16
0
10000
20000
30000
40000
50000
60000
Source: Ministry of Finance
ExpenditureIn fiscal 2016, Total Expenditure is anticipated to decline by 12.9 percent to $52,234.9 million as compared with the previous fiscal year. Recurrent Expenditure, amounting to $47,526.2 million, is expected to contribute 91.0 percent of Total Expenditure, while Capital Expenditure, projected at $4,708.7 million, would represent 9.0 percent of this total.
Under Recurrent Expenditure, in 2016, reductions are anticipated in Wages and Salaries, Other Goods and Services, Interest Payments, as well as Transfers and Subsidies. The most significant decreases are expected to be a 10.5 percent contraction of expenditure on Other Goods and Services, along with a 10.4 percent reduction in Transfers and Subsidies, totalling $27,497.5 million.
Personnel Expenditure is estimated to be reduced by 3.2 percent to $9,750.1 million in fiscal 2016, as compared with the $10,077.1 million spent in the preceding fiscal year. Contributing to this decrease, is the estimated reduction in funding for the Unemployment Relief Programme (URP), from $707.7 million in 2015 to $355.7 million in the current year.
Expenditure on Other Goods and Services are projected to decrease by 10.5 percent to $7,250.7 million in 2016. This decline of $854.7 million at the fiscal 2015 figure, is primarily due to cutbacks in discretionary areas. Additionally, the administrative reviews of contract agreements under Contract Employment, as well as delays in the processing of payments under Other
4 3
would be reduced by $48.9 million to $650.0 million.
Additionally, Other Transfers are expected to be reduced by 12.7 percent to $8,155.3 million, owing to decreases in the various components of Other Transfers, in particular a decline in transfers to the Infrastructure Development Fund (IDF), totalling $1,600.0 million in 2016. With respect to the other components under this area of expenditure, no transfers are expected to be made to the Heritage and Stabilisation Fund (HSF), as well as the CARICOM Petroleum Fund for the current fiscal year; with $271.7 million last transferred to the HSF in fiscal 2013 and $100 million transferred to the Petroleum Fund in 2014. Furthermore, transfers to the GATE Fund are anticipated to remain unchanged at $650.0 million.
Transfers to State Enterprises are also estimated to decrease in fiscal 2016, by 15.8 percent, moving from $2,369.0 million in 2015 to $1,995.4 million. Disbursements from the Green Fund are projected to decline by $114.4 million to $8.0 million consequent to delays in grants of approval for the implementation of various environmental projects. In addition, marginal reductions in subventions to Educational Institutions, as well as Non-Profit Institutions, by amounts of $116.0 million and $58.6 million are expected in 2016.
Transfers to Statutory Boards and Similar Bodies, which represent 26.9 percent of Transfers and Subsidies, are anticipated to amount to $7,386.2 million; $148.4 million less than Transfers for fiscal 2015. The projected $137.4 million decrease in Transfers to Local Government Bodies, as well as the reduction in funding for the Tobago House of Assembly of $66.9 million, are expected to offset the $154.9 million rise in Transfers to Public Utilities.
Capital Expenditure, estimated at $4,708.7 million, represents a 38.4 percent reduction from the previous fiscal year’s total of $7,648.5 million. Expenditure under the Consolidated Fund is expected to decline to $3,162.2 million, from $4,064.3 million in fiscal 2015. Similarly, Capital Expenditure funded via the Infrastructure Development Fund (IDF), totalling $1,546.5 million in 2016, is projected to be reduced by $2,037.7 million. The anticipated fall in expenditure under both funds during the current year is consequential to delays in the implementation of projects, as well as administrative delays in the processing of claims for payments to be made.
Contracted Services, are expected to contribute to the decline in expenditure on Goods and Services for the fiscal year. Furthermore, the $127.4 million reduced spending on Minor Equipment Purchases; expected to total $177.5 million, would also contribute to reduced expenditure in this area. Conversely, Management Expenses/Expenses of Issue/Discounts and Other Financial Instruments are estimated to rise by 82.8 percent to $1,003.6 million in fiscal 2016.
Expenditure on Interest Payments is projected at $3,027.9 million, as compared with payments of $3,438.4 million in fiscal 2015. Domestic Interest Payments, amounting to $2,451.7 million, are anticipated to be $463.8 million lower than 2015, on account of reduced interest payments on Government Bonds. However, External Interest Payments of $576.2 million are expected to exceed the previous fiscal year’s payments by $53.3 million.
Subsidies, which represent 0.9 percent of Transfers and Subsidies, are estimated at $261.1 million; 8.8 percent lower than the previous fiscal year’s total of $286.3 million. This anticipated variance of $25.2 million is consequent to reduced subsidies for Relief of Flood Damage, the Agriculture Incentive Programme, as well as for the operations of the Port Authority Coastal Steamers, by the amounts of $15.6 million, $9.7 million and $0.5 million, in that order.
Current Transfers, which contribute 72.2 percent to total Transfers and Subsidies, are projected at $19,850.2 million; $3,030.9 million lower than fiscal 2015. The sole percentage increase in the components of Current Transfers is expected to be the 13.5 percent rise in Transfers Abroad, to $261.3 million, due to higher contributions to International Bodies.
Transfers to Households, which represent the largest share of expenditure under Transfers and Subsidies (other major components include: Subsidies; Other Transfers; Transfers to State Enterprises; and Transfers to Statutory Boards and Similar Bodies), is estimated at $9,753.8 million for this fiscal year. This 23.0 percent decline from the preceding fiscal year can be attributed to the shortfall in subsidies relating to the sale of petroleum products, as claims have been reduced due to lower oil prices and the ensuing impact on petroleum products. Also, in this category, it is anticipated that expenditure under the Government Assistance for Tuition Expenses (GATE) Fund
CENTRAL GOVERNMENT OPERATIONS
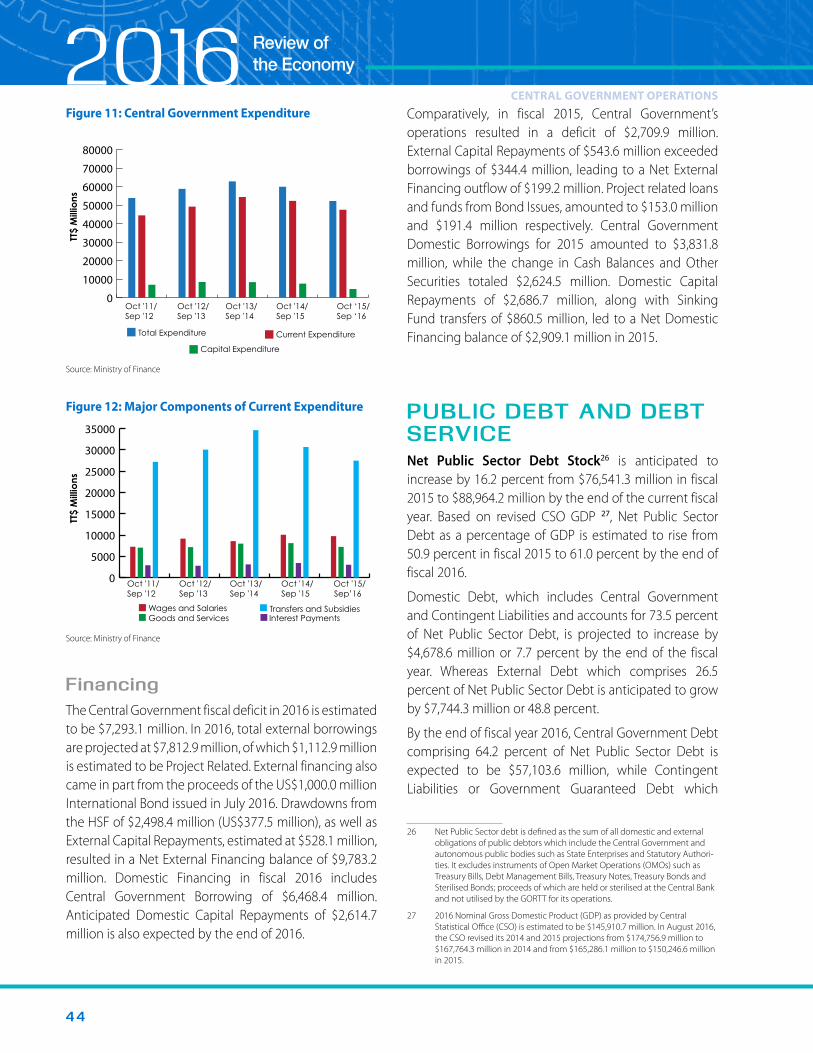
4 4
2016CENTRAL GOVERNMENT OPERATIONS
Figure 11: Central Government Expenditure
Total Expenditure Current Expenditure
Capital Expenditure
Oct '11/ Oct '12/ Oct '13/ Oct '14/ Oct ‘15/Sep '12 Sep '13 Sep '14 Sep '15 Sep ‘16
TT$
Mill
ions
0
10000
20000
30000
40000
50000
60000
70000
80000
Source: Ministry of Finance
Figure 12: Major Components of Current Expenditure
Wages and SalariesGoods and Services Interest Payments
Transfers and Subsidies
Oct '11/ Oct '12/ Oct '13/ Oct '14/Sep '12 Sep '13 Sep '14 Sep '15 Sep’16
TT$
Mill
ions
Oct '15/0
5000
10000
15000
20000
25000
30000
35000
Source: Ministry of Finance
FinancingThe Central Government fiscal deficit in 2016 is estimated to be $7,293.1 million. In 2016, total external borrowings are projected at $7,812.9 million, of which $1,112.9 million is estimated to be Project Related. External financing also came in part from the proceeds of the US$1,000.0 million International Bond issued in July 2016. Drawdowns from the HSF of $2,498.4 million (US$377.5 million), as well as External Capital Repayments, estimated at $528.1 million, resulted in a Net External Financing balance of $9,783.2 million. Domestic Financing in fiscal 2016 includes Central Government Borrowing of $6,468.4 million. Anticipated Domestic Capital Repayments of $2,614.7 million is also expected by the end of 2016.
Comparatively, in fiscal 2015, Central Government’s operations resulted in a deficit of $2,709.9 million. External Capital Repayments of $543.6 million exceeded borrowings of $344.4 million, leading to a Net External Financing outflow of $199.2 million. Project related loans and funds from Bond Issues, amounted to $153.0 million and $191.4 million respectively. Central Government Domestic Borrowings for 2015 amounted to $3,831.8 million, while the change in Cash Balances and Other Securities totaled $2,624.5 million. Domestic Capital Repayments of $2,686.7 million, along with Sinking Fund transfers of $860.5 million, led to a Net Domestic Financing balance of $2,909.1 million in 2015.
PUBLIC DEBT AND DEBT SERVICENet Public Sector Debt Stock26 is anticipated to increase by 16.2 percent from $76,541.3 million in fiscal 2015 to $88,964.2 million by the end of the current fiscal year. Based on revised CSO GDP 27, Net Public Sector Debt as a percentage of GDP is estimated to rise from 50.9 percent in fiscal 2015 to 61.0 percent by the end of fiscal 2016.
Domestic Debt, which includes Central Government and Contingent Liabilities and accounts for 73.5 percent of Net Public Sector Debt, is projected to increase by $4,678.6 million or 7.7 percent by the end of the fiscal year. Whereas External Debt which comprises 26.5 percent of Net Public Sector Debt is anticipated to grow by $7,744.3 million or 48.8 percent.
By the end of fiscal year 2016, Central Government Debt comprising 64.2 percent of Net Public Sector Debt is expected to be $57,103.6 million, while Contingent Liabilities or Government Guaranteed Debt which
26 Net Public Sector debt is defined as the sum of all domestic and external obligations of public debtors which include the Central Government and autonomous public bodies such as State Enterprises and Statutory Authori-ties. It excludes instruments of Open Market Operations (OMOs) such as Treasury Bills, Debt Management Bills, Treasury Notes, Treasury Bonds and Sterilised Bonds; proceeds of which are held or sterilised at the Central Bank and not utilised by the GORTT for its operations.
27 2016 Nominal Gross Domestic Product (GDP) as provided by Central Statistical Office (CSO) is estimated to be $145,910.7 million. In August 2016, the CSO revised its 2014 and 2015 projections from $174,756.9 million to $167,764.3 million in 2014 and from $165,286.1 million to $150,246.6 million in 2015.
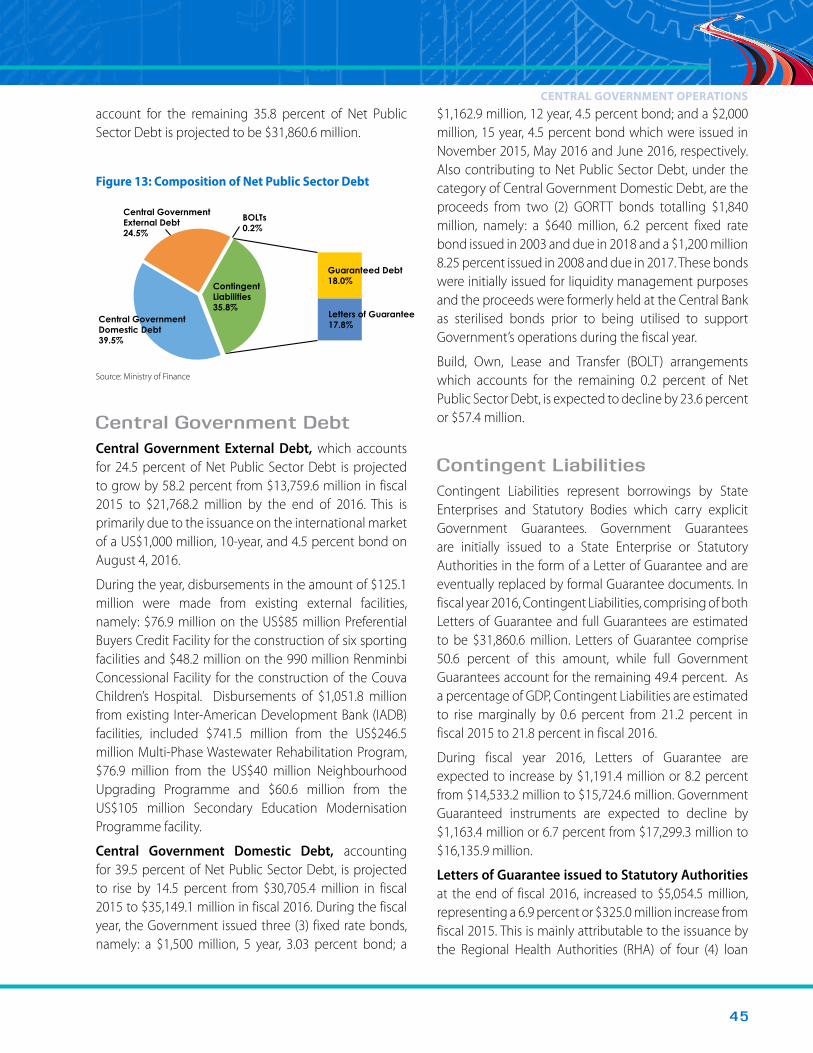
4 5
$1,162.9 million, 12 year, 4.5 percent bond; and a $2,000 million, 15 year, 4.5 percent bond which were issued in November 2015, May 2016 and June 2016, respectively. Also contributing to Net Public Sector Debt, under the category of Central Government Domestic Debt, are the proceeds from two (2) GORTT bonds totalling $1,840 million, namely: a $640 million, 6.2 percent fixed rate bond issued in 2003 and due in 2018 and a $1,200 million 8.25 percent issued in 2008 and due in 2017. These bonds were initially issued for liquidity management purposes and the proceeds were formerly held at the Central Bank as sterilised bonds prior to being utilised to support Government’s operations during the fiscal year.
Build, Own, Lease and Transfer (BOLT) arrangements which accounts for the remaining 0.2 percent of Net Public Sector Debt, is expected to decline by 23.6 percent or $57.4 million.
Contingent LiabilitiesContingent Liabilities represent borrowings by State Enterprises and Statutory Bodies which carry explicit Government Guarantees. Government Guarantees are initially issued to a State Enterprise or Statutory Authorities in the form of a Letter of Guarantee and are eventually replaced by formal Guarantee documents. In fiscal year 2016, Contingent Liabilities, comprising of both Letters of Guarantee and full Guarantees are estimated to be $31,860.6 million. Letters of Guarantee comprise 50.6 percent of this amount, while full Government Guarantees account for the remaining 49.4 percent. As a percentage of GDP, Contingent Liabilities are estimated to rise marginally by 0.6 percent from 21.2 percent in fiscal 2015 to 21.8 percent in fiscal 2016.
During fiscal year 2016, Letters of Guarantee are expected to increase by $1,191.4 million or 8.2 percent from $14,533.2 million to $15,724.6 million. Government Guaranteed instruments are expected to decline by $1,163.4 million or 6.7 percent from $17,299.3 million to $16,135.9 million.
Letters of Guarantee issued to Statutory Authorities at the end of fiscal 2016, increased to $5,054.5 million, representing a 6.9 percent or $325.0 million increase from fiscal 2015. This is mainly attributable to the issuance by the Regional Health Authorities (RHA) of four (4) loan
account for the remaining 35.8 percent of Net Public Sector Debt is projected to be $31,860.6 million.
Figure 13: Composition of Net Public Sector Debt
Central Government External Debt 24.5%
BOLTs 0.2%
Guaranteed Debt 18.0%
Letters of Guarantee17.8%
Central Government Domestic Debt 39.5%
Contingent Liabilities35.8%
Source: Ministry of Finance
Central Government Debt Central Government External Debt, which accounts for 24.5 percent of Net Public Sector Debt is projected to grow by 58.2 percent from $13,759.6 million in fiscal 2015 to $21,768.2 million by the end of 2016. This is primarily due to the issuance on the international market of a US$1,000 million, 10-year, and 4.5 percent bond on August 4, 2016.
During the year, disbursements in the amount of $125.1 million were made from existing external facilities, namely: $76.9 million on the US$85 million Preferential Buyers Credit Facility for the construction of six sporting facilities and $48.2 million on the 990 million Renminbi Concessional Facility for the construction of the Couva Children’s Hospital. Disbursements of $1,051.8 million from existing Inter-American Development Bank (IADB) facilities, included $741.5 million from the US$246.5 million Multi-Phase Wastewater Rehabilitation Program, $76.9 million from the US$40 million Neighbourhood Upgrading Programme and $60.6 million from the US$105 million Secondary Education Modernisation Programme facility.
Central Government Domestic Debt, accounting for 39.5 percent of Net Public Sector Debt, is projected to rise by 14.5 percent from $30,705.4 million in fiscal 2015 to $35,149.1 million in fiscal 2016. During the fiscal year, the Government issued three (3) fixed rate bonds, namely: a $1,500 million, 5 year, 3.03 percent bond; a
CENTRAL GOVERNMENT OPERATIONS
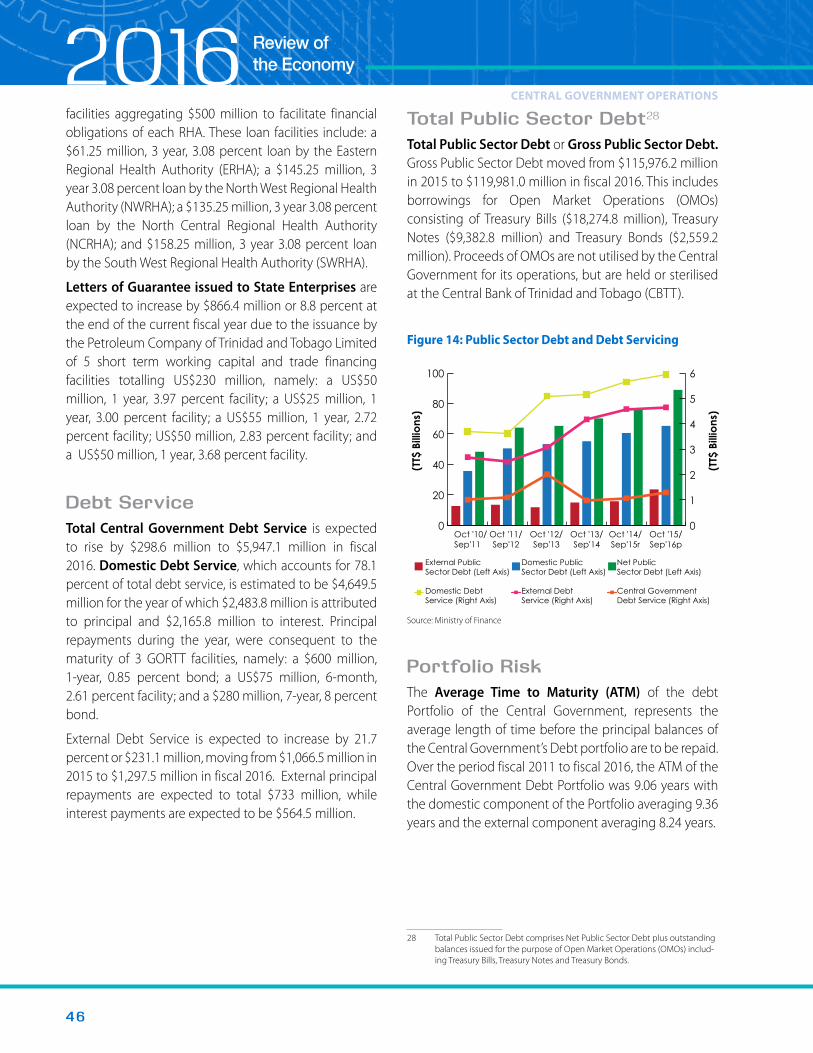
4 6
2016facilities aggregating $500 million to facilitate financial obligations of each RHA. These loan facilities include: a $61.25 million, 3 year, 3.08 percent loan by the Eastern Regional Health Authority (ERHA); a $145.25 million, 3 year 3.08 percent loan by the North West Regional Health Authority (NWRHA); a $135.25 million, 3 year 3.08 percent loan by the North Central Regional Health Authority (NCRHA); and $158.25 million, 3 year 3.08 percent loan by the South West Regional Health Authority (SWRHA).
Letters of Guarantee issued to State Enterprises are expected to increase by $866.4 million or 8.8 percent at the end of the current fiscal year due to the issuance by the Petroleum Company of Trinidad and Tobago Limited of 5 short term working capital and trade financing facilities totalling US$230 million, namely: a US$50 million, 1 year, 3.97 percent facility; a US$25 million, 1 year, 3.00 percent facility; a US$55 million, 1 year, 2.72 percent facility; US$50 million, 2.83 percent facility; and a US$50 million, 1 year, 3.68 percent facility.
Debt Service Total Central Government Debt Service is expected to rise by $298.6 million to $5,947.1 million in fiscal 2016. Domestic Debt Service, which accounts for 78.1 percent of total debt service, is estimated to be $4,649.5 million for the year of which $2,483.8 million is attributed to principal and $2,165.8 million to interest. Principal repayments during the year, were consequent to the maturity of 3 GORTT facilities, namely: a $600 million, 1-year, 0.85 percent bond; a US$75 million, 6-month, 2.61 percent facility; and a $280 million, 7-year, 8 percent bond.
External Debt Service is expected to increase by 21.7 percent or $231.1 million, moving from $1,066.5 million in 2015 to $1,297.5 million in fiscal 2016. External principal repayments are expected to total $733 million, while interest payments are expected to be $564.5 million.
Total Public Sector Debt28
Total Public Sector Debt or Gross Public Sector Debt. Gross Public Sector Debt moved from $115,976.2 million in 2015 to $119,981.0 million in fiscal 2016. This includes borrowings for Open Market Operations (OMOs) consisting of Treasury Bills ($18,274.8 million), Treasury Notes ($9,382.8 million) and Treasury Bonds ($2,559.2 million). Proceeds of OMOs are not utilised by the Central Government for its operations, but are held or sterilised at the Central Bank of Trinidad and Tobago (CBTT).
Figure 14: Public Sector Debt and Debt Servicing
External Public Domestic Public Net Public Sector Debt (Left Axis) Sector Debt (Left Axis) Sector Debt (Left Axis)
Domestic Debt External Debt Central Government Service (Right Axis) Service (Right Axis) Debt Service (Right Axis)
0
20
40
60
80
100
0
1
2
3
4
5
6
Oct '10/ Oct '11/ Oct '12/ Oct '13/ Oct '14/ Oct '15/Sep'11 Sep'12 Sep'13 Sep'14 Sep'15r Sep'16p
(TT$
Bill
ions
)
(TT$
Bill
ions
)
Source: Ministry of Finance
Portfolio RiskThe Average Time to Maturity (ATM) of the debt Portfolio of the Central Government, represents the average length of time before the principal balances of the Central Government’s Debt portfolio are to be repaid. Over the period fiscal 2011 to fiscal 2016, the ATM of the Central Government Debt Portfolio was 9.06 years with the domestic component of the Portfolio averaging 9.36 years and the external component averaging 8.24 years.
28 Total Public Sector Debt comprises Net Public Sector Debt plus outstanding balances issued for the purpose of Open Market Operations (OMOs) includ-ing Treasury Bills, Treasury Notes and Treasury Bonds.
CENTRAL GOVERNMENT OPERATIONS

4 7
Figure 15: Average Time to Maturity of Debt Stock 2011-2016
0
2
4
6
8
10
12
2010/11
No
. of Y
ea
rs
Average Time to Maturity Total Debt StockAverage Time to Maturity External Debt Stock Average Time to Maturity Domestic Debt Stock
2015/162013/14 2014/152012/132011/12
Source: Ministry of Finance
BOX 3: Amendments to Borrowing Limits under the Guarantee of Loans (Companies) Act, Chap. 71:82, Development Loans Act, Chap. 71:04, and External Loans Act, Chap. 71:05.
The borrowing capacity of the Government of the Republic of Trinidad and Tobago (GORTT) was increased in December 2015 via amendments to the borrowing limits under the Guarantee of Loans (Companies) Act, Chap. 71:82, Development Loans Act, Chap. 71:04, and External Loans Act, Chap. 71:05.
This Guarantee of Loans (Companies) Act, Chap. 71:82 was first enacted in July 1969 and provides for the guarantee by the GORTT of loans by the lending agencies to Companies in which GORTT holds at least 50 percent of ordinary share capital. The Act also prescribes a statutory limit on Guarantees to be provided by the GORTT for borrowings by wholly and majority-owned State Enterprises. The statutory limit on the Guarantee of Loans (Companies) Act, Chap. 71:82 was increased from $25 billion to $45 billion in order to sufficiently accommodate planned borrowings by State Enterprises in the medium-term. There have been several revisions to the statutory limits under the Act, since its enactment in 1970. Details of the revisions to the statutory limit under the Guarantee of Loans (Companies) Act, Chap. 71:82, are outlined in Table 1 below.
The statutory limit under the Development Loans Act, Chap. 71:04, increased from $30 billion to $45 billion. This Act provides authorisation for the GORTT to borrow both domestically and externally for the purpose of financing the general development of Trinidad and Tobago. The initial limit was set by the Act in 1964 and since then there have been seven (7) revisions to the statutory limits under the Development Loans Act, Chap. 71:04 as detailed in Table 2 below.
The External Loans Act, Chap. 71:05 prescribes borrowings for the purpose of financing general development of Trinidad and Tobago and for purposes incidental thereto and to ensure that there is sufficient borrowing capacity to meet Government’s external borrowing requirements over the medium-term. The Act was first enacted in 1967 and the initial limit set by the Act was TT$50 million. In the subsequent years, the limit was reset several times. The current revision raised the limit from $15 billion to $30 billion. Table 3, outlines details of the amendments to the External Loans Act, Chap. 71:05 since its enactment.
Trinidad and Tobago Credit RatingsTrinidad and Tobago is currently rated by three rating agencies, Moody’s Investors Service (Moody’s), Standard and Poor’s (S&P) Global Ratings and the Caribbean-based Caribbean Information and Credit Rating Services Limited (CariCRIS). The economy faced downgrades by all three agencies in fiscal 2016; with key factors cited as suppressed oil and gas prices and the implied linkages between the economy’s high dependence on oil and gas revenue for public finances. All three agencies also highlighted deficiencies in the Central Statistical Office. This notwithstanding, the various agencies concurred with the view that Trinidad and Tobago remains one of the most resilient economies in the Caribbean, with a strong external position, high governance levels, significant accumulated savings within the Heritage and Stabilisation Fund (HSF) and a strong financial and regulatory framework.
CENTRAL GOVERNMENT OPERATIONS

4 8
2016Table 1: Change in Statutory Limit under the Guarantee of Loans (Companies) Act,
Chapter 71:82 for the period 1970 to 2015 (TT$ Millions)
Year Change in Statutory Limit
1970 70.0
1972 120.0
1974 200.0
1976 400.0
1978 1,000.0
1979 5,000.0
2003 9,000.0
2011 25,000.0
2015 40,000.0Source Ministry of Finance
Table 2: Change in the Borrowing Limit under the Development Loans Act,
Chapter 71:04 for the period 1964 to 2015 (TT$ Million, unless otherwise specified)
Year Change in Borrowing Limit
1964 US$30.0
1990 5,000.0
1994 7,500.0
1999 10,000.0
2002 13,000.0
2008 20,000.0
2011 30,000.0
2015 45,000.0
Source Ministry of Finance
Table 3: Change in the Borrowing Limit under the External Loans Act, Chapter
71:05 for the period 1967 to 2015 (TT$ Million, or otherwise specified)
Year Change in Borrowing Limit
1967 50.0
1972 75.0
1973 125.0
1977 1,000.0
1979 5,000.0
1989 6,000.0
1993 9,000.0
2011 15,000.0
2015 30,000.0
Source Ministry of Finance
Moody’s Investors Service
In April 2016, Moody’s further downgraded Trinidad and Tobago’s Government Bond Rating and Issuer Rating from Baa2 to Baa3, with a negative outlook. The main drivers for this downgrade was the globally depressed oil and gas prices which ultimately undermined Trinidad and Tobago’s economic and financial strength, despite fiscal consolidation efforts.
The Report also indicated that the low rating was buoyed by continued robust energy exports, strong external position, a moderate debt burden, and accumulated savings in the Heritage and Stabilisation Fund (HSF).
Moody’s indicated that ratings may be upgraded if fiscal adjustment results in lower deficits in the next two years, as well as increased fortitude in intuitional capacity to monitor policy responses and the use of institutional capacity upgrades to bring about responses to contain further fiscal deterioration.
Table 5: Trinidad and Tobago Credit Rating History by Moody’s Investors Service: 2007 - 2016
Year Outlook
Foreign Currency Ceiling Government Bond Ratings
Bonds and Notes Bank Deposits Foreign Currency
Local Currency
Long term Short term Long term Short term Long term Short term
Apr 2016 Negative Baa2 P-3 Baa3 P-3 Baa2 Baa2
Apr 2015 Negative A3 P-2 Baa2 P-3 Baa2 Baa2
Jan 2014 Stable A1 P-1 Baa1 P-2 Baa1 Baa1
Jan 2013 Stable A1 ... Baa1 … Baa1 Baa1
Aug 2012 Stable A1 ... Baa1 … Baa1 Baa1
July 2011 Stable A1 ... Baa1 … Baa1 Baa1
Jun 2009 Stable A1 ... Baa1 … Baa1 Baa1
Dec 2008 Stable A1 ... Baa1 … Baa1 Baa1
Oct 2007 Stable A1 … Baa1 P-2 Baa1 Baa1Source: Moody’s Investors Service (2016)

4 9
Standard & Poor’s
Following a ratings review in April 2016, S&P Global Ratings lowered its A/A-1 foreign and local currency sovereign credit ratings for Trinidad and Tobago to A-/A-2 and revised the outlook for the economy to negative.
The agency’s downgrade of the economy was as a result of weaker growth projections due to volatility in energy prices which they indicated presented difficultly in stabilising finances in spite of announced policy changes. S&P also noted that the growing debt burden of the economy, the continued lack of economic data and weak statistical agency as well as the impact of the managed exchange rate on monetary policy, negatively affected the Sovereign’s ratings.
The agency further advised that the outlook for the Trinidad and Tobago economy could be upgraded
Table 6: Trinidad and Tobago Credit Rating History by Standard and Poor’s Ratings Services: 2008 - 2016
Year OutlookForeign currency Local currency
Long term Short term Long term Short term
Apr 2016 Negative A- A-2 A- A-2
Dec 2015 Negative A A-1 A A-1
Dec 2014 Stable A A-1 A A-1
Jan 2013 Stable A A-1 A A-1
Jan 2012 Stable A A-1 A A-1
Aug 2011 Stable A A-1 A A-1
Jan 2011 Stable A A-1 A+ A-1
Dec 2009 Stable A A-1 A+ A-1
April 2009 Negative A A-1 A+ A-1
Aug 2008 Stable A A-2 A+ A-1
Source: Standard & Poor’s Ratings Services (2016)
to stable consequent to more prudent fiscal policies, future recovery in the energy sector, and reduced debt financing.
In the view of S&P, Trinidad and Tobago’s prosperity and credit ratings continues to be tied to the performance of the energy sector, however, its historically strong external position may be eroded due to the energy sector downturn. Nevertheless, the agency identified key areas of strength in the economy, stating that contingent liabilities will remain limited due in part to a healthy banking system which is well capitalised and well regulated, the country’s long established parliamentary democracy and stable political system, along with its favorable net external asset position, sustained low external vulnerability and its policy of savings within the Heritage and Stabilisation Fund (HSF).
CENTRAL GOVERNMENT OPERATIONS

5 0
2016Caribbean Information and Credit Rating Services Limited (CariCRIS)
Following its annual rating exercise in June 2016, CariCRIS lowered its regional rating of CariAAA on Foreign and Local Currency debt to CariAA+ and reaffirmed its rating of ttAAA on the national scale. As with the other two agencies, CariCRIS assigned a negative outlook due to the continued volatility of the energy sector and its resultant effect on the fiscal outlook of the economy.
The key factor identified by CariCRIS for the ratings downgrade was the impact of energy prices on fiscal
Table 7: Trinidad and Tobago Credit Rating History by CariCRIS: 2010 – 2016
Rating 2010 2011 2012 2013 2014 2015 2016
Regional scale foreign currency
CariAAA CariAAA CariAAA CariAAA CariAAA CariAAA CariAA+
Regional scale local currency
CariAAA CariAAA CariAAA CariAAA CariAAA CariAAA CariAA+
Trinidad and Tobago national scale
ttAAA ttAAA ttAAA ttAAA ttAAA ttAAA ttAAA
Source: Caribbean Information and Credit Rating Services Limited (CariCRIS) (2016)
performance. The Report further highlighted a lack of reliable data sources which can assist in informing policymakers to proficiently map timely outcomes for economic turnaround.
Factors which continue to support Trinidad and Tobago’s creditworthiness include its large diversified economy which continues to exhibit resilience, healthy reserves, low external debt, favorable public debt and well-regulated financial system with stable monetary and exchange rate policies.
CENTRAL GOVERNMENT OPERATIONS

5 1
REST OF THE NON- FINANCIAL PUBLIC SECTOR OPERATIONS
OverviewCash Operations
Current Transfers to State Enterprises and Public UtilitiesCapital Expenditure
Capital Transfers from Central Government
Overview During the first three quarters of fiscal 2016, operations of the Rest of the Non-Financial Public Sector 29 recorded a deficit of $963.7 million; substantially lower than the fiscal 2015 $4,909.2 million surplus. State Enterprises 30 accounted for $684.1 million of the overall surplus, while Public Utilities 31 accounted for a deficit of $1,647.8 million.
Capital Transfers from Central Government decreased by $271.3 million, from $958.8 million in fiscal 2015 to $687.5 million in fiscal 2016. Current Transfers from Government to State Enterprises decreased by $627.5 million to $440.9 million, but increased by $227.4 million to $1,842.0 million for Public Utilities.
Cash Operations Over the period October 2015 to June 2016, Total Operating Revenues and Total Operating Expenditures were recorded at $34,788.1 million and $35,751.8 million, respectively. Compared to the corresponding period a year ago, Total Operating Revenues decreased by 20.3 percent, while Total Operating Expenditures decreased by 7.8 percent. Consequently, the cash operations of the consolidated Rest of Non-Financial Public Sector generated an operating deficit of $963.7 million, which was 119.6 percent lower than the $4,909.2 million surplus recorded in the comparative period of the previous fiscal year.
State Enterprises recorded a net operating surplus of $684.1 million during the current period under review, a significant decrease of 87.5 percent when compared to the corresponding period of fiscal 2015. This reduction in the net operating surplus was primarily due to the deficit position of the National Gas Company (NGC) of $1,342.9 million. Additionally, the Petroleum Company of Trinidad and Tobago (PETROTRIN) realised a reduced surplus of $1,794.9 million in fiscal 2016, when compared to the $4,311.1 million recorded in fiscal 2015.
29 Rest of Non-Financial Public Sector refers to the consolidation of the operations of fourteen (14) State Enterprises (which represent approximately 80 percent of all State Enterprises) and six (6) Public Utilities.
30 State Enterprises refer to the consolidated operations of fourteen (14) companies namely: Caribbean Airlines Limited (CAL); National Maintenance Training and Security Company (MTS); National Gas Company (NGC); National Helicopter Services Limited (NHSL); National Infrastructure Development Company (NIDCO); National Petroleum Marketing Company (NPMC); National Quarries Company Limited (NQCL); Petroleum Company of Trinidad and Tobago (PETROTRIN); Point Lisas Industrial Port Develop-ment Company (PLIPDECO); Solid Waste Management Company Limited (SWMCOL); Trinidad Nitrogen Company Limited (TRINGEN); Trinidad and Tobago Mortgage Fi-nance Company (TTMF); Urban Development Corporation of Trinidad and Tobago (UDeCOTT); and Vehicle Management Corporation of Trinidad and Tobago (VMCOTT).
31 Public Utilities refer to the consolidated operations of six (6) companies namely: Airports Authority of Trinidad and Tobago (AATT); Port Authority of Trinidad and Tobago (PATT); Public Transport Service Corporation (PTSC); Telecommunications Services of Trinidad and Tobago (TSTT); Trinidad and Tobago Electricity Commission (T&TEC); and Water and Sewerage Authority (WASA).
REST OF THE NON-FINANCIAL PUBLIC SECTOR OPERATIONS

5 2
2016Among the other State Enterprises, the non-energy sector companies recorded a consolidated operating deficit of $90.6 million. Caribbean Airlines Limited (CAL) contributed the largest component of this operating deficit; amounting to $178.9 million. Results of the Trinidad and Tobago Mortgage Finance Company (TTMF), National Maintenance Training and Security Company (MTS) and the Urban Development Corporation of Trinidad and Tobago (UDeCOTT) minimally offset the total operating deficit of non-energy sector companies, with operating surpluses of $68.4 million, $36.2 million, and $33.8 million, respectively.
Over the first nine months of fiscal 2016, Public Utilities recorded a deficit of $1,647.8 million with operating revenues of $5,934.2 million and operating expenditures of $7,582.0 million. This operating position reflected a 196.6 percent decline from the $555.5 million deficit recorded in the first nine months of fiscal 2015.
Among the Public Utilities, the Airports Authority of Trinidad and Tobago (AATT) and the Telecommunications Services of Trinidad and Tobago (TSTT) generated surpluses of $26.9 million and $167.8 million, respectively. The other four (4) utilities recorded deficits totalling $1,842.5 million with the Water and Sewerage Authority (WASA) contributing 72.9 percent ($1,343.9 million) of this total.
Current Transfers to State Enterprises and Publ ic Uti l it iesTotal Current Transfers from Central Government for the nine-month period ending June 2016, amounted to $2,282.9 million and represented a 14.9 percent decrease over the previous corresponding period. Of this amount, $440.9 million (19.3 percent) was transferred to State Enterprises and $1,842.0 million (80.7 percent) to Public Utilities.
During this period, transfers to State Enterprises included the UDeCOTT ($350.7 million), the Solid Waste Management Company Limited (SWMCOL) ($55.4 million), National Infrastructure Development Company (NIDCO) ($27.0 million), and Vehicle Management Corporation of Trinidad and Tobago (VMCOTT) ($7.8
million). For Public Utilities, WASA received the largest transfer of resources with $1,464.6 million, which represents 79.5 percent of the total current transfers to Public Utilities.
Capital ExpenditureFor the first nine months of fiscal 2016, Capital Expenditure undertaken by both State Enterprises and Public Utilities, totalled $3,507.4 million, of which State Enterprises accounted for $2,980.7 million (85.0 percent) and Public Utilities accounted for $526.7 million (15.0 percent).
The bulk of the State Enterprises’ Capital Expenditure in the energy sector was made by PETROTRIN and NGC in amounts of $1,186.8 million and $90.3 million, respectively. However, the majority of Capital Expenditures among non-energy State Enterprises was undertaken by UDeCOTT ($689.7 million), TTMF ($518.3 million), CAL ($195.4 million), and NIDCO ($178.5 million).
Among the Public Utilities, TSTT made the largest Capital Expenditure outlay with $204.7 million being spent, followed by WASA ($198.4 million) and T&TEC ($70.9 million).
Capital Transfers from Central GovernmentFor the period under review, Capital Transfers from Central Government to the Rest of the Non-Financial Public Sector totalled $687.5 million; a decrease of 28.3 percent as compared to the $958.8 million received in the previous corresponding period.
NIDCO was the sole recipient of the $215.4 million in Capital Transfers disbursed to State Enterprises during the review period.
Capital Transfers to Public Utilities totalled $472.1 million: of which WASA accounted for $315.7 million, AATT $110.7 million, and the Port Authority of Trinidad and Tobago (PATT) $45.7 million.
REST OF THE NON-FINANCIAL PUBLIC SECTOR OPERATIONS

5 3
Table 8: Cash Statement of Operations of the Rest of the Non-Financial Public Sector
State Enterprises Public Utilities
Total
State Enterprises and
Public Utilities(TT $ millions) Oct 2014 -
Jun 2015Oct 2015 - Jun 2016
Oct 2014 - Jun 2015
Oct 2015 - Jun 2016
Oct 2014 - Jun 2015
Oct 2015 - Jun 2016
Operating Revenues 37,513.0 28,853.9 6,162.7 5,934.2 43,675.7 34,788.1Operating Expenditures 32,048.3 28,169.8 6,718.2 7,582.0 38,766.5 35,751.8Operating Surplus/(Deficit)
5,464.7 684.1 -555.5 -1,647.8 4,909.2 -963.7
Current Transfers from Central Gov’t
1,068.4 440.9 1,614.6 1,842.0 2,683.0 2,282.9
Current Balance 2,469.5 179.0 1,872.9 570.2 4,342.4 749.2Capital Expenditure 5,374.7 2,980.7 1,159.5 526.7 6,534.2 3,507.4Capital Transfers from Central Gov’t
487.4 215.4 471.4 472.1 958.8 687.5
Overall Balance -1,989.2 -2,277.1 1,190.1 522.9 -799.1 -1,754.2Financing 1,989.2 2,277.1 -1,190.1 -522.9 799.1 1,754.2Net Foreign Financing -111.2 1,166.4 -26.5 -10.8 -137.7 1,155.6Net Domestic Financing 2,100.4 1,110.7 -1,163.6 -512.1 936.8 598.6
1. Table refers to fiscal years.
2. State Enterprises refer to the consolidated operations of fourteen (14) companies namely: Caribbean Airlines Limited (CAL); National
Maintenance Training and Security Company (MTS); National Gas Company (NGC); National Helicopter Services Limited (NHSL); National
Infrastructure Development Company (NIDCO); National Petroleum Marketing Company (NPMC); National Quarries Company Limited
(NQCL); Petroleum Company of Trinidad and Tobago (PETROTRIN); Point Lisas Industrial Port Development Company (PLIPDECO); Solid Waste
Management Company Limited (SWMCOL); Trinidad Nitrogen Company Limited (TRINGEN); Trinidad and Tobago Mortgage Finance Company
(TTMF); Urban Development Corporation of Trinidad and Tobago (UDeCOTT); and Vehicle Management Corporation of Trinidad and Tobago
(VMCOTT).
3. Public Utilities refer to the consolidated operations of six (6) companies namely: Airports Authority of Trinidad and Tobago (AATT); Port
Authority of Trinidad and Tobago (PATT); Public Transport Service Corporation (PTSC); Telecommunications Services of Trinidad and Tobago
(TSTT); Trinidad and Tobago Electricity Commission (T&TEC); and Water and Sewerage Authority (WASA).
4. UDECOTT comprises data for the period October 2015 to May 2016.
5. Totals may vary due to rounding.
REST OF THE NON-FINANCIAL PUBLIC SECTOR OPERATIONS

5 4
2016THE MONETARY SECTOR
Monetary ConditionsCentral Bank Operations
Financial Sector PerformanceRegulatory Developments
Monetary Condit ionsAmid a macroeconomic environment of contained inflationary pressures, a normalisation of US interest rates, and a subdued global economic outlook, the CBTT has paused its contractionary monetary policy stance over the 11-month period October 2015 to August 2016. Accordingly, the CBTT’s main policy rate, the Repo rate, was increased only once during the eleven-month period October 2015 to August 2016. Subsequently, the Repo rate was increased in December 2015 to 4.75 percent. This current rate is 25 basis points higher that the September 2015 rate of 4.5 percent.
During the first half of fiscal year 2015/2016, and consequent to the CBTT’s liquidity management strategy, commercial bank’s excess reserves (the CBTT’s measure of liquidity) averaged $3.4 billion daily. The daily average rose to $5.3 billion by the third quarter of the fiscal year, on account of the CBTT’s relaxation of liquidity conditions to allow financial institutions to participate in Central Government’s bond issues. Liquidity levels
subsequently reverted to its pre-Central Government domestic borrowing levels, and commercial banks excess reserves averaged $3.3 billion in the months of July and August 2016.
Central Bank OperationsExchange Rates/Foreign Exchange MarketDuring the eleven-month period to August 2016, tighter conditions prevailed in the local foreign exchange market, leading to declining foreign exchange sales and purchases compared to the corresponding period one year ago. During this period, sales of foreign exchange by authorised dealers to the public amounted to US$5,650.4 million, 16.0 percent lower than the US$6,730.1 sold in the same period one year earlier. Reports by dealers on sales in excess of US$20,000.00 suggest that the demand for foreign exchange was mainly concentrated in the retail and distribution and manufacturing sectors, credit card centres and for the purchase of automobiles (Table 9).
Table 9: Commercial Banks and Non-Bank Financial Institutions Foreign Currency Sales and Purchases (US$ Mn.)
Period Purchases from the Public
Sales to the Public
Net Sales to the Public
Purchases from the Central Bank
2014 5,525.2 6,956.0 1,430.8 1,715.02015 4,941.3 7,382.5 2,411.2 2,595.0Oct 2014 - Aug 2015 4,596.5 6,730.1 2,133.6 2,223.9Oct 2015 - Aug 2016 4,078.6 5,650.4 1,571.8 1,858.6Percentage Change (year-on-year)
-11.3 -16.0 -26.3 -16.4
Source: Central Bank of Trinidad and Tobago

5 5
2015. This performance was driven by a moderating in the contraction of demand deposits, which fell by 0.9 percent in June 2016 as compared to an 11.8 percent decline in October 2015. A closer examination of demand deposits showed that demand deposits held by businesses declined by 1.2 percent in June 2016, compared with a decline of 3.4 percent at the start of the fiscal year. Demand deposits held by Government bodies (excluding Local Government and State owned financial institutions) fell by 13.9 percent in June 2016 compared with 38.3 percent in October 2015.
Broad money (M-2), which includes M1-A plus savings and time deposits, also increased over the review period. On a year-on-year basis, M-2 rose by 3.7 percent on average per month in June 2016, compared with a marginal contraction of 0.1 percent in October 2015. This growth in M-2 was driven by a 17.0 percent growth in time deposits, a 4.4 percent increase in savings deposits, a 7.7 percent increase in commercial bank’s foreign currency deposits, and a 12.1 percent increase in businesses’ foreign currency deposits which all occurred in the month of June 2016.
Credit to the private sector granted by the commercial banks has been resilient over the review period given the muted economic environment. On a year-on-year basis to June 2016, credit to the private sector by banks rose by 5.0 percent compared with 6.5 percent in October 2015. A disaggregation of consumer loans showed growth in lending for the purchase of motor vehicles (13.4 per cent) and home improvement (4.9 per cent), as well as a robust expansion of credit card balances (12.8 per cent). In addition, consistent with the trend observed during the previous fiscal year, the expansion in real estate mortgage loans has continued to decelerate thus far in fiscal 2015/16. Real estate mortgage loans rose by 7.2 per cent in June 2016 compared with 8.7 per cent in October 2015. However, growth in commercial banks’ business loans decelerated to 0.1 percent (year-on-year) in June 2016 from an increase of 4.1 percent in October 2015.
Interest RatesThe CBTT increased its main monetary policy rate, the Repo Rate, once during the eleven-month period
Purchases of foreign exchange from the public (except from the CBTT) by authorised dealers, amounted to US$4,078.6 million, 11.3 percent lower than the US$4,596.5 million purchased in the 2014/2015 period. The CBTT intervention of US$1,858.6 million over the period, was 16.4 percent lower than the US$2,223.9 million sold in the corresponding period in the previous fiscal year.
The weighted average selling rate for August 2016 stood at US$1=TT$6.7392; a depreciation of 5.9 percent from US$1=TT$6.3627 for October 2015 (Figure 16). The negative impact of subdued economic conditions domestically, resulted in the Trinidad and Tobago dollar depreciating by 6.8 percent against the Canadian dollar, and 5.8 percent against the Euro. The TT dollar however appreciated by 8.4 percent against the Pound Sterling over the eleven-month period ending August 2016, in the aftermath of the ‘Brexit’ referendum in June 2016.
Figure 16: Exchange Rates- Buying Rate (TT$ per US$)
6.75
6.70
6.65
6.60
6.55
6.50
6.45
6.40
6.35
6.30
Oc
t 12
De
c 1
2Fe
b 1
3A
pr 1
3Ju
n 1
3A
ug
13
Oc
t 13
De
c 1
3Fe
b 1
4A
pr 1
5Ju
n 1
5A
ug
15
Oc
t 14
De
c 1
4Fe
b 1
5A
pr 1
5Ju
n 1
5A
ug
15
Oc
t 15
De
c 1
5Fe
b 1
6A
pr 1
6Ju
n 1
6A
ug
16
Source: Central Bank of Trinidad and Tobago
Money Supply and Commercial Banks’ Deposits and CreditsOver the nine-month period to June 2016, growth of the monetary aggregates declined slightly during the first quarter, but picked up towards the middle of the fiscal year. On a year-on-year basis, growth in narrow money (M1-A); comprising currency in active circulation and demand deposits; grew to 0.3 percent in June 2016, up from its contraction of 8.1 percent in October
THE MONETARY SECTOR
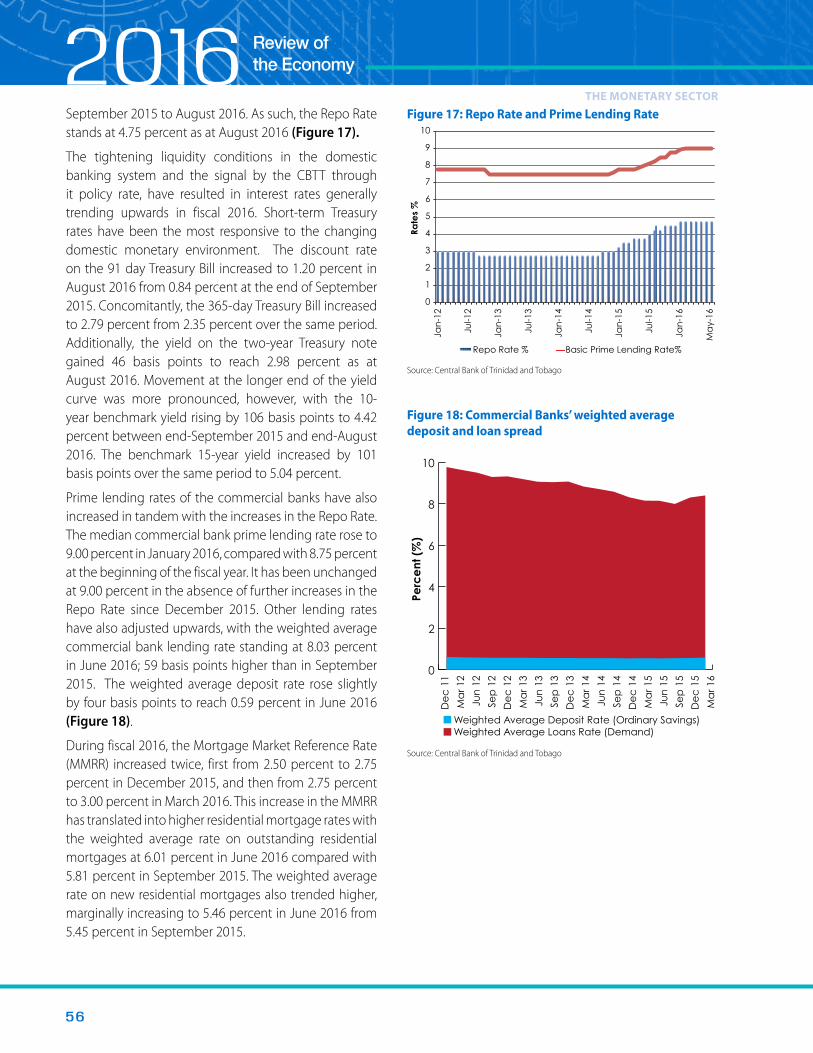
5 6
2016September 2015 to August 2016. As such, the Repo Rate stands at 4.75 percent as at August 2016 (Figure 17).
The tightening liquidity conditions in the domestic banking system and the signal by the CBTT through it policy rate, have resulted in interest rates generally trending upwards in fiscal 2016. Short-term Treasury rates have been the most responsive to the changing domestic monetary environment. The discount rate on the 91 day Treasury Bill increased to 1.20 percent in August 2016 from 0.84 percent at the end of September 2015. Concomitantly, the 365-day Treasury Bill increased to 2.79 percent from 2.35 percent over the same period. Additionally, the yield on the two-year Treasury note gained 46 basis points to reach 2.98 percent as at August 2016. Movement at the longer end of the yield curve was more pronounced, however, with the 10-year benchmark yield rising by 106 basis points to 4.42 percent between end-September 2015 and end-August 2016. The benchmark 15-year yield increased by 101 basis points over the same period to 5.04 percent.
Prime lending rates of the commercial banks have also increased in tandem with the increases in the Repo Rate. The median commercial bank prime lending rate rose to 9.00 percent in January 2016, compared with 8.75 percent at the beginning of the fiscal year. It has been unchanged at 9.00 percent in the absence of further increases in the Repo Rate since December 2015. Other lending rates have also adjusted upwards, with the weighted average commercial bank lending rate standing at 8.03 percent in June 2016; 59 basis points higher than in September 2015. The weighted average deposit rate rose slightly by four basis points to reach 0.59 percent in June 2016 (Figure 18).
During fiscal 2016, the Mortgage Market Reference Rate (MMRR) increased twice, first from 2.50 percent to 2.75 percent in December 2015, and then from 2.75 percent to 3.00 percent in March 2016. This increase in the MMRR has translated into higher residential mortgage rates with the weighted average rate on outstanding residential mortgages at 6.01 percent in June 2016 compared with 5.81 percent in September 2015. The weighted average rate on new residential mortgages also trended higher, marginally increasing to 5.46 percent in June 2016 from 5.45 percent in September 2015.
Figure 17: Repo Rate and Prime Lending Rate
Repo Rate % Basic Prime Lending Rate%
1
2
3
4
5
6
7
8
9
10
0
Rate
s %
Jan
-12
Jul-1
2
Jan
-13
Jul-1
3
Jan
-14
Jul-1
4
Jan
-15
Jul-1
5
Jan
-16
Ma
y-16
Source: Central Bank of Trinidad and Tobago
Figure 18: Commercial Banks’ weighted average deposit and loan spread
Perc
ent
(%
)
Weighted Average Deposit Rate (Ordinary Savings)Weighted Average Loans Rate (Demand)
De
c 1
1
Ma
r 12
Jun
12
Sep
12
De
c 1
2
Ma
r 13
Jun
13
Sep
13
De
c 1
3
Ma
r 14
Jun
14
Sep
14
De
c 1
4
Ma
r 15
Jun
15
Sep
15
De
c 1
5
Ma
r 16
0
2
4
6
8
10
Source: Central Bank of Trinidad and Tobago
THE MONETARY SECTOR

5 7
Securities (General) By-Laws 2015 and the formalisation of its requirements through the TTSEC’s regularisation exercise. This regularisation exercise resulted in the re-registration of market participants under Section 51(1) of the Securities Act 2012 and also required the registration of persons who were not previously required to be registered under the By-Laws 1997. This exercise led to significant increases in the Registered Representatives category of registrants.
Decreases were recorded in the number of Investment Advisors and Reporting Issuers. While the number of Self-Regulatory Organisations, Broker-Dealers (Securities Companies) and Underwriters remained unchanged (Table 10).
Table 10: Total Registrants
Type of RegistrantAs at July 31, 2015
As at July 31, 2016
Registered Representatives 58 143
Investment Advisers 15 13
Reporting Issuers 97 83
Broker-Dealers (Securities Companies)
36 36
Self-Regulatory Organisations (SRO)
2 2
Underwriters 0 0
Sponsored Brokers-Dealers - 6
Total 208 283
Total 224 221Source: Trinidad and Tobago Securities and Exchange Commission
EquitiesThe domestic stock market continued its subdued performances during the nine-month period ending August 2016, paralleling the anemic economic performance during this period. The Composite Price Index (CPI) declined slightly by 0.2 percent from 1152.81 to 1154.92 in August 2016 (year-on-year). The volume of shares traded on the first tier market increased significantly by 34.4 percent (year-on-year) from 65.1 million in August 2015 to 90.7 million in August 2016. For the comparative period, the value of shares traded
LiquidityDuring the October 2015 to August 2016 period, the CBTT allowed net $6,578.1 million of (OMOs) Treasury securities to mature. This compares with the CBTT’s sterilisation of $5,081.0 million from the banking system via net OMOs over the comparative period one year earlier. The CBTT relaxed liquidity conditions to allow financial institutions to better participate in the Central Government’s bond issues during the fiscal year. (Figure 19).
Figure 19: Liquidity Indicators
30,000
25,000
20,000
15,000
10,000
5,000
0
-5,000
-10,00
Net Domestic Fiscal Injections TT$MCBTT Sale of FX TT$M
(TT$
Mill
ions
)
Excess Reserves (Avg.)Commercial Banks: Deposits at Central Bank
Oc
t-13
Jan
-14
Jun
-14
Jan
-15
Jun
-15
Jan
-16
Au
g-1
6
Source: Central Bank of Trinidad and Tobago
FINANCIAL SECTOR PERFORMANCECapital Market Activity Trinidad and Tobago Securities and Exchange Commission (TTSEC)
The domestic capital market comprised mainly debt instruments, securitised instruments, repurchase agreements, equities and collective investments schemes with a total of 221 registrants as at July 31, 2016; down from 224 registrants at July 2015.
The composition of the TTSEC’s registrants was significantly changed due to the passage of the
THE MONETARY SECTOR

5 8
2016increased by 36.1 percent from $801.0 million to $1,090.1 million. Market capitalisation on the first tier market increased slightly by 2.0 percent to stand at $112.6 billion at the end of August 2016, up from $110.4 billion in August 2015.
Since the First Citizens Bank’s initial public offering (IPO) in September 2013, two additional IPOs have come to the market. The first being Stallion Property Trust which opened for investment in May 2015; and Phoenix Park Gas Processors Limited IPO in August 2015.
The Stallion Property Trust offering was withdrawn due to under-subscription of the offering with all funds being returned to investors. The withdrawal was made on account of the fact that the business model required full subscription.
The highly anticipated IPO of Phoenix Park Gas Processors Limited (PPGPL); one of the largest gas processing facilities in the Americas, which offered 49.0 percent of the Trinidad and Tobago NGL holdings of PPGPL was oversubscribed by 1.77 times. The stock began trading on the TTSE on Monday 19, October 2015, where it maximised the daily change rate to close the day 15 percent higher at $23 per share. Market capitalisation was increased by $2.7 billion as a result of the issue of 116.1 million of PPGPL shares. The share price stood at $23.75 at the end of August 2016, representing an 18.8 percent price increase since the initial public offering 11 months ago.
Primary Bond MarketThe domestic primary bond market was relatively active over the period October 2015 to June 2016. This was evidenced by 15 issues raising approximately $7.2 billion compared to 9 issues raising $4.1 billion in the same period one year earlier. The Central Government was the main issuer over the period, with three bonds totalling $4.5 billion. State Enterprises, issued 8 bonds, totalling $1.6 billion, while the private sector issued 4 bonds, financing just over $1.1 billion. Compared with the same period one year prior, the Central Government issued six bonds which raised almost $3.8 billion and the private sector issued five placements raising just over $1.7 billion.
On the Secondary Government Bond Market there was higher trading activity over the eleven months ended
August 2016, than occurred during the same period one year ago. Over the review period there were 140 trades of Central Government bonds with a combined face value of approximately $1.5 billion, compared with 100 trades with a face value of $503.9 million in the same period in 2014-2015.
Mutual FundsActivity in the mutual fund sector slowed over the nine-month period October 2015 to June 2016 as aggregate sales fell by 2.6 percent while repurchases increased by 76.0 percent. Funds under management fell by 20.4 percent from $50.1 billion to $39.9 billion led by RBC’s 43.0 percent decline in funds under management (Figure 20c).
Money Market Funds accounted for funds under management growing by 0.3 percent on a year-on-year basis; moving from $30.4 billion to $30.6 billion. The equity funds segment of the market declined by 10.5 percent on a year-on-year basis; moving from $10.4 billion to $9.3 billion.
In terms of market share, the Unit Trust Corporation’s (UTC) dominance of the mutual funds industry continued in the two major classifications of the funds; the Growth and Income and Money Market segments.
The UTC accounted for 49.0 percent of the Money Market segment of the market at the end of June 2016, up marginally from its 47.0 percent share at the end of June 2015. RBC Royal Bank (RBC) Limited’s family of mutual funds lost market share, decreasing its share of the market from 33.0 percent to 31.0 percent. Whereas Republic Bank Limited (RBL) and First Citizens Asset Management (FCB) maintained their share of the market at 19.0 percent and 1.0 percent respectfully (Figure 20a).
The Growth and Income segment of the mutual fund market was dominated by the UTC which held 50.0 percent of this market segment at the end of June 2016, 1.0 percentage point higher than at the end of June 2015. RBC’s share of the segment declined to 45.0 percent at the end of June 2016 down from 47.0 percent at the end of June 2015. RBL’s share of the market moved to 3.0 percent in 2016, from 2.0 percent in 2015, whereas FCB maintained its 2.0 percent market share (Figure 20b).
THE MONETARY SECTOR

5 9
UTC RBC RBL FCB
TT$
Billi
on
Jun 2015Jun 2016
0
5
10
15
20
25
30
35
40
0.420.51
19.68
19.49
13.69
23.996.09
6.12
RBL 2%FCB 2%
RBC 47%
UTC 49% RBL 3%FCB 2%
RBC 45%
UTC 50%
RBL 19%FCB 1%
RBC 33%
UTC 47%RBL 19%
FCB 1%
RBC 31%
UTC 49%
Figure 20: Comparative Analysis
(a) Market Share - Money Market Funds
(b) Market Share - Growth and Income Funds
(c) Funds under Management
June 2015
June 2015
June 2016
June 2016
Sources: UTC, RBL, RBC and FCB
THE MONETARY SECTOR
6 0
2016REGULATORY DEVELOPMENTSLegislative DevelopmentsDuring the year under review, the legislative and regulatory framework of the monetary sector saw the advancement of a number of initiatives which targeted the enhancement of the security and stability of the financial system of Trinidad and Tobago.
Of notable importance was the implementation of the Basel II Framework for local banking institutions by the CBTT. The framework aims to improve the risk sensitivity of regulatory capital in the banking sector and align local capital standards with international counterparts. Additionally, the Insurance Bill was laid in Parliament again on July 1, 2016, while the Credit Union Bill has been scheduled for the mid-term 2017-2019 on the Government’s legislative agenda. Moreover, the Caribbean Financial Action Task Force (CFATF) completed its National Risk Assessment (NRA) in June 2016 and subsequently published the 4th Round Mutual Evaluation of Trinidad and Tobago. The collaborative negotiations of the Ministry of Finance and the Board of Inland Revenue continued with the Internal Revenue Service (IRS) of the United States of America with regard to the Foreign Account Tax Compliant Act (FATCA).
Revised Capital Adequacy Standards/Implementation of Basel II
During fiscal 2015/2016, the CBTT continued to drive the implementation of Basel II forward and introduced revised capital standards for institutions licensed under the Financial Institutions Act, 2008. In November 2014, the CBTT issued a policy proposal document which presented proposals for the first phase of the implementation and addresses quantitative capital standards for banks and non-bank financial institutions. Phase 2 addresses the supervisory review process, and Phase 3 deals with the treatment of market discipline via appropriate disclosures by the relevant financial institutions, respectively and are to be implemented at a later date. Phase I incorporates:
(i) changes to the methodology for the calculation of credit risk capital charges;
(ii) increases of the minimum capital adequacy ratio; and
(iii) introducing capital provisioning for operational risk.
In addition to leading the Basel II Technical Working Group (which addresses implementation issues), the CBTT held several consultative sessions with the industry during the year. Moreover, an implementation project plan, revised capital adequacy reporting template and implementation guidelines were issued to the industry. At the same time, a quantitative impact study was launched to examine the impact of the new proposals on the capital position of the relevant financial institutions.
The Insurance Bill
In April 2015, the Insurance Bill 2015 was laid in Parliament, and was subsequently referred to a Joint Select Committee (JSC) to undertake a detailed review of the substantive changes. On May 26, 2015, the Bill was passed in the Senate with amendments and was then laid in the House of Representatives. However, the Bill lapsed on June 17, 2015 when Parliament was dissolved. On Friday July 1, 2016, the Insurance Bill 2016, which is identical to the Bill that was previously passed in the Senate, was laid in Parliament.
This Bill seeks to, among other things, address the current legislative deficiencies by strengthening prudential requirements and enhancing corporate governance practices within the insurance sector. The Bill will also allow for greater accountability by the regulator, Boards of Directors and senior management of insurance companies, intermediaries, external auditors and liquidators.
Motor Vehicle Accident Fund (MVAF)
The MVAF policy was approved by Cabinet in March 2015 and the legislation is being drafted, and is included on the Government’s legislative agenda for the 2019-2020 period. A Committee comprising members from the CBTT, Ministry of Finance, the Association of Trinidad and Tobago Insurance Companies (ATTIC) and other key stakeholders, was established to deal with issues relating to the operation of the MVAF.
THE MONETARY SECTOR

6 1
Anti-Money Laundering and Counter Terrorist Financing (AML/CFT)
The National Risk Assessment (NRA) began in March 2014 and was completed during the period with the assistance of the World Bank. This NRA, aimed to identify the main risks and determinants of money laundering and terrorist financing in Trinidad and Tobago. The draft NRA Report was approved by Cabinet and finalisation of the action plan is pending. Additionally, in May 2016, a NRA workshop was jointly held by the National Anti-Money Laundering Committee (NAMLC) and the World Bank, of which public and private sector stakeholders participated.
Moreover, in June 2016, the Caribbean Financial Action Task Force (CFATF) published the 4th Round Mutual Evaluation of Trinidad and Tobago, which indicated that Trinidad and Tobago has established a relatively sound AML/CFT framework, and has made recommendations for strengthening the regime.
Revised Terms and Conditions for the Operations of a Bureau de Change
In August 2015, the CBTT issued revised “Terms and Conditions of Operations of a Bureau de Change”, which became effective September 1, 2015. These Terms and Conditions were issued pursuant to Section 5 of the Exchange Control Act, Chap. 79:50, and include provisions to:
• introduce fit and proper requirements for directors, officers, controlling shareholders and external auditors;
• introduce minimum capital requirements of $500,000;
• provide for the conduct of on-site examinations; and
• stipulate regulatory/enforcement actions by the CBTT for non-compliance with the Terms and Conditions.
A transition period of six (6) months is allowed for compliance with the fit and proper standards and 24 months for the minimum capital requirements. The CBTT intends to conduct a post-implementation review to further refine and enhance the relevant Terms and Conditions.
Loan Loss Classification and Provisioning Standards
During the review period, a Technical Working Group of the Caribbean Group of Banking Supervisors (CGBS) was established with the aim of harmonising loan classifications and provisioning standards within the region. These harmonised provisions will aid regional regulators in cross-border consolidated supervision and risk assessments. The working group developed and issued a first draft of the document for comment by members, and the final document is expected to be issued by the CGBS in 2016.
Regional Consolidated Supervision Framework
A protocol for the conduct of Consolidated Supervision was developed by a Technical Working Group established by the CGBS and chaired by the CBTT. The Protocol was developed and circulated for comment. The final document was submitted to the CGBS in May 2016 for adoption.
Foreign Account Tax Compliance Act (FATCA)
Trinidad and Tobago is currently classified as a jurisdiction that has reached an agreement in substance as of November 30, 2014 with the United States of America’s IRS on a Model 1 Inter-Governmental Agreement (IGA). During the review period, the US Treasury Department extended the deadline for Model 1 IGA countries for the reporting of FATCA specific information to September 30, 2016. The Model 1 IGA was signed by the Government of Trinidad and Tobago and the USA on August 16, 2016. The TIEA Bill 2016, which is necessary to incorporate the IGA into domestic law and requires a 3/5 majority, was laid in Parliament on September 9, 2016. The proceedings on this Bill were resumed in the new session of Parliament, which commenced on September 23, 2016, and the Bill is currently being debated in the House of Representatives. An application has thus been made by the Government to the US Treasury for a further extension to 2017 of the FATCA reporting deadline. It is envisioned that the legislation to operationalise the IGA will repeal and replace the Tax Information Exchange Agreement (TIEA).
THE MONETARY SECTOR

6 2
2016TRADE AND PAYMENTS
Balance of Payments Heritage and Stabilisation Fund
Balance of Visible Trade
Balance of PaymentsOwing predominantly to a severe collapse in the trade balance, the balance of payments is projected to record an overall deficit of US$1,529 million in 2015, denoting a substantial deterioration of 215 percent over the US$1,330 million surplus estimated in the previous year. Contributing to this performance were the decline of both Current and Capital and Financial Accounts, which decreased from US$378 million to negative US$101 million, and from US$952 million to negative US$1,427 million over the period 2014 to 2015, respectively (Table 11).
Current Account32
The Current Account decreased significantly (127 percent) to a negative of US$101 million from US$378 million reported in 2014. This Current Account deficit reflected a severe decline in the merchandise trade balance (59.6 percent) which in turn, is attributable to falling energy sector exports. Energy exports declined by 30.3 percent, from US$12,093 million in 2014 to US$ 8,423 million in 2015. The services, income and transfers (net) account collectively registered a lowered deficit of US$1,432 million in 2015 as compared to a deficit of US$2,912 million in 2014, attributable largely to an improvement in factor income (net) of 73 percent (Table 11).
Capital Account33
Lackluster performance in the energy sector and the weak pace of economic activity triggered a deficit on the Capital Account which diminished drastically by 250 percent from US$952 million in 2014 to -US$1,427 million in 2015. Key contributory factors include the challenges faced by the petrochemicals sector and deterioration under foreign direct investment (net) and commercial banks (net). Direct investment fell to US$583 million in 2015, a 52 percent decrease from US$1,214 million reported in 2014. In turn, commercial banks increased their holdings abroad (net foreign assets) resulting in a mammoth 738 percent decrease from US$66 million in 2014 to -US$421 million in 2015. Comparably, over the corresponding period portfolio outflows contracted by 42.5 percent to a deficit of US$96 million in 2015, from a deficit of US$167 million in 2014 (Table 11).
Foreign ReservesNet Official Reserves, continuing to exceed conventional benchmarks of reserve adequacy, were US$10,077 million in September 2016, representing 11.1 months of prospective import cover, compared to US$10,312 million in September 2015.
32 The current account (balance of payments) shows components of goods and services, income, and current transfers.
33 The capital account records acquisitions less disposals of non-financial assets by resident units and measures the change in net worth due to saving (final balancing item in the current accounts) and capital transfers.

6 3
Table 11: Summary Balance of Payments (US$ million)
2011r 2012r 2013r 2014r 2015p
Current Account 1,787 (2,739) 3,420 378 (101)
Trade Balance 5,455 1,272 6,116 3,290 1,330
Exports 14,943 12,916 18,745 14,566 10,804
Energy 12,597 9,782 15,188 12,093 8,423
Non-Energy 2,346 3,135 3,557 2,473 2,381
Imports 9,488 11,644 12,629 11,276 9,474
Energy 4,308 5,589 7,141 5,586 3,301
Non-Energy 5,180 6,055 5,488 5,691 6,173
Services (628) (655) (445) (470) (735)
Income (3,074) (3,390) (2,275) (2,421) (650)
Transfers 33 34 25 (21) (47)
Capital and Financial Account (1,035) 2,117 (2,634) 952 (1,427)
Private Sector (719) 2,943 (2,594) 1,220 (1,338)
Direct Investment 771 772 (66) 1,214 583
Portfolio Investment (85) (446) (100) (167) (96)
Commercial Banks (310) (669) 94 66 (421)
Other Private Sector Capital* (1,094) (3,286) (2,522) 108 (1,404)
Public Sector** (316) (827) (40) (268) (89)
Overall Surplus/Deficit 753 (622) 786 1,330 (1,529)
Memo Items:
Net Official Reserves*** 9,346 9,335 9,427 10,119 10,312
Import Cover*** 12.8 10.7 11.3 11.5 11.8
Source: Central Bank of Trinidad and Tobago and the Central Statistical Office Figures may not sum due to rounding r Revised p Provisional data for 2015 represent data reported by the Central Statistical Office for Jan-Sep 2015 and an estimate for Oct-Dec 2015 prepared by the Central Bank. * Includes Errors and Omissions ** Includes Official Borrowing, State Enterprise, Heritage and Stabilisation Fund, Other Assets and Other Liabilities. *** End of Financial Year
TRADE AND PAYMENTS

6 4
2016Heritage and Stabi l isat ion Fund (HSF)At the end of June 2016, the Net Asset Value of the Trinidad and Tobago Heritage and Stabilisation Fund stood at US$5,454.6 million, down from US$5,787.3 million recorded in March 2016. Of this total, the investment portfolio was valued at US$5,452.7 million, while the remaining portion (US$1.9 million) was held in cash to meet the day-to-day expenses arising from the management of the Fund.
Amid the sustained slump in oil prices and its concomitant dire effects, Government, in May 2016, withdrew US$377.5 million from the HSF to support its expenditure. While there were no deposits to the Fund during fiscal year 2015/2016, a 3.3 percent return on the Fund was realised. No further drawdowns are envisaged in fiscal 2016.
Balance of Visible Trade 34
For the period April 2015 to June 2016, Trinidad and Tobago’s balance of visible trade declined by 37.6 percent to TT$7,837.2 million (from TT$12,566.1 million) over the corresponding period one year earlier. Both exports and imports of visible trade faltered considerably from TT$102,518.9 million to TT$71,999.1 million, and TT$89,952.8 million to TT$64,161.9 million, respectfully, for the periods April 2014 to June 2015 and April 2015 to June 2016. This trade outturn is attributable to declines of 31.9 percent in Trade Excluding Mineral Fuels; 42.5 percent in Trade Excluding Mineral Fuels UPA; and 30.8 percent in Trade in Mineral Fuels non – UPA. Conversely, declines in exports and imports relating to Trade in Mineral Fuels UPA reduced the April 2014 to June 2015 deficit of TT$2,259.0 million to TT$684.2 million from April 2015 to June 2016 (Appendix 28).
34 The difference in value over a period of time of a country’s imports and exports of merchandise.
BOX 4: Rules of Withdrawals from the HSF
At present, the governing legislation for the Trinidad and Tobago Heritage and Stabilisation Fund (HSF) sets forth the conditions under which a withdrawal may be made from the Fund. The Withdrawal Rules are such that they cater for the intended stabilisation function (by placing withdrawals within the context of the fiscal shortfall affecting the Government) as well as the heritage purpose (by setting a “floor” below which the Fund cannot be depleted).
The Rules of Withdrawal are governed by Section 15 of the HSF Act No. 6 of 2007 which states:
1. Subject to subsections (2) and (3), where the petroleum revenues collected in any financial year fall below the estimated petroleum revenues for that financial year by at least ten percent, withdrawals may be made from the Fund as follows, whichever is the lesser amount: (a) either sixty percent of the amount of the shortfall of petroleum revenues for that year; or (b) twenty-five percent of the balance standing to the credit of the Fund at the beginning of that year.
2. The amount withdrawn from the Fund in accordance with subsection (1), shall be deposited into the Consolidated Fund within forty-eight hours of such withdrawal.
3. Notwithstanding subsection (1), no withdrawal may be made from the Fund in any financial year, where the balance standing to the credit of the Fund would fall below one billion dollars in the currency of the United States of America, if such withdrawal were to be made.
TRADE AND PAYMENTS

6 5
Trinidad and Tobago - Guatemala Partial Scope Trade AgreementAfter four rounds of negotiations for the Trinidad and Tobago - Guatemala Partial Scope Agreement in Investment, Culture and Tourism, both parties signed the Agreement on February 6, 2015. The Agreement allows for the entry of one hundred and forty-six (146) products into Guatemala at preferential duties as well as the elimination or reduction of import tariffs for one hundred and forty-three (143) Guatemalan products into Trinidad and Tobago. A draft Bill has been prepared and the Agreement awaits completion of domestic procedures prior to entry into force.
World Trade Organisation (WTO) - Agreement on Trade FacilitationThe WTO Agreement on Trade Facilitation (TFA) aims to elevate global trade by expediting the movement, release, and clearance of goods. The Agreement enters into force globally when two-thirds of the WTO Membership ratifies the TFA. The Agreement seeks to improve the conditions under which goods are traded through the establishment of rules for further expediting the movement, release and clearance of goods. It also seeks to eliminate the ‘red tape’ or bureaucracy that exists at the borders where goods are traded. A National Trade Facilitation Committee (NTFC) was established in January 2016 and convened in March 2016 to oversee domestic implementation of the TFA. The NTFC is currently preparing an Implementation Plan to ensure compliance with the TFA.
Caricom-Costa Rica Free Trade AgreementThe outcomes of the First Meeting of the Joint Council under the CARICOM-Costa Rica Free Trade Agreement (FTA) held in July 2015 were presented to the 41st Meeting of the CARICOM Council of Trade and Economic Development in November 2015. The Committees on Trade in Services and Market Access established under the CARICOM – Costa Rica FTA are expected to be
Caricom TradeTrinidad and Tobago’s balance of trade with CARICOM countries decreased from TT$11,872.5 million for the period April 2014 to June 2015, to TT$5,943.5 million (50 percent) for the corresponding period in 2016. This deterioration in the trade balance is attributable in large part to the drastic decline (64.6 percent) in the value of exports of mineral fuels which contracted from TT$8,148.2 million to TT$2,884.6 million. The Balance of Trade Excluding Mineral Fuels also contracted considerably (22.3 percent) owing to decreases in exports excluding mineral fuels as well as imports excluding mineral fuels. The former declined from TT$5,250.1 million to TT$4,209.5 million (19.8 percent) while the latter contracted from TT$1,082.7 million to TT$973.2 million (10.1 percent) (Appendix 27).
Trade AgreementsTrinidad and Tobago-Panama Partial Scope Trade AgreementThe Trinidad and Tobago-Panama Partial Scope Agreement was signed on October 3, 2013. Both parties exchanged instruments of ratification on June 4, 2016 and the Agreement entered into force thirty days thereafter. His Excellency, President Anthony Carmona gave assent to the Trinidad and Tobago – Panama Partial Scope Trade Agreement on April 1, 2015 via Act No. 5 of 2015. Under the Agreement, Panama provides preferential access for 230 products from Trinidad and Tobago including agro processed goods (cocoa, cereals, and nuts), water, plastic and paper containers and other packaging material, paper products, tiles and blocks and metal products. Trinidad and Tobago committed to provide preferential access for 248 products coming from Panama. Among these products are agricultural products (minced meat, meat of bovine animals, edible offal of bovine animals, mackerel, eggs, fruits and vegetables), agro processed products (cocoa, infant juices, pear, apricot and peach juices) lubricating oils, plastic ware, wood, paper products, clothing and apparel products and metal products.
TRADE AND PAYMENTS

6 6
2016convened to discuss the following key issues in further detail – temporary Entry of Business Persons, Contact Points, and Market Access difficulties.
Caricom-Cuba Trade and Economic Cooperation AgreementThe Ninth Meeting of the Joint Commission under the Trade and Economic Cooperation Agreement between the CARICOM Community (CARICOM) and the Republic of Cuba was held in October 2015 in Havana, Cuba. Progress was made on the negotiation for the expansion of preferential access by the confirmation of offers by both Parties. The results of the negotiations for expansion of preferential access will be reflected in a Second Protocol Implementing the CARICOM – Cuba Trade and Economic Cooperation Agreement which is expected to be signed at a date mutually agreed by CARICOM and Cuba.
The Ninth Meeting of the Joint Commission also advanced the discussions on the Product Specific Rules of Origin (PSRO), completed the Rules of Procedure for the Joint Commission, and agreed on the text of the Draft Second Protocol.
BOX 5: The Venezuela - TT Trade Agreement
In May 2016, the Bolivarian Republic of Venezuela and Trinidad and Tobago agreed to an arrangement to purchase goods manufactured in Trinidad and Tobago and paid for by Venezuela via a US$50 million revolving fund, for the supply of twelve (12) products prioritised by Caracas for immediate purchase. These included 9 food items and 3 personal hygiene products, valued at US$26,977,370. These products were intended to service the monthly needs of approximately four (4) million citizens in eastern Venezuela. Additional agreements would be signed upon completion of the first contract and the arrangement is expected to continue until decided otherwise by both countries.
In June 2016, Trinidad and Tobago companies (VEMCO Limited, Trinidad Parboil Limited/Old Mac Agro Supplies Limited, Arawak and Company Limited, John Dickinson and Co. (W.I) Limited, National Canners Limited, National Flour Mills, Coconut Growers Association Limited and Nutrimix Feeds Limited) signed commercial contracts with Corporación Venezolana de Comercia Exterior (CORPOVEX) in Port of Spain.
Venezuela has signaled interest in including additional products in the near future and has also expressed a strong desire to move beyond the purchase of goods into investment and joint venture initiatives. Both sides will explore additional opportunities in other parts of Venezuela.
TRADE AND PAYMENTS
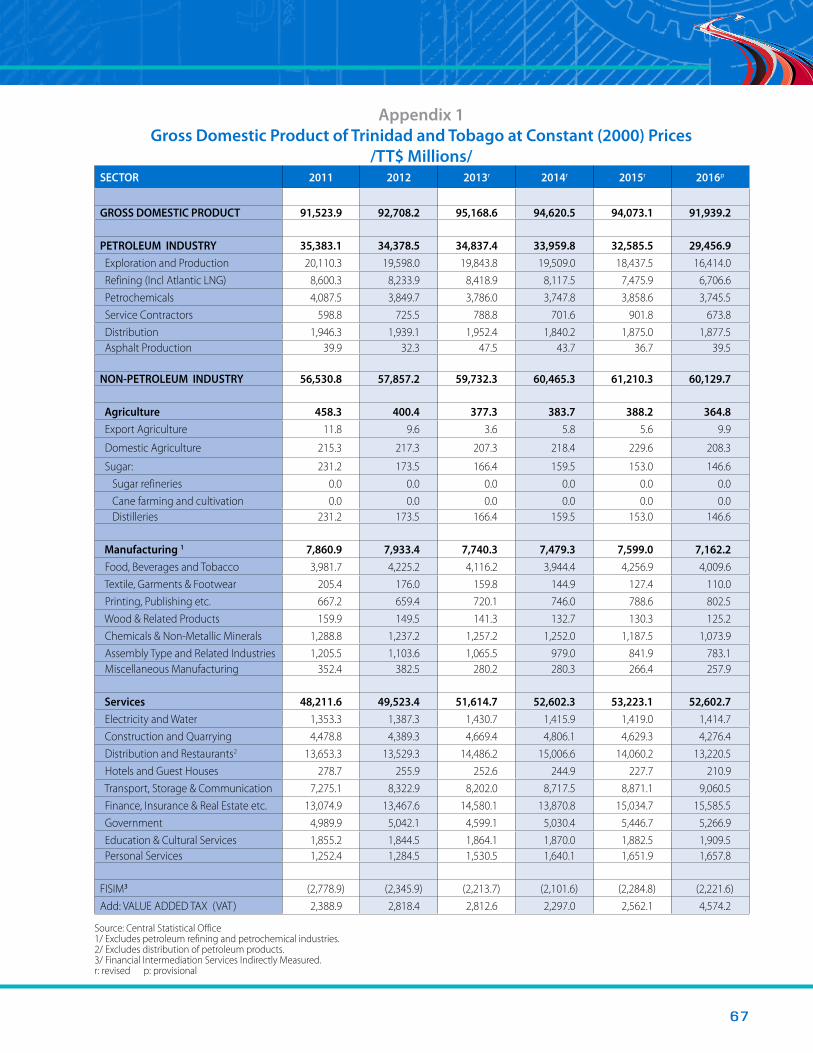
6 7
SECTOR 2011 2012 2013r 2014r 2015r 2016p
GROSS DOMESTIC PRODUCT 91,523.9 92,708.2 95,168.6 94,620.5 94,073.1 91,939.2
PETROLEUM INDUSTRY 35,383.1 34,378.5 34,837.4 33,959.8 32,585.5 29,456.9 Exploration and Production 20,110.3 19,598.0 19,843.8 19,509.0 18,437.5 16,414.0 Refining (Incl Atlantic LNG) 8,600.3 8,233.9 8,418.9 8,117.5 7,475.9 6,706.6 Petrochemicals 4,087.5 3,849.7 3,786.0 3,747.8 3,858.6 3,745.5 Service Contractors 598.8 725.5 788.8 701.6 901.8 673.8 Distribution 1,946.3 1,939.1 1,952.4 1,840.2 1,875.0 1,877.5 Asphalt Production 39.9 32.3 47.5 43.7 36.7 39.5
NON-PETROLEUM INDUSTRY 56,530.8 57,857.2 59,732.3 60,465.3 61,210.3 60,129.7
Agriculture 458.3 400.4 377.3 383.7 388.2 364.8 Export Agriculture 11.8 9.6 3.6 5.8 5.6 9.9
Domestic Agriculture 215.3 217.3 207.3 218.4 229.6 208.3
Sugar: 231.2 173.5 166.4 159.5 153.0 146.6 Sugar refineries 0.0 0.0 0.0 0.0 0.0 0.0 Cane farming and cultivation 0.0 0.0 0.0 0.0 0.0 0.0 Distilleries 231.2 173.5 166.4 159.5 153.0 146.6
Manufacturing 1 7,860.9 7,933.4 7,740.3 7,479.3 7,599.0 7,162.2 Food, Beverages and Tobacco 3,981.7 4,225.2 4,116.2 3,944.4 4,256.9 4,009.6 Textile, Garments & Footwear 205.4 176.0 159.8 144.9 127.4 110.0 Printing, Publishing etc. 667.2 659.4 720.1 746.0 788.6 802.5 Wood & Related Products 159.9 149.5 141.3 132.7 130.3 125.2 Chemicals & Non-Metallic Minerals 1,288.8 1,237.2 1,257.2 1,252.0 1,187.5 1,073.9 Assembly Type and Related Industries 1,205.5 1,103.6 1,065.5 979.0 841.9 783.1 Miscellaneous Manufacturing 352.4 382.5 280.2 280.3 266.4 257.9
Services 48,211.6 49,523.4 51,614.7 52,602.3 53,223.1 52,602.7 Electricity and Water 1,353.3 1,387.3 1,430.7 1,415.9 1,419.0 1,414.7 Construction and Quarrying 4,478.8 4,389.3 4,669.4 4,806.1 4,629.3 4,276.4 Distribution and Restaurants2 13,653.3 13,529.3 14,486.2 15,006.6 14,060.2 13,220.5 Hotels and Guest Houses 278.7 255.9 252.6 244.9 227.7 210.9 Transport, Storage & Communication 7,275.1 8,322.9 8,202.0 8,717.5 8,871.1 9,060.5 Finance, Insurance & Real Estate etc. 13,074.9 13,467.6 14,580.1 13,870.8 15,034.7 15,585.5 Government 4,989.9 5,042.1 4,599.1 5,030.4 5,446.7 5,266.9 Education & Cultural Services 1,855.2 1,844.5 1,864.1 1,870.0 1,882.5 1,909.5 Personal Services 1,252.4 1,284.5 1,530.5 1,640.1 1,651.9 1,657.8
FISIM3 (2,778.9) (2,345.9) (2,213.7) (2,101.6) (2,284.8) (2,221.6)Add: VALUE ADDED TAX (VAT) 2,388.9 2,818.4 2,812.6 2,297.0 2,562.1 4,574.2
Source: Central Statistical Office 1/ Excludes petroleum refining and petrochemical industries. 2/ Excludes distribution of petroleum products. 3/ Financial Intermediation Services Indirectly Measured. r: revised p: provisional
Appendix 1Gross Domestic Product of Trinidad and Tobago at Constant (2000) Prices
/TT$ Millions/

6 8
2016SECTOR 2011 2012 2013r 2014r 2015r 2016p
GROSS DOMESTIC PRODUCT (0.3) 1.3 2.7 (0.6) (0.6) (2.3)
PETROLEUM INDUSTRY (3.9) (2.8) 1.3 (2.5) (4.0) (9.6) Exploration and Production (4.4) (2.5) 1.3 (1.7) (5.5) (11.0) Refining (Incl Atlantic LNG) (5.8) (4.3) 2.2 (3.6) (7.9) (10.3) Petrochemicals (4.7) (5.8) (1.7) (1.0) 3.0 (2.9) Service Contractors 62.6 21.2 8.7 (11.1) 28.5 (25.3) Distribution (0.5) (0.4) 0.7 (5.7) 1.9 0.1 Asphalt Production 43.5 (19.0) 47.1 (8.0) (16.0) 7.6
NON-PETROLEUM INDUSTRY 3.2 2.3 3.2 1.2 1.2 (1.8)
Agriculture 0.3 (12.6) (5.8) 1.7 1.2 (6.0)Export Agriculture 103.4 (18.6) (62.5) 61.1 (3.4) 76.8 Domestic Agriculture 3.7 0.9 (4.6) 5.4 5.1 (9.3)
Sugar: (5.0) (25.0) (4.1) (4.1) (4.1) (4.2) Sugar refineries 0.0 0.0 0.0 0.0 0.0 0.0 Cane farming and cultivation 0.0 0.0 0.0 0.0 0.0 0.0 Distilleries (5.0) (25.0) (4.1) (4.1) (4.1) (4.2)
Manufacturing 1 (0.3) 0.9 (2.4) (3.4) 1.6 (5.7) Food, Beverages and Tobacco 1.9 6.1 (2.6) (4.2) 7.9 (5.8) Textile, Garments & Footwear (1.0) (14.3) (9.2) (9.3) (12.1) (13.7) Printing, Publishing etc. (0.3) (1.2) 9.2 3.6 5.7 1.8 Wood & Related Products 12.5 (6.5) (5.5) (6.1) (1.8) (3.9) Chemicals & Non-Metallic Minerals 3.5 (4.0) 1.6 (0.4) (5.2) (9.6) Assembly Type and Related Industries (9.2) (8.5) (3.5) (8.1) (14.0) (7.0) Miscellaneous Manufacturing (8.5) 8.5 (26.7) 0.0 (5.0) (3.2)
Services 3.9 2.7 4.2 1.9 1.2 (1.2) Electricity and Water 6.4 2.5 3.1 (1.0) 0.2 (0.3) Construction and Quarrying (8.8) (2.0) 6.4 2.9 (3.7) (7.6) Distribution and Restaurants2 9.8 (0.9) 7.1 3.6 (6.3) (6.0) Hotels and Guest Houses (8.7) (8.2) (1.3) (3.0) (7.0) (7.4) Transport, Storage & Communication 2.8 14.4 (1.5) 6.3 1.8 2.1 Finance, Insurance & Real Estate etc. 5.3 3.0 8.3 (4.9) 8.4 3.7 Government (0.7) 1.0 (8.8) 9.4 8.3 (3.3) Education & Cultural Services (2.4) (0.6) 1.1 0.3 0.7 1.4 Personal Services 16.8 2.6 19.2 7.2 0.7 0.4
FISIM3 (2.4) (15.6) (5.6) (5.1) 8.7 (2.8)Add: VALUE ADDED TAX (VAT) (22.4) 18.0 (0.2) (18.3) 11.5 78.5
Source: Central Statistical Office 1/ Excludes petroleum refining and petrochemical industries. 2/ Excludes distribution of petroleum products. 3/ Financial Intermediation Services Indirectly Measured. r: revised p: provisional
Appendix 2Gross Domestic Product of Trinidad and Tobago at Constant (2000) Prices
/Percentage Change/

6 9
SECTOR 2011 2012 2013r 2014r 2015r 2016p
GROSS DOMESTIC PRODUCT 100.0 100.0 100.0 100.0 100.0 100.0
PETROLEUM INDUSTRY 38.7 37.1 36.6 35.9 34.6 32.0 Exploration and Production 22.0 21.1 20.9 20.6 19.6 17.9 Refining (Incl Atlantic LNG) 9.4 8.9 8.8 8.6 7.9 7.3 Petrochemicals 4.5 4.2 4.0 4.0 4.1 4.1 Service Contractors 0.7 0.8 0.8 0.7 1.0 0.7 Distribution 2.1 2.1 2.1 1.9 2.0 2.0 Asphalt Production 0.04 0.03 0.05 0.05 0.04 0.04
NON-PETROLEUM INDUSTRY 61.8 62.4 62.8 63.9 65.1 65.4
Agriculture 0.5 0.4 0.4 0.4 0.4 0.4 Export Agriculture 0.01 0.01 0.00 0.01 0.01 0.01 Domestic Agriculture 0.2 0.2 0.2 0.2 0.2 0.2 Sugar: 0.3 0.2 0.2 0.2 0.2 0.2
Sugar refineries 0.00 0.00 0.00 0.00 0.00 0.00 Cane farming and cultivation 0.00 0.00 0.00 0.00 0.00 0.00 Distilleries 0.3 0.2 0.2 0.2 0.2 0.2
Manufacturing 1 8.6 8.6 8.1 7.9 8.1 7.8 Food, Beverages and Tobacco 4.4 4.6 4.3 4.2 4.5 4.4 Textile, Garments & Footwear 0.2 0.2 0.2 0.2 0.1 0.1 Printing, Publishing etc. 0.7 0.7 0.8 0.8 0.8 0.9 Wood & Related Products 0.2 0.2 0.1 0.1 0.1 0.1 Chemicals & Non-Metallic Minerals 1.4 1.3 1.3 1.3 1.3 1.2 Assembly Type and Related Industries 1.3 1.2 1.1 1.0 0.9 0.9 Miscellaneous Manufacturing 0.4 0.4 0.3 0.3 0.3 0.3
Services 52.7 53.4 54.2 55.6 56.6 57.2 Electricity and Water 1.5 1.5 1.5 1.5 1.5 1.5 Construction and Quarrying 4.9 4.7 4.9 5.1 4.9 4.7 Distribution and Restaurants2 14.9 14.6 15.2 15.9 14.9 14.4 Hotels and Guest Houses 0.3 0.3 0.3 0.3 0.2 0.2 Transport, Storage & Communication 7.9 9.0 8.6 9.2 9.4 9.9 Finance, Insurance & Real Estate etc. 14.3 14.5 15.3 14.7 16.0 17.0 Government 5.5 5.4 4.8 5.3 5.8 5.7 Education and Cultural Services 2.0 2.0 2.0 2.0 2.0 2.1 Personal Services 1.4 1.4 1.6 1.7 1.8 1.8
FISIM³ (3.0) (2.5) (2.3) (2.2) (2.4) (2.4)Add: VALUE ADDED TAX (VAT) 2.6 3.0 3.0 2.4 2.7 5.0
Source: Central Statistical Office 1/ Excludes petroleum refining and petrochemical industries. 2/ Excludes distribution of petroleum products. 3/ Financial Intermediation Services Indirectly Measured. r: revised p: provisional
Appendix 3Gross Domestic Product of Trinidad and Tobago at Constant (2000) Prices
/Percentage Contribution/

7 0
2016SECTOR 2011 2012 2013r 2014r 2015r 2016p
GROSS DOMESTIC PRODUCT 163,007.8 165,203.2 170,317.6 167,764.3 150,246.6 145,910.7
PETROLEUM INDUSTRY 73,005.9 68,467.3 63,416.0 57,388.9 37,209.9 27,457.4 Exploration and Production 38,506.0 38,467.5 38,692.0 32,063.1 17,528.4 11,943.2 Refining (Incl Atlantic LNG) 12,848.8 10,449.9 7,178.8 8,174.7 4,293.2 4,161.1 Petrochemicals 12,622.3 11,478.7 8,554.0 9,446.4 8,973.1 7,268.2 Service Contractors 2,552.4 2,863.8 3,035.4 2,364.6 2,859.9 1,920.1 Distribution 6,302.8 5,113.7 5,811.4 5,190.0 3,399.5 2,002.9 Asphalt Production 173.6 93.7 144.4 150.1 155.8 161.9
NON-PETROLEUM INDUSTRY 90,806.7 95,632.7 105,484.2 109,888.0 112,313.2 112,092.9
Agriculture 744.2 770.1 795.7 768.9 761.0 750.5 Export Agriculture 14.7 13.0 5.6 8.7 11.7 23.3 Domestic Agriculture 598.2 594.9 619.6 592.2 587.0 566.2 Sugar: 131.3 162.2 170.5 168.0 162.3 161.0 Sugar refineries 0.0 0.0 0.0 0.0 0.0 0.0 Cane farming and cultivation 0.0 0.0 0.0 0.0 0.0 0.0 Distilleries 131.3 162.2 170.5 168.0 162.3 161.0
Manufacturing1 9,219.3 8,884.2 10,122.4 8,979.7 8,549.0 8,288.8 Food, Beverages and Tobacco 5,018.2 4,941.8 5,547.1 4,685.9 4,896.7 4,839.3 Textile, Garments & Footwear 125.8 104.6 94.0 85.3 75.2 65.1 Printing, Publishing etc. 720.3 702.0 748.5 766.3 790.1 778.8 Wood & Related Products 207.5 200.6 189.1 178.0 174.9 168.0 Chemicals & Non-Metallic Minerals 1,381.3 1,475.6 1,814.7 1,928.2 1,725.2 1,535.8 Assembly Type and Related Industries 1,262.7 910.7 1,305.6 935.1 460.5 491.7 Miscellaneous Manufacturing 503.5 548.9 423.4 400.9 426.4 410.1
Services 80,843.2 85,978.4 94,566.1 100,139.4 103,003.2 103,053.6 Electricity and Water 2,000.1 1,997.3 1,940.7 2,088.6 2,194.2 2,277.3 Construction and Quarrying 8,772.3 8,778.5 9,352.3 10,243.6 10,098.9 9,433.1 Distribution and Restaurants² 28,994.0 31,826.9 36,214.2 38,406.3 37,977.4 37,313.7 Hotels and Guest Houses 574.9 591.8 607.2 611.6 601.3 584.5 Transport, Storage & Communication 8,653.1 8,826.1 9,204.2 9,571.8 10,148.9 10,763.4 Finance, Insurance & Real Estate etc. 16,229.5 17,506.7 19,403.4 18,906.1 20,769.2 21,188.3 Government 10,475.6 10,674.1 11,551.4 13,755.3 14,505.8 14,615.9 Education and Cultural Services 3,222.5 3,741.4 3,861.1 3,990.3 4,071.3 4,167.5 Personal Services 1,921.2 2,035.6 2,431.6 2,565.8 2,636.2 2,709.9
FISIM3 (5,721.8) (5,234.2) (5,240.0) (5,257.3) (5,981.5) (6,003.6)Add: VALUE ADDED TAX (VAT) 4,917.0 6,337.4 6,657.4 5,744.7 6,705.0 12,364.0
Source: Central Statistical Office 1/ Excludes petroleum refining and petrochemical industries. 2/ Excludes distribution of petroleum products. 3/ Financial Intermediation Services Indirectly Measured. r: revised p: provisional
Appendix 4Gross Domestic Product of Trinidad and Tobago at Market Prices (Current Prices)
/TT$ Millions/
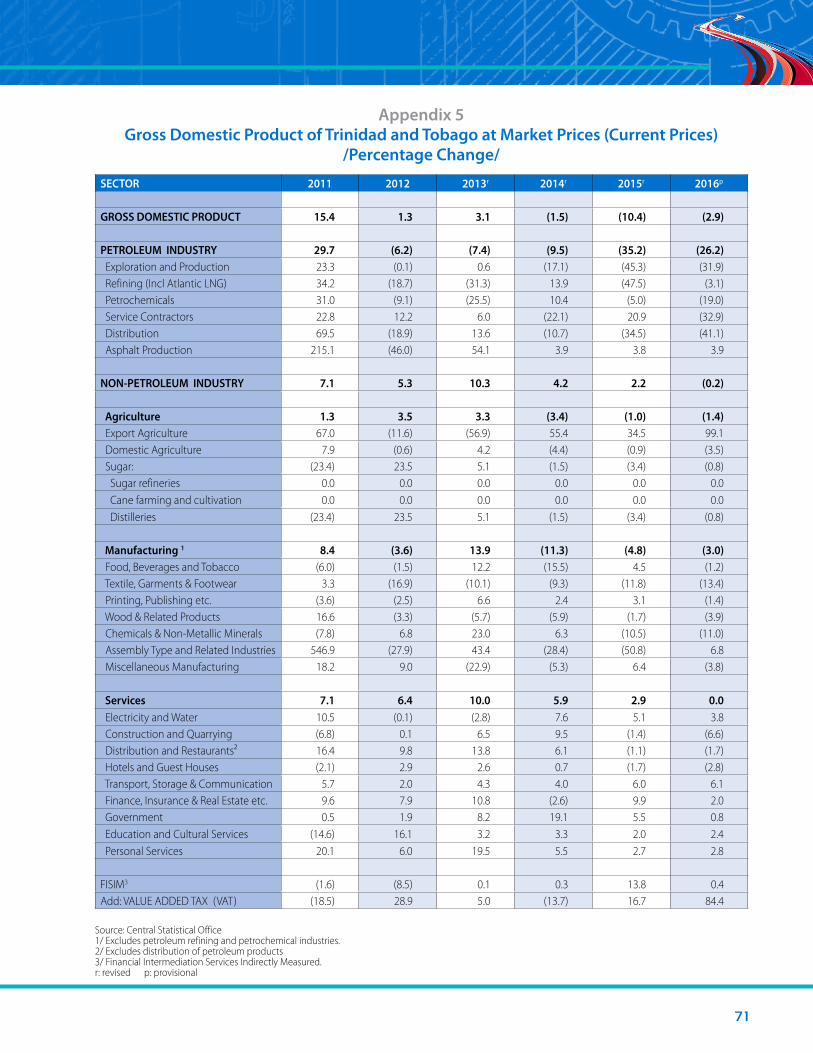
7 1
SECTOR 2011 2012 2013r 2014r 2015r 2016p
GROSS DOMESTIC PRODUCT 15.4 1.3 3.1 (1.5) (10.4) (2.9)
PETROLEUM INDUSTRY 29.7 (6.2) (7.4) (9.5) (35.2) (26.2) Exploration and Production 23.3 (0.1) 0.6 (17.1) (45.3) (31.9) Refining (Incl Atlantic LNG) 34.2 (18.7) (31.3) 13.9 (47.5) (3.1) Petrochemicals 31.0 (9.1) (25.5) 10.4 (5.0) (19.0) Service Contractors 22.8 12.2 6.0 (22.1) 20.9 (32.9) Distribution 69.5 (18.9) 13.6 (10.7) (34.5) (41.1) Asphalt Production 215.1 (46.0) 54.1 3.9 3.8 3.9
NON-PETROLEUM INDUSTRY 7.1 5.3 10.3 4.2 2.2 (0.2)
Agriculture 1.3 3.5 3.3 (3.4) (1.0) (1.4) Export Agriculture 67.0 (11.6) (56.9) 55.4 34.5 99.1 Domestic Agriculture 7.9 (0.6) 4.2 (4.4) (0.9) (3.5) Sugar: (23.4) 23.5 5.1 (1.5) (3.4) (0.8) Sugar refineries 0.0 0.0 0.0 0.0 0.0 0.0 Cane farming and cultivation 0.0 0.0 0.0 0.0 0.0 0.0 Distilleries (23.4) 23.5 5.1 (1.5) (3.4) (0.8)
Manufacturing 1 8.4 (3.6) 13.9 (11.3) (4.8) (3.0) Food, Beverages and Tobacco (6.0) (1.5) 12.2 (15.5) 4.5 (1.2) Textile, Garments & Footwear 3.3 (16.9) (10.1) (9.3) (11.8) (13.4) Printing, Publishing etc. (3.6) (2.5) 6.6 2.4 3.1 (1.4) Wood & Related Products 16.6 (3.3) (5.7) (5.9) (1.7) (3.9) Chemicals & Non-Metallic Minerals (7.8) 6.8 23.0 6.3 (10.5) (11.0) Assembly Type and Related Industries 546.9 (27.9) 43.4 (28.4) (50.8) 6.8 Miscellaneous Manufacturing 18.2 9.0 (22.9) (5.3) 6.4 (3.8)
Services 7.1 6.4 10.0 5.9 2.9 0.0 Electricity and Water 10.5 (0.1) (2.8) 7.6 5.1 3.8 Construction and Quarrying (6.8) 0.1 6.5 9.5 (1.4) (6.6) Distribution and Restaurants² 16.4 9.8 13.8 6.1 (1.1) (1.7) Hotels and Guest Houses (2.1) 2.9 2.6 0.7 (1.7) (2.8) Transport, Storage & Communication 5.7 2.0 4.3 4.0 6.0 6.1 Finance, Insurance & Real Estate etc. 9.6 7.9 10.8 (2.6) 9.9 2.0 Government 0.5 1.9 8.2 19.1 5.5 0.8 Education and Cultural Services (14.6) 16.1 3.2 3.3 2.0 2.4 Personal Services 20.1 6.0 19.5 5.5 2.7 2.8
FISIM3 (1.6) (8.5) 0.1 0.3 13.8 0.4 Add: VALUE ADDED TAX (VAT) (18.5) 28.9 5.0 (13.7) 16.7 84.4
Source: Central Statistical Office 1/ Excludes petroleum refining and petrochemical industries. 2/ Excludes distribution of petroleum products 3/ Financial Intermediation Services Indirectly Measured. r: revised p: provisional
Appendix 5Gross Domestic Product of Trinidad and Tobago at Market Prices (Current Prices)
/Percentage Change/
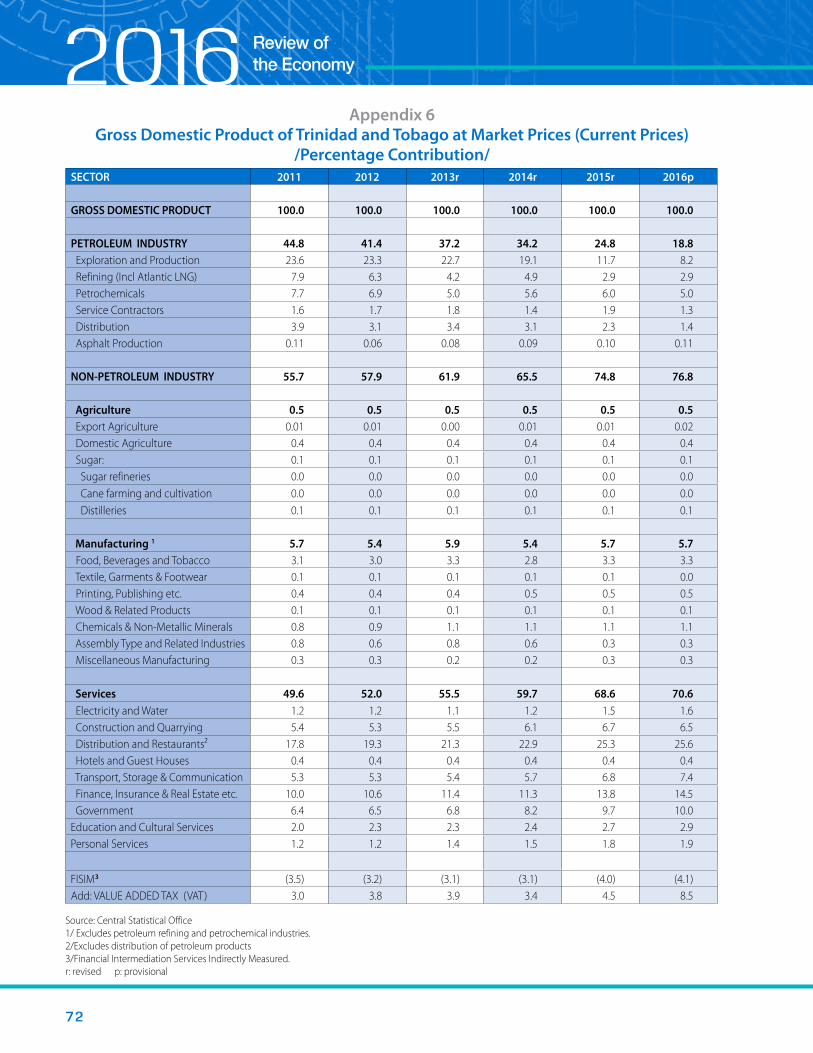
7 2
2016SECTOR 2011 2012 2013r 2014r 2015r 2016p
GROSS DOMESTIC PRODUCT 100.0 100.0 100.0 100.0 100.0 100.0
PETROLEUM INDUSTRY 44.8 41.4 37.2 34.2 24.8 18.8 Exploration and Production 23.6 23.3 22.7 19.1 11.7 8.2 Refining (Incl Atlantic LNG) 7.9 6.3 4.2 4.9 2.9 2.9 Petrochemicals 7.7 6.9 5.0 5.6 6.0 5.0 Service Contractors 1.6 1.7 1.8 1.4 1.9 1.3 Distribution 3.9 3.1 3.4 3.1 2.3 1.4 Asphalt Production 0.11 0.06 0.08 0.09 0.10 0.11
NON-PETROLEUM INDUSTRY 55.7 57.9 61.9 65.5 74.8 76.8
Agriculture 0.5 0.5 0.5 0.5 0.5 0.5 Export Agriculture 0.01 0.01 0.00 0.01 0.01 0.02 Domestic Agriculture 0.4 0.4 0.4 0.4 0.4 0.4 Sugar: 0.1 0.1 0.1 0.1 0.1 0.1 Sugar refineries 0.0 0.0 0.0 0.0 0.0 0.0 Cane farming and cultivation 0.0 0.0 0.0 0.0 0.0 0.0 Distilleries 0.1 0.1 0.1 0.1 0.1 0.1
Manufacturing 1 5.7 5.4 5.9 5.4 5.7 5.7 Food, Beverages and Tobacco 3.1 3.0 3.3 2.8 3.3 3.3 Textile, Garments & Footwear 0.1 0.1 0.1 0.1 0.1 0.0 Printing, Publishing etc. 0.4 0.4 0.4 0.5 0.5 0.5 Wood & Related Products 0.1 0.1 0.1 0.1 0.1 0.1 Chemicals & Non-Metallic Minerals 0.8 0.9 1.1 1.1 1.1 1.1 Assembly Type and Related Industries 0.8 0.6 0.8 0.6 0.3 0.3 Miscellaneous Manufacturing 0.3 0.3 0.2 0.2 0.3 0.3
Services 49.6 52.0 55.5 59.7 68.6 70.6 Electricity and Water 1.2 1.2 1.1 1.2 1.5 1.6 Construction and Quarrying 5.4 5.3 5.5 6.1 6.7 6.5 Distribution and Restaurants² 17.8 19.3 21.3 22.9 25.3 25.6 Hotels and Guest Houses 0.4 0.4 0.4 0.4 0.4 0.4 Transport, Storage & Communication 5.3 5.3 5.4 5.7 6.8 7.4 Finance, Insurance & Real Estate etc. 10.0 10.6 11.4 11.3 13.8 14.5 Government 6.4 6.5 6.8 8.2 9.7 10.0 Education and Cultural Services 2.0 2.3 2.3 2.4 2.7 2.9Personal Services 1.2 1.2 1.4 1.5 1.8 1.9
FISIM3 (3.5) (3.2) (3.1) (3.1) (4.0) (4.1)Add: VALUE ADDED TAX (VAT) 3.0 3.8 3.9 3.4 4.5 8.5
Source: Central Statistical Office 1/ Excludes petroleum refining and petrochemical industries. 2/Excludes distribution of petroleum products 3/Financial Intermediation Services Indirectly Measured. r: revised p: provisional
Appendix 6Gross Domestic Product of Trinidad and Tobago at Market Prices (Current Prices)
/Percentage Contribution/

7 3
Development and Exploratory Drilling Oct '10/ Sep '11
Oct '11/ Sep '12
Oct '12/ Sep '13
Oct '13/ Sep '14
Oct '14/ Sep '15
Oct '14/ Jun '15p
Oct '15/ Jun '16p
Total Depth Drilled* 94.0 66.6 123.4 103.7 134.0 99.0 93.2 Land 50.8 40.4 65.2 55.3 88.3 68.8 44.1 Marine 43.3 26.2 58.2 48.4 45.7 30.2 49.1Development Drilling* 87.1 66.1 110.8 88.9 117.9 88.3 84.4Exploratory Drilling* 6.9 0.5 12.6 14.8 16.2 10.8 8.8
Number of Wells DrilledOct '10/ Sep '11
Oct '11/ Sep '12
Oct '12/ Sep '13
Oct '13/ Sep '14
Oct '14/ Sep '15
Oct '14/ Jun '15p
Oct '15/ Jun '16p
No. of Wells Drilled 77 55 86 80 94 75 57Development 59 55 81 73 88 70 55Exploratory 18 0 5 7 6 5 2
Domestic Crude and Condensate ProductionOct '10/ Sep '11
Oct '11/ Sep '12
Oct '12/ Sep '13
Oct '13/ Sep '14
Oct '14/ Sep '15
Oct '14/ Jun '15p
Oct '15/ Jun '16p
Total Crude and Condensate Barrels of Oil per day (BOPD) 91,976 83,335 80,925 80,791 80,601 81,987 73,784 Land (%) 23.4 26.6 28.3 28.6 28.7 28.7 28.8 Marine (%) 76.6 73.4 71.7 71.4 71.3 71.3 71.2Crude Production Barrels of Oil per day (BOPD) 65,578 68,947 68,138 66,890 65,712 66,785 62,682 Condensate Production Barrels of Oil per day (BOPD) 26,399 14,388 12,787 13,901 14,889 15,202 11,102
Source: Ministry of Energy and Energy Industries p: provisional * ALL FIGURES IN THOUSANDS OF METRES
Appendix 7Development and Exploratory Drilling and Domestic Crude Production
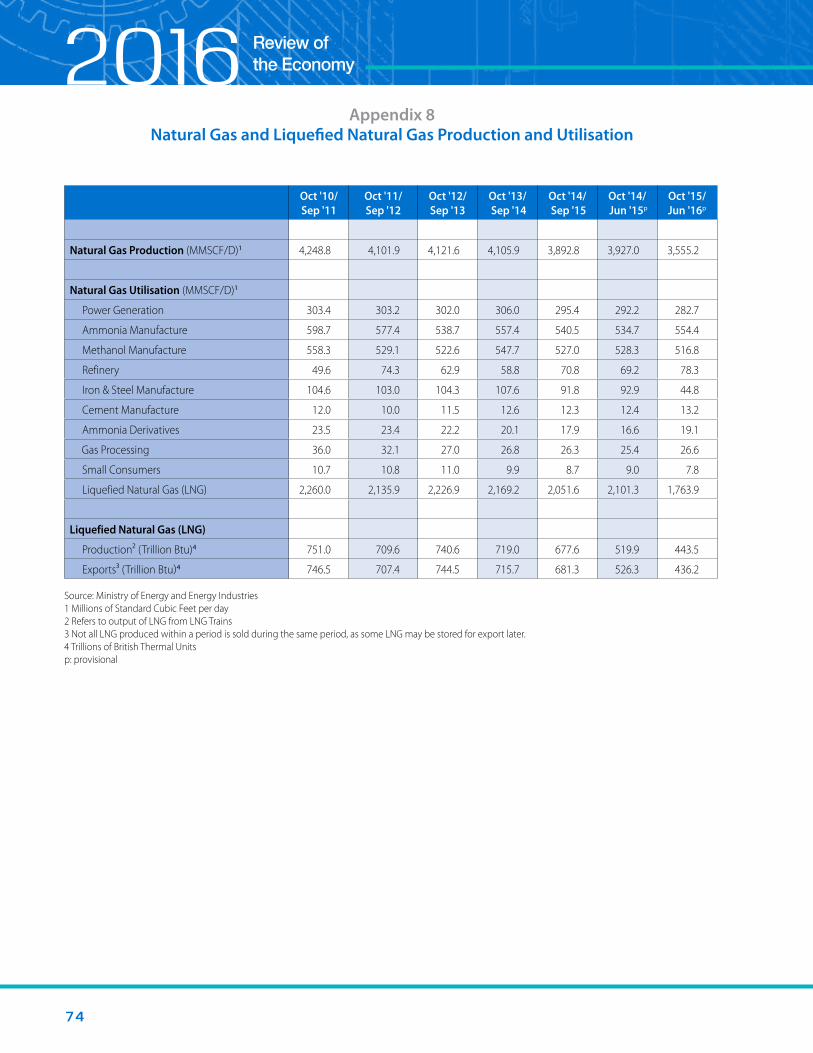
7 4
2016
Oct '10/ Sep '11
Oct '11/ Sep '12
Oct '12/ Sep '13
Oct '13/ Sep '14
Oct '14/ Sep '15
Oct '14/ Jun '15p
Oct '15/ Jun '16p
Natural Gas Production (MMSCF/D)1 4,248.8 4,101.9 4,121.6 4,105.9 3,892.8 3,927.0 3,555.2
Natural Gas Utilisation (MMSCF/D)1
Power Generation 303.4 303.2 302.0 306.0 295.4 292.2 282.7
Ammonia Manufacture 598.7 577.4 538.7 557.4 540.5 534.7 554.4
Methanol Manufacture 558.3 529.1 522.6 547.7 527.0 528.3 516.8
Refinery 49.6 74.3 62.9 58.8 70.8 69.2 78.3
Iron & Steel Manufacture 104.6 103.0 104.3 107.6 91.8 92.9 44.8
Cement Manufacture 12.0 10.0 11.5 12.6 12.3 12.4 13.2
Ammonia Derivatives 23.5 23.4 22.2 20.1 17.9 16.6 19.1
Gas Processing 36.0 32.1 27.0 26.8 26.3 25.4 26.6
Small Consumers 10.7 10.8 11.0 9.9 8.7 9.0 7.8
Liquefied Natural Gas (LNG) 2,260.0 2,135.9 2,226.9 2,169.2 2,051.6 2,101.3 1,763.9
Liquefied Natural Gas (LNG)
Production² (Trillion Btu)4 751.0 709.6 740.6 719.0 677.6 519.9 443.5
Exports³ (Trillion Btu)4 746.5 707.4 744.5 715.7 681.3 526.3 436.2
Source: Ministry of Energy and Energy Industries 1 Millions of Standard Cubic Feet per day 2 Refers to output of LNG from LNG Trains 3 Not all LNG produced within a period is sold during the same period, as some LNG may be stored for export later. 4 Trillions of British Thermal Units p: provisional
Appendix 8Natural Gas and Liquefied Natural Gas Production and Utilisation

7 5
Oct '10/ Sep '11
Oct '11/ Sep '12
Oct '12/ Sep '13
Oct '13/ Sep '14
Oct '14/ Sep '15
Oct '14/ Jun '15p
Oct '15/ Jun '16p
Nitrogeneous Fertilisers
Ammonia
Production 5,280.6 5,013.4 4,521.4 4,825.4 4,681.0 3,429.3 3,700.2
Exports 4,831.1 4,446.2 4,201.7 4,355.0 4,299.7 3,196.4 3,456.3
Urea
Production 708.6 532.5 480.2 533.4 447.5 297.5 410.5
Exports 689.1 530.1 461.7 526.9 425.0 300.0 448.7
Methanol
Production 5,937.5 5,597.1 5,380.4 5,697.1 5,380.8 4,030.8 3,950.1
Exports 5,934.7 5,575.9 5,482.0 5,674.0 5,313.8 4,048.5 4,036.5
Source: Ministry of Energy and Energy Industries p: provisional
Appendix 9Petrochemicals Production and Exports
/Tonnes ‘000/
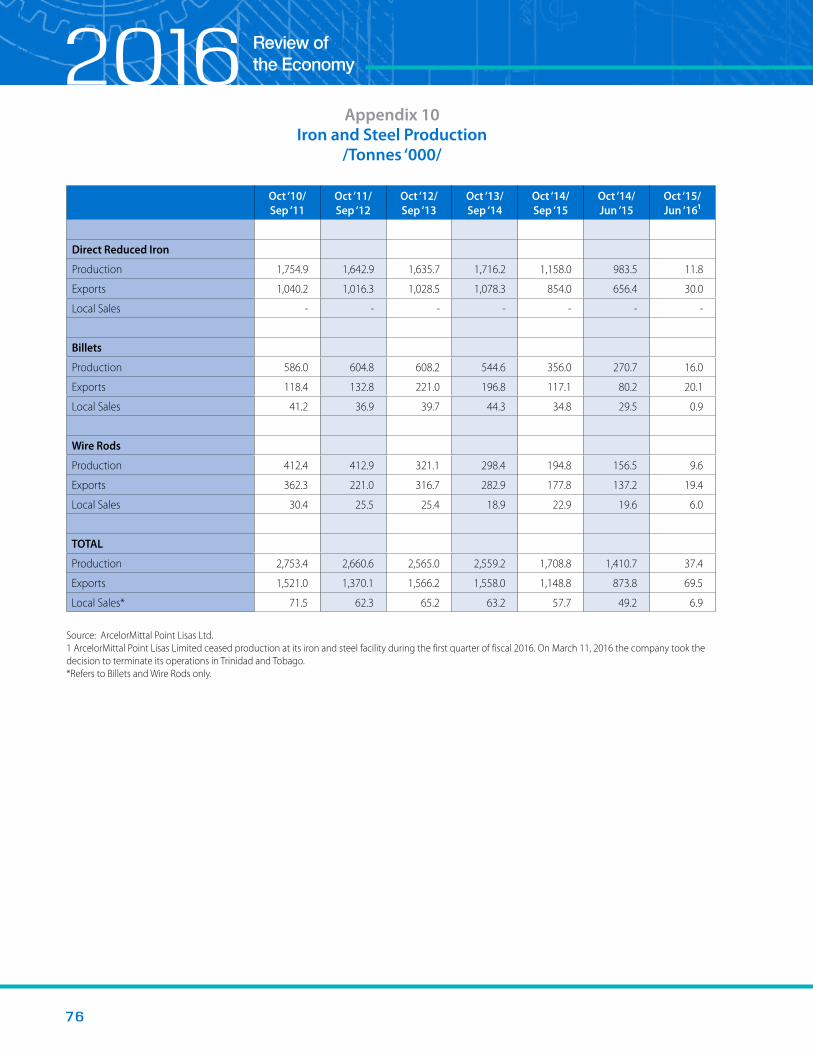
7 6
2016
Oct ‘10/Sep ‘11
Oct ‘11/ Sep ‘12
Oct ‘12/ Sep ‘13
Oct ‘13/ Sep ‘14
Oct ‘14/ Sep ‘15
Oct ‘14/ Jun ‘15
Oct ‘15/ Jun ‘16¹
Direct Reduced Iron
Production 1,754.9 1,642.9 1,635.7 1,716.2 1,158.0 983.5 11.8
Exports 1,040.2 1,016.3 1,028.5 1,078.3 854.0 656.4 30.0
Local Sales - - - - - - -
Billets
Production 586.0 604.8 608.2 544.6 356.0 270.7 16.0
Exports 118.4 132.8 221.0 196.8 117.1 80.2 20.1
Local Sales 41.2 36.9 39.7 44.3 34.8 29.5 0.9
Wire Rods
Production 412.4 412.9 321.1 298.4 194.8 156.5 9.6
Exports 362.3 221.0 316.7 282.9 177.8 137.2 19.4
Local Sales 30.4 25.5 25.4 18.9 22.9 19.6 6.0
TOTAL
Production 2,753.4 2,660.6 2,565.0 2,559.2 1,708.8 1,410.7 37.4
Exports 1,521.0 1,370.1 1,566.2 1,558.0 1,148.8 873.8 69.5
Local Sales* 71.5 62.3 65.2 63.2 57.7 49.2 6.9
Source: ArcelorMittal Point Lisas Ltd. 1 ArcelorMittal Point Lisas Limited ceased production at its iron and steel facility during the first quarter of fiscal 2016. On March 11, 2016 the company took the decision to terminate its operations in Trinidad and Tobago. *Refers to Billets and Wire Rods only.
Appendix 10Iron and Steel Production
/Tonnes ‘000/

7 7
2011 2012 2013 2014 2015 Jan -Jun* 2015
Jan -Jun* 2016
WeightsIndex of Retail Prices (Calendar Year)
All Items (Base Year = Jan 2015) 1,000 5.1 9.2 5.1 5.8 4.7 0.0 1.9Core 827 1.7 2.5 2.3 2.1 1.8 1.4 1.1Food 173 10.5 19.1 8.7 10.0 8.6 -1.4 5.1
Transport 147 0.8 1.9 3.4 2.8 1.0 -0.1 3.0
Housing 275 1.4 2.4 0.2 0.7 0.9 0.6 -0.7
2010/ 2011
2011/ 2012
2012/ 2013
2013/ 2014
2014/ 2015
Jan '15/ Mar
‘15**
Jan '16/ Mar
‘16**Index of Productivity (Fiscal Year)All workers/all industries (Base Year = 1995) 7.4 -6.3 3.2 1.1 -1.4 -2.2 -5.4
Non-Energy 14.9 -2.6 6.2 0.4 -4.5 -8.6 -16.5 Food Processing 13.2 -8.7 -13.5 -13.7 25.8 9.8 25.8 Drink and Tobacco 1.9 4.2 0.1 -4.0 4.1 7.8 15.7 Textiles, Garments and Footwear
8.9 -4.1 -10.9 -13.1 -14.7 -15.9 -15.1
Printing, Publishing and Paper Converters
10.1 -0.8 16.0 8.2 -9.0 -10.5 -0.6
Wood and Related Products 28.1 -5.1 -7.7 -23.7 0.3 1.0 5.1 Chemicals 1.4 25.8 -8.4 11.0 2.9 3.7 0.2 Assembly Type & Related Products
6.2 -1.9 33.7 18.8 -14.3 -22.9 -69.7
Miscellaneous Manufacturing 1.7 15.3 16.0 8.0 7.1 7.6 8.5 Electricity 31.7 -22.0 1.0 -5.6 -3.3 1.0 5.1 Water 29.7 -11.7 24.5 14.7 6.6 9.7 -3.6
Petrochemicals 4.2 -3.9 -7.5 3.4 -11.6 -16.7 2.1Exploration and Production of Oil and Natural Gas
-13.2 -17.4 -12.6 -5.7 0.4 -2.3 9.5
Oil & Natural Gas Refining 3.2 -23.1 3.1 3.2 22.9 59.2 40.0
Index of Average Weekly Earnings (Fiscal Year)All workers/all industries (Base Year = 1995) 1,000 -4.1 1.9 11.0 -1.4 5.1 3.0 3.1
Source: Central Statistical Office * Calendar Year-to-date ** Refers to change in January to March period, versus January to March in the previous year
Appendix 11Change in Prices, Productivity and Average Weekly Earnings
/Percentage Change/
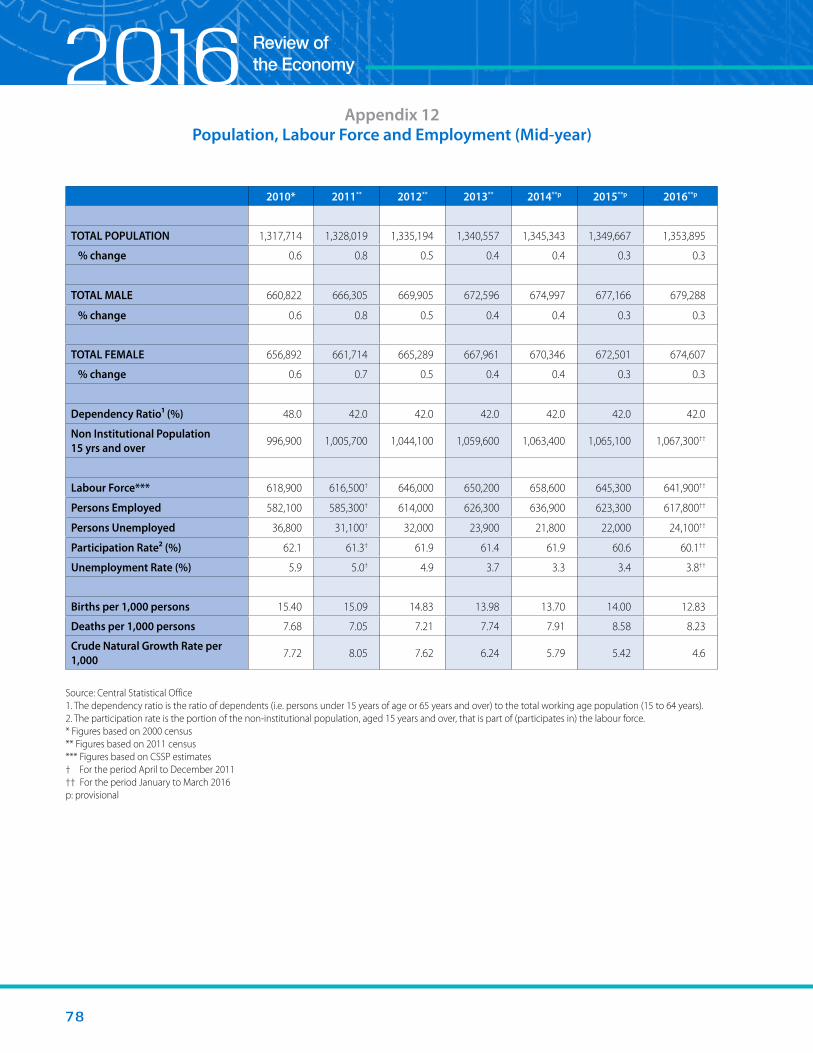
7 8
2016
2010* 2011** 2012** 2013** 2014**p 2015**p 2016**p
TOTAL POPULATION 1,317,714 1,328,019 1,335,194 1,340,557 1,345,343 1,349,667 1,353,895
% change 0.6 0.8 0.5 0.4 0.4 0.3 0.3
TOTAL MALE 660,822 666,305 669,905 672,596 674,997 677,166 679,288
% change 0.6 0.8 0.5 0.4 0.4 0.3 0.3
TOTAL FEMALE 656,892 661,714 665,289 667,961 670,346 672,501 674,607
% change 0.6 0.7 0.5 0.4 0.4 0.3 0.3
Dependency Ratio¹ (%) 48.0 42.0 42.0 42.0 42.0 42.0 42.0
Non Institutional Population15 yrs and over 996,900 1,005,700 1,044,100 1,059,600 1,063,400 1,065,100 1,067,300††
Labour Force*** 618,900 616,500† 646,000 650,200 658,600 645,300 641,900††
Persons Employed 582,100 585,300† 614,000 626,300 636,900 623,300 617,800††
Persons Unemployed 36,800 31,100† 32,000 23,900 21,800 22,000 24,100††
Participation Rate² (%) 62.1 61.3† 61.9 61.4 61.9 60.6 60.1††
Unemployment Rate (%) 5.9 5.0† 4.9 3.7 3.3 3.4 3.8††
Births per 1,000 persons 15.40 15.09 14.83 13.98 13.70 14.00 12.83
Deaths per 1,000 persons 7.68 7.05 7.21 7.74 7.91 8.58 8.23
Crude Natural Growth Rate per 1,000 7.72 8.05 7.62 6.24 5.79 5.42 4.6
Source: Central Statistical Office 1. The dependency ratio is the ratio of dependents (i.e. persons under 15 years of age or 65 years and over) to the total working age population (15 to 64 years). 2. The participation rate is the portion of the non-institutional population, aged 15 years and over, that is part of (participates in) the labour force. * Figures based on 2000 census ** Figures based on 2011 census *** Figures based on CSSP estimates † For the period April to December 2011 †† For the period January to March 2016 p: provisional
Appendix 12Population, Labour Force and Employment (Mid-year)

7 9
2009 2010 2011 2012 2013p 2014p 2015p 2016p
Total Population 1,310,106 1,317,714 1,328,019 1,335,194 1,340,557 1,345,343 1,349,667 1,353,895
Non-Institutional Population
All Ages
Under 15 332,036 333,965 273,415 274,892 275,996 276,982 277,872 278,742
15-19 143,714 144,548 98,379 98,911 99,308 99,662 99,983 100,296
20-24 116,215 116,890 114,240 114,857 115,319 115,730 116,102 116,466
25-29 100,258 100,841 123,518 124,185 124,684 125,129 125,531 125,925
30-34 95,680 96,235 105,580 106,150 106,577 106,957 107,301 107,637
35-39 106,452 107,070 92,539 93,039 93,413 93,746 94,047 94,342
40-44 93,789 94,333 86,163 86,629 86,976 87,287 87,568 87,842
45-49 77,652 78,103 96,114 96,633 97,021 97,368 97,681 97,987
50-54 64,794 65,170 87,184 87,655 88,007 88,321 88,605 88,883
55-59 48,256 48,537 73,215 73,611 73,906 74,170 74,408 74,642
60-64 38,512 38,736 58,647 58,964 59,201 59,412 59,603 59,790
65 and over 92,748 93,286 119,025 119,668 120,149 120,578 120,965 121,344
Source: Central Statistical Office Figures for 2009 and 2010 are based on 2000 census Figures for 2011 to 2016 are based on 2011 census p: provisional
Appendix 13Mid-year Estimates of Population by Age

8 0
201620
1420
1520
16
Oct
- D
ec
Jan
- Mar
Apr -
Jun
Jul -
Sep
Oct
- D
ec
Jan
- Mar
Lab
Forc
e E
mp
Une
mp
Rate
%La
b Fo
rce
Em
pU
nem
p Ra
te %
Lab
Forc
e E
mp
Une
mp
Rate
%La
b Fo
rce
Em
pU
nem
p Ra
te %
Lab
Forc
e E
mp
Une
mp
Rate
%La
b Fo
rce
Em
pU
nem
p Ra
te %
Tota
l Lab
our F
orce
6,51
06,
298
3.3
6,46
06,
228
3.6
6,49
16,
286
3.2
6,4
21
6,20
23.
4 6
,439
6,
216
3.5
6,4
19
6,1
78
3.8
Oth
er A
gric
ultu
re, F
ores
try,
Hun
ting
& Fi
shin
g24
524
50.
024
624
02.
821
621
12.
3 2
07
204
1.4
197
19
70.
0 2
21
219
1.
4
Suga
r-
--
--
--
--
--
--
--
--
-
Petro
leum
and
gas
225
217
4.0
225
210
7.1
193
185
4.1
241
22
57.
1 2
16
198
8.3
207
1
97
5.8
Cons
truct
ion
1,0
32
982
4.8
989
92
96.
21,
038
984
5.2
943
88
36.
5 9
53
888
6.9
928
8
67
6.6
Who
lesa
le/R
etai
l Tra
de,
Rest
aura
nts &
Hot
els
1,22
21,
168
4.5
1,21
51,
163
4.4
1,21
81,
167
4.4
1,2
62
1,21
04.
1 1
,192
1,
149
3.5
1,2
38
1,1
78
4.9
Tran
spor
t, St
orag
e &
Com
m.
459
449
2.2
403
398
1.5
428
423
1.2
473
46
12.
5 5
01
490
2.0
431
4
25
1.6
Fina
nce,
Insu
ranc
e Re
al-
Esta
te &
Bus
ines
s Ser
vice
s63
161
62.
558
557
32.
256
355
02.
5 5
93
576
2.5
633
61
92.
1 6
07
588
3.
1
Com
mun
ity S
ocia
l &
Pers
onal
Ser
vice
s2,
009
1,95
92.
52,
125
2,06
03.
02,
145
2,09
82.
1 2
,087
2,
046
2.0
2,1
27
2,06
62.
9 2
,178
2
,124
2.
5
Elec
trici
ty &
Wat
er94
940.
084
824.
811
311
30.
0 1
15
112
2.6
83
812.
4 1
03
99
2.9
Oth
er M
anuf
actu
ring
(exc
ludi
ng su
gar a
nd o
il)54
552
63.
555
654
61.
653
051
33.
2 4
63
447
3.5
519
51
01.
7 4
77
460
3.
6
Oth
er M
inin
g &
Qua
rryi
ng8
80.
05
50.
011
110.
0 1
4 14
0.0
3
30.
0 1
0 6
30
.0
Not
stat
ed40
3412
.523
228.
736
3211
.1 2
3 23
0.0
15
1313
.3 1
9 1
7 10
.5
Sour
ce: C
entra
l Sta
tistic
al O
ffice
App
endi
x 14
Labo
ur F
orce
by
Indu
stry
and
Em
ploy
men
t Sta
tus
(CSS
P Es
timat
es)
/Hun
dred
s (‘0
0)

8 1
Period US Dollar Canadian Dollar U.K. Pound Sterling EUROBuying Selling Buying Selling Buying Selling Buying Selling
2004 6.2440 6.2990 4.7107 4.9058 11.1953 11.6742 7.5991 7.92442005 6.2318 6.2996 5.0866 5.2849 11.1559 11.6325 7.6171 7.88182006 6.2494 6.3123 5.4430 5.6765 11.3205 11.8324 7.7153 8.04202007 6.2736 6.3282 5.7744 6.0402 12.2988 12.8852 8.4361 8.79902008 6.2236 6.2891 5.7929 6.0553 11.2925 11.8596 8.9735 9.39612009 6.2736 6.3259 5.4486 5.6911 9.6108 10.0982 8.5703 8.98662010 6.3203 6.3757 6.0640 6.3055 9.6020 10.0445 8.2477 8.58502011 6.3731 6.4261 6.3605 6.6262 9.9974 10.4562 8.6736 9.03752012 6.3716 6.4349 6.2971 6.5787 9.8818 10.3595 8.0181 8.34142013 6.3885 6.4426 6.1134 6.4166 9.7838 10.2313 8.2916 8.66172014 6.3613 6.4086 5.6779 5.9750 10.2525 10.7882 8.2714 8.68312015 6.3298 6.3776 4.8932 5.1793 9.5120 10.0569 6.9171 7.3032
2014October 6.3218 6.3624 5.5670 5.8545 9.9332 10.5090 7.8601 8.2812November 6.3121 6.3607 5.4961 5.8087 9.7664 10.3190 7.7301 8.1672December 6.3396 6.3839 5.4403 5.7165 9.6817 10.2769 7.6461 8.0694
2015January 6.3271 6.3736 5.1547 5.4742 9.4219 9.9536 7.2234 7.6449February 6.3158 6.3670 4.9723 5.2462 9.4871 10.0030 7.0498 7.4394March 6.3270 6.3706 4.9385 5.2139 9.3073 9.8326 6.7380 7.0901April 6.3245 6.3717 5.0428 5.3206 9.2987 9.7571 6.7233 7.0811May 6.3197 6.3647 5.1218 5.4144 9.5943 10.1114 6.9254 7.3125June 6.3167 6.3650 5.0386 5.3268r 9.6505 10.1923 6.9410 7.3316July 6.3172 6.3647 4.8447 5.1420 9.6537 10.2261 6.8512 7.2218August 6.3153 6.3597 4.7453 5.0271 9.6695 10.2527 6.9215 7.3049September 6.3184 6.3625 4.7128 4.9856 9.5145 10.0814 6.9776 7.3675October 6.3183 6.3627 4.7819 5.0666 9.5167 10.0999 7.0234 7.4293November 6.3746 6.4329 4.7903 5.0596 9.5873 10.1703 6.7583 7.1753December 6.3806 6.4342 4.6117 4.9074 9.4361 9.9866 6.8793 7.2490
2016January 6.4039 6.4593 4.4519 4.7187 9.0711 9.6471 6.8974 7.2130February 6.4542 6.5190 4.6229 4.8963 9.1004 9.6861 7.0729 7.4635March 6.5352 6.5944 4.8821 5.1779 9.1358 9.7290 7.2287 7.5527April 6.5764 6.6315 5.0725 5.3781 9.2646 9.8195 7.3982 7.7832May 6.6103 6.6656 5.0491 5.3686 9.4330 10.0487 7.4007 7.8277June 6.6148 6.6654 5.0659 5.3923 9.2868 9.8514 7.3381 7.7839July 6.6434 6.7025 5.0657 5.3484 8.6813 9.2295 7.3243 7.7100August 6.6816 6.7392 5.0818 5.4092 8.6953 9.2502 7.4607 7.8569
Source: Central Bank of Trinidad and Tobagor: revised
Appendix 15Exchange Rate for Selected Currencies
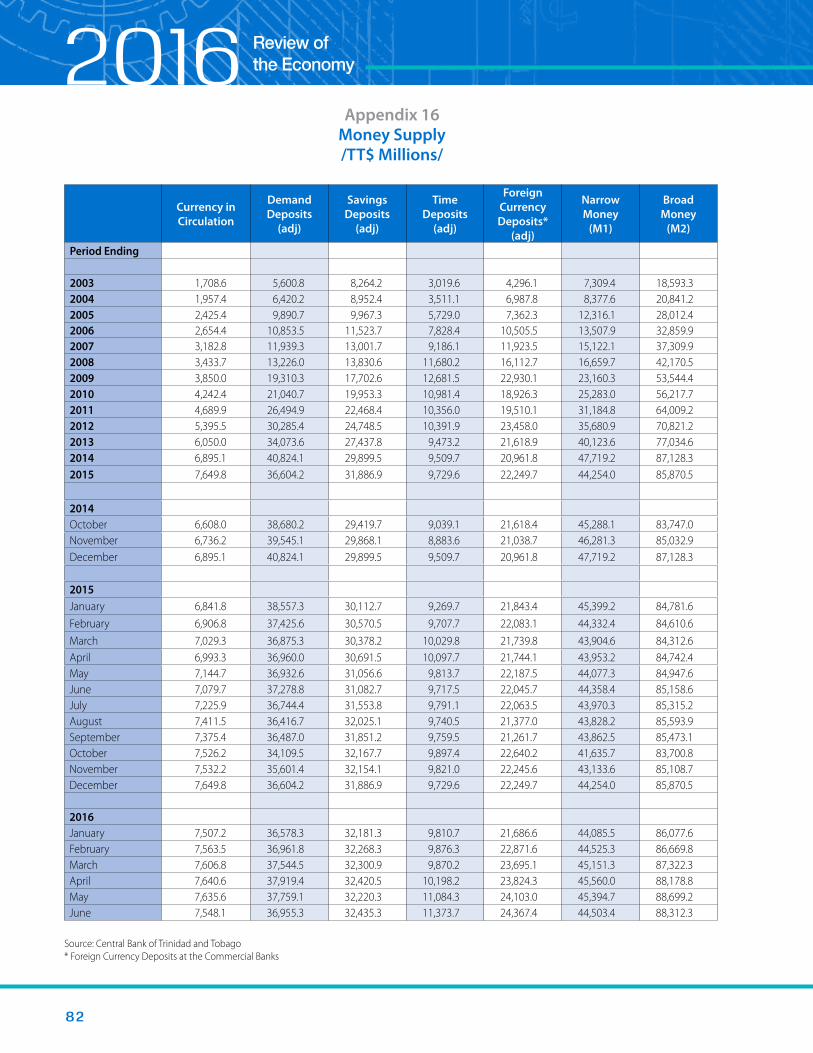
8 2
2016
Currency in Circulation
Demand Deposits
(adj)
Savings Deposits
(adj)
Time Deposits
(adj)
Foreign Currency Deposits*
(adj)
Narrow Money
(M1)
Broad Money
(M2)
Period Ending
2003 1,708.6 5,600.8 8,264.2 3,019.6 4,296.1 7,309.4 18,593.32004 1,957.4 6,420.2 8,952.4 3,511.1 6,987.8 8,377.6 20,841.22005 2,425.4 9,890.7 9,967.3 5,729.0 7,362.3 12,316.1 28,012.42006 2,654.4 10,853.5 11,523.7 7,828.4 10,505.5 13,507.9 32,859.92007 3,182.8 11,939.3 13,001.7 9,186.1 11,923.5 15,122.1 37,309.92008 3,433.7 13,226.0 13,830.6 11,680.2 16,112.7 16,659.7 42,170.52009 3,850.0 19,310.3 17,702.6 12,681.5 22,930.1 23,160.3 53,544.42010 4,242.4 21,040.7 19,953.3 10,981.4 18,926.3 25,283.0 56,217.72011 4,689.9 26,494.9 22,468.4 10,356.0 19,510.1 31,184.8 64,009.22012 5,395.5 30,285.4 24,748.5 10,391.9 23,458.0 35,680.9 70,821.22013 6,050.0 34,073.6 27,437.8 9,473.2 21,618.9 40,123.6 77,034.62014 6,895.1 40,824.1 29,899.5 9,509.7 20,961.8 47,719.2 87,128.32015 7,649.8 36,604.2 31,886.9 9,729.6 22,249.7 44,254.0 85,870.5
2014October 6,608.0 38,680.2 29,419.7 9,039.1 21,618.4 45,288.1 83,747.0November 6,736.2 39,545.1 29,868.1 8,883.6 21,038.7 46,281.3 85,032.9December 6,895.1 40,824.1 29,899.5 9,509.7 20,961.8 47,719.2 87,128.3
2015January 6,841.8 38,557.3 30,112.7 9,269.7 21,843.4 45,399.2 84,781.6February 6,906.8 37,425.6 30,570.5 9,707.7 22,083.1 44,332.4 84,610.6March 7,029.3 36,875.3 30,378.2 10,029.8 21,739.8 43,904.6 84,312.6April 6,993.3 36,960.0 30,691.5 10,097.7 21,744.1 43,953.2 84,742.4May 7,144.7 36,932.6 31,056.6 9,813.7 22,187.5 44,077.3 84,947.6June 7,079.7 37,278.8 31,082.7 9,717.5 22,045.7 44,358.4 85,158.6July 7,225.9 36,744.4 31,553.8 9,791.1 22,063.5 43,970.3 85,315.2August 7,411.5 36,416.7 32,025.1 9,740.5 21,377.0 43,828.2 85,593.9September 7,375.4 36,487.0 31,851.2 9,759.5 21,261.7 43,862.5 85,473.1October 7,526.2 34,109.5 32,167.7 9,897.4 22,640.2 41,635.7 83,700.8November 7,532.2 35,601.4 32,154.1 9,821.0 22,245.6 43,133.6 85,108.7December 7,649.8 36,604.2 31,886.9 9,729.6 22,249.7 44,254.0 85,870.5
2016January 7,507.2 36,578.3 32,181.3 9,810.7 21,686.6 44,085.5 86,077.6February 7,563.5 36,961.8 32,268.3 9,876.3 22,871.6 44,525.3 86,669.8March 7,606.8 37,544.5 32,300.9 9,870.2 23,695.1 45,151.3 87,322.3April 7,640.6 37,919.4 32,420.5 10,198.2 23,824.3 45,560.0 88,178.8May 7,635.6 37,759.1 32,220.3 11,084.3 24,103.0 45,394.7 88,699.2June 7,548.1 36,955.3 32,435.3 11,373.7 24,367.4 44,503.4 88,312.3
Source: Central Bank of Trinidad and Tobago* Foreign Currency Deposits at the Commercial Banks
Appendix 16Money Supply/TT$ Millions/

8 3
Reserve Position Deposits at the Central Bank
Period Ending Required Reserves Cash Reserves
Deposit Liabilities
(adj.)Cash Reserves Special
Deposits Total Deposits Local Cash in Hand Treasury Bills
2003 2,327.5 2,333.8 16,625.0 2,333.8 621.5 2,955.3 586.1 124.6
2004 2,055.1 2,121.6 18,682.7 2,121.6 660.9 2,782.5 596.8 60.2
2005 2,601.9 3,672.5 23,653.6 3,672.5 1,000.0 4,672.5 566.0 415.1
2006 3,087.8 3,626.6 28,070.9 3,626.6 2,061.4 5,688.0 906.0 561.5
2007 3,625.4 3,928.0 32,958.2 3,928.0 2,158.6 6,086.6 1,022.5 567.4
2008 6,416.7 8,352.7 37,745.3 8,352.7 2,252.4 10,605.1 1,051.9 819.7
2009 8,055.7 10,110.7 47,386.5 10,110.7 4,447.7 14,558.5 1,004.0 1,001.2
2010 8,896.9 10,634.3 52,334.7 10,634.3 5,546.7 16,181.0 800.0 1,055.6
2011 9,747.2 15,431.2 57,336.5 15,431.2 5,646.7 21,077.9 1,245.4 451.8
2012 10,906.2 14,871.9 64,154.1 14,871.9 7,273.1 22,145.0 1,246.2 287.92013 12,123.8 18,678.4 71,316.3 18,678.4 7,416.3 26,094.8 1,365.9 828.22014 13,339.0 19,262.7 78,464.5 19,262.7 7,569.3 26,832.0 1,447.5 843.6
2015 13,330.2 17,954.9 78,413.1 17,954.9 4,068.3 22,023.1 1,437.3 275.5
2014October 12,740.6 20,448.0 74,944.6 20,448.0 7,498.9 27,946.9 854.4 724.0November 13,078.0 20,854.7 76,929.4 20,854.7 7,538.6 28,393.2 840.1 894.2
December 13,339.0 19,262.7 78,464.5 19,262.7 7,569.3 26,832.0 1,447.5 843.6
2015January 13,630.4 18,147.2 80,178.7 18,147.2 7,603.6 25,750.8 834.4 843.6
February 13,354.0 16,633.1 78,553.0 16,633.1 7,571.1 24,204.1 912.7 843.6
March 13,331.8 15,215.3 78,422.1 15,215.3 7,568.4 22,783.7 1,070.7 1,126.6
April 13,156.6 17,372.6 77,391.7 17,372.6 7,547.8 24,920.5r 1,015.9 256.7
May 13,065.3 16,778.8 76,854.9 16,778.8 7,537.1 24,315.9 930.2 198.1
June 13,184.5 16,604.6 77,555.9 16,604.6 7,551.1 24,155.7 1,043.1 198.1
July 13,164.9 17,860.1 77,440.6 17,860.1 7,548.8 25,408.9 946.5 248.1
August 13,236.6 15,534.2 77,862.6 15,534.2 7,557.3 23,091.5 887.8 185.3
September 13,388.3 15,183.9 78,754.9 15,183.9 7,575.1 22,759.0 1,093.0 250.0October 13,086.1 14,289.0 76,977.0 14,289.0 5,539.5 19,828.5 866.4 280.1November 13,210.4 15,632.9 77,708.2 15,632.9 5,554.2 21,187.1 901.0 263.3
December 13,330.2 17,954.9 78,413.1 17,954.9 4,068.3 22,023.1 1,437.3 275.5
2016January 13,384.1 17,880.4 78,730.0 17,880.4 4,074.6 21,955.0 966.2 353.4
February 13,404.7 17,146.5 78,851.2 17,146.5 4,077.0 21,223.5 892.5 291.9
March 13,585.1 17,024.1 79,912.4 17,024.1 4,098.2 21,122.4 1,171.3 330.1
April 13,567.1 19,091.0 79,806.5 19,091.0 4,096.1 23,187.1 950.0 253.1
May 13,784.2 18,814.0 81,083.5 18,814.0 3,121.7 21,935.7 1,162.0 142.2
June 13,899.6 18,471.1 81,762.3 18,471.1 3,135.2 21,606.3 1,072.6 212.0
Source: Central Bank of Trinidad and Tobago r: revised p: provisional
Appendix 17Commercial Banks’ Liquid Assets
/TT$ Millions/

8 4
2016
Period Ending Central Government Credit Public Sector Private Sector Total Credit
Year on Year Percentage Change
in Private Sector
2003 3,114.7 1,404.4 15,234.0 19,753.0 3.72004 2,756.6 1,541.7 19,805.4 24,103.7 30.02005 3,646.9 3,292.8 24,662.2 31,601.9 24.52006 2,627.4 2,702.3 29,225.1 34,554.8 18.52007 2,834.7 4,119.8 35,574.0 42,528.5 21.72008 3,350.4 4,501.4 40,452.4 48,304.2 13.72009 7,943.9 7,327.7 38,689.1 53,960.8 -4.42010 9,696.9 7,723.2 38,886.7 56,306.8 0.52011 9,480.3 6,877.1 41,402.3 57,759.7 6.52012 14,808.9 7,075.3 43,010.0 64,894.2 3.92013 14,070.6 7,579.0 45,042.9 66,692.4r 4.72014 17,156.8 9,668.8 48,311.2 75,136.7 7.32015 14,924.7 11,388.4 51,246.4 77,559.5 6.1
2014October 16,128.6 7,304.0 47,599.8 71,032.3 7.0November 15,890.1 7,925.2 47,963.1 71,778.4 6.2December 17,156.8 9,668.8 48,311.2 75,136.7 7.3
2015January 16,748.7 9,891.7 48,524.7 75,165.1 6.8February 15,441.4 9,807.6 48,674.2 73,923.2 6.1March 16,392.5 9,527.0 48,734.2 74,653.7 6.1April 15,098.8 9,394.7 48,965.3 73,458.8 6.1May 15,084.4 9,460.6 48,913.6 73,458.6 4.6June 16,492.3 9,950.0 49,510.0 75,952.2 5.6July 15,163.1 9,840.7 49,635.3 74,639.2 5.8August 15,853.7 11,495.4 50,039.4 77,388.5 5.4September 15,004.9 12,353.5 50,124.4 77,482.8 5.8October 15,118.2 11,685.1 50,706.6 77,509.9 6.5November 15,725.4 11,548.6 50,784.0 78,058.0 5.9December 14,924.7 11,388.4 51,246.4 77,559.5 6.1
2016January 14,565.8 11,524.8 51,723.0 77,813.6 6.6February 16,483.1 11,362.0 51,550.2 79,395.3 5.9March 16,130.3 11,280.8 51,739.3 79,150.4 6.2April 15,952.5 11,342.1 52,300.1 79,594.7 6.8May 17,380.1 12,069.4 52,014.4 81,463.8 6.3June 19,009.1 10,986.2 51,975.7 81,971.0 5.0
Source: Central Bank of Trinidad and Tobagor: revised
Appendix 18Commercial Banks’ Domestic Credit
/TT$ Millions/

8 5
Prime Loan Rates Deposits
Period Ending Basic Prime Rate Term Demand Overdraft Real Estate
MortgageSavings
OrdinarySpecial
Savingsr 3 Month 3 to 6 Month
6 to 12 Month
2003 9.50 9.50 9.50 9.50 10.00 2.00 2.69 2.75 3.30 3.352004 8.75 9.13 8.75 9.13 9.50 1.44 2.38 2.05 2.69 3.212005 9.75 9.50 9.50 9.63 9.63 1.46 2.39 2.65 3.06 3.632006 11.75 10.63 11.75 11.75 11.75 1.40 2.39 2.35 2.92 3.382007 11.75 10.63 11.75 11.75 11.75 1.77 2.45 3.35 3.65 4.002008 13.00 12.88 13.00 13.00 13.00 2.13 2.39 3.00 3.86 4.132009 10.25 10.25 10.25 10.25 9.90 0.57 0.88 1.08 1.48 2.222010 8.38 8.25 8.25 8.25 8.25 0.32 0.33 0.52 0.79 1.332011 7.75 7.75 7.75 7.75 7.75 0.20 0.21 0.22 0.79 1.512012 7.50 7.63 7.50 7.50 7.50 0.20 0.23 0.23 0.61 0.712013 7.50 7.50 7.50 7.50 7.50 0.20 0.20 0.38 0.45 0.772014 7.75 7.50 7.50 7.50 7.50 0.20 0.20 0.38 0.45 0.78r
2015 8.93 7.50 7.50 7.50 7.50 0.20 0.20 0.38 0.45 0.78
2014October 7.50 7.50 7.50 7.50 7.50 0.20 0.20 0.38 0.45 0.77November 7.63 7.50 7.50 7.50 7.50 0.20 0.20 0.38 0.45 0.77December 7.75 7.50 7.50 7.50 7.50 0.20 0.20 0.38 0.45 0.77
2015January 7.75 7.50 7.50 7.50 7.50 0.20 0.20 0.38 0.45 0.77February 7.75 7.50 7.50 7.50 7.50 0.20 0.20 0.38 0.45 0.77March 7.75 7.50 7.50 7.50 7.50 0.20 0.20 0.38 0.45 0.77April 7.88 7.50 7.50 7.50 7.50 0.20 0.20 0.38 0.45 0.77May 8.00 7.50 7.50 7.50 7.50 0.20 0.20 0.38 0.45 0.77June 8.13 7.50 7.50 7.50 7.50 0.20 0.20 0.38 0.45 0.77July 8.25 7.50 7.50 7.50 7.50 0.20 0.20 0.38 0.45 0.77August 8.50 7.50 7.50 7.50 7.50 0.20 0.20 0.38 0.45 0.77September 8.50 7.50 7.50 7.50 7.50 0.20 0.20 0.38 0.45 0.77October 8.75 7.50 7.50 7.50 7.50 0.20 0.20 0.38 0.45 0.77November 8.75 7.50 7.50 7.50 7.50 0.20 0.20 0.38 0.45 0.77December 8.93 7.50 7.50 7.50 7.50 0.20 0.20 0.38 0.45 0.77
2016January 9.00 7.50 7.50 7.50 7.50 0.20 0.20 0.38 0.45 0.77February 9.00 7.50 7.50 7.50 7.50 0.20 0.20 0.38 0.45 0.77March 9.00 7.50 7.50 7.50 7.50 0.20 0.20 0.38 0.45 0.77April 9.00 7.50 7.50 7.50 7.50 0.20 0.20 0.38 0.45 0.77May 9.00 7.50 7.50 7.50 7.50 0.20 0.20 0.38 0.45 0.77June 9.00 7.50 7.50 7.50 7.50 0.20 0.20 0.38 0.45 0.78
Source: Central Bank of Trinidad and Tobago r: revised
Appendix 19Commercial Banks’
Interest Rates

8 6
2016
Period Ending Number of Transactions Volume of Shares
Traded (Mn) Market Value ($Mn)Composite Index (Period
End)
2004 36,057 312.5 3,033.4 1,074.6
2005 32,316 209.1 4,326.3 1,067.4
2006 20,791 220.8 2,498.0 969.2
2007 17,744 120.7 2,250.0 982.0
2008 22,053 135.0 2,191.0 842.9
2009 9,884 76.9 1,474.2 765.3
2010 8,496 77.6 864.5 835.6
2011 9,200 564.1 1,029.0 1,012.9
2012 8,778 50.7 746.6 1,065.0
2013 11,595 98.0 1,105.2 1,185.1
2014 11,643 91.6 1,115.7 1,150.9
2015 1,170 6.9 108.3 1,162.3
2014October 837 10.7 100.1 1,146.0
November 859 6.5 40.4 1,143.1
December 914 6.4 148.0 1,150.9
2015January 1,110 5.9 98.3 1,150.8
February 815 5.7 45.0 1,148.8
March 1,000 5.6 71.3 1,154.3
April 722 6.6 62.0 1,151.3
May 790 5.9 73.2 1,159.9
June 908 7.3 108.8 1,161.9
July 715 4.4 53.9 1,154.9
August 737 4.6 48.2 1,141.5
September 649 4.9 97.7 1,147.6
October 1,209 14.6 297.7 1,148.9
November 1,184 5.7 88.5 1,157.3
December 1,170 6.9 108.3 1,162.3
2016January 971 6.4 89.9 1,163.3
February 812 8.1 40.9 1,160.0
March 1,090 14.0 103.6 1,133.2
April 807 16.3 131.4 1,125.2
May 837 7.1 61.0 1,109.6
June 1,194 6.5 99.7 1,135.6
July 894 5.2 69.1 1,152.8
August 775 3.8 54.0 1,159.7
Source: Central Bank of Trinidad and Tobago
Appendix 20Secondary Market Activities

8 7
Oct '10/ Sep '11r
Oct '11/ Sep '12r
Oct '12/ Sep '13r
Oct '13/ Sep '14r
Oct '14/ Sep '15r
Oct '15/ Sep '16p
Total Revenue and Grants 47,535.9 49,309.9 52,782.2 58,397.0 57,261.5 44,941.8
Current Revenue 47,248.9 49,266.5 52,280.8 57,080.5 52,272.3 41,026.6
of which: Energy Sector Revenue
27,513.5 26,923.0 26,420.5 28,056.9 19,767.2 7,929.8
Tax Revenue 42,017.3 43,568.8 44,641.6 47,286.6 42,298.2 29,195.0
Non-Tax Revenue 5,231.6 5,697.7 7,639.2 9,793.9 9,974.1 11,831.6
Capital Revenue 45.0 42.2 419.4 1,292.8 4,989.5 3,915.2
Grants 242.0 1.2 82.0 150.7 92.3 114.9
Total Expenditure 49,853.3 53,840.3 58,827.2 62,820.9 59,971.4 52,234.9
Current Expenditure 41,644.3 44,475.2 49,230.0 54,386.3 52,322.9 47,526.2
Capital Expenditure 6,987.9 7,019.7 8,461.9 8,452.9 7,648.5 4,708.7
Current Account Balance 5,604.6 4,791.3 3,050.8 2,694.2 -50.6 -6,499.6
Overall Balance -2,216.4 -4,431.6 -5,942.4 -4,442.2 -2,709.9 -7,293.1
Financing Requirements 2,216.4 4,431.6 5,942.4 4,442.2 2,709.9 7,293.1
External Financing (net) 545.2 1,054.1 583.9 3,312.4 -199.2 9,783.2
Domestic Financing (net) 1,671.2 3,377.5 5,358.5 1,129.8 2,909.1 -2,490.1
Source: Budget Division, Ministry of Financer: revisedp: provisional
Appendix 21Central Government Fiscal Operations
/TT$ Millions/

8 8
2016
Oct '10/ Sep '11r
Oct '11/ Sep '12r
Oct '12/ Sep '13r
Oct '13/ Sep '14r
Oct '14/ Sep '15r
Oct '15/ Sep '16p
Total Revenue and Grants 47,535.9 49,309.9 52,782.2 58,397.0 57,261.5 44,941.8
Current Revenue 47,248.9 49,266.5 52,280.8 57,080.5 52,272.3 41,026.6
Tax Revenue 42,017.3 43,568.8 44,641.6 47,286.6 42,298.2 29,195.0
Non-Tax Revenue 5,231.6 5,697.7 7,639.2 9,793.9 9,974.1 11,831.6
Taxes on Income & Profits 33,266.4 33,105.0 33,508.8 36,752.3 29,974.3 17,012.3of which:- Companies 25,056.1 24,473.3 24,446.9 27,120.0 19,993.9 7,376.7 Oil 16,022.5 15,826.8 14,771.8 16,969.5 10,512.7 1,016.5 Other 9,033.6 8,646.4 9,675.1 10,150.5 9,481.2 6,360.2 Individuals 4,960.8 5,434.7 6,207.4 6,619.9 7,445.3 7,337.4 Withholding Taxes 1,197.3 1,083.6 884.6 941.5 1,066.8 985.8 Health Surcharge 216.0 293.6 186.6 210.2 264.0 211.4 Business Levy 208.9 187.4 218.0 209.6 215.0 432.7 Unemployment Fund 1,240.2 1,259.2 1,162.6 1,240.2 600.9 65.5 Green Fund 365.7 346.5 369.7 381.4 345.8 555.7
Taxes on Property 10.7 4.6 4.2 3.5 3.4 3.0 Land & Buildings 10.7 4.6 4.2 3.5 3.4 3.0
Taxes on Goods and Services 6,387.7 7,925.6 8,295.2 7,384.3 8,903.7 8,840.2of which:- Excise Duties 705.4 725.2 703.8 675.7 694.7 735.1 VAT 4,917.0 6,337.4 6,657.4 5,744.7 7,223.3 7,016.0 Motor Vehicle Taxes & Duties 428.6 524.3 551.5 569.4 575.5 598.9
Taxes on International Trade 2,167.8 2,319.4 2,587.7 2,861.5 3,014.2 3,003.2of which:- Import Duties 2,166.9 2,318.6 2,577.5 2,861.0 2,987.9 3,002.9
OtherStamp Duties 184.7 214.2 245.7 285.0 402.6 336.3
Non-Tax Revenue 5,231.6 5,697.7 7,639.2 9,793.9 9,974.1 11,831.6of which: - Royalty on Oil 2,415.2 2,448.5 2,379.6 2,399.2 1,100.7 697.7 Profits - State Enterprises 215.0 245.8 179.7 5,357.4 6,232.0 5,162.9 Profits - National Lottery 998.8 1,347.3 1,978.2 262.9 169.7 265.0 Production Sharing 0.0 0.0 800.0 0.0 450.0 1,000.0 Equity Profits - Central Bank 478.6 478.8 555.3 392.5 177.4 809.0 Interest Income 50.0 59.7 37.6 32.0 40.0 26.3 Repayment of Past Lending 35.3 32.0 22.1 18.3 27.7 2,679.8 Administrative Fees and Charges 593.7 419.4 522.5 803.8 636.1 586.1
Capital Revenue 45.0 42.2 419.4 1,292.8 4,989.5 3,915.2Grants 242.0 1.2 82.0 150.7 92.3 114.9
Source: Budget Division, Ministry of Financer: revisedp: provisional
Appendix 22Central Government Revenue
/TT$ Millions/

8 9
Oct '10/ Sep '11
Oct '11/ Sep '12
Oct '12/ Sep '13
Oct '13/ Sep '14r
Oct '14/ Sep '15r
Oct '15/ Sep '16p
Total Expenditure 49,853.3 53,840.3 58,827.2 62,820.9 59,971.4 52,234.9
Current Expenditure 41,644.3 44,475.2 49,230.0 54,386.3 52,322.9 47,526.2
Wages and Salaries 7,179.7 7,282.3 9,171.5 8,590.8 10,077.1 9,750.1
Goods & Services 6,504.3 7,061.6 7,180.1 8,008.8 8,105.4 7,250.7
Interest Payments 2,866.4 2,937.1 2,808.7 3,122.6 3,438.4 3,027.9
of which:-
Domestic 2,486.9 2,547.9 2,437.3 2,661.9 2,915.5 2,451.7
External 379.5 389.2 371.4 460.7 522.9 576.2
Transfers & Subsidies 25,093.9 27,194.2 30,069.7 34,664.1 30,702.0 27,497.5
Capital Expenditure 6,987.9 7,019.7 8,461.9 8,452.9 7,648.5 4,708.7
of which:-
Development Programme (PSIP) 3,276.6 3,335.8 3,315.4 3,630.6 4,064.3 3,162.2
Infrastructure Development Fund 3,552.3 3,683.9 5,146.5 4,804.8 3,584.2 1,546.5
Acquisition of Foreign Fixed Assets 159.0 0.0 0.0 17.5 0.0 0.0
Source: Budget Division, Ministry of Financer: revisedp: provisional
Appendix 23Central Government Expenditure and Net Lending
/TT$ Millions/

9 0
2016
Oct '10/ Sep '11r
Oct '11/ Sep '12r
Oct '12/ Sep '13r
Oct '13/ Sep '14
Oct '14/ Sep '15r
Oct '15/ Sep '16p
TOTAL FINANCING 2,216.4 4,431.6 5,942.4 4,442.2 2,709.9 7,293.1
NET EXTERNAL 545.2 1,054.1 583.9 3,312.4 -199.2 9,783.2
External Borrowings 1,175.3 1,765.6 1,025.8 3,835.0 344.4 7,812.9
Transfer from the Heritage and Stabilisation Fund (HSF)
- - - - - 2,498.4
Capital Repayments -630.1 -711.5 -442.0 -522.6 -543.6 -528.1
NET DOMESTIC 1,671.2 3,377.5 5,358.5 1,129.8 2,909.1 -2,490.1
Domestic Borrowings 446.6 2,880.9 1,579.0 1,783.4 3,831.8 6,468.4
Capital Repayments -1,364.4 -1,126.7 -1,885.8 -1,607.5 -2,686.7 -2,614.7
Sinking Fund Transfers -1,950.5 -1,021.7 -923.2 -866.8 -860.5 -731.0
Source: Budget Division, Ministry of Financer: revisedp: provisional
Appendix 24Central Government Budget Financing
/TT$ Millions/
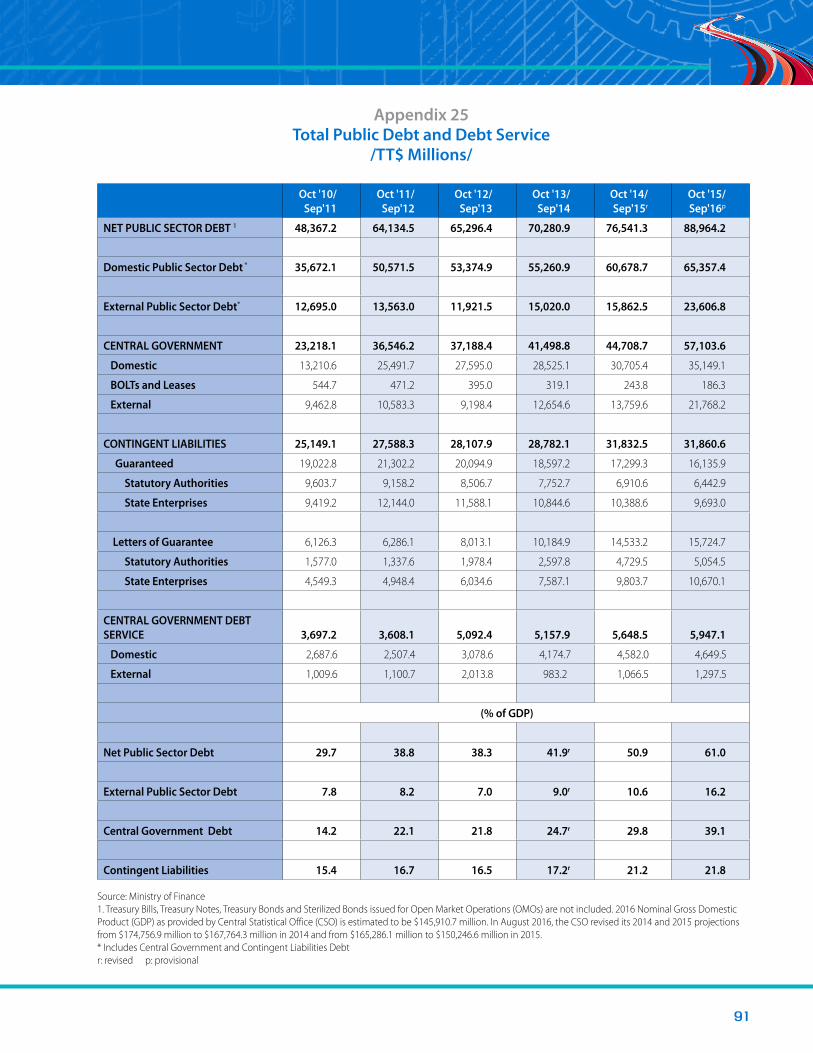
9 1
Oct '10/ Sep'11
Oct '11/ Sep'12
Oct '12/ Sep'13
Oct '13/ Sep'14
Oct '14/ Sep'15r
Oct '15/ Sep'16p
NET PUBLIC SECTOR DEBT 1 48,367.2 64,134.5 65,296.4 70,280.9 76,541.3 88,964.2
Domestic Public Sector Debt * 35,672.1 50,571.5 53,374.9 55,260.9 60,678.7 65,357.4
External Public Sector Debt* 12,695.0 13,563.0 11,921.5 15,020.0 15,862.5 23,606.8
CENTRAL GOVERNMENT 23,218.1 36,546.2 37,188.4 41,498.8 44,708.7 57,103.6
Domestic 13,210.6 25,491.7 27,595.0 28,525.1 30,705.4 35,149.1
BOLTs and Leases 544.7 471.2 395.0 319.1 243.8 186.3
External 9,462.8 10,583.3 9,198.4 12,654.6 13,759.6 21,768.2
CONTINGENT LIABILITIES 25,149.1 27,588.3 28,107.9 28,782.1 31,832.5 31,860.6
Guaranteed 19,022.8 21,302.2 20,094.9 18,597.2 17,299.3 16,135.9
Statutory Authorities 9,603.7 9,158.2 8,506.7 7,752.7 6,910.6 6,442.9
State Enterprises 9,419.2 12,144.0 11,588.1 10,844.6 10,388.6 9,693.0
Letters of Guarantee 6,126.3 6,286.1 8,013.1 10,184.9 14,533.2 15,724.7
Statutory Authorities 1,577.0 1,337.6 1,978.4 2,597.8 4,729.5 5,054.5
State Enterprises 4,549.3 4,948.4 6,034.6 7,587.1 9,803.7 10,670.1
CENTRAL GOVERNMENT DEBT SERVICE 3,697.2 3,608.1 5,092.4 5,157.9 5,648.5 5,947.1
Domestic 2,687.6 2,507.4 3,078.6 4,174.7 4,582.0 4,649.5
External 1,009.6 1,100.7 2,013.8 983.2 1,066.5 1,297.5
(% of GDP)
Net Public Sector Debt 29.7 38.8 38.3 41.9r 50.9 61.0
External Public Sector Debt 7.8 8.2 7.0 9.0r 10.6 16.2
Central Government Debt 14.2 22.1 21.8 24.7r 29.8 39.1
Contingent Liabilities 15.4 16.7 16.5 17.2r 21.2 21.8
Source: Ministry of Finance 1. Treasury Bills, Treasury Notes, Treasury Bonds and Sterilized Bonds issued for Open Market Operations (OMOs) are not included. 2016 Nominal Gross Domestic Product (GDP) as provided by Central Statistical Office (CSO) is estimated to be $145,910.7 million. In August 2016, the CSO revised its 2014 and 2015 projections from $174,756.9 million to $167,764.3 million in 2014 and from $165,286.1 million to $150,246.6 million in 2015. * Includes Central Government and Contingent Liabilities Debt r: revised p: provisional
Appendix 25Total Public Debt and Debt Service
/TT$ Millions/

9 2
2016Central Bank Commercial Banks
Period Ending
Foreign Assets
Foreign Liabilities
Net Internat. Reserves
Gov’t Balances
Foreign Assets
Foreign Liabilities
Net Foreign Position
Gross Foreign Assets
Total Foreign Liabilities
Net Foreign Position
(1) (2) (3) (4) (5) (6) (7) (8) (9) (10)(1)+(4)+(5) (2)+(6) (8)-(9)
2006 6,530.7 16.1 5,117.8 0.1 1,945.8 948.8 997.1 7,079.8 964.9 6,114.92007 6,673.4 14.8 6,658.6 0.1 1,959.7 1,069.5 890.1 8,633.2 1,084.3 7,548.82008 9,380.2 16.1 9,364.1 0.1 2,203.5 953.3 1,250.2 11,583.8 969.4 10,614.52009 8,651.5 0.0 8,651.5 0.1 2,739.3 787.3 1,952.0 11,390.9 787.3 10,603.62010 9,069.8 0.0 9,069.8 0.2 2,188.6 730.6 1,458.1 11,258.7 730.6 10,528.12011 9,822.4 0.0 9,822.4 0.3 2,490.9 723.0 1,767.8 12,313.6 723.0 11,590.52012 9,200.3 0.0 9,200.3 0.4 3,050.8 614.2 2,436.6 12,251.4 614.2 11,637.32013 9,987.0 0.0 9,987.0 0.0 3,087.3 745.2 2,342.1 13,074.4 745.2 12,329.22014 11,316.4 0.0 11,316.4 0.2 3,066.7 790.6 2,276.1 14,383.3 790.6 13,592.72015 9,787.4 0.0 9,787.4 0.6 3,508.9 811.5 2,697.4 13,296.9 811.5 12,485.4
2014October 11,110.8 0.0 11,110.8 0.2 3,163.1 746.2 2,416.9 14,274.1 746.2 13,527.9November 11,127.9 0.0 11,127.9 0.2 3,018.7 734.5 2,284.2 14,146.8 734.5 13,412.3December 11,316.4 0.0 11,316.4 0.2 3,066.7 790.6 2,276.1 14,383.3 790.6 13,592.7
2015January 10,921.2 0.0 10,921.2 0.2 3,104.7 752.0 2,352.8 14,026.1 752.0 13,274.2February 10,676.8 0.0 10,676.8 0.2 3,244.3 883.4 2,360.9 13,921.4 883.4 13,037.9March 10,710.0 0.0 10,710.0 0.2 3,209.4 680.7 2,528.7 13,919.6 680.7 13,238.9Apr 10,812.2 0.0 10,812.2 0.2 3,114.1 664.4 2,449.7 13,926.5 664.4 13,262.1May 10,658.3 0.0 10,658.3 0.4 3,231.6 680.3 2,551.3 13,890.3 680.3 13,209.9June 10,591.6r 0.0 10,591.6r 0.4 3,127.3 777.7 2,349.6 13,719.8 777.7 12,941.5July 10,479.9 0.0 10,479.9 0.4 3,086.3 746.4 2,339.9 13,566.6 746.4 12,820.3August 10,391.9 0.0 10,391.9 0.4 3,107.0 817.8 2,289.2 13,499.3 817.8 12,681.6September 10,311.7 0.0 10,311.7 0.6 3,313.2 857.3 2,455.9 13,625.5 857.3 12,768.2October 9,644.1 0.0 9,644.1 0.6 3,675.6 778.2 2,897.4 13,320.4 778.2 12,542.1November 9,634.4 0.0 9,634.4 0.6 3,513.7 823.4 2,690.3 13,148.7 823.4 12,325.4December 9,787.4 0.0 9,787.4 0.6 3,508.9 811.5 2,697.4 13,296.9 811.5 12,485.4
2016January 9,660.9 0.0 9,660.9 0.6 3,079.5 821.7 2,257.8 12,740.9 821.7 11,919.3February 9,531.2 0.0 9,531.2 0.6 3,094.8 653.6 2,441.2 12,626.6 653.6 11,973.0March 9,375.7 0.0 9,375.7 0.6 3,260.6 704.7 2,555.9 12,636.9 704.7 11,932.2April 9,232.5 0.0 9,232.5 0.6 3,217.0 648.2 2,568.8 12,450.1 648.2 11,801.9May 9,476.9 0.0 9,476.9 0.6 3,236.6 710.8 2,525.9 12,714.1 710.8 12,003.3June 9,374.6 0.0 9,374.6 0.6 3,083.0 519.0 2,564.1 12,458.2 519.0 11,939.3July 9,258.5 0.0 9,258.5 0.6 n.a. n.a. n.a. n.a. n.a. n.a.August 10,078.3 0.0 10,078.3 0.6 n.a. n.a. n.a. n.a. n.a. n.a.
Source: Central Bank of Trinidad and Tobagor: revised
Appendix 26Trinidad and Tobago - Net Foreign Reserves
/US$ Millions/

9 3
Imports Exports Balance of Trade
Exports of Mineral Fuels
Imports of Mineral Fuels
Imports Excluding
Mineral Fuels
Exports Excluding
Mineral Fuels
Balance of Trade
Excluding Mineral Fuels
1998 668.8 4,309.9 3,641.1 1,827.6 248.7 420.1 2,482.3 2,062.2
1999 827.9 4,708.1 3,880.2 2,323.3 454.6 373.3 2,384.8 2,011.5
2000 791.2 6,284.4 5,493.2 3,880.3 399.9 391.3 2,404.1 2,012.8
2001 750.8 6,415.2 5,664.4 3,808.7 218.2 532.6 2,606.5 2,073.9
2002 574.4 5,152.0 4,577.6 2,531.9 167.6 406.8 2,620.1 2,213.3
2003 588.9 6,585.5 5,996.6 4,146.8 69.0 519.9 2,438.7 1,918.8
2004 634.6 5,620.7 4,986.1 2,954.4 87.5 547.1 2,666.3 2,119.2
2005 700.2 13,153.1 12,452.9 9,931.0 126.6 573.6 3,222.1 2,648.5
2006 611.1 15,528.3 14,917.2 12,027.2 158.7 452.4 3,501.1 3,048.7
2007 762.3 11,462.3 10,700.0 7,571.5 177.9 584.4 3,890.8 3,306.4
2008 772.0 21,231.8 20,459.8 16,994.9 146.5 625.5 4,236.9 3,611.4
2009 700.0 9,141.4 8,441.4 5,945.8 101.7 598.3 3,195.6 2,597.3
2010 793.2 13,238.6 12,445.4 10,506.2 141.0 652.2 2,732.4 2,080.2
2011 1,545.8 13,442.5 11,896.7 9,630.5 218.8 1,327.0 3,812.0 2,485.0
2012 1,402.2 11,129.3 9,727.1 7,394.0 450.8 951.4 3,735.3 2,783.9
2013 1,230.9 19,933.4 18,702.5 15,671.0 421.8 809.1 4,262.4 3,453.3
2014p 1,212.4 12,770.2 11,557.8 8,553.3 399.9 812.5 4,216.9 3,404.4
2015p 1,002.4 7,285.1 6,282.7 3,323.8 164.7 837.7 3,961.3 3,123.6
Apr '14 / Jun '15p 1,525.8 13,398.3 11,872.5 8,148.2 443.1 1,082.7 5,250.1 4,167.4
Apr '15 / Jun '16p 1,150.6 7,094.1 5,943.5 2,884.6 177.4 973.2 4,209.5 3,236.3
Source: Central Statistical Officep: provisional
Appendix 27Trade with CARICOM Countries
/TT$ Millions/

9 4
2016
2010 2011 2012p 2013 2014r 2015pApr ‘14 / Jun ‘15p
Apr ‘15 / Jun ‘16p
Total Visible Trade
Exports 71,344.7 95,634.0 82,786.5 120,294.3 93,057.8 43,726.2 102,518.9 71,999.1
Imports 41,284.1 60,748.6 74,635.9 80,784.3 72,024.3 38,880.0 89,952.8 64,161.9
Balance 30,060.6 34,885.4 8,150.6 39,510.0 21,033.5 4,846.2 12,566.1 7,837.2
Trade Excluding Mineral Fuels
Exports 27,619.1 42,246.6 40,567.9 48,698.1 41,252.1 15,223.6 49,916.8 42,361.8
Imports 27,528.7 37,107.6 43,433.7 39,876.9 40,768.6 23,835.8 52,667.6 45,992.4
Balance 90.4 5,139.0 (2,865.8) 8,821.2 483.5 (8,612.2) (2,750.8) (3,630.6)
Trade Excluding Mineral Fuels U.P.A.
Exports 71,221.2 95,470.9 82,657.3 120,123.9 92,730.0 43,587.1 102,052.0 71,860.0
Imports 41,150.9 60,599.6 74,422.4 80,634.9 69,521.1 38,041.4 87,226.9 63,338.6
Balance 30,070.3 34,871.3 8,234.9 39,489.0 23,208.9 5,545.7 14,825.1 8,521.4
Trade in Mineral Fuels non - U.P.A
Exports 43,602.1 53,224.3 42,089.4 71,425.8 51,477.9 28,363.5 52,135.2 29,498.2
Imports 13,622.2 23,492.0 30,988.7 40,758.0 28,752.5 14,205.6 34,559.3 17,346.2
Balance 29,979.9 29,732.3 11,100.7 30,667.8 22,725.4 14,157.9 17,575.9 12,152.0
Trade in Mineral Fuels UPA
Exports 123.5 163.1 129.2 170.4 327.8 139.1 466.9 139.1
Imports 133.2 149.0 213.5 149.4 2,503.2 838.6 2,725.9 823.3
Balance (9.7) 14.1 (84.3) 21.0 (2,175.4) (699.5) (2,259.0) (684.2)
Trade in Mineral Fuels
Exports 43,725.6 53,387.4 42,218.6 71,596.2 51,805.7 28,502.6 52,602.1 29,637.3
Imports 13,755.4 23,641.0 31,202.2 40,907.4 31,255.7 15,044.2 37,285.2 18,169.5
Balance 29,970.2 29,746.4 11,016.4 30,688.8 20,550.0 13,458.4 15,316.9 11,467.8
Source: Central Statistical Officer: revisedp: provisional
Appendix 28Balance of Visible Trade
/TT$ Millions/

9 5

9 6
2016
Design & Layout: Paria Publishing Co. Ltd.
Cover Artwork: Christian Smart
Printing: Caribbean Print Technologies Ltd.


