Review of the Vesting Contract Technical Parameters for the period 1 January 2017 to 31 December 2018 Draft Report 2611312A-REP-002A 10 June 2016 Submitted to: Energy Market Authority Submitted by: WSP | Parsons Brinckerhoff www.wspgroup.com
Transcript
Review of the Vesting Contract Technical Parameters for the period 1 January 2017 to 31 December 2018
Draft Report 2611312A-REP-002A
10 June 2016 Submitted to: Energy Market Authority Submitted by: WSP | Parsons Brinckerhoff
This report has been provided by WSP | Parsons Brinckerhoff (“PB”) for the benefit of Energy Market
Authority Singapore (“EMA” or “Client”) in response to Client’s request for a proposal on Consultancy
services for the review of vesting price parameters 2017-2018 (“Services”).
This report has been prepared solely for the purpose described in the Services and no responsibility is
accepted for the use of this report, in whole or in part, for any other purpose. This report sets out findings
that are subject to the qualifications, assumptions and limitations set out in this report or otherwise
communicated to, or by, the Client.
PB has prepared this report for the purpose of assisting the EMA and has not had regard to any special or
particular interest of any person other than the EMA when undertaking the Services or setting out the
findings in the report.
It is recognised that the passage of time affects the information and findings provided in this report. PB
findings are based upon information that existed at the time of preparing this report.
This report has not (and will not) be updated for events or circumstances occurring after the date of the
report or any other matter which may have an effect on its contents which come to light after the date of this
report. Accordingly, PB is not (and will not be) obliged to provide an update of this report to include any
event, circumstance or matter coming to PB attention or becoming apparent after the date of this report
which may affect or qualify this report.
Where information (including without limitation, data from published sources) (“Information”) has been
provided by a third party, it has been assumed that the Information is correct unless otherwise stated in the
report. PB accepts no responsibility for the reliability, accuracy, completeness or adequacy of such
Information.
PB may have retained associates of a related entity or any other person in connection with or relating to the
business of PB (“Associates”) to provide part of the Services. To the maximum extent allowed by law, the
Associates have no liability to the Client in relation to the Services.
In no event shall the report be relied on as to recommend or induce a decision to make (or not to make) any
purchase, disposal, investment, divestment, financial commitment or otherwise.
No responsibility or liability whatsoever will be accepted by PB in relation to this report to any person other
than the Client. Any use which a third party makes of this report or a reliance on (or decisions to be made)
based on this report is the responsibility of those third parties.
i
WSP | Parsons Brinckerhoff
EXECUTIVE SUMMARY
WSP | Parsons Brinckerhoff (PB) has been engaged by Energy Market Authority (EMA) of Singapore to conduct a comprehensive review of the vesting price parameters set out in Section 2.3 of the published EMA’s Procedures for Calculating the Components of the Vesting Contracts (Procedures)
1 for the period 1 January 2017 to 31 December 2018. The vesting price parameters
are categorized as technical and financial.
The technical parameters, namely items 6 to 8 and 11 to 16 are covered by this report prepared by PB. The financial parameters, items 17 to 23 are provided separately in the financial report prepared by KPMG Singapore. The remaining items, 1 to 5 and 9 to 10 are determined by EMA.
The recommended technical parameters for the period 1 January 2017 to 31 December 2018 (1 January 2017 to 31 January 2017 for items 7 and 8) are summarised in the following table.
Summary of recommended technical parameters for 2017-2018 review
ITEM DESCRIPTION UNIT 2017-2018
6 Economic capacity of the most economic technology in operation in Singapore
MW 407.95
7 Capital cost of the plant identified in item 6 $US/kW 887.72
8 Land, infrastructure and development cost of the plant identified in item 6
$S million 157.74
11 HHV Heat Rate of the plant identified in item 6 Btu/kWh 7,072.1
12 Build duration of the plant identified in item 6 years 2.5
13 Economic lifetime of the plant identified in item 6 years 25
14 Average expected utilisation factor of the plant identified in item 6, i.e. average generation level as a percentage of capacity
% 60.2
15 Fixed annual running cost of the plant identified in item 6 $S million 19.69
16 Variable non-fuel cost of the plant identified in item 6 $S/MWh 7.45
1 The Procedures is available at EMA website: https://www.ema.gov.sg/cmsmedia/Version%202%203%20-%20Vesting%20Contract%20Procedures_updated.pdf Version 2.3, September 2015 has been used for this report.
4.1.1 O&M manning and head office services cost 25
4.1.2 Starts impact on turbine maintenance costs 26
4.1.3 Distillate usage impact on turbine maintenance 26
4.1.4 EMA licence (fixed) fees 27
4.1.5 Working capital costs 27
4.1.6 Emergency fuel usage 27
4.1.7 Property tax 27
4.1.8 Insurance 28
4.1.9 Summary and comparison with previous reviews 28
4.2 Variable non-fuel cost 29
5 OTHER PARAMETERS 30
5.1 Build duration 30
5.2 Economic life 30
5.3 Average expected utilisation factor 30
6 RESULTS - VESTING CONTRACT PARAMETERS 31
6.1 Introduction 31
6.2 Summary of technical parameters 31
6.3 Calculated LRMC 31
APPENDIX A 33
Prescribed Procedure 33
APPENDIX B 38
Economic Life 38
APPENDIX C 39
Thermodynamic Analysis 39
iv
TABLES
Table 1-1: Assumed financial parameters applied for LRMC calculation .. 1 Table 1-2: Assumed EMA determined parameters applied for LRMC calculation .................................................................................................. 2 Table 2-1: NEMS registered capacity by technology ................................. 3 Table 2-2: the details of existing generation plants ................................... 3 Table 2-3: Generation capacity of new entrant CCGT units @ 100% load condition ..................................................................................................... 6 Table 2-4: Estimated auxiliary loads within GT-Pro models @ 100% load condition ..................................................................................................... 7 Table 2-5: Gas pressure trends ................................................................. 9 Table 2-6: Generation capacity of new entrant CCGT units .................... 10 Table 2-7: Heat rate of new entrant CCGT units @ 100% load condition11 Table 2-8: Variation of HHV Heat rate of new entrant CCGT units ......... 11 Table 2-9: Heat rate of new entrant CCGT units ..................................... 13 Table 3-1: Gas Turbine World Handbook budget plant prices for CCGT units, USD/kWISO ...................................................................................... 16 Table 3-2: Construction Material Market Prices (2010 - Q1 2016) .......... 17 Table 3-3: Initial plant capital cost summary and compared with previous reviews (1 unit) ......................................................................................... 19 Table 3-4: Through-life capital costs (1 unit) ........................................... 20 Table 3-5: Current review land costs compared with previous reviews (2 units) ........................................................................................................ 20 Table 3-6: Electrical connection costs for two units ................................. 21 Table 3-7: Current review connection costs compared with previous reviews (1 unit) ......................................................................................... 22 Table 3-8: Owner’s cost after Financial Close ......................................... 22 Table 3-9: Owner's cost pre Financial Close ........................................... 23 Table 3-10: Current review Owner’s post and pre Financial Close costs compared with previous reviews .............................................................. 24 Table 4-1: Fixed annual operating cost for two units ............................... 25 Table 4-2: Annual fixed running costs compared with previous reviews (2 units) ........................................................................................................ 28 Table 4-3: Variable non-fuel cost parameters .......................................... 29 Table 4-4: Variable operating cost allowance comparison ...................... 29 Table 5-1: Other parameters compared with previous reviews (2 units) . 30 Table 6-1: Summary of recommended technical parameters and comparison with previous review ............................................................. 31 Table 6-2: Assumed financial parameters for LRMC calculation ............. 32 Table 6-3: Calculated LRMC for 2017-2018 ............................................ 32 Table 6-4: Calculated LRMC for 2017-2018 compared with previous review (gas price at S$8.47/GJ) .......................................................................... 32
v
FIGURES Figure 2-1: Form of CCGT recoverable and non-recoverable degradation8 Figure 2-2: Gas compressor power requirements for relevant gas turbine9 Figure 2-3: Gas network pressure; Networks 1 and 2 ............................... 9 Figure 2-4: Variation of heat rate to part load factor ................................ 12 Figure 3-1: Overview of capital cost considered in the review ................ 14 Figure 3-2: Price trends of power plants (without nuclear): PCCI and EPCCI ...................................................................................................... 16 Figure 3-3: BCA Tender Price Index (2010 = 100) .................................. 17 Figure 3-4: MAS Core Index, 2014 = 100 (2010-2016) ........................... 17 Figure 3-5: Assumed electrical connection configuration ........................ 21 Figure 4-1: Labour cost and MAS core inflation indices .......................... 26
vi
WSP | Parsons Brinckerhoff
ABBREVIATIONS
ABBREVIATION DESCRIPTION
AGC Automated Generation Control
CCGT Combined Cycle Gas Turbine
COD Commercial Operation Date
CPI Consumer Price Index
EMA Energy Market Authority
EPC Engineering, Procurement and Construction
EURO Currency of Eurozone
GE General Electric
GJ Giga Joule
GT Gas Turbine
HRSG Heat recovery steam generator
ISO International Organization for Standardization
kW kilo Watt
kWh kilo Watt hour
LRMC Long Run Marginal Cost
LTSA Long Term Service Agreement
MAS Monetary Authority of Singapore
MJ Mega Joule
MW Mega Watt
NEMS National Electricity Market of Singapore
OEM Original equipment manufacturer
O&M Operation and maintenance
PB WSP | Parsons Brinckerhoff
PEACE Plant Engineering And Construction Estimator
PLF Plant load factor
psm Per square metre
RH Relative humidity
SGD Currency of Singapore
SPPG Singapore Power Powergrid
SRMC Short run marginal cost
ST Steam turbine
USD Currency of USA
WACC Weighted average cost of capital
YoY Year on year
1
WSP | Parsons Brinckerhoff
1 INTRODUCTION
1.1 TERMS OF REFERENCE
In January 2004, the Energy Market Authority (EMA) of Singapore implemented Vesting Contracts as a tool to mitigate the exercise of market power by commercial generation companies (Gencos) in the national electricity market of Singapore (NEMS). Under the Vesting Contracts, Gencos are committed to sell a specified quantity of electricity at a specified price. This removes the incentive for large Gencos to withhold generation capacity in the market. The price under the Vesting Contracts is approximated with the long run marginal cost (“LRMC”) of a theoretical new generation entrant in the market, utilising the most economic generation technology in operation which contributes to more than 25% of total demand.
The parameters for setting the Vesting Contract price associated with these contracts are to be reviewed every two years. The current review relates to the setting of these parameters for 1 January 2017 through to 31 December 2018.
EMA has engaged WSP | Parsons Brinckerhoff (PB) to:
Conduct a comprehensive review and recommend the value of each vesting contract technical parameter (items 6 to 8 and 11 to 16 in section 2.3 of the Vesting Contract Procedures) for the setting of the vesting price for the period 1 January 2017 to 31 December 2018; and
Review the financial parameters, which are presented in a separate report. PB has engaged KPMG Singapore (KPMG) to provide the financial parameters (items 17 to 23 of the Vesting Contract Procedures) for the setting of the vesting price for the period 1 January 2017 to 31 December 2018.
To ensure consistency with the previous reviews and as instructed by EMA, PB has followed the method adopted by Jacobs SKM in the review of parameters for the period 1 January 2015 to 31 December 2016 (2015-2016 review) to determine the vesting contract technical parameters for 1 January 2017 through to 31 December 2018.
1.2 FINANCIAL PARAMETERS
The financial parameters as determined in the Financial Parameters Draft Report prepared by KPMG for use in the technical parameter analysis are shown in Table 1-1.
Table 1-1: Assumed financial parameters applied for LRMC calculation
NO. PARAMETER VALUE FOR 2017-2018 REMARKS
1 WACC 6.45% post-tax, nominal
7.27% pre-tax, real Calculated financial parameters
2 CPI 0.47%
Financial parameters; average year-
on-year MAS core inflation index for
Jan - Mar 2016
3 Exchange rates SGD/USD - 1.4018
SGD/EUR - 1.5475
Financial parameters; average of daily
Bid/Ask rates for Jan - Mar 2016
2
WSP | Parsons Brinckerhoff
1.3 EMA DETERMINED PARAMETERS
The parameters as determined by EMA for use in the technical parameter analysis are shown in Table 1-2.
Table 1-2: Assumed EMA determined parameters applied for LRMC calculation
NO. PARAMETER VALUE FOR 2017-2018 REMARKS
1 Determination Date
01 June 2016
2 Base Month March 20162
3 Application Date 1 Jan 2017 – 31 Dec 2018
4 Current Year 2017
5 Weighted average gas
price S$8.47/GJ
6 Gasoil (10ppm) price US$41.60/bbl Average midpoint of daily Bid/Ask for
Jan - Mar 2016
7
Average expected
utilisation factor of the
plant
60.2%
8 Generating licence fee S$57,780
1.4 DISCLAIMER
This report has been prepared for the benefit of EMA for the purposes of setting the vesting contract price for the 2017 to 2018 period. This report may not be relied upon by any other entity and may not be relied upon for any other purpose.
2 The base month used in this report is March 2016 for the purpose of obtaining the indicative LRMC. The base month will be updated to May 2016 for subsequent reports.
3
WSP | Parsons Brinckerhoff
2 PERFORMANCE PARAMETERS
The objective of this section is to estimate the technical performance parameters of the new entrant power plant in Singapore electricity market.
2.1 NATIONAL ELECTRICITY MARKET OF SINGAPORE
Total registered capacity in National Electricity Market of Singapore (NEMS) is 13,349 MW as on 31 December 2015. This capacity includes the new addition of Tuaspring’s first generation facility of 395.7MW and retirement of Sembcorp Cogen’s fourth generator with a capacity of 500MW3. It is estimated that the CCGT technology contributes to 70.26% of total registered capacity in Singapore as is shown in Table 2-1.
Table 2-1: NEMS registered capacity by technology
POWER GENERATION TECHNOLOGY REGISTERED CAPACITY % OF TOTAL
Combined Cycle Gas Turbine power plant 9,379.4 MW 70.26 %
Generation capacity from all other technologies 3,969.6 MW 29.74 %
In Singapore, electricity generation is predominantly dominated by gas based power generation using CCGT technology. The existing generation plant details are given below Table 2-2.
Table 2-2: the details of existing generation plants4
LARGE CCGT UNITS GT MODEL CAPACITY5 (MW) COD LICENCE NO.
Keppel Merlimau Cogen Pte Ltd (GRF Unit 1)
Conventional 250 Apr - 2007 EMA/GE/006
Keppel Merlimau Cogen Pte Ltd (GRF Unit 2)
Conventional 250 Apr - 2007 EMA/GE/006
Keppel Merlimau Cogen Pte Ltd (GRF Unit 3)
GT 26 420 Mar - 2013 EMA/GE/006
Keppel Merlimau Cogen Pte Ltd (GRF Unit 4)
GT 26 420 Jul - 2013 EMA/GE/006
PacificLight Power Pte Ltd (PACLBLK1)
SGT5-4000F 400 Jan - 2014 EMA/GE/005
PacificLight Power Pte Ltd (PACLBLK2)
SGT5-4000F 400 Feb - 2014 EMA/GE/005
Pulau Seraya Power Station (PSPS CCP1)
V94.3A 368 Oct - 2002 EMA/GE/016
Pulau Seraya Power Station (PSPS CCP2)
V94.3A 364 Nov - 2002 EMA/GE/016
Pulau Seraya Power Station (PSPS CCP3)
SGT5-4000F 370 Jul - 2010 EMA/GE/016
Pulau Seraya Power Station (PSPS CCP4)
SGT5-4000F 370 Jul - 2010 EMA/GE/016
Sembcorp Cogen Pte Ltd (SKACCP1)
GE 9FA 392.5 Sep - 2005 EMA/GE/004
Sembcorp Cogen Pte Ltd (SKACCP2)
GE 9FA 392.5 Sep - 2005 EMA/GE/004
3 NEMS market report 2015
4 https://www.ema.gov.sg/Licensees_Electricity_Generation_Company.aspx 5 “Capacity” means the maximum power that a generating unit can produce
Senoko Energy Pte Ltd (SNK CCP5) GT26 365 Dec - 2004 EMA/GE/012
Senoko Energy Pte Ltd (SNK CCP6) M701F 431 Aug - 2012 EMA/GE/012
Senoko Energy Pte Ltd (SNK CCP7) M701F 431 Aug - 2012 EMA/GE/012
Senoko Energy Pte Ltd (SNK G7) Conventional 243 Jun - 1983 EMA/GE/012
Senoko Energy Pte Ltd (SNK G8) Conventional 250 Dec - 1983 EMA/GE/012
Tuas Power Station, Stage II CCP1 M701F 367.5 Nov - 2001 EMA/GE/009
Tuas Power Station, Stage II CCP2 M701F 367.5 Jan - 2002 EMA/GE/009
Tuas Power Station (TUACCP3) M701F 367.5 Jun - 2002 EMA/GE/009
Tuas Power Station (TUACCP4) M701F 367.5 Sep - 2002 EMA/GE/009
Tuas Power Station (TUACCP5) GT26 405.9 Apr - 2014 EMA/GE/009
Tuasspring Pte Ltd (TSPBLK1) SGT5-4000F 395.7 Mar - 2016 EMA/GE/015
2.2 GENERATION TECHNOLOGY
The Vesting Contract procedures published by EMA6 indicate that:
The Energy Market Authority (“EMA” or the “Authority”) implemented Vesting Contracts on 1 January 2004 as a regulatory instrument to mitigate the exercise of market power by the generation companies (“Gencos”). Vesting Contracts commit the Gencos to sell a specified amount of electricity (viz. the Vesting Contract level) at a specified price (viz. the Vesting Contract price). This removes the incentives for Gencos to exercise their market power by withholding their generation capacity to push up spot prices in the wholesale electricity market. Vesting Contracts are allocated only to the Gencos that had made their planting decisions before the decision was made in 2001 to implement Vesting Contracts.
And also:
The Allocated Vesting Price approximates the Long Run Marginal Cost (LRMC) of a theoretical new entrant that uses the most economic generation technology in operation in Singapore and contributes to more than 25% of the total demand.
The underlying concept of LRMC is to find the average price at which the most efficiently configured generation facility with the most economic generation technology in operation in Singapore will cover its variable and fixed costs and provide reasonable return to investors. The plant to be used for this purpose is to be based on a theoretical generation station with the most economic plant portfolio (for existing CCGT technology, this consists of 2 to 4 units of 370MW plants). The profile of the most economic power plants is as follows:
6
Energy Market Authority, “EMA’s procedure for calculating the components of the vesting contracts”, September 2015, Version 2.3
5
WSP | Parsons Brinckerhoff
Utilises the most economic technology available and operational within Singapore at the time. This most economic technology would have contributed to more than 25% of demand at that time.
The generation company is assumed to operate as many of the units of the technology necessary to achieve the normal economies of scale for that technology.
The plants are assumed to be built adjacent to one another to gain infrastructure economies of scale.
The plants are assumed to share common facilities such as land, buildings, fuel supply connections and transmission access. The cost of any common facilities should be prorated evenly to each of the plants.
The plants are assumed to have a common corporate overhead structure to minimise costs. Any common overhead costs should be prorated evenly to each of the plants.
The technology selected according to these criteria is CCGT units based on “F” class gas turbines. The existing large CCGT/Cogen plants in Singapore are based on “F” class gas turbine technology. Hence this review is focused on CCGT power plant with “F” class gas turbine technology.
2.3 THERMODYNAMIC MODELLING
PB expects that any new power plant in Singapore would be optimised for performance at the reference site conditions. For this review, reference site conditions are as follows:
32°C dry bulb air temperature
85% relative humidity
0 metres mean sea level
29.2°C cooling water inlet temperature7
The operation of any other ambient conditions or sea water temperature will be considered as an off-design operation. This includes operation at the ambient conditions specified in the Singapore Market Manuals for the Maximum Generation Capacity at an ambient temperature of 24.7°C.
Since this review is focused on "F" class gas turbine CCGT units, the following original equipment manufacturers (OEMs) are available in the market:
Ansaldo Energia8 (Ansaldo)
Siemens Energy (Siemens)
GE Power & Water (GE)
Mitsubishi Hitachi Power System (MHPS)
The market for supply of such plants is competitive and it generally cannot be determined, without competitive bidding for a specific local project, which design is the most economic generation technology on an LRMC basis for new built plant. It is often the case for example that the configuration offered with the lowest heat rate is the bid with a higher capital cost. In order to model the performance of the most economic generator, it is recommended to consider all these OEMs’ appropriate "F" class CCGT configurations and to use an arithmetic average of the performance parameters of each of these OEMs' plants in CCGT configuration.
In order to estimate these performance parameters, the GTPro/GTMaster/PEACE9 (Version 25
with updates until 11 February 201610
) is used as a thermodynamic analysis. The output from the simulations is shown in Appendix C of this report.
7 Based on the previous vesting contract technical parameters report for the period 1 January 2015 to 31 December 2016
8 Following GE’s acquisition of Alstom in 2015, Alstom’s heavy duty gas turbine (GT 26 and GT 36) has been acquired by Ansaldo Energia
9 Software module released by “Thermoflow, Inc”
10 Base month is set at March 2016. Version updates will be checked for subsequent report for base month - May 2016.
6
WSP | Parsons Brinckerhoff
2.4 CAPACITY PER GENERATING UNIT
The generation capacities of new entrant CCGT configurations on a clean-as-new condition and at the Reference Site Conditions of 32°C air temperature are given in Table 2-3. Note that upgrades of gas turbine technologies occur frequently and judgement must be applied as to whether a new entrant developer would choose the very latest announced version of the gas turbine for a project in Singapore or not. In this review PB has decided not to apply the very latest announced models of the Mitsubishi gas turbine (the 701F5) but to instead select the variants that have been available in the market for a longer time (considering commercial operating experience).
New designs beyond “F” class technology are now available from most OEMs. For example “H” and “J” classes. A new entrant would likely consider these later models, however, the procedure indicates that the Allocated Vesting Price approximates the Long Run Marginal Cost (LRMC) of a theoretical new entrant that uses the most economic generation technology in operation in Singapore and contributes to more than 25% of the total demand. Thus it is interpreted that the procedure requires evaluation of “F” class units which are currently offered by the OEMs.
Table 2-3: Generation capacity of new entrant CCGT units @ 100% load condition
GT OEM / GT MODEL GROSS POWER AUXILIARY POWER NET POWER
Total auxiliary power and transformer losses 9,857.27 8,889.38 9,821.18 8,583.62
There is no need of further allowances to be made to the above performance numbers except the following factors:
Adjustment for degradation
Adjustment for gas compression
2.4.1 ADJUSTMENT FOR DEGRADATION
The capacities and heat rates of operating gas turbine and CCGT power plants degrade from the time the plant is clean-as-new. The following parameters are the primary drivers for performance degradation:
1. Fouling 2. Erosion 3. Roughening of the gas turbine compressor blades 4. Material losses in the turbine section
A CCGT plant has a slightly reduced degradation profile than a simple cycle gas turbine installation due to partial recovery of the losses suffered by the gas turbine in the steam cycle, and that the gas turbine only comprises approximately two thirds of the plant output. This degradation effect is typically described as having two components:
"Recoverable" degradation is degradation of performance that occurs to the plant that can be recovered within the overhaul cycle. Recoverable degradation can be substantially remediated by cleaning of air inlet filters, water washing of the compressor, ball-cleaning of condensers and the like. These cleaning activities are typically undertaken several or many times within a year depending on the site characteristics and the economic value of performance changes.
"Non-recoverable" degradation is caused by the impacts of temperature, erosion and corrosion of parts within the plant. This type of degradation is typically substantially remediated at overhaul when damaged parts are replaced with new or refurbished parts. Because the typical industry repair philosophy uses an economic mix of new and refurbished parts within overhauls, it is typically the case that not all of the original clean-as-new performance is recovered at the overhauls.
8
WSP | Parsons Brinckerhoff
The average capacity reduction due to recoverable degradation is estimated at 1%. That is, the degradation amount varies from approximately zero to approximately 2% over the cleaning cycle.
Additional to this, an allowance for the non-recoverable degradation of capacity should be made. These typically have the form similar to that shown in Figure 2-1. Degradation rates for base and intermediate loaded CCGT units are not considered to be materially affected by load factor or capacity factor.
Figure 2-1: Form of CCGT recoverable and non-recoverable degradation
Based on plants operating up to 93.2%11
of hours in the year, the degradation allowance of 3.06% for average capacity degradation over the plant's life is suggested (calculated as a weighted average using the pre-tax real discount rate to weight each year in the plant’s life).
2.4.2 ADJUSTMENT FOR GAS COMPRESSION
Gas compression is considered for new entrant “F” class CCGT plants in Singapore.
Three of the CCGT configurations noted use natural gas at approximately 30 barg and one configuration (the GT26) uses natural gas at approximately 50 barg. The gas compressor power requirements calculated for the relevant gas turbines at varying gas pressures are shown in Figure 2-2. An additional 7 bar pressure drop allowance from the system pressure measurement point to the site boundary (as included in GTPro) is included in the calculation.
Data for gas pressures in the Tuas area of Singapore is shown in Figure 2-3 and Table 2-5, for the period from December 2011 to March 2016. The Network 1 pressure may be downstream of a regulator in which case the upstream pressure will be higher.
The data indicates that gas compression is sometimes required under current conditions. Should the system pressures reduce further (e.g. because of load growth) then gas compression would be required more often.
For the purposes of this review it is assumed:
Gas compressors would be incorporated in a new plant in the Tuas View vicinity
The specification of the compressors would allow for further reductions in local gas pressures from those presently seen. It is assumed they would be capable of operating from a site boundary gas pressure of 17 barg
The average pressure at the site boundary during operation is 38.72 barg in the relevant period, being the average pressure in the Network 2 in 2015.
11
Estimated Available Capacity Factor for the plant
9
WSP | Parsons Brinckerhoff
Figure 2-2: Gas compressor power requirements for relevant gas turbine
Figure 2-3: Gas network pressure; Networks 1 and 2
On this basis the calculated average gas compressor auxiliary/parasitic load impact is 0.57 MW per unit based on the averaged pressure requirements of the four gas turbine models under consideration.
The resulting net capacity calculation after considering the above factor is given in Table 2-6.
Table 2-6: Generation capacity of new entrant CCGT units
PARAMETERS / FACTORS MW
Gross power @ RSC & clean as new 430.68
Adjustment for auxiliary power - 9.29
Adjustment for gas compression - 0.57
Adjustment for degradation - 12.87
Net Capacity 407.95
11
WSP | Parsons Brinckerhoff
2.5 HEAT RATE OF THE GENERATING UNIT
The heat rates of new entrant CCGT configurations, on a clean-as-new condition, and at the Reference Conditions of 32°C air temperature are given in below Table 2-7.
Table 2-7: Heat rate of new entrant CCGT units @ 100% load condition
CCGT CONFIGURATION NET LHV HR
(KJ/KWH)
NET HHV HR
(KJ/KWH)
NET LHV HR
(BTU/KWH)
NET HHV HR
(BTU/KWH)
GT 26 6,198 6,861 5,875 6,503
9F.05 6,185 6,847 5,862 6,490
701 F4 6,191 6,853 5,868 6,496
SGT5-4000F 6,196 6,859 5,873 6,501
Average 6,193 6,855 5,869 6,497
This thermodynamic modelling includes all corrections (within GTPro) necessary for:
Reference site ambient conditions and average sea water temperature of 29.2°C;
Boiler blow-down
Step-up transformer losses
No further allowances need to be made for these factors except as discussed below:
Adjustment for degradation
Adjustment for part load factor
Adjustment for starts gas usage
Adjustment for gas compression
2.5.1 ADJUSTMENT FOR DEGRADATION
As noted in Section 2.4.1 above, heat rates for CCGT plants are also subject to degradation. Weighted average heat rate degradation over the plant's life of 1.89% is estimated (weighted by the pre-tax real discount factor for each year).
2.5.2 ADJUSTMENT FOR PART LOAD FACTOR
Whenever the power plant is operated at less than the Maximum Continuous Rating (MCR) of the plant at the reference site conditions, the heat rate is affected. The modelled variation in heat rate with the part load factor of the plant is shown in Table 2-8 and Figure 2-4.
Table 2-8: Variation of HHV Heat rate of new entrant CCGT units
% CCGT LOAD AVERAGE HHV HEAT RATE RELATIVE TO 100% LOAD
100% 100.00%
95% 100.47%
90% 101.02%
85% 101.65%
80% 102.52%
75% 103.55%
70% 104.72%
65% 106.09%
60% 107.68%
55% 109.87%
50% 112.75%
12
WSP | Parsons Brinckerhoff
Figure 2-4: Variation of heat rate to part load factor
In the 2015-2016 review the plant load factor of the new plant was determined from the average historical capacity factor of the existing F class plant for the 12 months leading up to the base month.
For consistency with the previous reviews, the actual historic capacity factor for the previous 12 months is applied. This value has been advised by EMA to be 60.23%.
The part load factor is to be calculated based on the plant load factor of 60.23%. Applying the Available Capacity Factor of 93.2% (i.e. planned and unplanned outage rate is 6.8%) and assuming there are no economic shuts or part load conditions, the calculated part load factor is 60.23% / 93.2% = 64.62%. The apparent part load factor for the plant performance is slightly reduced since the registered capacity would only be 98.5% of the nominal capacity. The resulting overall part load factor is 63.65% for which the part-load factor for heat rate adjustment would be 6.71%.
2.5.3 ADJUSTMENT FOR STARTS GAS USAGE
An additional adjustment is made to reflect the natural gas used in starts through the year. The gas usage for starts is estimated at 10 hours of full-load operating equivalent, or 0.1%. In reviews prior to 2010, an additional allowance on account of regulation service is added to the heat rate (+0.5%). However, AGC requirement in Singapore is not considered to be materially different from other jurisdictions, where minor perturbations of output on account of AGC (for those units in the system providing AGC service) or on droop-control are part of normal operations for which no specific extra allowance is considered appropriate. Note that the impact of operating the plant at part-load on account of the need for regulation and contingency reserve ancillary services is already accounted for within the load factor correction.
98%
100%
102%
104%
106%
108%
110%
112%
114%
116%
118%
120%
40% 50% 60% 70% 80% 90% 100%
% o
f H
HV
HR
var
iati
on
% of CCGT partload
Variation of heat rate to part load
GT 26
9F.05
701 F4
SGT5-4000F
Average
13
WSP | Parsons Brinckerhoff
2.5.4 ADJUSTMENT FOR GAS COMPRESSION
An adjustment is applied to account for the gas compressor auxiliary load. As noted in Section 2.4, the auxiliary load of the gas compression has an impact on net output and also on net heat rate.
The resulting overall heat rate calculated is given in Table 2-9.
Table 2-9: Heat rate of new entrant CCGT units
PARAMETERS / FACTORS HHV HEAT RATE
Net HHV heat rate @ RSC & clean as new 6,855 kJ/kWh
Adjustment for degradation 130 kJ/kWh
Adjustment for overall part load factor 460 kJ/kWh
Adjustment for start gas usage 7 kJ/kWh
Adjustment for gas compression 10 kJ/kWh
Final HHV heat rate 7,462 kJ/kWh
7,072 Btu/kWh
14
WSP | Parsons Brinckerhoff
3 CAPITAL COST
3.1 INTRODUCTION
The items considered in the capital cost of the power plant are listed below and in Figure 3-1. Details are further described in the subsequent sections.
The main power island of the CCGT power plant in a single shaft configuration, each unit comprising of gas turbine generator, HRSG and steam turbine
The balance of plant facility costs (ancillary buildings, water treatment and demineralisation plant, gas compression system, sea water intake/outfall structures, emergency fuel unloading jetty and storage tanks
Civil works for the plant, erection and assembly, detailed engineering and start-up costs, and contractor soft costs
Additional spares and security measures as required by the authorities
Discounted through life capital cost
Land lease, water frontage and site preparation
Grid connection facility and gas receiving facilities
Owner’s costs before and after achievement of Financial Close.
Figure 3-1: Overview of capital cost considered in the review
15
WSP | Parsons Brinckerhoff
3.2 METHOD OF ASSESSMENT
The method of assessment for the estimated capital cost of the new entrant power plant uses the same approach as the previous reviews by Jacobs SKM. This includes the following:
1. Modelling the plant as discussed in Section 2 (a two-unit single shaft “F” class CCGT built with shared common facilities) using the latest version of the PEACE software included with the GTPro software suite. This model is used to generate the initial capital cost of the turnkey project with an EPC contracting strategy for each of the machine type. The average of the PEACE output of the four machine types is taken and adjusted to the plant output considered in this review. The PEACE software has in-built current regional cost factors (labour, equipment, currency) to adjust the costs to be region specific to reflect the market condition. The PEACE cost generated is on an “overnight basis”.
2. Enquiries made to the OEMs requesting for an EPC price indication for constructing such a green field CCGT plant in Singapore.
3. Assessment of recent CCGT power projects in the region and PB in-house data.
4. Assessment of published price indicators: Power Capital Cost Index (PCCI) North America, European Power Capital Cost Index (EPCCI) and the widely used Gas Turbine World Handbook to gauge the change in price trends of power plants since the last mid-term review. These are provided in Table 3-1 and Figure 3-2.
5. Cost of additional facilities and equipment required for the power plant that are not typically included in a turnkey project and captured by PEACE are computed using costs from the previous review adjusted by the BCA tender price index for construction components of civil/structural nature and the MAS core index for plant machinery and equipment. This method is consistent with the previous reviews. The indices are provided in Figure 3-3 and Figure 3-4.
RESULTS OF ANALYSIS
From the analysis of items 2 to 4, the PEACE cost breakdown of item 1 are adjusted to produce the initial plant capital cost in Table 3-3.
The information received from the OEMs indicate that the power market in Singapore and the region is very competitive and EPC prices have not risen to the extent as shown in the Gas Turbine World Handbook. There is a slight increase in the specialised equipment
12 price and for
the balance of plant equipment, such equipment packages are subcontracted out to local contractors to remain competitive. With this feedback from the OEMs, the balance of plant equipment multiplier in PEACE was adjusted for the modelled plant. The resulting initial plant cost was compared with recent CCGT projects in the region to provide a sanity check.
The price trends from the various sources, i.e., PCCI, EPCCI and GTW handbook are consulted to provide an indication of the global power market for CCGT plants. The specific costs are not used in the 2017-2018 review calculation as there is a time lag between the published data and actual market conditions. As seen from GTW Handbook prices in Table 3-1, the unit cost of the F-class CCGT plants have been on the upward trend since 2010. The upward trend is supported by EPCCI in the last quarter of 2014. However the price trend for PCCI shows a relative decline in the last quarter of 2014. It is noted that the PCCI and EPCCI includes costs of coal, gas and wind power plants and may not truly reflect the CCGT power plant market.
12
Main power island equipment consisting of gas turbine, steam turbine-generator, HRSG, condenser, DCS, CEMS and transformers.
16
WSP | Parsons Brinckerhoff
Table 3-1: Gas Turbine World Handbook budget plant prices for CCGT units, USD/kWISO
GAS TURBINE UNIT FOR
A SINGLE SHAFT CCGT
BLOCK
VOL. 26 2007-08
VOL. 27 2009
VOL. 28 2010
VOL. 29 2012
VOL. 30 2013
VOL. 31 2014-2015
Frame 9FB 520 551 494 536 572 667
M701F 529 539 491 533 560 670
GT26 521 549 497 539 Not listed 675
SGT5-4000F 521 550 497 Not listed Not listed Not listed
Figure 3-2: Price trends of power plants (without nuclear): PCCI and EPCCI13
The apparent local construction costs have decreased from the previous review as reflected by the construction material prices and the BCA Tender Price Index. For the mid-term review of 2015-2016, the index used was for February 2015 at 106.4 (adjusted to base year 2010=100 as implemented by BCA in 2015) and the latest value used in this report is 101.0, the February 2016 quarterly data published. Thus, the adjustment factor applied is 0.95 from the 2015-2016 mid-term review.
For plant machinery and equipment which are outside of the EPC contractor scope, the cost estimates have been escalated using the MAS core index which reflects the cost of goods in Singapore, excluding accommodation and private road transport. The previous index used in the 2015-2016 mid-term review was 100.34 (average of 3 months including base month, May 2015) and the current value is 101.03 (average of 3 months including base month, March 2016
14). This
reflects a small increase of 1.0069.
13
IHS Indexes. The PCCI and EPCCI track the costs of building coal, gas, wind and nuclear power plants, indexed to year 2000. Data excluding nuclear power plants are used. https://www.ihs.com/info/cera/ihsindexes/
14 Base month will be updated to May 2016 when data from MAS is available
80
100
120
140
160
180
200
2000 2002 2004 2006 2008 2010 2012 2014 2016
Co
st
Ind
ex (
2000=
100)
Power Capital Cost Index (PCCI) and European Power Capital Cost Index (EPCCI)
The initial plant capital cost includes the following modifications applied to a typical two-unit CCGT plant. This is done to reflect the design features required for a power plant in Singapore. Where plant equipment or infrastructure is shared between the two units, the costs are halved.
Gas compression system (two trains per unit)
Once-through cooling system with the civil costs added separately on a shared (two-unit) basis
Dual fuel firing system for the gas turbines and fuel forwarding system from the tanks
Fuel unloading jetty and associated facilities on a shared (two-unit) basis
Fuel tanks with on-site storage capacity at not less than sixty days on a shared (two-unit) basis
Civil costs are calculated on a two-unit station basis and then halved
Building and structures costs are calculated for a two unit station and then halved
Additional security measures as allowed in previous reviews
Additional inlet filter spares considering the requirements of the Transmission Code clause 9.2.5
The resulting initial plant cost for the plant (excluding external connections) is S$500.388 million per unit as shown in Table 3-3. This cost is on an "overnight" basis
15.
15
Overnight basis does not include interest during construction.
19
WSP | Parsons Brinckerhoff
Table 3-3: Initial plant capital cost summary and compared with previous reviews (1 unit)
Total initial plant cost excl. connection costs (1 unit)
(numbers may not add up due to rounding)
500.388 480.506 447.395
The initial plant capital cost estimate for this review is approximately 4.1% higher than the 2015-2016 mid-term review due to an increase in EPC price trend in the market as observed in Table 3-1 and Figure 3-2. The Singapore dollar exchange rates to the Euro and US dollars have also contributed to this increase as EPC contracts are usually quoted in multi-currencies.
Thus, the total initial plant cost is S$500.388 million for one unit or S$1.001 billion for two units.
3.4 THROUGH-LIFE CAPITAL COSTS
Additional capital costs are incurred through the project's life. Actual costs incurred vary considerably and are based on progressive assessments made of plant condition through the plant's life. The recommended estimates for this review are given in Table 3-4.
The maintenance costs incurred for the overhaul cycles of the gas turbine and steam turbine are included in the Operating Cost Sections 4.1 and 4.2.
20
WSP | Parsons Brinckerhoff
Table 3-4: Through-life capital costs (1 unit)
NO. ITEM UNIT 2017 - 2018
1 Distributed control system (DCS)
- Time to replacement:
- Cost of replacement:
EOH
S$ m
S$ m (2016 real)
150,000 or ~15 years
6.80
2.37 (discounted equivalent at pre-tax
real WACC of 7.27%)
2 Gas turbine rotor
- Time to replacement:
- Cost of replacement:
EOH
S$ m
S$ m (2016 real)
150,000 or ~15 years
14.0 (US$10 m)
4.89
(discounted equivalent at pre-tax real WACC of 7.27%)
Total through life capital cost (1 unit)
(numbers may not add up due to rounding)
S$ m 7.26
The cost of the DCS upgrade depends on the level of obsolescence of related items such as field instrumentation and associated wiring.
Towards the end of the notional technical life of the plant, if market studies indicated that the plant may still be economic, studies would be undertaken to evaluate extending the plant's life. The studies and the resulting costs and resulting life extensions are not included.
3.5 LAND AND SITE PREPARATION COST
The land and site preparation cost excludes (i) facility costs (ancillary buildings, demineralisation plant, sea water intake/outfall structures, constructing the jetty for emergency fuel unloading facility and gas receiving facilities) and (ii) emergency fuel facilities. These costs have been included under capital cost for the current review.
The site area for building the two units remains unchanged from the previous review at 12.5 Ha and a waterfront requirement of 200m. Based on data published by JTC Corporation’s Land Rents and Prices, the land price for 30-year lease at Tuas View is between $226 and $282 psm and taking the midpoint value of S$254 psm, the total land lease cost is S$31.75 million. The published water frontage fees range from $1,280 to $1,920 per metre per year and using the midpoint annual cost at a pre-tax discount rate of 7.27% over 25 years; this gives an equivalent cost of $3.64 million. Therefore, the total cost assuming mid-point land cost is S$35.39 million.
For site preparation cost at the same site location as the previous review, the BCA tender price index have been applied to the previous mid-term review cost of S$2.23 million which results in site preparation cost of S$2.11 million.
The total land and site preparation costs are summarised and compared with the previous reviews in Table 3-5.
Table 3-5: Current review land costs compared with previous reviews (2 units)
NO. REVIEW UNIT 2017 - 2018 2015-2016 (MID-TERM)
2015-2016
1 Land cost for 30-year lease at Tuas View S$ m 31.75 33.31 36.13
2 Equivalent water frontage cost S$ m 3.64 4.05 4.05
3 Site preparation cost S$ m 2.11 2.23 2.23
Total land and site preparation cost (2 units)
S$ m 37.50 39.58 42.40
21
WSP | Parsons Brinckerhoff
For the current review, the total land and site preparation costs is $37.50 million for two units or S$18.75 million per unit.
3.6 CONNECTION COST
The connection costs for electrical and gas connections to the electricity grid and gas network respectively are considered in this section.
3.6.1 ELECTRICAL CONNECTION COST
For the electrical connection cost, the components considered are shown in Figure 3-5 and itemised in Table 3-6. The electrical connection configuration assumed in this review is consistent with the previous review where the 3 x 500 MVA arrangement is selected from the options of a 3 x 500 MVA or 2 x 1000 MVA connection. It is noted that the PacificLight and Sembcorp Cogen connections are using the 3 x 500 MVA configuration to achieve the “N-1” redundancy arrangement. The sizing of the 230kV GIS equipment, 230kV cables have been sized for export of the plant total net output at 24.7°C of 879.4 MW.
Table 3-6: Electrical connection costs for two units
NO. ITEM UNIT 2017 - 2018
1 Total SPPG generation connection charge S$ m 43.97
1a - Plant output at 24.7°C MW 879.4
1b - Unit cost of SPPG generation connection charge S$/MW 50,000
2
230kV Switchgear GIS and underground cables
- Includes switch house but excludes generator transformer which is included in power plant cost
- 3 x 500 MVA circuits, 1km direct buried cables
S$ m 34.06
Total electricity connection cost (2 units) S$ m 78.03
1. SPPG generation connection charge
2. Connection components and underground cables
Electrical connection cost components
22
WSP | Parsons Brinckerhoff
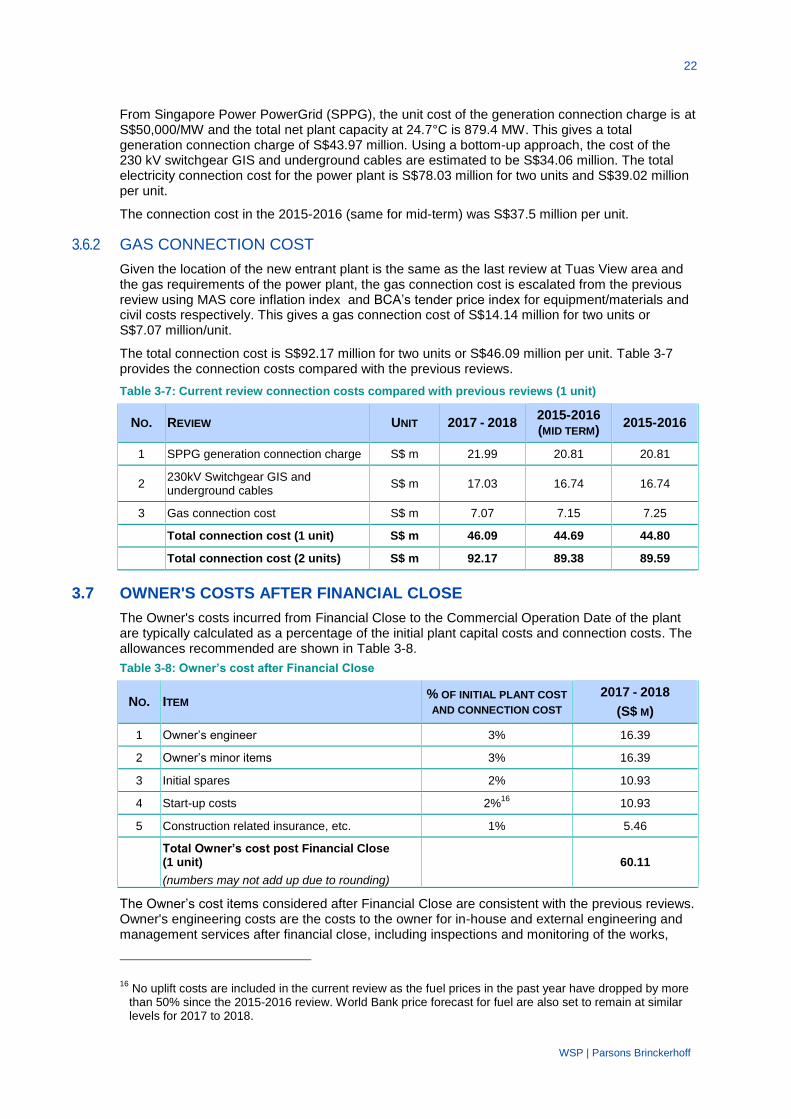
From Singapore Power PowerGrid (SPPG), the unit cost of the generation connection charge is at S$50,000/MW and the total net plant capacity at 24.7°C is 879.4 MW. This gives a total generation connection charge of S$43.97 million. Using a bottom-up approach, the cost of the 230 kV switchgear GIS and underground cables are estimated to be S$34.06 million. The total electricity connection cost for the power plant is S$78.03 million for two units and S$39.02 million per unit.
The connection cost in the 2015-2016 (same for mid-term) was S$37.5 million per unit.
3.6.2 GAS CONNECTION COST
Given the location of the new entrant plant is the same as the last review at Tuas View area and the gas requirements of the power plant, the gas connection cost is escalated from the previous review using MAS core inflation index and BCA’s tender price index for equipment/materials and civil costs respectively. This gives a gas connection cost of S$14.14 million for two units or S$7.07 million/unit.
The total connection cost is S$92.17 million for two units or S$46.09 million per unit. Table 3-7 provides the connection costs compared with the previous reviews.
Table 3-7: Current review connection costs compared with previous reviews (1 unit)
NO. REVIEW UNIT 2017 - 2018 2015-2016 (MID TERM)
2015-2016
1 SPPG generation connection charge S$ m 21.99 20.81 20.81
2 230kV Switchgear GIS and underground cables
S$ m 17.03 16.74 16.74
3 Gas connection cost S$ m 7.07 7.15 7.25
Total connection cost (1 unit) S$ m 46.09 44.69 44.80
Total connection cost (2 units) S$ m 92.17 89.38 89.59
3.7 OWNER'S COSTS AFTER FINANCIAL CLOSE
The Owner's costs incurred from Financial Close to the Commercial Operation Date of the plant are typically calculated as a percentage of the initial plant capital costs and connection costs. The allowances recommended are shown in Table 3-8.
Table 3-8: Owner’s cost after Financial Close
NO. ITEM % OF INITIAL PLANT COST
AND CONNECTION COST
2017 - 2018
(S$ M)
1 Owner’s engineer 3% 16.39
2 Owner’s minor items 3% 16.39
3 Initial spares 2% 10.93
4 Start-up costs 2%16
10.93
5 Construction related insurance, etc. 1% 5.46
Total Owner’s cost post Financial Close (1 unit)
(numbers may not add up due to rounding)
60.11
The Owner’s cost items considered after Financial Close are consistent with the previous reviews. Owner's engineering costs are the costs to the owner for in-house and external engineering and management services after financial close, including inspections and monitoring of the works,
16
No uplift costs are included in the current review as the fuel prices in the past year have dropped by more than 50% since the 2015-2016 review. World Bank price forecast for fuel are also set to remain at similar levels for 2017 to 2018.
23
WSP | Parsons Brinckerhoff
contract administration and supervision, project management and coordination between the EPC contractor, connection contractors and contractors providing minor services, witnessing of tests and management reporting.
Minor items include all the procurement costs to the owner outside of the primary plant EPC costs and the electricity and gas connections. This includes permits/licences/fees after financial close, connections of other services, office fit-outs and the like. This also reflects any site specific optimisation or cost requirements of the plant above those of a "generic" standard plant covered in Section 3.3.
Start-up costs include the cost to the owner of bringing the plant to commercial operation (the actual commissioning of the plant is within the EPC contractor's scope). The owner is typically responsible for fuels, water and consumables used during testing and commissioning, recruiting, training and holding staff prior to commercial operations commencing, and for establishing systems and procedures. The construction related insurance cost borne by the owner has also been considered in the owner’s total cost after Financial Close.
The initial working capital, including initial working capital for liquid fuel inventory and for accounts receivable versus payable, are not included (these are an ongoing finance charge included in the fixed operating costs of the plant in Section 4.1).
The total owner’s cost after Financial Close is S$60.11 million for one unit or S$120.22 million for two units.
3.8 OWNER'S COSTS PRIOR TO FINANCIAL CLOSE
At the time of Financial Close, when the investment decision is being made, the costs accrued up to that time against the project are "sunk" and are sometimes not included in a new entrant cost estimate.
Nevertheless, the industry needs to fund the process of developing projects to bring a plant from initial conception up to financial closure. If these are to be added, the costs can be highly variable. The allowances should include both in-house and external costs to the owner/developer from concept onwards including all studies, approvals, negotiations, preparation of specifications, finance arranging, legal, due diligence processes with financiers etc. These would typically be over a 3 to 5 year period leading up to financial close. An example of typical allowances based on percentages of the EPC cost is shown in Table 3-9.
Table 3-9: Owner's cost pre Financial Close
NO. ITEM % OF INITIAL PLANT
COST AND
CONNECTION COST
2017 - 2018
(S$ M)
1 Permits, licenses, fees 2% 10.93
2 Legal and financial advice and costs 2% 10.93
3 Owner's engineering and in-house costs 2% 10.93
Total Owner’s cost pre-Financial Close (1 unit) 32.79
Permits, licences and fees primarily consist of gaining the environmental and planning consents for the plant.
Legal and financial advice is required for establishing the project vehicle, documenting agreements, preparing financial models and information memoranda for equity and debt sourcing, management approvals and due diligence processes.
Owner's engineering and in-house costs prior to financial closure include the costs of conceptual and preliminary designs and studies (such as optimisation studies), specifying the plant, tendering and negotiating the EPC plant contract, negotiating connection agreements, attending on the feasibility assessment and due diligence processes, management reporting and business case preparation, etc.
24
WSP | Parsons Brinckerhoff
Project development on a project financed basis sometimes incurs extra transaction costs, such as swaptions for foreign exchange cover or for forward interest rate cover. These are highly project specific and not always necessary. No extra allowance is included.
Table 3-10: Current review Owner’s post and pre Financial Close costs compared with previous reviews
NO. REVIEW UNIT 2017 - 2018 2015-2016 (MID TERM)
2015-2016
1 Owner’s cost after Financial Close S$ m 60.11 59.37 55.74
2 Owner's cost pre Financial Close S$ m 32.79 31.51 29.53
Total Owner’s cost (1 unit) S$ m 92.90 90.88 85.27
25
WSP | Parsons Brinckerhoff
4 OPERATING COST
4.1 FIXED ANNUAL RUNNING COST
The fixed operation and maintenance cost of the power plant is discussed in this section using a bottom-up approach following the same methodology as adopted in the previous reviews.
As with the previous review, the gas turbine and steam turbine Long Term Service Agreement (LTSA) costs are treated as variable costs rather than fixed costs as the LTSAs are a function of the generation hours and part load factors. Typically, an LTSA only covers the main gas turbine and steam turbine components. The remaining balance of the plant including heat recovery steam generators (HRSGs), cooling system and electrical plant is maintained separately by the owner outside of the LTSA. The cost of this maintenance is typically considered to be a fixed cost, and is included in this section. An assessment of the fixed annual cost of operating the power station is shown in Table 4-1.
Table 4-1: Fixed annual operating cost for two units
NO. ITEM 2017 - 2018 (S$ M)
1 O&M Manning 5.390
2 Head office services 3.234
3 Fixed maintenance and other operations17
18.014
4 Starts impact on turbine maintenance 1.204
5 Distillate usage impact on turbine maintenance 0.090
6 EMA licence fee (fixed) 0.058
7 Working capital 3.822
8 Emergency fuel usage 0.869
9 Property tax 1.703
10 Insurance 5.004
Total fixed operation and maintenance cost
(numbers may not add up due to rounding) 39.388
The total fixed annual running cost is S$39.388 million and since services and facilities are shared equally, the cost per unit is S$19.694 million.
4.1.1 O&M MANNING AND HEAD OFFICE SERVICES COST
The operation and maintenance manning costs have been estimated based on 45 personnel covering the two units at S$119,788/person/year. The unit rate considers the cost allowed in 2014 for the 2015-2016 review indexed using a factor produced from average remuneration changes in a “chemicals” manufacturing environment in Singapore (in the absence of a power generation industry index being available) and MAS core inflation index. The indices used are shown in Figure 4-1.
The personnel include shift operators/technicians and shift supervision as well as day shift management, a share of trading/dispatch costs if this is undertaken at the station (versus head office), engineering, chemistry/environmental, trades supervision, trades and trades assistants, stores control, security, administrative and cleaning support. The cost per person is intended to cover direct and indirect costs.
17
Calculated as 3% of the plant capital cost per year excluding the cost attributable to the gas turbine and steam turbine (which are included in the variable operating maintenance costs in Section 4.2). These costs need to cover non-turbine maintenance, all other fixed costs including fixed charges of utilities and connections, service contracts, community service obligations etc.
26
WSP | Parsons Brinckerhoff
Figure 4-1: Labour cost18
and MAS core inflation indices
Head office costs would be highly variable and depend on the structure of the business and the other activities the business engages in. Only head office support directly associated with power generation should be included as part of head office costs. The allowance for head office costs is a nominal allowance (60% of manning cost allowance) for services that might be provided by head-office that are relevant to the generation services of the plant. These would include (for example):
Support services for generation such as trading etc.;
Corporate management and governance;
Human Resources and management of group policies (such as workplace safety and health, training etc.);
Accounting and legal costs at head office; and
Corporate Social Responsibility costs.
4.1.2 STARTS IMPACT ON TURBINE MAINTENANCE COSTS
The starts impact on turbine maintenance costs accounts for the fact that some gas turbine OEMs account for additional Equivalent Operating hours (EOH) factor or factored fire hours (FFH) for starts and this impacts on the costs under the LTSA.
Based on a EOH unit cost of US$2.50/CCGT-MWh at nominal ISO full load and allowing for correction from ISO conditions to reference site conditions, the equivalent cost is S$1,094.52/GT-EOH. The EOH factor is also adjusted by the part-load factor since the EOH measurement is based on operating hours rather than MWh. The LTSA is based on the gas and steam turbine only rather than maintenance of the whole plant. The starts factor only impacts on the gas turbine component however. Based on 55 starts/unit and 10 EOH/start, the cost is S$601,989 per unit or S$1,203,977 for two units.
4.1.3 DISTILLATE USAGE IMPACT ON TURBINE MAINTENANCE
Gas turbines installed in the Singapore are required to have dual fuel firing capabilities. The distillate usage has an impact of 1.5 EOH or FFH consumption. Based on the factor of 1.5 when operating on distillate, the additional EOH/FFH consumption over natural gas fuel operation is 0.5 EOH/hour. This equates to an impact on annual fixed running cost of S$44,876 per unit or S$89,751 for two units.
18
Labour cost index is produced using “Remuneration Per Worker of Manufacturing By Industry Cluster, Annual” available on SingStats. Source: Economic Development Board.
0%
20%
40%
60%
80%
100%
120%
2000 2002 2004 2006 2008 2010 2012 2014 2016
Labour cost index (Chemicals) and MAS core inflation index
Labour index (2014 = 100)
MAS Core Inflation Rate (2014 = 100)
27
WSP | Parsons Brinckerhoff
Calculation of the working capital cost and the emergency fuel usage cost below requires an estimate of the costs of distillate and natural gas. For the purposes of this report, the weighted average gas price of S$8.47/GJ and gas-oil (10ppm) price of S$11.18/GJ are applied. The gas-oil (10ppm) cost is based on the average daily rates from January to March 2016 at US$41.60/bbl and a handling and delivery cost allowance of US$6.52/bbl has been added to give the delivered gas-oil (10ppm) cost of US$48.12/bbl.
4.1.4 EMA LICENCE (FIXED) FEES
The annual generating licence fee for the power plant is S$57,780 for two units or S$28,890 per unit as advised by EMA. This licence fee is unchanged from the previous reviews.
4.1.5 WORKING CAPITAL COSTS
The working capital costs are the annual costs of the financial facilities needed to fund working capital. This comprises two components:
Emergency fuel inventory: EMA has recently revised the fuel reserves policy for generating companies to maintain fuel reserves to cover at least 60 days of its normal operation. Of the 60 days, at least 30 days must be on site and the balance may be stored by a fuel vendor within Singapore provided that it can be securely delivered to the power station when required. Note that the required on site storage tank capacity remains at not less than 60 days. On the fuel reserves policy, this is a reduction from at least 90 days of fuel reserves previously. The methodology applied to calculate the working capital cost for holding the fuel reserves remains unchanged. An effective working capital cost of 30 + 30/2 days is allowed as the offsite storage charge by the supplier would be between zero and the full cost but a midrange estimate of 50% have been used.
At the distillate or gas-oil (10ppm) cost of S$11.18/GJ and a pre-tax nominal WACC of 7.77%, the working capital cost for the emergency fuel inventory is S$3.442 million for two units or S$1.721 million per unit.
This is a significant drop from the previous 2015-2016 review of S$13.41 million for two units mainly due to the drop in gas-oil prices from 2014 to 2016 and the reduction in EMA’s fuel reserves policy (previously a total of 90 days).
Working capital against the cash cycle (timing of receipts from sales versus payments to suppliers) based on a net timing difference of 30 days and excluding fuel costs (based on the short settlement period in the market of 20 days from the time of generation). For two units the working capital requirement on this basis is S$4.892 million and the working capital cost (using a pre-tax nominal WACC of 7.77%) is S$0.380 million for two units per year or S$0.190 million per unit.
The total working capital costs considered for this review is S$3.822 million for two units or S$1.911 million for one unit.
4.1.6 EMERGENCY FUEL USAGE
The emergency fuel usage is an estimated amount of emergency fuel used for testing, tank turnover, maintenance works, etc. As applied in the last review, this is computed based on 1% of equivalent annual fuel usage and the difference in cost of distillate and natural gas (S$11.18/GJ vs S$8.47/GJ). The emergency fuel usage cost for two units is S$0.869 million and correspondingly, S$0.434 million for one unit.
4.1.7 PROPERTY TAX
Property tax has been estimated based on 10% per year of an assumed Annual Value of 6% of the land, preparation and buildings/structures cost
19. Reference is also made to IRAS tax guide
on the treatment of fixed machinery in the computation for property tax20
. The value of certain
19
Using the Contractor’s test at a rate of return of 6% as prescribed in IRAS e-Tax Guide: Investor’s Guide to Property Tax; published 2 September 2014.
20 IRAS e-Tax Guide: Treatment of Fixed Machinery under the Property Tax Act; published 2 September 2014.
28
WSP | Parsons Brinckerhoff
fixed plant and machinery items must be included within the property valuation when calculating property taxes. However an appended list of exemptions exempts most of the principal plant items of a combined cycle power plant including turbines, generators, boilers, transformers, switchgear etc. To allow for the extra value of the portion of the plant that is included, 10% of the cost of the plant is included in the property tax valuation calculation (except where already included). The total capital value included in the calculation of property tax is S$283.895 million for the power plant which gives an annual payable property tax of S$1.703 million for two units or S$0.852 million per unit.
4.1.8 INSURANCE
Insurance has been estimated based on 0.5% of the capital cost. This is considered to cover property, plant and industrial risks but would not cover business interruption insurance or the cost of hedging against plant outages. For this review, the annual insurance cost is S$5.004 million for two units or S$2.502 million per unit.
4.1.9 SUMMARY AND COMPARISON WITH PREVIOUS REVIEWS
The summary of the various fixed running costs are tabulated in Table 4-2 and a comparison with the previous reviews are also captured in the same table.
3 Fixed maintenance and other operations 18.01 16.11 16.91
4 Starts impact on turbine maintenance 1.20 1.04 0.94
5 Distillate usage impact on turbine maintenance
0.090 0.078 0.070
6 EMA license fee (fixed) 0.058 0.058 0.058
7 Working capital 3.82 13.76 13.60
8 Emergency fuel usage 0.87 2.20 1.66
9 Property tax 1.70 1.36 1.34
10 Insurance 5.00 4.47 4.70
Total fixed running cost (2 units)
(numbers may not add up due to rounding) 39.39 47.67 47.02
29
WSP | Parsons Brinckerhoff
4.2 VARIABLE NON-FUEL COST
As in the previous review, it is assumed a Long Term Service Agreement (LTSA) would be sought for the first one to two overhaul cycles of the gas turbine and steam turbine (typically 6 to 12 years). These are typically structured on a "per operating hour" or "per MWh" basis and hence are largely variable costs.
An assessment of the variable, non-fuel, costs is given in Table 4-3.
Table 4-3: Variable non-fuel cost parameters
NO. REVIEW UNIT 2017-2018 REMARKS
1 LTSA for Gas turbine S$/MWh 6.010
Based on EUR2.27/MWh before correction to site reference conditions and overall part load factor.
2 Steam turbine S$/MWh Included above
3 Balance of plant, chemicals, consumables
S$/MWh 0.557 Escalated by MAS core index
4 Town Water S$/MWh 0.178 No change in water consumption and water tariffs.
5 EMC fees S$/MWh 0.246 Weighted average for EMC budget for FY2016/2017 and 2017/2018
6 PSO S$/MWh 0.280 Weighted average for PSO estimated fees for FY2016/2017 and 2017/2018
7 EMA license fee (variable) S$/MWh 0.179 As advised by EMA, no change.
Total S$/MWh 7.450
The current review values are compared with the previous reviews in Table 4-4.
7 EMA license fee (variable) S$/MWh 0.179 0.179 0.179
Total S$/MWh 7.450 6.560 6.419
30
WSP | Parsons Brinckerhoff
5 OTHER PARAMETERS
5.1 BUILD DURATION
From discussions with EPC contractors, OEMs and a review of recently completed CCGT projects, the current expected build duration for the power plant is at 30 months. This is unchanged from the 2015-2016 and 2013-2014 reviews.
5.2 ECONOMIC LIFE
The technical life of this type of plant is considered to be approximately 25 years which is typically applied for CCGT power plants in the region and Singapore. Using the methodology as applied in the previous review (2015-2016), the resulting calculated economic life was 69 years which was not commercially or technically feasible
21. It is recommended that the lower value of the two,
namely technical life and calculated economic life is selected as the economic life of the plant to be used in the review. Thus, an economic life of 25 years is recommended for 2017-2018 review.
This is an increase from the 2015-2016 review of 24 years and is supported by the significant drop in fuel price since 2014, high generation supply cushion at 29.3% and the slower rate of growth in electricity in Singapore as reported in the NEMS Market Report 2015
22.
5.3 AVERAGE EXPECTED UTILISATION FACTOR
The average expected utilisation factor used in this review is 60.2% as advised by EMA. This is the actual historic capacity factor for the 12 months leading up to the base month. The current value is a reduction from 64.4% in 2015-2016 review as a result of slower growth rate of electricity consumption in 2015 and registration of new facilities to the Singapore grid.
Table 5-1 summarises the above parameters with a comparison with the values from the previous reviews.
Table 5-1: Other parameters compared with previous reviews (2 units)
NO. REVIEW UNIT 2017-2018 2015-2016 2013-2014
1 Build duration months 30 30 30
2 Economic life years 25 24 22
3 Average expected utilisation factor % 60.2 64.4 67.3
21
See Appendix B for discussion on calculated economic life. 22
The LRMC calculation uses parameters considered in this technical report and also parameters from the financial report and those as advised by EMA.
For the purposes of comparing the impacts of the changes in technical parameters, a calculation is included in the LRMC, using assumptions for financial parameters where necessary.
6.2 SUMMARY OF TECHNICAL PARAMETERS
Table 6-1: Summary of recommended technical parameters and comparison with previous review
ITEM REVIEW UNIT 2017-2018 2015-2016
6 Economic capacity of the most economic technology in operation in Singapore
MW 407.95 386.67
7 Capital cost of the plant identified in item 6
$US/kW 887.72 936.79
8 Land, infrastructure and development cost of the plant identified in item 6
$S million 157.74 151.27
11 HHV Heat Rate of the plant identified in item 6
Btu/kWh 7,072.1 7103.8
12 Build duration of the plant identified in item 6
years 2.5 2.5
13 Economic lifetime of the plant identified in item 6
years 25 24
14
Average expected utilisation factor of the plant identified in item 6, i.e. average generation level as a percentage of capacity
% 60.2 64.4
15 Fixed annual running cost of the plant identified in item 6
$S million 19.69 23.83
16 Variable non-fuel cost of the plant identified in item 6
$S/MWh 7.45 6.56
The variances from the previous review are attributable to:
An improvement to output capacity due to increased performance of the GT 26 and SGT-4000F machines which offset the unit capital cost of the plant (item 7) despite an increase in EPC cost of large CCGT plants in the region
An improvement to HHV heat rate due to increased efficiency performance across the machines
A lower plant load factor (utilisation factor) as a result of new entrants to the electricity market and a slower growth rate in electricity demand in Singapore. This increases the capital cost amortisation costs, maintenance cost (EOH impact).
A reduction in EMA’s fuel reserves policy to hold 60 days of secondary fuel instead of 90 days
Significant drop in global fuel prices
6.3 CALCULATED LRMC
For the calculation of the LRMC, parameters produced from the financial draft report and those as advised by EMA are used. These are tabulated in Table 6-2. Applying the vesting contract formulae and in accordance with the treatment in the previous years of using the nominal WACC,
32
WSP | Parsons Brinckerhoff
the technical parameters and financial parameters yield the component breakdown of the LRMC as summarised in Table 6-3.
Table 6-2: Assumed financial parameters for LRMC calculation
NO. PARAMETER VALUE FOR 2017-2018 SOURCE
1 WACC 6.45% post-tax, nominal
7.27% pre-tax, real Financial parameters
2 CPI 0.47% Financial parameters; average year-on-year MAS core inflation index for
Jan - Mar 2016
3 Weighted average gas price
S$8.47/GJ EMA
4 Gasoil (10ppm) price US$41.60/bbl EMA; average midpoint of daily
Bid/Ask for Jan - Mar 2016
5 Exchange rates SGD/USD - 1.4018
SGD/EUR - 1.5475
Financial parameters; midpoint of daily Bid/Ask for Jan - Mar 2016
Table 6-3: Calculated LRMC for 2017-2018
NO. PARAMETER UNIT VALUE FOR 2017-2018
1 Capital component S$/MWh 30.23
2 Fixed operating expenditure S$/MWh 9.15
3 Variable operating expenditure S$/MWh 7.45
4 Fuel component S$/MWh 63.23
5 Calculated LRMC
(numbers may not add up due to rounding) S$/MWh 110.06
The various parameters from the calculation of 2017-2018 LRMC are compared with that of previous review in Table 6-4. The average weighted gas price used for the current review at S$8.47/GJ is applied to the fuel component of previous review to remove the effect of the gas price on the resulting LRMC value.
Table 6-4: Calculated LRMC for 2017-2018 compared with previous review (gas price at S$8.47/GJ)
NO. PARAMETER UNIT 2017-2018 2015-2016
1 Fuel component* S$/MWh 63.23 63.51
2 Capital component S$/MWh 30.23 28.76
3 Fixed operating expenditure S$/MWh 9.15 10.93
4 Variable operating expenditure S$/MWh 7.45 6.56
5 Calculated LRMC
(numbers may not add up due to rounding) S$/MWh 110.06 109.76
* Based on the weighted average gas price of S$8.47/GJ.
Remarks:
1) Slight reduction in fuel component due to an improvement in heat rate
2) Slight overall increase in capital component as the increase in initial plant capital cost is negated by the lower plant load factor
3) Approximately 16% decrease in fixed operating expenditure due to the reduction in EMA’s fuel reserves policy and the gasoil (10 ppm) price since 2014
4) Approximately 14% increase in variable operating expenditure as a result of an increase in LTSA cost/MWh
33
WSP | Parsons Brinckerhoff
APPENDIX A
PRESCRIBED PROCEDURE
Source: Extracted from EMA’s Procedures for Calculating the Components of the Vesting Contracts, Sep 2015, Version 2.3
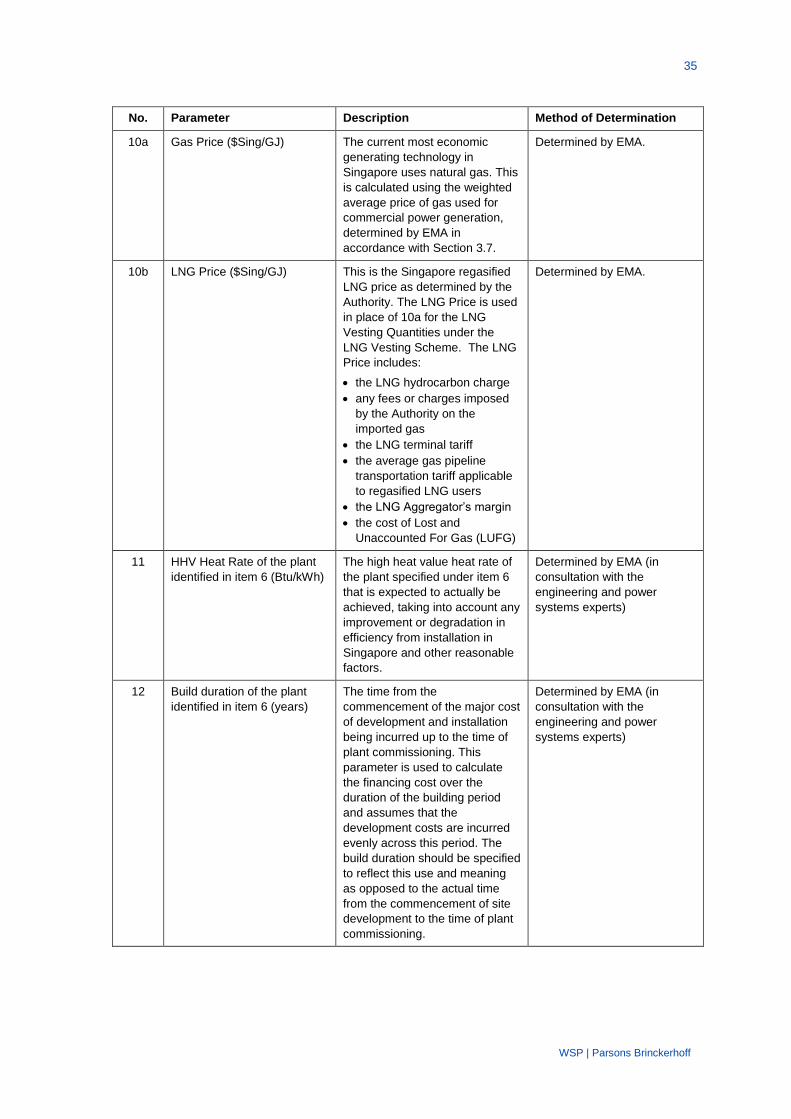
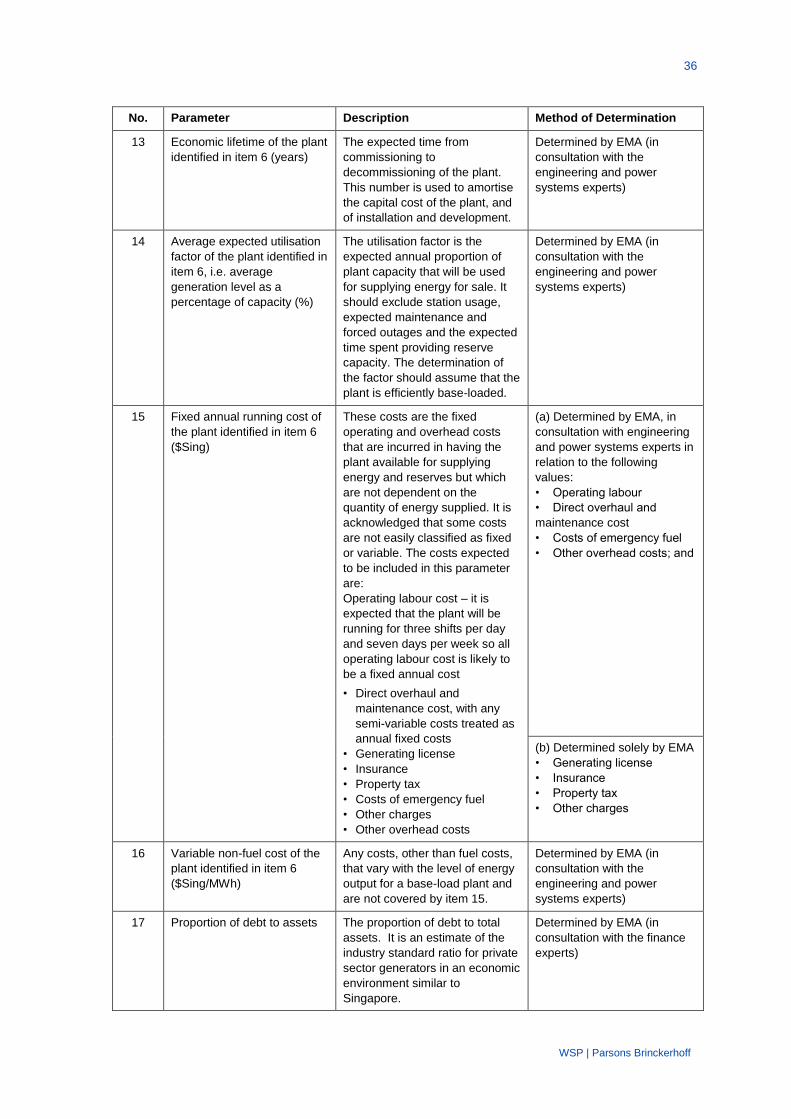
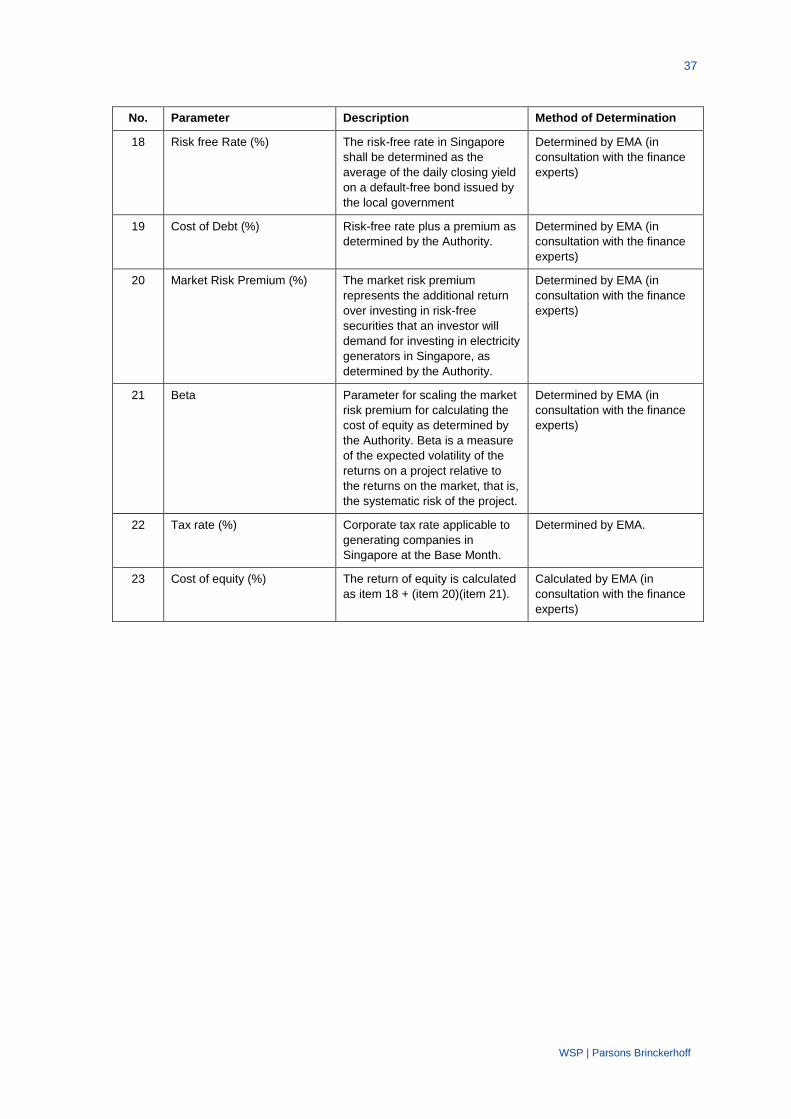
No. Parameter Description Method of Determination
1 Determination
Date
Date on which the calculations of
the LRMC, which is to apply at
the Application Date, are deemed
to be made.
Determined by EMA.
2 Base Month Cut-off month for data used in
determination of the LRMC base
parameters. For the following
base parameters which tend to
be volatile in nature, the data to
be used for estimating each of
them shall be based on
averaging over a three month
period leading up to and
including the Base Month:
1. Exchange rate denominated in
foreign currencies into Singapore
dollars;
2. Diesel price to calculate cost
of carrying backup fuel;
3. Debt premium to calculate cost
of debt; and
4. MAS Core Inflation Index.
Determined by EMA.
3 Application Date Period for which the LRMC is to
apply.
Determined by EMA.
4 Current Year Year in which the Application
Date falls.
Determined by EMA.
5 Exchange Rate ($US per
$Sing)
The exchange rate is that as
determined in Section 3.7.
Determined by EMA (in
consultation with finance
experts)
6 Economic capacity of the
most economic technology in
operation in Singapore (MW)
The size of the most thermally
efficient unit taking into account
the requirements of the
Singapore system, including the
need to provide for contingency
reserve to cover the outage of
the unit and the fuel quantities
available. It is acknowledged that
this value may depend on the
manufacturer. (For CCGT
technology the size of the unit is
expected to be around 370MW.)
Determined by EMA (in
consultation with the
engineering and power
systems experts)
34
WSP | Parsons Brinckerhoff
No. Parameter Description Method of Determination
7 Capital cost of the plant
identified in item 6 ($US/kW)
Capital cost includes the
purchase and delivery cost of the
plant in a state suitable for
installation in Singapore and all
associated equipment but
excludes switch gears, fuel
tanks, transmission and fuel
connections, land, buildings and
site development included in item
8. Where more than one unit is
expected to be installed that will
share any equipment, the costs
of the shared equipment should
be prorated evenly to each of the
units.
Determined by EMA (and in
consultation with the
engineering and power
systems experts)
8 Land, infrastructure and
development cost of the plant
identified in item 6 ($Sing
million)
Where more than one unit is
expected to be installed that will
share any equipment or facilities,
the costs of the shared
equipment or facilities should be
prorated evenly to each of the
units. These costs should include
all capital, development and
installation costs (excluding all
costs included in the capital cost
of plant included in item 7 and
financing costs during the build
period). These costs should
include the following specific
items:
• Acquisition costs of sufficient
land to accommodate the plant
defined above in item 6
(alternatively land may be
included as annual rental cost
under Fixed Annual Running
Costs)
• Site development
• Buildings and facilities
• Connections to gas pipelines
• Switchgear and connections to
transmission
• Emergency fuel facilities
• Project management and
consultancy
Determined by EMA,
(a) In consultation with the
engineering and power
systems experts in relation to
the following values:
• size of site required
• site development
• buildings and facilities
• connections to pipelines
• switchgear connections to
transmission
• emergency fuel facilities
• project management and
consultancy; and
(b) In consultation with the
real estate experts in relation
to land value.
9a HSFO 180 CST Oil Price
(US$/MT)
The HSFO 180 CST Oil Price is
that as determined in Section
3.7.1
Determined by EMA.
9b Brent Index Price (US$/bbl) The Brent Index is that as
determined in Section 3.7.2
Determined by EMA.
35
WSP | Parsons Brinckerhoff
No. Parameter Description Method of Determination
10a Gas Price ($Sing/GJ) The current most economic
generating technology in
Singapore uses natural gas. This
is calculated using the weighted
average price of gas used for
commercial power generation,
determined by EMA in
accordance with Section 3.7.
Determined by EMA.
10b LNG Price ($Sing/GJ) This is the Singapore regasified
LNG price as determined by the
Authority. The LNG Price is used
in place of 10a for the LNG
Vesting Quantities under the
LNG Vesting Scheme. The LNG
Price includes:
the LNG hydrocarbon charge
any fees or charges imposed
by the Authority on the
imported gas
the LNG terminal tariff
the average gas pipeline
transportation tariff applicable
to regasified LNG users
the LNG Aggregator’s margin
the cost of Lost and
Unaccounted For Gas (LUFG)
Determined by EMA.
11 HHV Heat Rate of the plant
identified in item 6 (Btu/kWh)
The high heat value heat rate of
the plant specified under item 6
that is expected to actually be
achieved, taking into account any
improvement or degradation in
efficiency from installation in
Singapore and other reasonable
factors.
Determined by EMA (in
consultation with the
engineering and power
systems experts)
12 Build duration of the plant
identified in item 6 (years)
The time from the
commencement of the major cost
of development and installation
being incurred up to the time of
plant commissioning. This
parameter is used to calculate
the financing cost over the
duration of the building period
and assumes that the
development costs are incurred
evenly across this period. The
build duration should be specified
to reflect this use and meaning
as opposed to the actual time
from the commencement of site
development to the time of plant
commissioning.
Determined by EMA (in
consultation with the
engineering and power
systems experts)
36
WSP | Parsons Brinckerhoff
No. Parameter Description Method of Determination
13 Economic lifetime of the plant
identified in item 6 (years)
The expected time from
commissioning to
decommissioning of the plant.
This number is used to amortise
the capital cost of the plant, and
of installation and development.
Determined by EMA (in
consultation with the
engineering and power
systems experts)
14 Average expected utilisation
factor of the plant identified in
item 6, i.e. average
generation level as a
percentage of capacity (%)
The utilisation factor is the
expected annual proportion of
plant capacity that will be used
for supplying energy for sale. It
should exclude station usage,
expected maintenance and
forced outages and the expected
time spent providing reserve
capacity. The determination of
the factor should assume that the
plant is efficiently base-loaded.
Determined by EMA (in
consultation with the
engineering and power
systems experts)
15 Fixed annual running cost of
the plant identified in item 6
($Sing)
These costs are the fixed
operating and overhead costs
that are incurred in having the
plant available for supplying
energy and reserves but which
are not dependent on the
quantity of energy supplied. It is
acknowledged that some costs
are not easily classified as fixed
or variable. The costs expected
to be included in this parameter
are:
Operating labour cost – it is
expected that the plant will be
running for three shifts per day
and seven days per week so all
operating labour cost is likely to
be a fixed annual cost
• Direct overhaul and
maintenance cost, with any
semi-variable costs treated as
annual fixed costs
• Generating license
• Insurance
• Property tax
• Costs of emergency fuel
• Other charges
• Other overhead costs
(a) Determined by EMA, in
consultation with engineering
and power systems experts in
relation to the following
values:
• Operating labour
• Direct overhaul and
maintenance cost
• Costs of emergency fuel
• Other overhead costs; and
(b) Determined solely by EMA
• Generating license
• Insurance
• Property tax
• Other charges
16 Variable non-fuel cost of the
plant identified in item 6
($Sing/MWh)
Any costs, other than fuel costs,
that vary with the level of energy
output for a base-load plant and
are not covered by item 15.
Determined by EMA (in
consultation with the
engineering and power
systems experts)
17 Proportion of debt to assets The proportion of debt to total
assets. It is an estimate of the
industry standard ratio for private
sector generators in an economic
environment similar to
Singapore.
Determined by EMA (in
consultation with the finance
experts)
37
WSP | Parsons Brinckerhoff
No. Parameter Description Method of Determination
18 Risk free Rate (%) The risk-free rate in Singapore
shall be determined as the
average of the daily closing yield
on a default-free bond issued by
the local government
Determined by EMA (in
consultation with the finance
experts)
19 Cost of Debt (%) Risk-free rate plus a premium as
determined by the Authority.
Determined by EMA (in
consultation with the finance
experts)
20 Market Risk Premium (%) The market risk premium
represents the additional return
over investing in risk-free
securities that an investor will
demand for investing in electricity
generators in Singapore, as
determined by the Authority.
Determined by EMA (in
consultation with the finance
experts)
21 Beta Parameter for scaling the market
risk premium for calculating the
cost of equity as determined by
the Authority. Beta is a measure
of the expected volatility of the
returns on a project relative to
the returns on the market, that is,
the systematic risk of the project.
Determined by EMA (in
consultation with the finance
experts)
22 Tax rate (%) Corporate tax rate applicable to
generating companies in
Singapore at the Base Month.
Determined by EMA.
23 Cost of equity (%) The return of equity is calculated
as item 18 + (item 20)(item 21).
Calculated by EMA (in
consultation with the finance
experts)
38
WSP | Parsons Brinckerhoff
APPENDIX B
ECONOMIC LIFE
Previous review
In the 2015-2016 review, the calculation of economic life was “dictated by the rate of development of the heat rate of newer plants and real reductions in capex of newer plants.”
The capex and heat rate of “E” class CCGTs as published in 1994 Edition of Gas Turbine World (GTW) Handbook was used as the base and the same parameters for the “F/H” class CCGTs from the 2012 GTW Handbook were used to compute the improvement in heat rate and reduction in capex.
From 1994 to 2012,
improvement in net heat rate = -0.0077 GJ/MWh/year
real rate of specific capex reduction = 2.29%/year
With the above rates of change, the LRMC of the newer unit would become lower than the SRMC of an incumbent after 24.5 years. Thus arriving at the calculated economic life of 24 years.
Current review
PB applied the same methodology used in the previous review and updated the 2012 parameters to 2015 parameters for “F/H” class CCGTs,
From 1994 to 2015,
improvement in net heat rate = -0.0066 GJ/MWh/year (smaller improvement per year as “F” class technology is maturing and efficiencies are levelling off)
real rate of specific capex reduction = 0.96%/year (smaller reduction per year as capital costs are showing an increasing trend from 2012)
The resulting number of years using the same approach is 69 years, which is not technically or commercially viable. These two factors along with the significant reduction in fuel cost from the 2012 review to the current review mean that it takes very much longer for the LRMC of the newer unit to fall to the level as the SRMC of the incumbent.
Thus, PB recommends applying the lower value of the technical life of the plant and this calculated economic life as the economic life of the plant for this review.
39
WSP | Parsons Brinckerhoff
APPENDIX C
THERMODYNAMIC ANALYSIS
The thermodynamic analysis of the CCGT plant was performed using GTPro/GTMaster/PEACE (Version 25 with updates until 11 February 2016). The output graphics from the simulations are provided:
Figure C1: Ansaldo Energia / GT 26
Figure C2: General Electric / 9F.05
Figure C3: MHPS / 701 F4
Figure C4: Siemens / SGT5-4000F
40
WSP | Parsons Brinckerhoff
Figure C1: Ansaldo Energia / GT 26
41
WSP | Parsons Brinckerhoff
Figure C2: General Electric / 9F.05
42
WSP | Parsons Brinckerhoff
Figure C3: MHPS / 701 F4
43
WSP | Parsons Brinckerhoff
Figure C4: Siemens / SGT5-4000F
ABOUT WSP | PARSONS BRINCKERHOFF
WSP and Parsons Brinckerhoff have combined and are now one of the world’s leading engineering professional services consulting firms. Together we provide services to transform the built environment and restore the natural environment, and our expertise ranges from environmental remediation to urban planning, from engineering iconic buildings to designing sustainable transport networks, and from developing the energy sources of the future to enabling new ways of extracting essential resources. We have approximately 32,000 employees, including engineers, technicians, scientists, architects, planners, surveyors, program and construction management professionals, and various environmental experts. We are based in more than 500 offices across 40 countries worldwide.